US7801682B2 - Method of monitoring genomic instability using 3D microscopy and analysis - Google Patents
Method of monitoring genomic instability using 3D microscopy and analysis Download PDFInfo
- Publication number
- US7801682B2 US7801682B2 US10/546,152 US54615205A US7801682B2 US 7801682 B2 US7801682 B2 US 7801682B2 US 54615205 A US54615205 A US 54615205A US 7801682 B2 US7801682 B2 US 7801682B2
- Authority
- US
- United States
- Prior art keywords
- organization
- telomeres
- chromosomes
- image data
- cell
- Prior art date
- Legal status (The legal status is an assumption and is not a legal conclusion. Google has not performed a legal analysis and makes no representation as to the accuracy of the status listed.)
- Active, expires
Links
- 238000000034 method Methods 0.000 title claims abstract description 81
- 208000031448 Genomic Instability Diseases 0.000 title claims abstract description 42
- 238000012544 monitoring process Methods 0.000 title claims abstract description 17
- 238000004458 analytical method Methods 0.000 title description 23
- 238000000386 microscopy Methods 0.000 title description 5
- 210000004027 cell Anatomy 0.000 claims abstract description 311
- 210000003411 telomere Anatomy 0.000 claims abstract description 308
- 108091035539 telomere Proteins 0.000 claims abstract description 308
- 102000055501 telomere Human genes 0.000 claims abstract description 308
- 230000008520 organization Effects 0.000 claims abstract description 238
- 210000000349 chromosome Anatomy 0.000 claims abstract description 104
- 230000002759 chromosomal effect Effects 0.000 claims abstract description 57
- 208000037265 diseases, disorders, signs and symptoms Diseases 0.000 claims abstract description 50
- 206010028980 Neoplasm Diseases 0.000 claims abstract description 39
- 201000010099 disease Diseases 0.000 claims abstract description 34
- 201000011510 cancer Diseases 0.000 claims abstract description 28
- 230000002062 proliferating effect Effects 0.000 claims abstract description 13
- 238000012360 testing method Methods 0.000 claims description 72
- 230000008859 change Effects 0.000 claims description 18
- 238000009826 distribution Methods 0.000 claims description 10
- 238000012512 characterization method Methods 0.000 claims description 6
- 238000003860 storage Methods 0.000 claims description 6
- 238000003745 diagnosis Methods 0.000 claims description 4
- 238000004141 dimensional analysis Methods 0.000 abstract description 6
- 210000004940 nucleus Anatomy 0.000 description 92
- 241000699666 Mus <mouse, genus> Species 0.000 description 53
- 230000016507 interphase Effects 0.000 description 41
- 101710135898 Myc proto-oncogene protein Proteins 0.000 description 29
- 102100038895 Myc proto-oncogene protein Human genes 0.000 description 29
- 208000007452 Plasmacytoma Diseases 0.000 description 29
- 101710150448 Transcriptional regulator Myc Proteins 0.000 description 29
- 230000002776 aggregation Effects 0.000 description 29
- 238000004220 aggregation Methods 0.000 description 29
- 210000004881 tumor cell Anatomy 0.000 description 27
- 210000004698 lymphocyte Anatomy 0.000 description 19
- 239000000523 sample Substances 0.000 description 15
- 210000001519 tissue Anatomy 0.000 description 15
- 210000003719 b-lymphocyte Anatomy 0.000 description 14
- 230000003831 deregulation Effects 0.000 description 14
- 230000004807 localization Effects 0.000 description 13
- 208000000102 Squamous Cell Carcinoma of Head and Neck Diseases 0.000 description 12
- 230000022131 cell cycle Effects 0.000 description 12
- 201000000459 head and neck squamous cell carcinoma Diseases 0.000 description 12
- 101100239628 Danio rerio myca gene Proteins 0.000 description 11
- 230000004075 alteration Effects 0.000 description 11
- 230000010337 G2 phase Effects 0.000 description 10
- 230000001419 dependent effect Effects 0.000 description 10
- 230000031864 metaphase Effects 0.000 description 10
- 210000004180 plasmocyte Anatomy 0.000 description 10
- 206010006187 Breast cancer Diseases 0.000 description 9
- 208000026310 Breast neoplasm Diseases 0.000 description 9
- WSFSSNUMVMOOMR-UHFFFAOYSA-N Formaldehyde Chemical compound O=C WSFSSNUMVMOOMR-UHFFFAOYSA-N 0.000 description 9
- 208000035475 disorder Diseases 0.000 description 9
- FWBHETKCLVMNFS-UHFFFAOYSA-N 4',6-Diamino-2-phenylindol Chemical compound C1=CC(C(=N)N)=CC=C1C1=CC2=CC=C(C(N)=N)C=C2N1 FWBHETKCLVMNFS-UHFFFAOYSA-N 0.000 description 8
- WOVKYSAHUYNSMH-RRKCRQDMSA-N 5-bromodeoxyuridine Chemical compound C1[C@H](O)[C@@H](CO)O[C@H]1N1C(=O)NC(=O)C(Br)=C1 WOVKYSAHUYNSMH-RRKCRQDMSA-N 0.000 description 8
- 206010009944 Colon cancer Diseases 0.000 description 8
- 238000009396 hybridization Methods 0.000 description 8
- 238000003384 imaging method Methods 0.000 description 8
- NHBKXEKEPDILRR-UHFFFAOYSA-N 2,3-bis(butanoylsulfanyl)propyl butanoate Chemical compound CCCC(=O)OCC(SC(=O)CCC)CSC(=O)CCC NHBKXEKEPDILRR-UHFFFAOYSA-N 0.000 description 7
- 230000010190 G1 phase Effects 0.000 description 7
- 230000003595 spectral effect Effects 0.000 description 7
- DODQJNMQWMSYGS-QPLCGJKRSA-N 4-[(z)-1-[4-[2-(dimethylamino)ethoxy]phenyl]-1-phenylbut-1-en-2-yl]phenol Chemical compound C=1C=C(O)C=CC=1C(/CC)=C(C=1C=CC(OCCN(C)C)=CC=1)/C1=CC=CC=C1 DODQJNMQWMSYGS-QPLCGJKRSA-N 0.000 description 6
- 208000031404 Chromosome Aberrations Diseases 0.000 description 6
- 201000010273 Porphyria Cutanea Tarda Diseases 0.000 description 6
- 230000008711 chromosomal rearrangement Effects 0.000 description 6
- 231100000005 chromosome aberration Toxicity 0.000 description 6
- 230000011855 chromosome organization Effects 0.000 description 6
- 230000003287 optical effect Effects 0.000 description 6
- 239000003973 paint Substances 0.000 description 6
- 238000010422 painting Methods 0.000 description 6
- NUSQOFAKCBLANB-UHFFFAOYSA-N phthalocyanine tetrasulfonic acid Chemical compound C12=CC(S(=O)(=O)O)=CC=C2C(N=C2NC(C3=CC=C(C=C32)S(O)(=O)=O)=N2)=NC1=NC([C]1C=CC(=CC1=1)S(O)(=O)=O)=NC=1N=C1[C]3C=CC(S(O)(=O)=O)=CC3=C2N1 NUSQOFAKCBLANB-UHFFFAOYSA-N 0.000 description 6
- 230000008569 process Effects 0.000 description 6
- 102000004169 proteins and genes Human genes 0.000 description 6
- 108090000623 proteins and genes Proteins 0.000 description 6
- 230000005855 radiation Effects 0.000 description 6
- 238000011725 BALB/c mouse Methods 0.000 description 5
- 206010025323 Lymphomas Diseases 0.000 description 5
- 206010029260 Neuroblastoma Diseases 0.000 description 5
- 230000004913 activation Effects 0.000 description 5
- 208000029742 colonic neoplasm Diseases 0.000 description 5
- 230000002596 correlated effect Effects 0.000 description 5
- 230000000694 effects Effects 0.000 description 5
- 210000002950 fibroblast Anatomy 0.000 description 5
- MHMNJMPURVTYEJ-UHFFFAOYSA-N fluorescein-5-isothiocyanate Chemical compound O1C(=O)C2=CC(N=C=S)=CC=C2C21C1=CC=C(O)C=C1OC1=CC(O)=CC=C21 MHMNJMPURVTYEJ-UHFFFAOYSA-N 0.000 description 5
- 210000005260 human cell Anatomy 0.000 description 5
- 230000005945 translocation Effects 0.000 description 5
- 230000033616 DNA repair Effects 0.000 description 4
- TWRXJAOTZQYOKJ-UHFFFAOYSA-L Magnesium chloride Chemical compound [Mg+2].[Cl-].[Cl-] TWRXJAOTZQYOKJ-UHFFFAOYSA-L 0.000 description 4
- 230000018199 S phase Effects 0.000 description 4
- 208000035199 Tetraploidy Diseases 0.000 description 4
- 230000001594 aberrant effect Effects 0.000 description 4
- 230000035508 accumulation Effects 0.000 description 4
- 238000009825 accumulation Methods 0.000 description 4
- 238000001727 in vivo Methods 0.000 description 4
- 210000003923 intranuclear space Anatomy 0.000 description 4
- 231100001221 nontumorigenic Toxicity 0.000 description 4
- QTBSBXVTEAMEQO-UHFFFAOYSA-N Acetic acid Chemical compound CC(O)=O QTBSBXVTEAMEQO-UHFFFAOYSA-N 0.000 description 3
- OXSYGCRLQCGSAQ-UHFFFAOYSA-N CC1CCC2N(C1)CC3C4(O)CC5C(CCC6C(O)C(O)CCC56C)C4(O)CC(O)C3(O)C2(C)O Chemical compound CC1CCC2N(C1)CC3C4(O)CC5C(CCC6C(O)C(O)CCC56C)C4(O)CC(O)C3(O)C2(C)O OXSYGCRLQCGSAQ-UHFFFAOYSA-N 0.000 description 3
- OKKJLVBELUTLKV-UHFFFAOYSA-N Methanol Chemical compound OC OKKJLVBELUTLKV-UHFFFAOYSA-N 0.000 description 3
- 206010044685 Trisomy 11 Diseases 0.000 description 3
- 101000855964 Vigna mungo Vignain Proteins 0.000 description 3
- 208000027418 Wounds and injury Diseases 0.000 description 3
- 230000015572 biosynthetic process Effects 0.000 description 3
- 230000001413 cellular effect Effects 0.000 description 3
- 230000006378 damage Effects 0.000 description 3
- 230000007613 environmental effect Effects 0.000 description 3
- 210000000981 epithelium Anatomy 0.000 description 3
- 230000002068 genetic effect Effects 0.000 description 3
- 208000014674 injury Diseases 0.000 description 3
- 230000005865 ionizing radiation Effects 0.000 description 3
- 238000005259 measurement Methods 0.000 description 3
- 210000001948 pro-b lymphocyte Anatomy 0.000 description 3
- 230000008707 rearrangement Effects 0.000 description 3
- 230000008521 reorganization Effects 0.000 description 3
- 238000002560 therapeutic procedure Methods 0.000 description 3
- 230000009495 transient activation Effects 0.000 description 3
- 208000005623 Carcinogenesis Diseases 0.000 description 2
- 201000009030 Carcinoma Diseases 0.000 description 2
- 206010008342 Cervix carcinoma Diseases 0.000 description 2
- 108020004414 DNA Proteins 0.000 description 2
- LFQSCWFLJHTTHZ-UHFFFAOYSA-N Ethanol Chemical compound CCO LFQSCWFLJHTTHZ-UHFFFAOYSA-N 0.000 description 2
- 238000012413 Fluorescence activated cell sorting analysis Methods 0.000 description 2
- 230000035519 G0 Phase Effects 0.000 description 2
- 108010034791 Heterochromatin Proteins 0.000 description 2
- 108700020796 Oncogene Proteins 0.000 description 2
- 206010033128 Ovarian cancer Diseases 0.000 description 2
- 206010061535 Ovarian neoplasm Diseases 0.000 description 2
- 206010060862 Prostate cancer Diseases 0.000 description 2
- 208000000236 Prostatic Neoplasms Diseases 0.000 description 2
- 206010039491 Sarcoma Diseases 0.000 description 2
- 208000006105 Uterine Cervical Neoplasms Diseases 0.000 description 2
- 230000009286 beneficial effect Effects 0.000 description 2
- 230000008901 benefit Effects 0.000 description 2
- 239000000090 biomarker Substances 0.000 description 2
- 210000004369 blood Anatomy 0.000 description 2
- 239000008280 blood Substances 0.000 description 2
- 230000036952 cancer formation Effects 0.000 description 2
- 231100000504 carcinogenesis Toxicity 0.000 description 2
- 201000010881 cervical cancer Diseases 0.000 description 2
- 239000003086 colorant Substances 0.000 description 2
- 230000000875 corresponding effect Effects 0.000 description 2
- 238000010586 diagram Methods 0.000 description 2
- 210000001840 diploid cell Anatomy 0.000 description 2
- 238000004980 dosimetry Methods 0.000 description 2
- 238000002474 experimental method Methods 0.000 description 2
- 210000004458 heterochromatin Anatomy 0.000 description 2
- 238000010348 incorporation Methods 0.000 description 2
- 238000002372 labelling Methods 0.000 description 2
- 230000003902 lesion Effects 0.000 description 2
- 208000032839 leukemia Diseases 0.000 description 2
- 229910001629 magnesium chloride Inorganic materials 0.000 description 2
- 230000036210 malignancy Effects 0.000 description 2
- 239000000463 material Substances 0.000 description 2
- WSFSSNUMVMOOMR-NJFSPNSNSA-N methanone Chemical compound O=[14CH2] WSFSSNUMVMOOMR-NJFSPNSNSA-N 0.000 description 2
- 238000012986 modification Methods 0.000 description 2
- 230000004048 modification Effects 0.000 description 2
- 230000002018 overexpression Effects 0.000 description 2
- 238000009877 rendering Methods 0.000 description 2
- 230000002441 reversible effect Effects 0.000 description 2
- 241000894007 species Species 0.000 description 2
- 210000004988 splenocyte Anatomy 0.000 description 2
- 230000000638 stimulation Effects 0.000 description 2
- 230000004083 survival effect Effects 0.000 description 2
- 239000000725 suspension Substances 0.000 description 2
- 230000009466 transformation Effects 0.000 description 2
- 230000001052 transient effect Effects 0.000 description 2
- 238000012800 visualization Methods 0.000 description 2
- PRDFBSVERLRRMY-UHFFFAOYSA-N 2'-(4-ethoxyphenyl)-5-(4-methylpiperazin-1-yl)-2,5'-bibenzimidazole Chemical compound C1=CC(OCC)=CC=C1C1=NC2=CC=C(C=3NC4=CC(=CC=C4N=3)N3CCN(C)CC3)C=C2N1 PRDFBSVERLRRMY-UHFFFAOYSA-N 0.000 description 1
- 208000024893 Acute lymphoblastic leukemia Diseases 0.000 description 1
- 208000014697 Acute lymphocytic leukaemia Diseases 0.000 description 1
- 208000031261 Acute myeloid leukaemia Diseases 0.000 description 1
- 208000010839 B-cell chronic lymphocytic leukemia Diseases 0.000 description 1
- 208000032791 BCR-ABL1 positive chronic myelogenous leukemia Diseases 0.000 description 1
- WOVKYSAHUYNSMH-UHFFFAOYSA-N BROMODEOXYURIDINE Natural products C1C(O)C(CO)OC1N1C(=O)NC(=O)C(Br)=C1 WOVKYSAHUYNSMH-UHFFFAOYSA-N 0.000 description 1
- 208000003174 Brain Neoplasms Diseases 0.000 description 1
- 208000011691 Burkitt lymphomas Diseases 0.000 description 1
- 208000009458 Carcinoma in Situ Diseases 0.000 description 1
- 206010008263 Cervical dysplasia Diseases 0.000 description 1
- 108010077544 Chromatin Proteins 0.000 description 1
- 208000037051 Chromosomal Instability Diseases 0.000 description 1
- 208000010833 Chronic myeloid leukaemia Diseases 0.000 description 1
- 235000000385 Costus speciosus Nutrition 0.000 description 1
- 244000258136 Costus speciosus Species 0.000 description 1
- 206010061818 Disease progression Diseases 0.000 description 1
- 241000196324 Embryophyta Species 0.000 description 1
- 241000287828 Gallus gallus Species 0.000 description 1
- 206010017993 Gastrointestinal neoplasms Diseases 0.000 description 1
- 241000282412 Homo Species 0.000 description 1
- 108060003951 Immunoglobulin Proteins 0.000 description 1
- 206010058467 Lung neoplasm malignant Diseases 0.000 description 1
- 208000031422 Lymphocytic Chronic B-Cell Leukemia Diseases 0.000 description 1
- 241001465754 Metazoa Species 0.000 description 1
- 208000034578 Multiple myelomas Diseases 0.000 description 1
- 208000033761 Myelogenous Chronic BCR-ABL Positive Leukemia Diseases 0.000 description 1
- 208000033776 Myeloid Acute Leukemia Diseases 0.000 description 1
- 208000015914 Non-Hodgkin lymphomas Diseases 0.000 description 1
- 206010061902 Pancreatic neoplasm Diseases 0.000 description 1
- 108010047620 Phytohemagglutinins Proteins 0.000 description 1
- 206010035226 Plasma cell myeloma Diseases 0.000 description 1
- 208000006664 Precursor Cell Lymphoblastic Leukemia-Lymphoma Diseases 0.000 description 1
- 238000013459 approach Methods 0.000 description 1
- 230000004071 biological effect Effects 0.000 description 1
- 239000013060 biological fluid Substances 0.000 description 1
- 238000001574 biopsy Methods 0.000 description 1
- 210000000601 blood cell Anatomy 0.000 description 1
- 210000000481 breast Anatomy 0.000 description 1
- 230000030833 cell death Effects 0.000 description 1
- 210000001175 cerebrospinal fluid Anatomy 0.000 description 1
- 201000003565 cervix uteri carcinoma in situ Diseases 0.000 description 1
- 238000000701 chemical imaging Methods 0.000 description 1
- 238000002512 chemotherapy Methods 0.000 description 1
- 210000003483 chromatin Anatomy 0.000 description 1
- 208000032852 chronic lymphocytic leukemia Diseases 0.000 description 1
- 230000000295 complement effect Effects 0.000 description 1
- 238000004624 confocal microscopy Methods 0.000 description 1
- 230000001351 cycling effect Effects 0.000 description 1
- 238000013500 data storage Methods 0.000 description 1
- 230000003247 decreasing effect Effects 0.000 description 1
- 238000012217 deletion Methods 0.000 description 1
- 230000037430 deletion Effects 0.000 description 1
- 230000002074 deregulated effect Effects 0.000 description 1
- 238000001514 detection method Methods 0.000 description 1
- 230000029087 digestion Effects 0.000 description 1
- 230000003467 diminishing effect Effects 0.000 description 1
- 230000005750 disease progression Effects 0.000 description 1
- BFMYDTVEBKDAKJ-UHFFFAOYSA-L disodium;(2',7'-dibromo-3',6'-dioxido-3-oxospiro[2-benzofuran-1,9'-xanthene]-4'-yl)mercury;hydrate Chemical compound O.[Na+].[Na+].O1C(=O)C2=CC=CC=C2C21C1=CC(Br)=C([O-])C([Hg])=C1OC1=C2C=C(Br)C([O-])=C1 BFMYDTVEBKDAKJ-UHFFFAOYSA-L 0.000 description 1
- 239000003814 drug Substances 0.000 description 1
- 230000004064 dysfunction Effects 0.000 description 1
- 210000002257 embryonic structure Anatomy 0.000 description 1
- 239000002158 endotoxin Substances 0.000 description 1
- 208000037828 epithelial carcinoma Diseases 0.000 description 1
- 230000001605 fetal effect Effects 0.000 description 1
- 238000000684 flow cytometry Methods 0.000 description 1
- 239000011521 glass Substances 0.000 description 1
- 230000005484 gravity Effects 0.000 description 1
- 230000012010 growth Effects 0.000 description 1
- 210000004209 hair Anatomy 0.000 description 1
- 201000010536 head and neck cancer Diseases 0.000 description 1
- 208000014829 head and neck neoplasm Diseases 0.000 description 1
- 206010020718 hyperplasia Diseases 0.000 description 1
- 102000018358 immunoglobulin Human genes 0.000 description 1
- 201000004933 in situ carcinoma Diseases 0.000 description 1
- 230000006698 induction Effects 0.000 description 1
- 230000000977 initiatory effect Effects 0.000 description 1
- 230000003993 interaction Effects 0.000 description 1
- 238000011835 investigation Methods 0.000 description 1
- 210000002510 keratinocyte Anatomy 0.000 description 1
- 230000000670 limiting effect Effects 0.000 description 1
- 229920006008 lipopolysaccharide Polymers 0.000 description 1
- 210000005229 liver cell Anatomy 0.000 description 1
- 201000005202 lung cancer Diseases 0.000 description 1
- 208000020816 lung neoplasm Diseases 0.000 description 1
- 208000015486 malignant pancreatic neoplasm Diseases 0.000 description 1
- 210000004962 mammalian cell Anatomy 0.000 description 1
- 230000007246 mechanism Effects 0.000 description 1
- 201000001441 melanoma Diseases 0.000 description 1
- 230000011278 mitosis Effects 0.000 description 1
- 230000035773 mitosis phase Effects 0.000 description 1
- 230000000394 mitotic effect Effects 0.000 description 1
- 239000000203 mixture Substances 0.000 description 1
- 239000003068 molecular probe Substances 0.000 description 1
- 238000010172 mouse model Methods 0.000 description 1
- 230000001613 neoplastic effect Effects 0.000 description 1
- 210000002445 nipple Anatomy 0.000 description 1
- 208000002154 non-small cell lung carcinoma Diseases 0.000 description 1
- 210000000056 organ Anatomy 0.000 description 1
- 201000004228 ovarian endometrial cancer Diseases 0.000 description 1
- 201000002528 pancreatic cancer Diseases 0.000 description 1
- 208000008443 pancreatic carcinoma Diseases 0.000 description 1
- 230000036961 partial effect Effects 0.000 description 1
- 230000002093 peripheral effect Effects 0.000 description 1
- 230000001885 phytohemagglutinin Effects 0.000 description 1
- 210000001586 pre-b-lymphocyte Anatomy 0.000 description 1
- 230000001855 preneoplastic effect Effects 0.000 description 1
- 238000002360 preparation method Methods 0.000 description 1
- XJMOSONTPMZWPB-UHFFFAOYSA-M propidium iodide Chemical compound [I-].[I-].C12=CC(N)=CC=C2C2=CC=C(N)C=C2[N+](CCC[N+](C)(CC)CC)=C1C1=CC=CC=C1 XJMOSONTPMZWPB-UHFFFAOYSA-M 0.000 description 1
- 238000004445 quantitative analysis Methods 0.000 description 1
- 238000007634 remodeling Methods 0.000 description 1
- 230000008439 repair process Effects 0.000 description 1
- 230000010076 replication Effects 0.000 description 1
- 230000004044 response Effects 0.000 description 1
- 230000000284 resting effect Effects 0.000 description 1
- 210000003296 saliva Anatomy 0.000 description 1
- 230000011218 segmentation Effects 0.000 description 1
- 210000002966 serum Anatomy 0.000 description 1
- 210000004989 spleen cell Anatomy 0.000 description 1
- 230000003393 splenic effect Effects 0.000 description 1
- 208000022159 squamous carcinoma in situ Diseases 0.000 description 1
- 206010041823 squamous cell carcinoma Diseases 0.000 description 1
- 230000035882 stress Effects 0.000 description 1
- 208000024891 symptom Diseases 0.000 description 1
- 230000001360 synchronised effect Effects 0.000 description 1
- 238000013518 transcription Methods 0.000 description 1
- 238000012546 transfer Methods 0.000 description 1
- 230000007704 transition Effects 0.000 description 1
- 230000005748 tumor development Effects 0.000 description 1
- 208000029729 tumor suppressor gene on chromosome 11 Diseases 0.000 description 1
- 238000007492 two-way ANOVA Methods 0.000 description 1
- 208000022625 uterine cervix carcinoma in situ Diseases 0.000 description 1
- 230000035899 viability Effects 0.000 description 1
- 230000003612 virological effect Effects 0.000 description 1
Images


Classifications
-
- C—CHEMISTRY; METALLURGY
- C12—BIOCHEMISTRY; BEER; SPIRITS; WINE; VINEGAR; MICROBIOLOGY; ENZYMOLOGY; MUTATION OR GENETIC ENGINEERING
- C12Q—MEASURING OR TESTING PROCESSES INVOLVING ENZYMES, NUCLEIC ACIDS OR MICROORGANISMS; COMPOSITIONS OR TEST PAPERS THEREFOR; PROCESSES OF PREPARING SUCH COMPOSITIONS; CONDITION-RESPONSIVE CONTROL IN MICROBIOLOGICAL OR ENZYMOLOGICAL PROCESSES
- C12Q1/00—Measuring or testing processes involving enzymes, nucleic acids or microorganisms; Compositions therefor; Processes of preparing such compositions
- C12Q1/68—Measuring or testing processes involving enzymes, nucleic acids or microorganisms; Compositions therefor; Processes of preparing such compositions involving nucleic acids
- C12Q1/6813—Hybridisation assays
- C12Q1/6816—Hybridisation assays characterised by the detection means
-
- C—CHEMISTRY; METALLURGY
- C12—BIOCHEMISTRY; BEER; SPIRITS; WINE; VINEGAR; MICROBIOLOGY; ENZYMOLOGY; MUTATION OR GENETIC ENGINEERING
- C12Q—MEASURING OR TESTING PROCESSES INVOLVING ENZYMES, NUCLEIC ACIDS OR MICROORGANISMS; COMPOSITIONS OR TEST PAPERS THEREFOR; PROCESSES OF PREPARING SUCH COMPOSITIONS; CONDITION-RESPONSIVE CONTROL IN MICROBIOLOGICAL OR ENZYMOLOGICAL PROCESSES
- C12Q1/00—Measuring or testing processes involving enzymes, nucleic acids or microorganisms; Compositions therefor; Processes of preparing such compositions
- C12Q1/68—Measuring or testing processes involving enzymes, nucleic acids or microorganisms; Compositions therefor; Processes of preparing such compositions involving nucleic acids
- C12Q1/6876—Nucleic acid products used in the analysis of nucleic acids, e.g. primers or probes
- C12Q1/6883—Nucleic acid products used in the analysis of nucleic acids, e.g. primers or probes for diseases caused by alterations of genetic material
- C12Q1/6886—Nucleic acid products used in the analysis of nucleic acids, e.g. primers or probes for diseases caused by alterations of genetic material for cancer
-
- C—CHEMISTRY; METALLURGY
- C12—BIOCHEMISTRY; BEER; SPIRITS; WINE; VINEGAR; MICROBIOLOGY; ENZYMOLOGY; MUTATION OR GENETIC ENGINEERING
- C12Q—MEASURING OR TESTING PROCESSES INVOLVING ENZYMES, NUCLEIC ACIDS OR MICROORGANISMS; COMPOSITIONS OR TEST PAPERS THEREFOR; PROCESSES OF PREPARING SUCH COMPOSITIONS; CONDITION-RESPONSIVE CONTROL IN MICROBIOLOGICAL OR ENZYMOLOGICAL PROCESSES
- C12Q2600/00—Oligonucleotides characterized by their use
- C12Q2600/156—Polymorphic or mutational markers
Definitions
- the present invention relates to methods for monitoring and determining genomic instability of a cell, in particular for the detection, monitoring and diagnosis of cell proliferative disorders such as cancer.
- the invention relates to three-dimensional analysis, and more specifically to characterization of the organization of telomeres and chromosomes.
- Telomeres are the ends of chromosomes. By capping the chromosomes, they are responsible for chromosomal integrity to prevent genomic instability 1-3 . Telomeres have been previously found at the nuclear edge 4 , at the nuclear periphery 5 , throughout the entire nucleus 6 , in non-Rabl association 7 , and in association with the nucleolus 8 . Similarly, the nuclear organization of chromosomes has been described as non-random 9-13 or random 14 , based on two-dimensional (2D) imaging, three-dimensional (3D) reconstitution and mathematical modeling 15 . Organized territories of individual chromosomes have been observed in human 10-13 , chicken 16 and plant 17 . A regular nuclear organization has also been described for replication and transcription 18-21 . While all this points to a well-defined nuclear organization, studies on radiation-induced aberrations suggested a random chromosomal organization 14 .
- telomeres and chromosomes have elucidated the three-dimensional (3D) organization and localization of telomeres and chromosomes in 3D interphase nuclei of normal, immortalized and tumor cells. It has been established that, independent of species and cell type, the mammalian telomeres and chromosomes are organized dynamically and non-randomly in the 3D nucleus of normal cells. On the other hand, 3D nuclei from tumor cells display a new order of telomeric and chromosome organization including telomere aggregations and concomitantly, altered positioning of telomeres and chromosomes. This altered nuclear telomeric organization allows chromosomal rearrangements. The precise organization of the 3D genome or alterations thereof reflects the differences in genomic stability vs instability of normal vs. cancer cells.
- the present invention relates to a method of monitoring or detecting genomic instability in a test cell comprising:
- the method of the invention may be used to detect or monitor disease, radiation and environmental exposure, and DNA repair and response in a cell.
- the method of the invention may be used to detect, monitor or diagnose cancer.
- the method of the invention may be used to monitor disease treatment, in particular cancer treatment.
- the system includes an input module for inputting image data of the 3D organization of telomeres and/or chromosomes and a characteristic module for finding a parameter of the 3D organization therefrom.
- telomeres and/or chromosomes may be used to characterize the 3D organization of telomeres and/or chromosomes. These parameters include a set of distances of the telomeres and/or chromosomes to a closest plane, the average of this set and the standard deviation of this set. Another parameter involves specifying the geometrical shape that best encompasses the organization of telomeres and/or chromosomes. The volume, intensity and shape of each the telomeres and/or chromosomes may also be used to characterize the 3D organization.
- telomeres and/or chromosomes may be used for several purposes, including to monitor or detect genomic instability in a cell, to monitor, detect or diagnose a disease, such as cancer, and to monitor disease treatment, such as cancer treatment.
- FIG. 1 illustrates a metaphase plate prepared from fetal liver cells directly isolated from 10 day old mouse embryos. Metaphase chromosomes and spreads were prepared and hybridized with PNA-telomeric probe that was Cy3 labeled.
- FIG. 2 describes the volume spanned by the telomeres in an interphase nucleus as an ellipsoid.
- the ellipsoid main axes along the x′y′z′ axes do not coincide with the slide plane and optical axes of xyz.
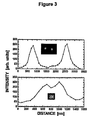
- FIG. 3 illustrates the signal to noise and spatial resolution of the instruments used by the inventors.
- the fluorescence intensity in the measurements is bright and significantly higher than the background noise (typical signal to noise ratio of 10:1 or higher). This high signal to noise ratio enables a reliable analysis of the telomeres position and intensities.
- a pair of telomeres from an interphase nucleus was selected from a single plane from the stack of ⁇ 80 sections. Top: shows a pair of telomeres that are 1200 nm apart and can be easily separated. Bottom: shows a pair of telomeres that are 400 nm apart. The inserts show the actual image of the pairs.
- FIG. 4 illustrates telomere organization in interphase nuclei of primary mouse and human cells.
- 4A Telomere organization in primary mouse lymphocytes.
- a-c Localization of telomeres in primary BALB/c splenic B lymphocytes maintained in the presence (b,c) or absence (a) of lipoploysaccharide (LPS) for a 0 hours, b 24 hours, c 69 hours.
- LPS lipoploysaccharide
- each of the five panels illustrate; a schematic representation of the telomere localization, followed by the 2D image of the interphase nucleus and its telomeres, followed by the 3D front view of the nucleus with DAPI (blue) counterstain (3DFdapi), 3DF without DAPI (3DF), and the 3D side view of the telomeres within the nucleus (3DS). Telomeres are stained in red (Cy3 labeled PNA telomere probe). In each of the panels, the 3D interphase localization of the telomeres can be visualized as 3D movies (available from Dr. Sabine Mai, Manitoba Institute of Cell Biology, CancerCare Manitoba, University of Manitoba, 675 McDermot Ave., Winnipeg, Manitoba).
- 3DF stands for three dimensional front view
- 3DS stands for three dimensional side view
- 4B Telomere organization in primary human cells. a-c Localization of telomeres in primary human lymphocytes stimulated with phytohemaglutinin (PHA) and in primary human fibroblasts (left and right panels respectively). As indicated, each of the panels show representative images in 2D, 3DFdapi, 3DF, and 3DS for decondensed (a), less decondensed (b) and condensed (c) telomeres (red). Abreviations as in FIG. 4A . In each of the panels, the 3D interphase localization of the telomeres can be visualized as 3D movies (available from Dr. Sabine Mai, Manitoba Institute of Cell Biology, CancerCare Manitoba, University of Manitoba, 675 McDermot Ave., Winnipeg, Manitoba).
- FIG. 5 illustrates the distribution of telomeres in the interphase nucleus of three typical cells selected from the G0/G1 phase (upper row), S phase (middle row) and late G2 phase (lower row).
- Each telomere distribution is shown from a top view (the XY plane) as observed along the optical axis Z (left column), from a side view (XZ plane) as observed along the Y axis (center column) and as a 3D image of the telomeres in an open nucleus (right column).
- the telomeres are displayed on top of the projected image of the nucleus. This projection demonstrates the extent of the chromatin (and therefore chromosomes) and defines the area and borderline of the nucleus.
- FIG. 6 illustrates cell fractions as a function of time showing the TD (black line and circles), entering mitosis (dashed line and squares) and entering G1 (dotted line and triangles). The time is measured since the population was harvested after being sorted. From the bar graph one can observe that most cells (90%) form a telomeric disk (TD) 3.5 hours after BrdU incorporation.
- the fraction of metaphase cells peaks at 7.5 hours (65%) and the number of interphase cells that does not have a TD (and are interpreted as being in G1 phase) peaks after 8.5 hours (57%).
- the increase in the number of metaphases at 9.5 hours can not be explained and probably lies within the limits of experimental errors. This demonstrates that a TD is formed in late G2 phase.
- telomeres As cells progress from G2 to M, telomeres start to spread out and the organization of telomeres into the TD is no longer observed. At the end of M phase, the inventors begin to observe nuclei in G1 conformation of telomeres with wide distribution of telomeres throughout a smaller nucleus.
- FIG. 7 illustrates telomere organization in interphase nuclei of immortalized and tumor mouse and human cell lines. To better illustrate the localization of telomeres, they are represented in the telomeric disk (TD) state (for details, see text). As indicated, the telomeres are shown in 2D and 3DS. Abbreviations as in FIG. 4A.a v-abl immortalized mouse Pre-B lymphocyte line 26 . b Spontaneously immortalized tetraploid mouse BAF3 cells 27 . c Telomere organization in spontaneously immortalized tetraploid HaCaT cells 25 . d Telomere organization in human tumor cell lines in Colon320DM 28 and e in SH-EP 29 . Telomere aggregations and distorted disks are indicated by arrows.
- FIG. 8 illustrates telomere organization in interphase nuclei of mouse and human tumors.
- 8A Telomere organization in mouse tumor and control cells. a Normal splenocytes and b mouse plasmacytoma DCPC21 30 . Telomeres are shown in 2D and 3D respectively for abbreviations, see FIG. 4A . Telomere aggregations and distorted disks are indicated by arrows.
- 8B Telomere organization in human tumor and control tissues. Telomeres are shown in 2D and 3D for a Control epithelial tissue, overview and b insert images, and c head and neck squamous cell carcinoma tissue, overview and d insert images. Telomere aggregations and distorted disks are indicated by arrows.
- FIG. 9 illustrates the distribution of telomeres in interphase nuclei of cancer cells compared to a normal cell. Images are shown as explained in FIG. 5 .
- Normal A normal blood cell.
- RAJI A Burkift lymphoma cell line.
- PCT a primary mouse plasmacytoma cell.
- HNSCC A primary human head and neck squamous cell carcinoma (stage IV). Aggregates of telomeres are formed and the telomere disk is distorted.
- FIG. 10 illustrates the telomere organization in interphase nuclei of mouse and human normal, immortalized and tumor cells. Telomeres are shown in 2D and 3D, for abbreviations see FIG. 4A . The following cell types are shown: a and b mouse embryonic fibroblast; c fibroblast; d VH primary human fibroblast; e HaCaT human keratinocyte cell line; f SH-EP neuroblastoma cell line; g cervical cancer; and h RAJI Burkift Lymphoma cell line.
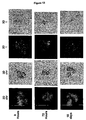
- FIG. 11 illustrates telomere and chromosome organization in 3D mouse and human interphase nuclei of normal, immortalized and tumor cells. Abbreviations as in FIG. 4A . chr: chromosomes, t: telomeres. 11 A. Telomere and chromosome organization in 3D mouse nuclei of normal, immortalized and tumor cells. Chromosome painting was carried out with chromosome 11 paint, and images were acquired and analyzed in 2D and 3D for primary spleen cells a, immortalized Pre-B cells with trisomy 11. b, and tumor cells (plasmacytoma DCPC21).
- c In addition, the whole genome was visualized following mouse SKY, showing the arrangement of all chromosomes in the 3D nuclear space. However, only Cy3 and FITC filters were available for deconvolution. d Shows the same analysis performed for the plasmacytoma DCPC21. Note the change in 3D space occupied by chromosome 11 in Pre-B cells trisomic for chromosome 11 and in mouse plasmacytoma and a dislocated telomere (3DSt). Telomere hybridization was performed for the identical cells and is shown for each of the images presented. 11 B. Telomere and chromosome organization in 3D human nuclei of normal and tumor cells.
- Chromosome painting was carried out with chromosome 1 (green) and chromosome 21 (red), and images were acquired and analyzed in 2D and 3D for primary human lymphocytes a, and for the human colon carcinoma line Colo320DM b. Note that only 11 images were deconvolved for 11 A and all images gave similar results. Arrows depict chromosomal rearrangements between chromosomes 1 and 21. Telomere hybridization was performed for the identical cells and is shown for each of the images presented. Telomere aggregations and distorted disks are indicated by arrows.
- FIG. 12 illustrates telomeric organization in two-dimensional and three-dimensional interphase nuclei of primary and immortalized mouse B-lymphocytes.
- a Primary BALB/c lymphocyte nucleus in G0/G1 phase of the cell cycle. The a/c ratio is 1.
- b Nucleus of Pre-B mouse lymphocyte, immortalized, non-tumorigenic in G1/S phase telomeric organization. The a/c ratio is 8.8.
- c Baf3 mouse pro B lymphocyte in G1-S phase telomeric organization, immortalized, non-tumorigenic. The a/c ratio is :5.5.
- 2D two-dimensional analysis of telomeres in the interphase nucleus.
- 3DF three-dimensional analysis of the telomeres in the interphase nucleus, front view.
- 3DS three-dimensional analysis of the telomeres in the interphase nucleus, side view. Telomere hybridizations and imaging in 2D and 3D were as outlined herein.
- FIG. 13 illustrates telomere and chromosome organization in interphase nuclei of MycER-activated mouse B-lymphocytes (Pre-B).
- Pre-B MycER-activated mouse B-lymphocytes
- the identical nuclei have been probed for chromosomes and telomeres.
- Left panels show the two-dimensional (2D) images of FISH with chromosome paints at 0 hours, 72 hours, and 10 days.
- Second panel to the left shows the same image after three-dimensional (3D) analysis.
- the DAPI channel has been inactivated in order to visualize the red (chromosome 11) and green (chromosome 15) signals within the nucleus. Note the mixed color signatures of chromosomes 11 and 15 at 72 hours.
- telomere hybridizations in 2D and 3D respectively.
- 2D t shows the telomeric signals (red) seen in 2D nuclei at 0 hours, 72 hours and 10 days.
- 3D t shows the telomeric signals (red) seen in 3D nuclei at 0 hours, 72 hours and 10 days. Note the telomeric aggregates at 72 hours. Similar results were obtained with BAF3 cells.
- 2D chr two-dimensional image of chromosomes; 3D chr: three-dimensional image of chromosomes.
- 2D t two-dimensional image of telomeres; 3D t: three-dimensional image of telomeres.
- FIG. 14 illustrates telomere organization in interphase nuclei of MycER-activated mouse B-lymphocytes (Pre-B).
- This peak in aggregate formation (see also Table 9) is reversible after c-Myc deregulation ceases.
- the telomeric order is almost identical to the one measured for 0 hours. 0 hours: black, 72 hours: dark grey, 10 days: grey.
- the measurements were carried out with a novel software that was developed by the present inventors.
- FIG. 15 illustrates FACS analysis of MycER-activated mouse pro B lymphocytes (BAF3). Cells were analyzed by FACS and the viability of the culture was assessed at 0, 1, 3-10 days. The sub-G1 cells in cultures grown in the absence or presence of 4HT was identical.
- FIG. 16 illustrates the organization of chromosomes and telomeres in primary mouse plasmacytoma.
- 2D and 3D images show the organization of telomeres (t) and of chromosome 11 (chr) in interphase nuclei (blue) of primary mouse plasmacytoma and control primary B cells.
- Panel a primary mouse B cells
- panel b primary mouse plasmacytoma cells. The abbreviations are as given in FIG. 13 .
- FIG. 17 illustrates that 3D telomeric organization in interphase nuclei are altered as a result of radiation exposure.
- a 3D telomeric organization in lymphocyte line without radiation exposure.
- b and c 3D telomeric organization after 12 and 24 hours of radiation exposure (6Gy) respectively.
- FIG. 18 illustrates two-dimensional and three-dimensional images of interphase nuclei of control mammary tissue and breast cancer.
- 3D reconstructions for each of the patients are shown in bottom panels (3DR). (see also Table 8). Note that there are no telomere aggregations in normal breast tissue. Telomeres are shown in red. Nuclei are shown in blue. The 3D images show telomeres only.
- 3DF three-dimensional front view; 3DS: three-dimensional side view.
- 3DR 3D reconstruction by YG. Magnification of 2D images: 63 ⁇ /1.4 oil Planapo (Zeiss). 3D images were rendered as described (Chuang et al, 2004).
- FIG. 19 is a block diagram of a system for characterizing a 3D organization of telomeres and/or chromosomes in interphase nuclei.
- FIGS. 20A and 20B show plots of intensities of telomeres of interphase nuclei that may be used to characterize a 3D organization of telomeres.
- telomere dysfunction associated with tumor development and genomic instability 22,23 .
- Genomic instability is a complex process through which the genome of the affected cell becomes prone to transformation and ultimately transformed, and involves the genetic reorganization of the cellular genome.
- such genetic reorganization is readily observed in the 3D interphase nucleus, irrespective of the cell and tumor type. It is clearly visible when analyzing the 3D telomeric organization.
- genomic instability also becomes apparent when examining the territories occupied by individual chromosomes and the chromosomal alignment along the telomeric disk (see below).
- the 3D intranuclear space and organization of telomeres and chromosomes are clearly abrogated in tumor cells. Instead, a new order of complexity is generated in which genetic rearrangements become feasible through the illegitimate juxtaposition of genetic material that is otherwise found in different regions of the nucleus.
- the present inventors have used high resolution deconvolution microscopy and imaging to elucidate the three-dimensional (3D) organization of telomeres and chromosomes in the interphase nuclei of normal, immortalized and tumor cells. It has been found that telomeres and chromosomes from tumor cells form an altered organization, occupying a 3D space that differs from their normal counterparts.
- the present invention relates to a method of monitoring or detecting genomic instability in a test cell comprising:
- the term ‘cell’ includes more than one cell or a plurality of cells or portions of cells.
- the sample may be from any animal, in particular from humans, and may be biological fluids (such as blood, serum, saliva or cerebrospinal fluid), tissue, hair or organ.
- biological fluids such as blood, serum, saliva or cerebrospinal fluid
- tissue such as hair or organ.
- An advantage of the method of the present invention is that only a very thin slice or section of a tissue (even thinner than the width of a cell) can be used in the method.
- the “test cell” is a cell that is suspected of having a cell-proliferative disorder such as cancer.
- the test cell includes, but is not limited to, a cancer cell.
- the term cancer includes any cancer including, without limitation, cervical cancer, ovarian cancer, pancreatic cancer, head and neck cancer, squamous cell carcinoma, gastrointestinal cancer, breast cancer (such as carcinoma, ductal, lobular, and nipple), prostate cancer, non small cell lung cancer, Non-Hodgkin's lymphoma, multiple myeloma, leukemia (such as acute lymphocytic leukemia, chronic lymphocytic leukemia, acute myelogenous leukemia, and chronic myelogenous leukemia), brain cancer, neuroblastoma, sarcomas, colon cancer, plasmacytoma, head and neck squamous cell carcinoma, lymphoma, and cMyc-dependent tumors.
- the cancer includes, without limitation, colon cancer, neuroblastoma, plasmacytoma, head and neck squamous cell carcinoma, lymphoma, breast cancer and cMyc-dependent tumors.
- the sample can be any sample that contains the cancerous cells such as a biopsy from the tumor or blood.
- control cell refers to a normal, disease-free cell.
- three-dimensional (3D) analysis refers to any technique that allows the 3D visualization of cells, for example high resolution deconvolution microscopy.
- the 3D analysis is performed using the system described hereinbelow.
- telomere organization refers to the 3D arrangement of the telomeres and/or chromosomes during any phase of a cell cycle and includes such parameters as telomere and/or chromosome size, alignment, state of aggregation and the size of the 3D space that the telomeres and/or chromosomes occupy.
- Telomere organization also refers to the size and shape of the telomeric disk which is the organized structure formed when the telomeres condense and align during the late G2 phase of the cell cycle.
- state of aggregation refers to the size and shape of the aggregates of telomeres and/or chromosomes.
- the “change in telomeric and/or chromosomal organization in the test cell compared to the control cell” may be determined, for example by counting the number of telomeres in the cell, measuring the size of any telomere or telomere aggregate or characterizing 3D chromosomal organization during any phase of the cell cycle.
- any telomere in the test cell is larger (i.e. form more aggregates), for example double the size, of those in the control cell, then this indicates the presence of genomic instability in the test cell.
- the telomeres in a test cell with genomic instability may also be fragmented and therefore appear smaller than those in the control cell.
- the change in telomeric organization in the test cell compared to the control cell is determined by monitoring the alignment of telomeres in the telomeric disk during the late G2 phase of the cell cycle as well as the size of the telomeric disk during the late. G2 phase.
- the telomeres in a cell with genomic instability will fail to align in the way those in a control cell will align, and therefore the telomeric disk in cells with genomic instability will be distorted and occupy an enlarged space compared to controls.
- a change in chromosomal organization, positioning or alignment in the test cell compared to the control cell indicates the presence of genomic instability in the test cell. For example, the intermingling of genetic material is indicative of genomic instability.
- a change in telomeric and/or chromosomal organization in the test cell compared to the control cell may be determined by comparing parameters used to characterize the organization of telomeres and/or chromosomes. In a further embodiment, such parameters are determined or obtained using a system and/or method described hereinbelow.
- the results obtained in the present studies show that genomic instability in a cell is correlated with disease.
- the presence of genomic instability in a cell indicates the presence of a cell proliferative disorder in the cell. Therefore in an embodiment of the present invention the method the presence of genomic instability in a cell is indicative of a cell proliferative disorder.
- the presence of genomic instability in a cell indicates that the cell is a cancer cell. Therefore in an embodiment of the present invention the method the presence of genomic instability in a cell is indicative of cancer.
- the present invention also includes of method of detecting, monitoring disease in a test cell comprising:
- the disease is a cell proliferative disorder, for example, cancer.
- the cancer includes breast cancer, prostate cancer, lymphoma, leukemia, sarcoma, melanoma, head and neck squamous cell carcinoma, lung cancer, ovarian cancer and endometrial cancer.
- the method of the invention may also be used to monitor disease treatment.
- samples comprising test cell(s) from a patient with a cell proliferative disorder may be taken at various time points, for example before, during and after chemo or other forms of therapy, and the presence of genomic instability determined.
- the diminishing of genomic instability in the test cells over time would be indicative of successful therapy.
- an increase in or lack of change in the genomic instability of the test cells over time would be indicative of unsuccessful therapy.
- the present invention further relates to method of monitoring disease treatment in a test cell comprising:
- the method of the invention may be used to monitor radiation, environmental impact, injury and key proteins in DNA repair in a cell.
- the present invention further relates to method of monitoring radiation, environmental impact, injury and key proteins in DNA repair in a test cell comprising:
- treatment is an approach for obtaining beneficial or desired results, including clinical results.
- beneficial or desired clinical results can include, but are not limited to, alleviation or amelioration of one or more symptoms or conditions, diminishment of extent of disease, stabilized (i.e. not worsening) state of disease, preventing spread of disease, delay or slowing of disease progression, amelioration or palliation of the disease state, and remission (whether partial or total), whether detectable or undetectable.
- Treatment can also mean prolonging survival as compared to expected survival if not receiving treatment.
- “Palliating” a disease or disorder means that the extent and/or undesirable clinical manifestations of a disorder or a disease state are lessened and/or time course of the progression is slowed or lengthened, as compared to not treating the disorder.
- the present invention relates to a method of monitoring or detecting genomic instability in a test cell comprising:
- the present invention also includes of method of detecting, monitoring disease in a test cell comprising:
- the present invention further relates to method of monitoring disease treatment in a test cell comprising:
- the present invention relates to methods and systems for characterizing the 3D organization of telomeres and/or chromosomes.
- FIG. 19 shows a block diagram of a system 100 for characterizing a 3D organization of telomeres and/or chromosomes.
- the system 100 includes an input module 102 , an image data processor 104 , an optimizer 106 and a characteristic module 108 .
- the input module 102 inputs image data of the 3D organization of telomeres and/or chromosomes.
- the input module 102 includes appropriate hardware and/or software, such as a CD-ROM and CD-ROM reader, or other data storage and reading means.
- the inputting performed by the input module 102 need not be from outside the system 100 to inside the system 100 . Rather, in some embodiments, the inputting of data may describe the transfer of data from a permanent storage medium within the system 100 , such as a hard disk of the system 100 , to a volatile storage medium of the system 100 , such as RAM.
- the image data can be obtained using regular or confocal microscopy and can include the intensities of one or more colors at pixels (totaling, for example, 300 ⁇ 300 or 500 ⁇ 500) that comprise an image of a nucleus.
- the image data can also be grey level image data of a nucleus that has been appropriately stained to highlight telomeres and/or chromosomes.
- Several images (on the order of 100) are obtained corresponding to slices along a particular axis.
- the image data may correspond to a total of about 2.5 ⁇ 10 7 pixels.
- the slices may be on the order of 100 nanometers apart. In this manner, the image data accounts for the 3D quality of the organization of telomeres and/or chromosomes.
- the confocal microscope is able to obtain the intensity of two colors, for example blue and green, of the nucleus at every pixel imaged, thereby doubling the amount of data points.
- a stain such as DAPI can be used to preferentially mark the heterochromatin material that comprises DNA.
- a second stain, such as cy3, together with an appropriate label, such as PNA telomere probe, can be used to mark the telomeric portion of the heterochromatin material.
- constrained iterative deconvolution of the image data to improve resolution.
- constrained iterative deconvolution may not be required if confocal, instead of regular, microscopy is used as the image data may be of superior resolution.
- other instruments such as an apotome, may be used to improve the quality of the image.
- Each blob identified as a telomere and/or chromosome has a non-negligible volume (for example, a small telomere may have a volume of 4 ⁇ 4 ⁇ 4 pixels, a large one a volume of 10 ⁇ 10 ⁇ 10, where the size of the nucleus may be approximately 200 ⁇ 200 ⁇ 100 pixels).
- a small telomere may have a volume of 4 ⁇ 4 ⁇ 4 pixels, a large one a volume of 10 ⁇ 10 ⁇ 10, where the size of the nucleus may be approximately 200 ⁇ 200 ⁇ 100 pixels.
- the optimizer 106 finds the parameters a,b,c,d that minimize the function.
- ⁇ i 1 N ⁇ D i ⁇ ( a , b , c , d ) .
- the characteristic module 108 proceeds to find at least one parameter that can be used to characterize the 3D organization of telomeres and/or chromosomes.
- “Parameters used to characterize the organization of telomeres and/or chromosomes” include:
- the geometrical shape can be the ellipsoid, having principal axes ⁇ 1 , ⁇ 2 , and ⁇ 3 , that best encompasses the 3D organization of the telomeres and/or chromosomes.
- the ellipsoid that best encompasses the telomeres can be defined as the ellipsoid of smallest volume that encloses a certain fraction (e.g., 100%) of the telomeres.
- telomeres and/or chromosomes can be used.
- ⁇ 1 approximately equal to ⁇ 2 .
- ⁇ 3 an oblateness ratio
- ⁇ 1 can be used to characterize the oblate spheroid describing the organization of the telomeres.
- I i-j is the intensity of the jth pixel of the ith telomere.
- FIG. 20A shows a plot of i, where i denotes the ith telomere, versus I i , where the ordering of the telomeres, from left to right, is from lowest total intensity to highest total intensity.
- FIG. 20B shows a similar plot except that the vertical axis is I i divided by the average total intensity over a sample set of cells.
- the sets can be used to calculate statistical measures such as an average, a median or a standard deviation.
- the parameters 1-5 outlined above characterize the 3D organization of the telomeres and/or chromosomes by focusing on the geometrical structure of the telomeres and/or chromosomes.
- Parameters 1 and 2 are motivated by the finding that, especially during the late G2 phase of the cell cycle, telomeres tend to lie on a plane.
- Parameters 1 and 2 measure deviations of telomeres from a planar arrangement.
- Parameter 3 attempts to describe, with features, such as the three principal axes of an ellipsoid or the oblateness ratio, the overall shape of the 3D organization. While parameters 1-3 are global geometric characteristics, dealing with the overall shape of the organization parameters 4 and 5 are local geometric characteristics in the sense that they involve the geometry of each individual telomere.
- the final parameter is also local, involving the intensity of each individual telomere.
- the characterizations of the 3D organization of telomeres and/or chromosomes can be used for a number of purposes. For example, by comparing a parameter to a standard value, diseases may be monitored or diagnosed, as described above.
- the standard (control) values can arise from population studies, theoretical models, or the characterization of control cells.
- the characterizations of the 3D organization of telomeres and/or chromosomes can be used to monitor or detect genomic instability in a cell.
- Table 1 summarizes the cells that were used in this study.
- Mouse primary cells were directly isolated from BALB/c mice. Human primary cells were obtained form healthy donors. Cell lines and culture conditions have been described elsewhere (HaCaT 25 , Pre-B 26 , BAF3 27 Colo320DM 28 , SH-EP 29 )
- the primary plasmacytoma DCPC21 was isolated from a BALB/c mouse 30 . Head and neck squamous cell carcinoma and control tissue were obtained from a patient at CancerCare Manitoba upon ethics approval and informed consent.
- Cells were fixed in four ways: i) following cytospin preparations, cells were fixed in 3.7% formaldehyde (1 ⁇ PBS/50 mM MgCl 2 ), ii) cells were allowed to grow on glass slides and were fixed in 3.7% formaldehyde, iii) cells were fixed in suspension with 3.7% formaldehyde, and iv) cells were fixed in methanol:acetic acid (3:1) according to standard protocols 31 . Tissue was fixed following cryosection (5 mm sections were used) in 3.7% formaldehyde (1 ⁇ PBS/50 mM MgCl 2 ).
- FACS Fluorescent Activated Cell Sorter
- FACS analysis primary lymphocytes were fixed in 70% ethanol and stained with propidium iodide (1 ⁇ g/ml) following RNAse (20 ⁇ g/ml) digestion. FACS profiles were obtained at 0, 24, 48, and 69 hours post stimulation.
- Cells were stained with Hoechst 33342 (Molecular Probes) at a final concentration of 1 ⁇ g/ml for 90 minutes at 37° C. and 5% of CO2. Cells were sorted according to their DNA content (G0/G1, S and late G2 phases).
- Telomere FISH was performed as described 32 using a Cy3 labeled PNA telomere probe (DAKO, Glostrup, Denmark). Telomere hybridizations were specific as shown by metaphase hybridizations and the correct number of the telomeric signals observed at the ends of chromosomes prepared from primary cells ( FIG. 1 ).
- Chromosome painting was carried out according to standard protocols 31 using a chromosome 11 paint from CedarLane (Hornby, ON, Canada), and chromosome 1 and 21 paints from MetaSystems Group Inc. (Boston, Mass., USA). Spectral karyotyping was carried out as described 30 using the mouse SKY kit from Applied Spectral Imaging Inc. (Carlsbad, Calif., USA).
- a minimum of 20 cells and a maximum of 30 cells were analyzed by 3D imaging using Axioplan 2 (Zeiss) with 100 W fluorescence, a cooled AxioCam HR B&W with 1 ⁇ adaptor (Zeiss).
- DAPI, FITC and Cy3 filters were used in combination with Planapo 63 ⁇ /1.4 oil (Zeiss).
- Axiovision 3.1 software with deconvolution module and rendering module were used (Zeiss). 80 and 160 sections were acquired at 100 and 200 nm respectively.
- the constrained iterative algorithm option was employed 33 and surfaces rendered in x, z and x, y axes.
- telomere organization inside the nucleus
- telomere volume is oblate.
- the x′y′ plane of the spheroid should not necessarily be parallel to the microscope slide plane (described by xy), especially in those cases where tissue section are analyzed.
- the optical resolution and signal to noise ratio (SNR) are shown in FIG. 3A .
- the images of two neighbor telomeres that are 1200 nm and 400 nm apart and the corresponding intensity along the line connecting the pair indicates the smallest telomere distance that can still be unambiguously distinguished. This optical resolution is good enough for studying the nuclear organization of the telomeres, even if close telomeres are indistinguishable.
- FIG. 1 The findings for primary cells ( FIG. 1 ), immortalized cells ( FIG. 2 ), and tumor cells and tissue ( FIGS. 3 and 4 ) are summarized below.
- FIG. 1 With a simplified model on dynamic telomeric localization illustrates the data for primary mouse and human lymphocytes in both 2D and 3D formats.
- 3D images are presented from the three-dimensional front view (3DF) and from the three-dimensional side view (3DS).
- 3D movies were obtained that further illustrate the 3D findings. The 3D movies are readily available upon request from Dr. Sabine Mai, Manitoba Institute of Cell Biology, CancerCare Manitoba, University of Manitoba, 675 McDermot Ave., Winnipeg, Manitoba.
- the telomeric organization is a dynamic cell cycle dependent process.
- the commonly used 2D-analysis does not allow for a precise localization of the telomeres within interphase nuclei.
- 3D analysis defines their exact nuclear location.
- the 3D data demonstrate that telomeres are highly ordered in the nuclear space of primary cells. In resting, non-cycling (G0/G1) primary mouse and human lymphocytes, telomeres are decondensed. At this time, the segment of the nuclear sphere that telomeres occupy is found consistently within a 680 mm 3 nuclear region in a total nuclear volume of 905 mm 3 ( FIG. 4A , panel a, and in 3D movies).
- telomeres condense prior to late G2 and are then located within a volume of 410 mm 3 ( FIG. 4A , panel b, and in 3D movies).
- the telomeres fully condense in late G2 and precisely align, forming an organized structure that has been designated the telomeric disk (TD) ( FIG. 4A , panel c, and in 3D movies).
- TD telomeric disk
- telomeres are evenly distributed throughout the disk.
- the TD occupies a 190 mm 3 volume of the central nuclear space ( FIG. 4A , panel c, and in 3D movies). Similar results on telomeric organization were recorded in primary human lymphocytes ( FIG.
- telomeres are widely distributed throughout the nucleus in G0/G1 and S phases with a calculated a/c ratio of 0.9 ⁇ 0.4 which means a spherical-like volume.
- a/c ratio of 0.9 ⁇ 0.4 which means a spherical-like volume.
- TD telomeric disk
- Typical cells from different phases are shown in FIG. 5 .
- the a/c ratio of these cells in G0/G1, S and late G2 phases is 0.8, 0.8 and 6 respectively and clearly shows the correlation of the a/c ratio with the telomere distribution and the organization of the TD that have been found in the G2 phase.
- the elongation of the telomeres along the Z axis relative to the XY plane has the same ratio as the point spread function of the present system and therefore is a result of the poorer optical resolution along the optical axis. This however, has a very small effect on the shape of the whole nucleus.
- FIG. 6B shows the cell fractions as a function of time. Most cells (90%) form a TD 3.5 hours after BrdU incorporation. The fraction of metaphase cells peaks at 7.5 hours (65%) and the cell fraction of interphase cells that do not have a TD (and are interpreted as being in the G1 phase) peaks at 8.5 hours (57%).
- telomeres The question of whether or not this 3D organization was present in non-tumorigenic immortalized cells was addressed next. It was observed that the telomeric organization of normal cells is maintained in immortalized diploid cells as documented in the 3DS position that best illustrates the organization of the telomeres ( FIG. 7 a ). However, there are consistent alterations of telomeric organization in immortalized tetraploid mouse and human cell lines ( FIG. 7 b , FIG. 10 and data not shown). Such tetraploid cells show a double telomeric disk, consisting of two individual TDs, with telomeres that synchronously decondense or condense in the 3D space of the nucleus.
- telomeric organization is found in tumour cell lines ( FIGS. 7 c and d , and FIG. 10 ). More importantly, this new telomeric organization is not a tissue culture artifact but intrinsic to tumor cells, as demonstrated in FIG. 8 , panel b, and FIG. 8B , panels c and d, arrows.
- Colon carcinoma and neuroblastoma cell lines FIGS. 7 c and d , and FIG. 10
- stage IV FIGS. 8A and B, and FIG. 10
- FIGS. 8A and B, and FIG. 10 show a similar reorganization of the 3D nuclear space.
- telomeres All tumor cells show large aggregates or aggregations of telomeres of various levels of complexity so that telomeres fail to properly align in the TD ( FIGS. 7 and 8 ). This structural alteration coincides with the distortion of the TD ( FIGS. 7 and 8 ). Moreover, aggregated or fused telomeres protrude outside of the TD space thus enlarging the TD space considerably ( FIGS. 7 and 8 , see inserts and arrows). In addition, it is striking that individual non-aggregated or fused telomeres are also not properly integrated into the TD ( FIGS. 7 and 8 ).
- telomeres of tumor cells form an altered telomeric organization, occupying a 3D space that differs from their normal counterparts.
- telomeres form aggregates and thus a partially altered TD.
- telomere aggregates are characterized by both a larger volume and a larger integrated intensity than their normal non-overlapping and non-aggregated counterparts. They are not observed in normal cells. Similar results on altered telomeric organization were also found in human neuroblastoma and colon carcinoma tumor cell lines.
- Tables 2 to 8 show the number of aggregates and the number of dividing telomeres in normal controls, immortalized cell lines, cancer cell lines and cancer samples.
- telomeres display an ordered localization in the 3D nuclear space ( FIG. 11A , panel a and FIG. 11B , panel a). Both mouse chromosomes 11 are consistently seen in two distinct territories in normal cells and properly aligned in the TD ( FIG. 11A , panel a). Surprisingly, the TD is maintained in immortalized mouse B cells with trisomy 11 ( FIG. 11A , panel b).
- the additional chromosome 11 occupies a distinct 3D intranuclear space that differs from the chromosome 11 organization in diploid cells ( FIG. 11A , panel a), telomeres and chromosomes of these cells perfectly align along the TD ( FIG. 11A , panel b).
- the 3D interphase nuclear space appears to tolerate an additional chromosome by aligning it along the TD.
- mouse spectral karyotyping for the same cells, it was found that all chromosomes properly align along the TD ( FIG. 11A , panel c).
- the 3D organization of chromosome 11 in mouse tumor cells was examined next. As illustrated in FIG.
- chromosome 11A panel d
- the order of chromosome 11 positioning is altered.
- the chromosomes 11 are dispersed widely throughout the 3D space of the nucleus ( FIG. 11A , panel d, 3DF chromosomes (chr)).
- chromosomes 11 are also improperly aligned along the TD ( FIG. 11A , panel d, 3DS chr).
- this TD shows some telomeric aggregations or aggregates, and one telomere is not integrated into the TD ( FIG. 11A , panel d, 3DS telomeres (t) (arrow)).
- c-Myc Deregulations Alters 3D Organization of Telomeres and Chromosomes of the Interphase Nucleus.
- BAF3 27 Pre-B 28
- the primary plasmacytoma DCPC21 was isolated from a BALB/c mouse 30 .
- v-abllmyc-induced plasmacytomas were collected from BALB/c mice.
- MycER was activated as described previously 27,28 .
- telomere FISH was performed as described 32 using a Cy3 labeled PNA telomere probe (DAKO, Glostrup, Denmark). Telomere hybridizations were specific as shown by metaphase hybridizations and the correct number of the telomeric signals observed at the ends of chromosomes prepared from primary cells.
- Chromosome painting was carried out according to standard protocols 31 using a mouse chromosome 11 (Cy3) and 15 (FITC) paints from CedarLane (Hornby, ON, Canada).
- SKY Mouse spectral karyotyping
- a minimum of 20 and a maximum of 30 nuclei were analyzed by 3D imaging using Axioplan 2 (Zeiss) with 100 W fluorescence, a cooled AxioCam HR B&W with 1 ⁇ adaptor (Zeiss).
- DAPI, FITC and Cy3 filters were used in combination with Planapo 63 ⁇ /1.4 oil (Zeiss).
- Axiovision 3.1 software with deconvolution module and rendering module were used (Zeiss). 80-100 sections were acquired for each fluorochrome at 100 and 200 nm respectively.
- the constrained iterative algorithm option was employed 33 and surfaces rendered in x, z and x, y axes.
- telomere parameters and the distribution of telomeres inside the volume of the nucleus.
- the program segments the nucleus, counts the telomeres and analyzes the size shape and intensity of each one. Finally, the distribution of telomeres inside the nucleus was analyzed. It compared the volume of the nucleus itself (as calculated from the 3D DAPI image) with the volume and the shape of the volume that was occupied by the telomeres.
- the inventors examined whether the deregulation of the oncogene c-Myc affected the 3D organization of telomeres in the interphase nucleus. To this end, the effect of a transient activation of c-Myc was examined using two independent immortalized cell lines BAF3 37 and Pre-B 28 stably transfected with MycER TM35 . In addition, a mouse model of c-Myc-dependent tumorigenesis, the mouse plasmacytoma (PCT) 36 was studied.
- PCT mouse plasmacytoma
- the first step of this study was the analysis of the 3D nuclear organization of telomeres in the non-MycER-activated BAF3 and Pre-B cells as well as in primary BALB/c B lymphocytes that served as a control for all BALB/c mouse PCTs.
- telomeres of primary BALB/c B cells showed non-overlapping telomere territories (TTs) as determined by 3D imaging and mathematical analysis ( FIG. 12 , panel a).
- TTs telomere territories
- FIG. 12 , panels b and c telomere territories
- FIG. 14 summarizes these findings graphically. These data indicate that the telomeres can alter their organization and form aggregates transiently and in a c-Myc-dependent fashion. Importantly, the reversal of the telomeric order to an almost original state was not due to growth arrest or cell death as confirmed by flow cytometry ( FIG. 15 ).
- FIGS. 13 and 14 The 3D organization of chromosomes and telomeres was studied over a time course of 10 days, in a c-Myc-dependent manner ( FIGS. 13 and 14 ).
- chromosomes 11 and 15 were found in their respective non-overlapping CTs ( FIG. 13 , panel a, 3D chr (chromosomes)).
- the telomeres of immortalized cells did not show overlaps or aggregations ( FIG. 13 , panel a, 3D t).
- chromosomes 11 and 15 were observed in altered territories in which they shared overlapping illegitimate territories as documented by the mixed color signatures representing these two chromosomes ( FIG.
- PCT mouse plasmacytoma in which c-Myc is constitutively activated through chromosomal or extrachromosomal translocation to one of the immunoglobulin loci was the in vivo model used 36,30 .
- PCTs induced by viral myc do not carry these translocations because myc is already constitutively activated due to virally-driven myc overexpression 37 .
- telomeres were analyzed by 3D imaging, and the telomeric organization of PCT interphase nuclei were examined.
- Primary BALB/c lymphocytes served as control ( FIG. 12 , panel a, FIG. 16 , panel a).
- the 3D intranuclear space of PCT nuclei exhibited an aberrant telomeric order, where telomeres formed aggregations and thus partially altered TDs ( FIG. 16 , panel b, arrows). This showed that an aberrant 3D nuclear organization of telomeres is consistently observed in primary PCTs but is absent in normal B cells.
- mouse chromosome 11 was chosen, since it constitutes the most frequent chromosomal aberration in v-abl/myc-induced PCTs 37 .
- FIGS. 16 a and b the 3D organization of chromosomes 11 in primary mouse PCTs 36,37 was disrupted.
- panel b a representative PCT with trisomy 11 showed altered positioning of one chromosome 11 as well as telomeric aggregations.
- chromosomes 11 displayed an ordered localization in the 3D nuclear space of primary B cells ( FIG. 16 ).
- Biomarkers can be defined as biological endpoints (such as cellular and molecular changes) used to indicate an exposure to ionizing radiation (IR), representing an early event that occurs as a result of IR interaction with living tissues.
- IR ionizing radiation
- the inventors have shown that gamma-irradiation alters the 3D organization of telomeres within short periods of time (12 hours) ( FIG. 17 ).
- FIG. 18 is a representative results for the breast cancer patients.
- FIG. 18 and Table 8 shows there is a significant difference in 3D telomeric volumes and telomeric aggregations between breast cancer cells and controls.
- Telomere dysfunction promotes non-reciprocal translocations and epithelial cancers in mice. Nature 406, 641-645 (2000).
- lymphocyte SPL lymphocyte SPL (spleen) Mouse, BALB/c Primary, diploid PreB lymphocyte Pre-B Mouse, BALB/c Cell line, near diploid Pro B lymphocyte BAF3 Mouse, BALB/c Cell line, near tetraploid Plasmacytoma DCPC21 Mouse, BALB/c Primary tumor, near tetraploid Plasmacytoma v-abl/myc 1 Mouse, BALB/c Primary tumor, trisomy 11 Plasmacytoma v-abl/myc 2 Mouse, BALB/c Primary tumor, diploid Lymphocyte Hu Ly Human Primary, diploid Fibroblast GL85/89W Human Primary, diploid Fibroblast VH Human Primary, diploid Keratinocyte HaCaT Human Cell line, near tetraploid Colon carcinoma Colo320HSR Human Tumor cell line, aneuploid Neuroblastoma SH-EP Human Tumor cell line, aneuploid Epithelial tissue CRTL/HNSCC Human Primary epithelial tissue, (control tissue
- LPS lipopolysaccharide
- PHA phytohemagglutinin
Landscapes
- Chemical & Material Sciences (AREA)
- Life Sciences & Earth Sciences (AREA)
- Organic Chemistry (AREA)
- Health & Medical Sciences (AREA)
- Proteomics, Peptides & Aminoacids (AREA)
- Wood Science & Technology (AREA)
- Zoology (AREA)
- Engineering & Computer Science (AREA)
- Immunology (AREA)
- Analytical Chemistry (AREA)
- Genetics & Genomics (AREA)
- General Engineering & Computer Science (AREA)
- General Health & Medical Sciences (AREA)
- Biotechnology (AREA)
- Physics & Mathematics (AREA)
- Biochemistry (AREA)
- Bioinformatics & Cheminformatics (AREA)
- Biophysics (AREA)
- Molecular Biology (AREA)
- Microbiology (AREA)
- Pathology (AREA)
- Hospice & Palliative Care (AREA)
- Oncology (AREA)
- Measuring Or Testing Involving Enzymes Or Micro-Organisms (AREA)
- Investigating Or Analysing Biological Materials (AREA)
Priority Applications (1)
| Application Number | Priority Date | Filing Date | Title |
|---|---|---|---|
| US10/546,152 US7801682B2 (en) | 2003-02-21 | 2004-02-23 | Method of monitoring genomic instability using 3D microscopy and analysis |
Applications Claiming Priority (3)
| Application Number | Priority Date | Filing Date | Title |
|---|---|---|---|
| US44854503P | 2003-02-21 | 2003-02-21 | |
| US10/546,152 US7801682B2 (en) | 2003-02-21 | 2004-02-23 | Method of monitoring genomic instability using 3D microscopy and analysis |
| PCT/CA2004/000241 WO2004074500A2 (en) | 2003-02-21 | 2004-02-23 | Method of monitoring genomic instability using 3d microscopy and analysis |
Publications (2)
| Publication Number | Publication Date |
|---|---|
| US20070031831A1 US20070031831A1 (en) | 2007-02-08 |
| US7801682B2 true US7801682B2 (en) | 2010-09-21 |
Family
ID=32908603
Family Applications (1)
| Application Number | Title | Priority Date | Filing Date |
|---|---|---|---|
| US10/546,152 Active 2026-09-28 US7801682B2 (en) | 2003-02-21 | 2004-02-23 | Method of monitoring genomic instability using 3D microscopy and analysis |
Country Status (5)
| Country | Link |
|---|---|
| US (1) | US7801682B2 (de) |
| EP (1) | EP1594990B8 (de) |
| CA (1) | CA2515792C (de) |
| ES (1) | ES2567199T3 (de) |
| WO (1) | WO2004074500A2 (de) |
Cited By (7)
| Publication number | Priority date | Publication date | Assignee | Title |
|---|---|---|---|---|
| US20100068701A1 (en) * | 2008-09-12 | 2010-03-18 | Yamada N Alice | Chromosome labeling method |
| WO2013086624A1 (en) | 2011-12-15 | 2013-06-20 | Sabine Mai | Methods for diagnosing alzheimer's disease |
| US20140024591A1 (en) * | 2012-04-24 | 2014-01-23 | Sabine Mai | Methods For Characterizing And Isolating Circulating Tumor Cell Subpopulations |
| US20150167058A1 (en) * | 2013-09-20 | 2015-06-18 | Sabine Mai | Methods for Evaluating Alzheimer's Disease and Disease Severity |
| US20160131569A1 (en) * | 2014-09-11 | 2016-05-12 | Sabine Mai | Methods For Assessing Cancer Cells Using Granulometry |
| US9963745B2 (en) | 2011-12-02 | 2018-05-08 | 3D Signatures Holdings Inc. | Hematological disorder diagnosis by 3D q-FISH |
| US10535137B2 (en) * | 2014-01-07 | 2020-01-14 | Sony Corporation | Analysis system and analysis method |
Families Citing this family (6)
| Publication number | Priority date | Publication date | Assignee | Title |
|---|---|---|---|---|
| CA2577623A1 (en) * | 2004-08-20 | 2006-02-23 | University Of Manitoba | Methods of diagnosis or detection using three-dimensional analysis |
| WO2006026714A2 (en) * | 2004-08-31 | 2006-03-09 | Board Of Regents, The University Of Texas System | Diagnosis and prognosis of cancer based on telomere length as measured on cytological specimens |
| CA2699434A1 (en) * | 2006-09-15 | 2008-04-24 | Mcgill University | Stroma derived predictor of breast cancer |
| CA2665100C (en) * | 2006-10-02 | 2017-01-03 | Cancercare Manitoba | Methods of detecting and monitoring cancer using 3d analysis of centromeres |
| US10929641B2 (en) * | 2018-08-07 | 2021-02-23 | Cytognomix Inc. | Smart microscope system for radiation biodosimetry |
| CN109948951B (zh) * | 2019-04-01 | 2022-06-24 | 吉林大学 | 一种播种作业后种子分布均匀性评价方法 |
Citations (1)
| Publication number | Priority date | Publication date | Assignee | Title |
|---|---|---|---|---|
| US6506563B1 (en) | 1995-12-22 | 2003-01-14 | Yale University | Multiparametric fluorescence in situ hybridization |
-
2004
- 2004-02-23 ES ES04713499.4T patent/ES2567199T3/es not_active Expired - Lifetime
- 2004-02-23 CA CA2515792A patent/CA2515792C/en not_active Expired - Lifetime
- 2004-02-23 EP EP04713499.4A patent/EP1594990B8/de not_active Expired - Lifetime
- 2004-02-23 US US10/546,152 patent/US7801682B2/en active Active
- 2004-02-23 WO PCT/CA2004/000241 patent/WO2004074500A2/en not_active Ceased
Patent Citations (1)
| Publication number | Priority date | Publication date | Assignee | Title |
|---|---|---|---|---|
| US6506563B1 (en) | 1995-12-22 | 2003-01-14 | Yale University | Multiparametric fluorescence in situ hybridization |
Non-Patent Citations (8)
| Title |
|---|
| Bass Hank W., et al., Telomeres Cluster de Novo Before The Initiation of Synapsis: A Three-dimensional Spatial Analysis of Telomere Posistions Before and During Meiotic Prophase, Journal of Cell Biology, 1997, pp. 5-18, vol. 137. |
| Chuang Tony Chin Yuan et al., The Three-dimensional Organization of Telomeres in the Nucleus of Mammalian Cells, Retrieved from the Internet,URL: http://www.biomedcentral.com/1741-7007/2/12, Jun. 2004. |
| Gonzalez-Suarez, Ignacio, et al., "Novel roles for A-type lamins in telomere biology and the DNA damage response pathway", The EMBO Journal (2009) 28, pp. 2414-2427. |
| Henderson S., et al., In Situ Analysis of Changes in Telomere Size During Replicative Aging and Cell Transformation, The Journal of Cell Biology, Jul. 1996. |
| Maierhofer Christine, et al., Multicolor Deconvolution Microscopy of Thick Biological Specimes, American Journal of Pathology, Feb. 2003. |
| Raz, Vered, et al., "Changes in lamina structure are followed by spatial reorganization of heterochromatic regions in caspase-8-activated human mesenchymal stem cells", Journal of Cell Science 119(20), Sep. 26, 2006, pp. 4247-4256. |
| Schaefer L.H., et al., Geberalized Approach for Accelerated Maximum Likelihood Based Image Restoration Applied to Three-dimensional Fluorescence Microscopy, Journal of Microscopy, Nov. 2001. |
| Weirich Claudia, et al., Three-dimensional arrangements of Centromeres and Telomeres in Nuclei of Human and Murine Lymphocytes, Chromosome Research, 2003, pp. 485-502, vol. 11. |
Cited By (10)
| Publication number | Priority date | Publication date | Assignee | Title |
|---|---|---|---|---|
| US20100068701A1 (en) * | 2008-09-12 | 2010-03-18 | Yamada N Alice | Chromosome labeling method |
| US9963745B2 (en) | 2011-12-02 | 2018-05-08 | 3D Signatures Holdings Inc. | Hematological disorder diagnosis by 3D q-FISH |
| WO2013086624A1 (en) | 2011-12-15 | 2013-06-20 | Sabine Mai | Methods for diagnosing alzheimer's disease |
| US20140024591A1 (en) * | 2012-04-24 | 2014-01-23 | Sabine Mai | Methods For Characterizing And Isolating Circulating Tumor Cell Subpopulations |
| US20190264289A1 (en) * | 2012-04-24 | 2019-08-29 | Sabine Mai | Methods for characterizing and isolating circulating tumor cell subpopulations |
| US20150167058A1 (en) * | 2013-09-20 | 2015-06-18 | Sabine Mai | Methods for Evaluating Alzheimer's Disease and Disease Severity |
| US9758830B2 (en) * | 2013-09-20 | 2017-09-12 | 3D Signatures Inc. | Methods for evaluating Alzheimer's disease and disease severity |
| US10535137B2 (en) * | 2014-01-07 | 2020-01-14 | Sony Corporation | Analysis system and analysis method |
| US20160131569A1 (en) * | 2014-09-11 | 2016-05-12 | Sabine Mai | Methods For Assessing Cancer Cells Using Granulometry |
| US9784666B2 (en) * | 2014-09-11 | 2017-10-10 | 3D Signatures Holdings Inc. | Methods for assessing cancer cells using granulometry |
Also Published As
| Publication number | Publication date |
|---|---|
| WO2004074500A3 (en) | 2004-11-04 |
| WO2004074500A2 (en) | 2004-09-02 |
| CA2515792C (en) | 2019-01-15 |
| EP1594990B8 (de) | 2016-02-24 |
| ES2567199T3 (es) | 2016-04-20 |
| CA2515792A1 (en) | 2004-09-02 |
| EP1594990A2 (de) | 2005-11-16 |
| EP1594990B1 (de) | 2015-12-02 |
| US20070031831A1 (en) | 2007-02-08 |
Similar Documents
| Publication | Publication Date | Title |
|---|---|---|
| US7801682B2 (en) | Method of monitoring genomic instability using 3D microscopy and analysis | |
| Vandesompele et al. | Genetic heterogeneity of neuroblastoma studied by comparative genomic hybridization | |
| Ko et al. | Value of 18F-FDG uptake on PET/CT and CEA level to predict epidermal growth factor receptor mutations in pulmonary adenocarcinoma | |
| Bockmühl et al. | CGH pattern of esthesioneuroblastoma and their metastases | |
| Persons et al. | Interphase cytogenetics of esophageal adenocarcinoma and precursor lesions | |
| Taslerová et al. | Arrangement of chromosome 11 and 22 territories, EWSR1 and FLI1 genes, and other genetic elements of these chromosomes in human lymphocytes and Ewing sarcoma cells | |
| Raman et al. | Cyst fluid biomarkers-diagnosis and prediction of malignancy for cystic lesions of the pancreas | |
| Chen et al. | The Paris System for reporting urinary cytology: an updated review | |
| Hieber et al. | Chromosomal rearrangements in post‐Chernobyl papillary thyroid carcinomas: Evaluation by spectral karyotyping and automated interphase FISH | |
| Walker et al. | Characterisation of molecular alterations in microdissected archival gliomas | |
| EP2066816B1 (de) | Verfahren zum nachweis und zur überwachung einer krebserkrankung mittels 3d-analyse von zentromeren | |
| Yoshimoto et al. | Comparative genomic hybridization analysis of pediatric adamantinomatous craniopharyngiomas and a review of the literature | |
| Gandhi et al. | Gene position within chromosome territories correlates with their involvement in distinct rearrangement types in thyroid cancer cells | |
| Kurihara et al. | Intraosseous intraneural perineurioma derived from the inferior alveolar nerve with an abnormality of chromosome 22 and expression of the BCR-ABL fusion gene: report of a case and review of recent literature | |
| Italiano et al. | Monosomy 7 and absence of 12q amplification in two cases of spindle cell liposarcomas | |
| Okada et al. | Comparison of numerical change of epidermal growth factor receptor gene among pre-and postradiation glioma, and gliosis, and its clinical use | |
| Feng et al. | Expression of DNA topoisomerase II-α: Clinical significance in laryngeal carcinoma | |
| WO2006017942A1 (en) | Methods of diagnosis or detection using three-dimensional analysis | |
| Seong et al. | Philadelphia chromosome-positive myeloid cells in the peripheral blood of chronic myelogenous leukemia patients: comparison with the frequency detected in cycling cells of the bone marrow. | |
| El-Naggar et al. | Limited nonrandom chromosomal aberrations in a recurrent adenoid cystic carcinoma of the parotid gland | |
| CA2775315C (en) | Methods for characterizing and isolating circulating tumor cell subpopulations | |
| Khor et al. | Chromosome 17 aberration of oral squamous cell carcinoma in Malaysia | |
| Babicz et al. | The effectiveness of high–resolution-comparative genomic hybridization in detecting the most common chromosomal abnormalities in pediatric myelodysplastic syndromes | |
| Roitman et al. | A Dedifferentiated Solitary Fibrous Tumor of Soft Tissue With Retiform and Papillary Features: Report of a Case and Review of the Literature | |
| Caliò et al. | ALK gene copy number in lung cancer: Unspecific polyploidy versus specific amplification visible as double minutes |
Legal Events
| Date | Code | Title | Description |
|---|---|---|---|
| AS | Assignment |
Owner name: CANCERCARE MANITOBA, CANADA Free format text: ASSIGNMENT OF ASSIGNORS INTEREST;ASSIGNORS:MAI, SABINE;CHUANG, TONY CHIH YUAN;GARINI, YUVAL;SIGNING DATES FROM 20070810 TO 20071107;REEL/FRAME:024822/0747 Owner name: MAI, SABINE, DR., MANITOBA Free format text: ASSIGNMENT OF ASSIGNORS INTEREST;ASSIGNOR:THE UNIVERSITY OF MANITOBA;REEL/FRAME:024822/0202 Effective date: 20061204 Owner name: CANCERCARE MANITOBA, CANADA Free format text: ASSIGNMENT OF ASSIGNORS INTEREST;ASSIGNOR:MOSHIR, SHARAREH;REEL/FRAME:024822/0342 Effective date: 20070921 Owner name: CANCERCARE MANITOBA, CANADA Free format text: ASSIGNMENT OF ASSIGNORS INTEREST;ASSIGNOR:THE UNIVERSITY OF MANITOBA;REEL/FRAME:024822/0202 Effective date: 20061204 |
|
| STCF | Information on status: patent grant |
Free format text: PATENTED CASE |
|
| CC | Certificate of correction | ||
| FPAY | Fee payment |
Year of fee payment: 4 |
|
| AS | Assignment |
Owner name: 3D SIGNATURES INC., CANADA Free format text: ASSIGNMENT OF ASSIGNORS INTEREST;ASSIGNOR:CANCERCARE MANITOBA;REEL/FRAME:036097/0524 Effective date: 20150515 |
|
| CC | Certificate of correction | ||
| AS | Assignment |
Owner name: 3D SIGNATURES HOLDINGS INC., CANADA Free format text: AMALGAMATION;ASSIGNORS:9574611 CANADA INC.;3D SIGNATURES INC.;REEL/FRAME:043696/0386 Effective date: 20160908 |
|
| MAFP | Maintenance fee payment |
Free format text: PAYMENT OF MAINTENANCE FEE, 8TH YR, SMALL ENTITY (ORIGINAL EVENT CODE: M2552) Year of fee payment: 8 |
|
| AS | Assignment |
Owner name: TELO GENOMICS HOLDINGS CORP., CANADA Free format text: CHANGE OF NAME;ASSIGNOR:3D SIGNATURES HOLDINGS INC.;REEL/FRAME:055001/0424 Effective date: 20190522 |
|
| MAFP | Maintenance fee payment |
Free format text: PAYMENT OF MAINTENANCE FEE, 12TH YR, SMALL ENTITY (ORIGINAL EVENT CODE: M2553); ENTITY STATUS OF PATENT OWNER: SMALL ENTITY Year of fee payment: 12 |