US7022998B2 - Radiation dose rate measurement - Google Patents
Radiation dose rate measurement Download PDFInfo
- Publication number
- US7022998B2 US7022998B2 US10/850,074 US85007404A US7022998B2 US 7022998 B2 US7022998 B2 US 7022998B2 US 85007404 A US85007404 A US 85007404A US 7022998 B2 US7022998 B2 US 7022998B2
- Authority
- US
- United States
- Prior art keywords
- measured
- locations
- environment
- spectrum
- dose
- Prior art date
- Legal status (The legal status is an assumption and is not a legal conclusion. Google has not performed a legal analysis and makes no representation as to the accuracy of the status listed.)
- Expired - Fee Related
Links
Images


Classifications
-
- G—PHYSICS
- G01—MEASURING; TESTING
- G01T—MEASUREMENT OF NUCLEAR OR X-RADIATION
- G01T7/00—Details of radiation-measuring instruments
-
- G—PHYSICS
- G01—MEASURING; TESTING
- G01T—MEASUREMENT OF NUCLEAR OR X-RADIATION
- G01T1/00—Measuring X-radiation, gamma radiation, corpuscular radiation, or cosmic radiation
- G01T1/16—Measuring radiation intensity
- G01T1/169—Exploration, location of contaminated surface areas
-
- G—PHYSICS
- G01—MEASURING; TESTING
- G01T—MEASUREMENT OF NUCLEAR OR X-RADIATION
- G01T1/00—Measuring X-radiation, gamma radiation, corpuscular radiation, or cosmic radiation
- G01T1/29—Measurement performed on radiation beams, e.g. position or section of the beam; Measurement of spatial distribution of radiation
Definitions
- This invention concerns improvements in and relating to monitoring, particularly the monitoring of radiation dose and dose rate.
- Radiometric measurements Three principle ways of expressing radiometric measurements exist, namely activity, count and dose.
- activity is a measure of the amount of radioactive material present within an environment. Activity is measured in Becquerels (Bq) where 1 Bq is 1 nuclear disintegration per second.
- Counts relate to the counting rate of a radiation detector, such as a scintillator, in a gamma flux.
- the count rate equates to the number of gamma photons depositing some energy in the detector in each second. By recording such information over a period of time a recorded spectrum relating to the given energy range is obtained.
- Dose relates to the interaction of gamma rays with living tissue. Dose is a measurement of the energy deposited in the tissue by gamma ray flux and is measured in Sieverts (Sv) where 1 Sv is 1 Joule per kilo. Dose relates to a specific spatial point and is derived from all gamma rays arriving at that point. Dose rate is proportional to the number and energy of the gamma photons arriving at a point in a second. Dose and dose rate measurements are of fundamental importance in the nuclear industry and in other radiological environments as they are the basis of most health and safety legislation relating to working environments and exposure.
- the present invention aims to provide an instrument which is capable of allowing dose, dose rate or an approximation thereto to be determined for an environment by scanning such an environment and without presenting a detector at that location.
- a method for determining dose rate for one or more selected locations within an environment comprising the steps of:
- the invention provides an accurate solution for the dose rate at any point of interest within the environment based on the measured count and incident energies.
- the measured count is determined using a remote controlled assembly.
- the assembly includes a gamma detector, for instance of the scintillator or semiconductor type.
- a caesium iodide scintillator offers one such device.
- the gamma detector is collimated. In this way directional sensitivity is provided.
- the collimator may be of tungsten.
- the collimator provides a plane angle of between 10 and 1 degrees.
- a series of collimators of discrete values may be provide. Suitable angles include 2, 4 and 9 degrees.
- the assembly may further include a video camera to provide visual images of the environment to the user.
- the video images may include details of the area under investigation by the collimated detector. Recordal facilities for the video images may be provided.
- the gamma detector can be moved to view different portions of the environment.
- a tilt and/or pan movement may be provided for the detector and collimator.
- the gamma detector measures a plurality of different energy ranges within the spectra under consideration.
- the regions of interest provide a continuous sequence for analysis across the spectra range of interest.
- the gamma detector analyses a location within the environment and then analyses further locations within the environment.
- the gamma detector scans from one location to the next.
- a raster style scan is preferred.
- the gamma detector analyses locations within the environment equally. Analysis may be provided by analysing locations equally spaced from one another in terms of pan angle and/or tilt angle. More equal analysis may be provided by weighting analyzed locations in an environment. Preferably more locations are sampled at or towards the equator of the detector scan than at or towards the poles of the detector scan. Preferably the number of analyzed locations in the pan direction at varying tilt angles is proportional to the cosine of the tilt angle. The number of analyzed locations in the pan direction, at a given tilt angle, may vary from a maximum at the equator to one or zero locations at the pole or poles.
- the gamma detector is fixedly directed at the location to be monitored during analysis of that location.
- a given location may overlap or at least abut an adjoining location.
- a separation between measured locations may be tolerated.
- Additional consideration of certain areas may be provided within the environment to determine whether those areas, for instance hot spots, are attributable to point source or spread area source types. The source type has a significant effect on the dose near to those locations, but such a technique may avoid over detailed scanning were it is not needed to achieve the required accuracy.
- Additional scanning of such locations may be conducted using a collimator with a reduced plane angle. Alternatively or additionally measurements may be conducted by advancing the area considered by less than the plane angle of the collimator. Over sampling in this way may provide increased spatial resolution.
- Preferably generally circular areas, or projections of a circular area are determined.
- the environment may be scanned in a series of rows and/or columns.
- the environment or portions thereof may be scanned from a series of detector locations.
- the relationship between the detector locations is preferably determined. Moving the detector from one location to another allows full inspection of an environment, for instance behind objects obscuring parts of the environment from a first position.
- the source location may be considered as a discrete point or as an area.
- the source results evaluated may be attributed to the area or to a discrete point, such as its centre, or a series of points within the area.
- the area or points to which a source is attributed may be a function of the viewing angle of the collimator relative to that area and/or the range from the collimator of that area.
- the location position is preferably determined in three dimensions.
- the location may be determined by the tilt and pan position of the gamma detector.
- the location may also be determined in terms of the locations distance from the gamma detector.
- the method may employ a range finding device to determine the location distance.
- a laser range finder may be employed.
- Preferably a position based on the combined information is employed.
- the positional information may be converted to Cartesian coordinates for further processing.
- the measured spectra is divided into a series of energy ranges.
- the ranges are continuous with one another.
- the ranges are of equivalent extent to one another.
- energy ranges of 100 keV divisions are employed.
- the count rates falling within a range are summed to give a total count for that range.
- the ranged or binned measured spectra is analyzed to determine the contributing energies.
- the analysis may comprise spectrum stripping.
- the analysis is performed on the highest energy level bin first.
- each remaining bin is then analyzed in descending energy order.
- an energy bin is analyzed by subtracting from the spectrum a value based on a response function multiplied by a variable factor to reduce the bin under analysis to zero.
- the highest remaining energy bin still contributing to the spectra after subtraction is analyzed next.
- the process is repeated to reduce the complete spectra to zero.
- each bin is considered as having the energy level of its mid point.
- the response function may be an indication of the detector response to a mono-energetic source having an energy corresponding to the mid point energy for the bin under analysis.
- the response function used in the analysis is a function of the energy value under consideration.
- the response functions are predetermined for the method.
- the response functions may be determined by modelling of the apparatus used for the method.
- the response values may be predetermined by evaluating the response of the detection method to a range of gamma ray energies.
- the response is evaluated for each energy bin employed in the analysis.
- Preferably a response every 100 keV is determined.
- a range of response in the range 50 keV to 1450 keV is determined, most preferably in 100 keV steps.
- variable factor is adjusted to equate its multiple with the response factor to the bin under analysis.
- the subtraction of the bin from the spectrum may also lead to subtraction or reduction in the remaining contribution to the spectrum in other bins.
- the analysis of the binned spectra may comprise an iterative process.
- a determination may be made based on a comparison of the response functions multiplied by variable factors with a measured spectrum.
- the fit at one set of variable factors may be compared with the fit at a different set of variable factors.
- a further set of variable factors may be considered against the measured spectrum.
- the further set of variable factor values may be determined by the relative result of a preceding set or sets of variable factors to the measured spectrum.
- the comparison may be based on a goodness of fit test, such as a chi-squared test. Comparisons may be continued with variations in the variable factor values until the difference between generated and measured spectrum is minimized or reduced below a given threshold.
- variable factor for one or more response functions may be varied between sets.
- variable factor determined for each response value gives the emitted spectrum.
- the emitted spectrum is the summation of the multiples of each response function by its variable factor.
- the analysis of the spectra may be conducted by a spreadsheet software package.
- the analysis results in one or more emission energy values and an intensity value for each emission energy value.
- the analysis results are considered as the emitted spectra.
- the process may be repeated for a plurality and more preferably all of the discrete locations.
- the data processing means may comprise specific machine code or spreadsheets or other software or hardware intended to calculate dose based on separations and spectra.
- the processing means may accommodate information relating to the spatial configuration of the environment.
- the source locations and intensities or spectra may be inputted to a computer model of the environment under analysis.
- Preferably the source locations are attributed to surfaces within the modelled environment.
- the processing means or model may determine dose and/or dose rates based on calculation of the behaviour/effect of a large number of photons from each source according to its characteristics. For dose rate, for instance, the number and type of those photons incident on the location may be considered.
- the location may be evaluated as a volume.
- the processing means or model may attribute each source spectra to a point source within the environment. Such a system may determine dose and/or dose rate based on the use of flux to dose conversion factors.
- the processing means or model provides visualisation of the environment and/or the source locations and/or the source types and/or diagnostic information on the source.
- the visualisation may be provided in three and/or two dimensions.
- the visualisation may include video images of the environment.
- the processing means or model accounts for the shape and/or relative position and/or shielding effect and/or attenuating effect and/or dissipating effect and/or first order scattering effect and/or second order scattering effect of the components of the environment.
- the dose rate at a location is preferably determined by summing the contribution of all the source locations emitted spectra determined to that point.
- the dose rate can be determined for any point within the environment based on the source information determined by the analysis and the distance of the location from each of the sources.
- the model or processing means may account for environmental effects on the emitted spectra from the various locations and contributing to that point.
- the dose rate calculated for a plurality of locations within the environment may be used to generate contour or other plots of dose rate over a part or the whole of the environment.
- the plots may be presented in 2D or 3D, for instance 2D slices through the environment.
- the environment may be any one or more of a vessel, a container, a room, a building, a stack, a location or any other volume desiring analysis.
- dose rate determining apparatus for one or more selected locations within an environment, the apparatus comprising:
- the apparatus may include means or devices for performing or embodying any of the process and method steps described elsewhere in this application.
- the apparatus may include details of apparatus set out in the first aspect of the invention.
- the processing means and calculating means may be on and the same.
- FIG. 1 illustrates a radiometric measuring array suitable for the present invention
- FIG. 2 illustrates output information from the measuring apparatus
- FIG. 3 illustrates the difference between a measured spectra and emitted spectra across a range of energy values
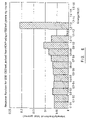
- FIG. 4 illustrates a bin spectra for Cs-137
- FIG. 5 illustrates a comparison between a measured spectrum, a generated spectrum and an iteratively modified generated spectrum
- FIG. 6 illustrates a response function for 1200–1300 keV using 1250 keV gamma ray source modelled on MCNP;
- FIG. 7 shows a complete set of response functions obtained from the MCNP model
- FIG. 8 illustrates a 2D slice through an environment indicating dose contour plots present invention
- FIG. 9 illustrates an MCNP generated, binned spectrum for Co-60
- FIG. 10 illustrates an emitted spectra calculated from the determined spectra of FIG. 8 ;
- FIG. 11 illustrates the variation of dose uptake across gamma ray energy spectra
- FIG. 12 illustrates a Cs-137 gamma spectra generated by model MCNP
- FIG. 13 illustrates a broadened spectrum produced from the spectrum of FIG. 11 ;
- FIG. 14 illustrates a binned gamma spectrum for a Cs-137 source experimentally determined
- FIG. 15 illustrates a model determined Cs-137 spectra
- FIG. 16 shows an emitted spectra obtained from processing the spectra of FIG. 13 ;
- FIG. 17 compares the dose values obtained from the present technique with a prior art instrument placed at the location of interest
- FIG. 18 provides the comparison of FIG. 16 for a total count rate against dose rate observation
- FIG. 19 shows the comparison of FIG. 16 based on a measured spectrum being taken as equivalent to the emitted spectra
- FIG. 20 illustrates a dose rate contour plot for an environment analysed according to the present invention.
- Such apparatus includes an inspection head 1 of the type illustrated schematically in FIG. 1 .
- the inspection head 1 is connected to a remote operator console, not shown.
- the head 1 is capable of pan and tilt movement controlled from the console by the operator or automatically according to a predetermined program.
- the head 1 includes a gamma detector 5 , in this case a tungsten collimated caesium iodide scintillator, a video camera 7 and a laser range finder 9 .
- the tungsten collimator containing the detector has an aperture with a plain angle width of 4°, but additional, exchangeable, collimators with widths 9° and 2° are also provided.
- the operator console includes a computer to process data, a video display unit, VDU, and video cassette recorder, VCR.
- the VDU displays the video image from the camera on the head 1 and a circle is superimposed upon this to indicate the field of view of the collimated scintillator.
- the console also receives information concerning the pan and tilt angles of the head and the range to the object in the centre of the field of view determined by the laser range finder 9 .
- the VCR is used to record the contents of the VDU screen and allows recall of the video data at a later date or the replay of previous scans through the console.
- the scanning operation of the head can be controlled manually through the console, but automatic scanning is preferred for generating the data inputs for the present invention.
- a rectilinear raster scan across the area from top left to bottom right is preferred with varying dwell time and pitch according to the operating parameters of the invention.
- the number of locations analyzed decreases for a given tilt angle, as the tilt angle increases, according to the cosine of the tilt angle to the equatorial plane.
- the instrument outputs data to an output file which includes the pan and tilt angles of the head, the range finder distance and count rates of different energy bands originating in the region of interest.
- a sample of such information is disclosed in FIG. 2 , a larger number of energy bands are likely to be monitored in practice to cover the full energy range of the spectra.
- a multichannel analyser for instance MAESTRO available from EG&G Ortec, may be used to receive the values for the various ranges.
- the monitoring apparatus thus provides a measure of the count rate and the energy deposited by each interacting photon at the detector.
- the contribution from gamma radiation along a narrow angle of incidence only is determined, contrary to the majority of prior art health physics instruments which are sensitive to radiation from all directions.
- the present invention enables count rate and energy data to be successfully used to determine a dose map, based on dose, or dose rate to be determined for a given point, without direct monitoring at that point for the first time.
- the system employs processing of the data obtained from the apparatus with a view to determining the effects of a detector and its collimator which give rise to the measured spectrum, so as to produce an emitted spectrum for each point in the environment. Additionally, the system incorporates the emitted spectra into a computer model of the environment and from this model a map of the resulting dose can be calculated or the dose rate at a given point predicted.
- the dose rate is based on the combined effect of the gamma spectrum emitted from each point in the environment on the point of interest.
- the automated scanning regime preferred for the present invention is one of rasta scanning with a series of points, which may include an area about them, being measured to cover the area.
- a trade off between the frequency of the points and the time taken for the scan is to be made. The more frequent the points are measured, and hence the lower the gap between points, then the more thoroughly the environment will be measured.
- a degree of overlap by selecting a suitably small pitch selection gives maximum accuracy as full analysis is provided. An increased measurement time arises as a result, however. In the alternative scenario too large a pitch and the resulting gaps between measurement areas, can cause inadequate measurement of the environment.
- the measured/recorded spectra can differ substantially from the emitted/incident spectra.
- the variation in the difference between the two is illustrated in FIG. 3 .
- Dose rate assessments based on assuming measured spectra equate to emitted spectra will lead to substantial dose rates underestimates which may not be tolerable. The extent of underestimation increases as the emitted gamma ray energy increases.
- the production of emitted gamma spectra from measured spectra can be based on a modified version of a technique designated, spectrum stripping.
- the basic technique considers the response functions of the instrument in question, determined either from calibration source measurements or calculation, against the spectra.
- the measured spectrum obtained in practice is unpeeled by starting with the highest energy level part of the spectra.
- a response function is derived for the said energy level of the bin function.
- the response function to this is multiplied by a variable factor and subtracted from the recorded spectrum to reduce the upper end of the spectrum to zero.
- the contribution from that energy source type is evaluated based on this variable factor compared with other variable factors for other parts of the spectra.
- the technique then progress to next lower energy anticipated which is then selected and stripped from the spectrum in a similar process. By repeating the process over and over the entire recorded spectrum is reduced to zero and accounted for in terms of a variety of energy level contributions.
- the multiplication factor by which each response function was multiplied to equate to the measured spectrum gives the relative intensity of that component.
- a generic spectrum stripping algorithm was developed. In analysing a radiation field the spectra are grouped into bins of a predetermined energy width, generally 100 keV. For a 30 keV to 2000 keV spectrum, 15 discrete energy bands are normally sufficient. Such a binned spectrum is shown in FIG. 4 for Cs-137.
- Each bin spectrum is then subjected to a spectrum stripping technique of the type described above so as to work down in energy until all of the energy bins have been stripped.
- the result of this is a series of factors corresponding to the incident gamma flux.
- each bin treats each bin as a source whose energy is the mean energy of that bin.
- the mixed field distribution occurring in practice is approximated to a number of discrete, uniformly spaced, energies of intensity corresponding to the mean, and hence known.
- the end result is that if a spectrum can be recorded and stripped in this manner for each measurement point of a scan then at any point the dose rates for dose maps can be determined.
- an emitted spectrum can be obtained from a measured spectrum based on an iterative process.
- the process relies on response functions of the type discussed above, with the emitted spectrum being considered as the summation of the response functions multiplied by variable factors.
- a calculated version of these variable factors can be determined from the measured spectrum by repeated comparison.
- the measured spectrum is binned in the manner described above and the mid point energy level response function for each bin is determined from pre-stored data.
- a comparative spectrum is generated, based on each response function 95 being multiplied by a variable factors, each variable factor being set at an initial level. As seen in FIG. 5 the sum arising 100 is compared with the corresponding measured spectrum 110 .
- variable factors can then be altered and the process repeated.
- variable for response function 105 is reduced to bring that point of the spectrum close to the measured spectrum 110 .
- a comparison such as chi-squared goodness of fit, can be made between the initial 100 and subsequent response 120 to measured 110 fit.
- the relative result is used to determine the subsequent adjustments until a threshold accuracy/fit value is crossed at which put the process is stopped.
- This modelling process required a model of the apparatus used in the method to be incorporated in software such as MONTE CARLO NEUTRONS AND PHOTONSTM (available from Los Alamos National Laboratories).
- the model determines the response of the caesium iodide scintillator to incident gamma rays of determined, varying energies across the spectra of interest.
- the response function was determined using this model for the mean value of each 100 keV energy bin across a spectrum from 50 to 1450 keV in 100 keV steps.
- the modelling solution employed a parallel beam of incident gamma rays to approximate for a point source at a typical range.
- a set of response functions for 1200–1300 keV using a 1250 keV source is shown in FIG. 6 , with a complete set of response functions obtained in this manner provided in FIG. 7 .
- the experimentally measured spectra can be converted into an accurate version of the emitted spectra.
- the overall information resulting, from either process therefore, provides data at any given measurement point as to the actual emitted spectra and the location of that spectra source, in space, within the environment, due to the range value and the tilt and pan values from the instrument head assembly.
- This information can form the input data to a processing system designed to arrive at the dose or dose rate results.
- tilt and pan data is converted to x, y, z coordinates representative of the location and to which the data relating to the various bands forming the spectra are allocated.
- Each point can be considered as a separate source whose emitted spectra is known, although it is possible to consider each set of measurements as an area with the emitted spectra of desire.
- the dose or dose rate information can be determined by a variety of modelling techniques.
- a modelling software package such as DECOM the use of which is available from British Nuclear Fuels plc can be used, for instance.
- the model provides a representation of the surface shapes within the modelled environment and also takes into account the shielding, scattering and other effects arising from their presence.
- a typical result obtained using DECOM is illustrated in FIG. 8 .
- the result is a 2D slice through the environment indicating dose for the various locations in that plane based on the environment under consideration.
- the input data supplied to DECOM above can alternatively be used in MONTE CARLO NEUTRONS AND PHOTONSTM modelling software to produce dose rate from the various source distributions.
- a similar input file providing locations and strengths of sources and a description of the environment in which they are located enables MCNP to calculate, on a photon by photon basis, the progress of photons through the model from birth to death. Once a sufficiently large number of photons have been modelled for the environment the user can select certain volumes within the modelling environment on which dose rates can be calculated.
- a third alternative dose mapping technique is offered by use of a commercially available spread sheet package, such as EXCEL from Microsoft or even specifically written code.
- EXCEL commercially available spread sheet package
- the measure sources are each point sources then the locations of those sources can readily be presented in a spread sheet.
- the use of flux to dose conversion factors can then be employed to determine the dose rate at any point; the dose at any point being the sum of the doses from each source within the environment.
- MONTE CARLO NEUTRONS AND PHOTONSTM modelling software was used to provide simulate real input results from a detector to give data for consideration.
- the model provided input data based around an incident spectrum consisting of 50% each of 1173 and 1332 keV gamma radiation, typical of cobalt 60.
- the simulation produced a spectra for a variety of gamma rays extending beyond those specific energies to simulate scattering and other effects present in real systems.
- the spectra was then binned in the manner discussed above, and is illustrated in FIG. 9 .
- This spectrum was then stripped, using the response functions previously calculated, on an EXCEL spread sheet.
- the incorporated stripping algorithms produced the emitted spectra which is illustrated in FIG. 10 .
- FIG. 11 illustrates the variation of dose uptake across the relevant gamma ray energy spectra.
- the determined dose from the created experimental scenario was calculated to be 8.35 units compared with the true dose rate, which could be calculated as the incident spectrum was known, of 8.33 units. A high degree of accuracy to within 1% is thus established.
- the lower level of accuracy with the Cs-134 measurements arise from the greater deviation between the actual emitted energies (605 and 796 keV) and the mean energies on which the modelled response functions were calculated (650 and 750 keV) than for the other isotopes considered.
- the selection of bin ranges to present mean values close to the emitted spectra values for the anticipated source types could be envisaged to minimise such errors.
- the actual accuracy of the technique can be demonstrated still further if the finite energy resolution of the scintillator used to detect the incident gamma rays is taken into account in generating the modelling input data.
- the modelling technique used to arrive at radiometric data of the gamma ray interactions is a delta function.
- spectra actually collected experimentally have peaks which are broadened by statistical effects in light collection.
- the modelled Compton edges used in the calculations are not broadened as they are in practice.
- P(E) is the value of the gaussian at energy E
- A being a normalised constant
- spectrum stripping can still be carried out using the same unbroadened response functions determined previously.
- a similar effect occurs with the Compton events which also undergo peak broadening. Once again events relocated to a higher bin are back cancelled to a large extent by those relocated to lower bins.
- the spectra illustrated in FIG. 14 obtained experimentally was then unpeeled using the stripping technique described previously to produce the emitted spectra shown in FIG. 16 .
- the unpeeling worked to a significant degree, placing 87% of the count measured in the 600–700 and 700–800 keV bins.
- the source in question produced 662 keV photons in practice, which as a result of the gaussian peak broadening previously discussed, expanded into the neighbouring energy bin also.
- MCNP was used to model the likely spectra from the Cs-137 source obtained from Amersham International (reference code X7 CS-137) and used above.
- the source in question is 3 mm long and 3 mm in diameter encapsulated essentially in steel of overall size 6 mm long and 4.5 mm in diameter.
- the calculated emitted spectra using the MCNP indicates that only 93% of all photons that penetrate the encapsulation of the model source escape with their full energy. The remainder are scattered below this 662.6 keV value.
- the results according to the technique of the present invention were compared with a standard health physicians dose probe in the following manner.
- the Cs-137 (7.8 mCi; dose rate at 2 m, 7.5 micro sv/hr), Cs-134 (0.87 mCi; dose rate at 2 m, 2.0 micro sv/hr) and Co-60 (2.6 mCi; dose rate at 2 m, 10 micro sv/hr) sources were placed 2 m from the detector in all possible combinations of the three sources.
- the traditional instrument was used to make dose measurements at the detector for the instrument of the present invention.
- Spectra were collected for 200 seconds in each of the scenarios relating to various ranges of dose rates and gamma fields. These results were analyzed to produce a value proportional to the dose rate according to the present invention. The results from the present invention are compared with those of the prior art dose meter in FIG. 17 and good linearity is seen to exist.
- the method and apparatus provided by the present invention therefore allow dose rates to be determined in mixed gamma fields on a practicable time scale with great accuracy for any location required, based on detection from a remote point.
- FIG. 20 A further example of the successful use of the present invention is illustrated in FIG. 20 and the table below.
- An instrument according to the invention was used to produce a dose map of a laboratory with two sealed sources provided in it.
- the environment contained a 10 mCi and a 7.8 mCi Cs-137 source and was scanned automatically using the instrument.
- the output file from the scan was used to produce a dose plot in the manner described above.
- FIG. 20 illustrates the dose rates calculated on a horizontal plane located 1 meter above ground level for the laboratory.
- the two sources were located at 1.5 meters above ground, the 10 mCi source at coordinates 2.75, 4 meters and the 7.8 mCi source at 0, 2.0 meters. The locations of these sources can readily be identified on FIG. 20 by reference to the areas of highest dose rate.
- the instrument provides an efficient and accurate measurement of dose rates in the environment and is applicable to a greater range of environments than the conventional dose prove can be introduced into.
Abstract
Description
-
- a) measuring incident gamma ray energy and count rate for one or more measured locations within the environment to obtain a measured spectrum for those measured locations;
- b) measuring the spatial position of the measured locations;
- c) determining an emitted spectrum for the measured locations from the measured spectrum;
- d) inputting the emitted spectrum and measured location information to data processing means; and
- e) determining the dose rate at one or more selected locations from the calculated total gamma ray energy incident on those one or more selected locations arising from the emitted spectrum of the measured locations.
-
- a) means for measuring incident gamma ray energy and count rate for one or more measured locations within the environment, the apparatus obtaining a measured spectrum for the measured locations from this information;
- b) means for measuring the spatial position of the measured locations;
- c) calculating means for determining an emitted spectrum for the measured locations based on the measured spectrum for the measured locations;
- d) processing means adapted to receive inputs corresponding to the emitted spectrum and measured location information; and
- e) calculating means for determining the dose rate at one or more selected locations from the total calculated gamma ray energy incident on those selected location arising from the emitted spectrum of the measured locations.
| Isotope | Stripped Over True Dose | ||
| Co-60 | 1.002 | ||
| Cs-137 | 0.992 | ||
| Cs-134 | 1.068 | ||
| Cs137:Co60 (10:1 ratio) | 1.001 | ||
P(E)=A exp−(E−E 0)2/2σ2
| With | Without | |||
| Isotope | Broadening | Broadening | ||
| Co-60 | 1.007 | 1.002 | ||
| Cs-137 | 1.021 | 0.992 | ||
| Cs-134 | 1.019 | 1.068 | ||
| Cs137:Co60(10: ratio) | 1.007 | 1.001 | ||
| Dose Rate | | ||||
| Source | |||||
| 10 |
200 seconds | Difference % | |||
| Co-60 | 6430 | 6320 | +1.7 | ||
| Co60 & | 10570 | 10830 | −2.4 | ||
| Cs137 | |||||
| TABLE 1 | ||
| Location | Instrument measured dose | Probe measured dose |
| 0.5, 2 m | 43.0 μSv/hr | 44.1 μSv/hr |
| 0.5, 1 m | 19.6 μSv/hr | 19.1 μSv/hr |
| 1.5, 2 m | 16.9 μSv/hr | 16.6 μSv/hr |
| 1.5, 1 m | 12.2 μSv/hr | 10.9 μSv/hr |
| 1.5, 0 m | 7.6 μSv/hr | 6.3 μSv/hr |
| 2.5, 3 m | 33.5 μSv/hr | 37.5 μSv/hr |
Claims (16)
Priority Applications (1)
| Application Number | Priority Date | Filing Date | Title |
|---|---|---|---|
| US10/850,074 US7022998B2 (en) | 1997-05-15 | 2004-05-19 | Radiation dose rate measurement |
Applications Claiming Priority (6)
| Application Number | Priority Date | Filing Date | Title |
|---|---|---|---|
| GBGB9709817.2A GB9709817D0 (en) | 1997-05-15 | 1997-05-15 | Improvements in and relating to monitoring |
| GB9709817.2 | 1997-05-15 | ||
| PCT/GB1998/001398 WO1998052071A1 (en) | 1997-05-15 | 1998-05-15 | Improvements in and relating to monitoring |
| US40321199A | 1999-12-06 | 1999-12-06 | |
| US10/263,938 US20030111612A1 (en) | 1997-05-15 | 2002-10-02 | Radiation dose rate measurement |
| US10/850,074 US7022998B2 (en) | 1997-05-15 | 2004-05-19 | Radiation dose rate measurement |
Related Parent Applications (1)
| Application Number | Title | Priority Date | Filing Date |
|---|---|---|---|
| US10/263,938 Continuation US20030111612A1 (en) | 1997-05-15 | 2002-10-02 | Radiation dose rate measurement |
Publications (2)
| Publication Number | Publication Date |
|---|---|
| US20040211912A1 US20040211912A1 (en) | 2004-10-28 |
| US7022998B2 true US7022998B2 (en) | 2006-04-04 |
Family
ID=26311535
Family Applications (2)
| Application Number | Title | Priority Date | Filing Date |
|---|---|---|---|
| US10/263,938 Abandoned US20030111612A1 (en) | 1997-05-15 | 2002-10-02 | Radiation dose rate measurement |
| US10/850,074 Expired - Fee Related US7022998B2 (en) | 1997-05-15 | 2004-05-19 | Radiation dose rate measurement |
Family Applications Before (1)
| Application Number | Title | Priority Date | Filing Date |
|---|---|---|---|
| US10/263,938 Abandoned US20030111612A1 (en) | 1997-05-15 | 2002-10-02 | Radiation dose rate measurement |
Country Status (1)
| Country | Link |
|---|---|
| US (2) | US20030111612A1 (en) |
Cited By (3)
| Publication number | Priority date | Publication date | Assignee | Title |
|---|---|---|---|---|
| US20080144046A1 (en) * | 2006-12-18 | 2008-06-19 | Young Kevin L | Hand-held survey probe |
| WO2008157716A1 (en) * | 2007-06-19 | 2008-12-24 | Thermo Fisher Scientific Inc. | Radiation measurement using multiple parameters |
| US8831177B2 (en) | 2011-05-27 | 2014-09-09 | General Electric Company | Apparatus and method for managing radiation doses and recording medium for implementing the same |
Families Citing this family (11)
| Publication number | Priority date | Publication date | Assignee | Title |
|---|---|---|---|---|
| GB0619145D0 (en) * | 2006-09-27 | 2006-11-08 | React Engineering Ltd | Improvements in radiation modelling |
| WO2009036337A2 (en) * | 2007-09-12 | 2009-03-19 | University Of Florida Research Foundation, Inc. | Method and apparatus for spectral deconvolution of detector spectra |
| FR2993674B1 (en) * | 2012-07-19 | 2014-08-22 | Irsn | METHOD FOR MEASURING THE ACTIVITY OF A PHOTON TRANSMITTING SOURCE |
| DE102013222315B4 (en) * | 2013-11-04 | 2015-06-25 | Deutsches Zentrum für Luft- und Raumfahrt e.V. | A method of providing a warning of radiopacitive space weather events at cruising altitudes |
| RU2613594C1 (en) * | 2015-12-04 | 2017-03-17 | Общество с ограниченной ответственностью "Радиационные технологии" (ООО "РадТех") | Method of dose rate measurement in mixed apparatus gamma-radiadion spectrum |
| RU2640311C1 (en) * | 2016-12-09 | 2017-12-27 | Российская Федерация, от имени которой выступает Государственная корпорация по атомной энергии "Росатом" | Method for searching and detecting sources of gamma-radiation under conditions of nonuniform radioactive contamination |
| CN108572382B (en) * | 2017-03-09 | 2022-05-20 | 中国辐射防护研究院 | Method for measuring and calculating H' (0.07) in beta-gamma mixed radiation field |
| CN111179432A (en) * | 2019-10-18 | 2020-05-19 | 北京中智核安科技有限公司 | Passive efficiency calibration method for gamma radioactivity activity measurement |
| CN112649836A (en) * | 2020-10-23 | 2021-04-13 | 中国人民解放军陆军防化学院 | Single-core air absorption dose rate measuring method for large radioactive area source |
| US11590363B2 (en) * | 2021-06-29 | 2023-02-28 | Varian Medical Systems International Ag | Assessing treatment parameters for radiation treatment planning |
| US11933935B2 (en) | 2021-11-16 | 2024-03-19 | Saudi Arabian Oil Company | Method and system for determining gamma-ray measurements using a sensitivity map and controlled sampling motion |
Citations (6)
| Publication number | Priority date | Publication date | Assignee | Title |
|---|---|---|---|---|
| US3270205A (en) * | 1963-02-13 | 1966-08-30 | Ca Atomic Energy Ltd | Digital spectrum stabilizer for pulse analysing system |
| US4187908A (en) * | 1978-09-29 | 1980-02-12 | Dresser Industries, Inc. | Method for ascertaining optimum location for well stimulation and/or perforation |
| US4827132A (en) | 1986-10-30 | 1989-05-02 | The Harshaw Chemical Company | TLD apparatus and method |
| US5204533A (en) | 1989-10-11 | 1993-04-20 | Genevieve Simonet | Device for localizing radiation sources in real time |
| EP0542561A1 (en) | 1991-11-13 | 1993-05-19 | Odetics, Inc. | Radiation mapping system |
| EP0743538A2 (en) | 1995-05-19 | 1996-11-20 | S.T.M.I. Société des Techniques en Milieu Ionisant | Device for localizing the distance of a radioactive source and to make spectrometric measurements in an observation zone |
-
2002
- 2002-10-02 US US10/263,938 patent/US20030111612A1/en not_active Abandoned
-
2004
- 2004-05-19 US US10/850,074 patent/US7022998B2/en not_active Expired - Fee Related
Patent Citations (7)
| Publication number | Priority date | Publication date | Assignee | Title |
|---|---|---|---|---|
| US3270205A (en) * | 1963-02-13 | 1966-08-30 | Ca Atomic Energy Ltd | Digital spectrum stabilizer for pulse analysing system |
| US4187908A (en) * | 1978-09-29 | 1980-02-12 | Dresser Industries, Inc. | Method for ascertaining optimum location for well stimulation and/or perforation |
| US4827132A (en) | 1986-10-30 | 1989-05-02 | The Harshaw Chemical Company | TLD apparatus and method |
| US5204533A (en) | 1989-10-11 | 1993-04-20 | Genevieve Simonet | Device for localizing radiation sources in real time |
| EP0542561A1 (en) | 1991-11-13 | 1993-05-19 | Odetics, Inc. | Radiation mapping system |
| US5286973A (en) * | 1991-11-13 | 1994-02-15 | Odetics, Inc. | Radiation mapping system |
| EP0743538A2 (en) | 1995-05-19 | 1996-11-20 | S.T.M.I. Société des Techniques en Milieu Ionisant | Device for localizing the distance of a radioactive source and to make spectrometric measurements in an observation zone |
Non-Patent Citations (3)
| Title |
|---|
| Chesnokov et al., Determination of surface activity and radiation spectrum characteristics inside buildings by a gamma locator, Apr. 14, 1997, Nuclear Instruments and Methods in Physics Research. A 401 p. 414-420. |
| Cho et al., Electronic Dose Conversion Technique Using a NaI(TI) Detector for Assessment of Exposure Dose Rate from Environmental Radiation, Jun. 1998, IEEE. Trans. Nucl. Sci. vol. 45 No. 3 p. 981-985. |
| Redus et al., An Imaging Nuclear Survey System, Jun. 1996, IEEE. Trans. Nucl. Sci. vol. 43 No. 3 p. 1827-1831. |
Cited By (6)
| Publication number | Priority date | Publication date | Assignee | Title |
|---|---|---|---|---|
| US20080144046A1 (en) * | 2006-12-18 | 2008-06-19 | Young Kevin L | Hand-held survey probe |
| US7667854B2 (en) * | 2006-12-18 | 2010-02-23 | Battelle Energy Alliance, Llc | Hand-held survey probe |
| WO2008157716A1 (en) * | 2007-06-19 | 2008-12-24 | Thermo Fisher Scientific Inc. | Radiation measurement using multiple parameters |
| US20080315110A1 (en) * | 2007-06-19 | 2008-12-25 | Michael Iwatschenko-Borho | Radiation measurement using multiple parameters |
| US7737401B2 (en) | 2007-06-19 | 2010-06-15 | Thermo Fisher Scientific Inc. | Radiation measurement using multiple parameters |
| US8831177B2 (en) | 2011-05-27 | 2014-09-09 | General Electric Company | Apparatus and method for managing radiation doses and recording medium for implementing the same |
Also Published As
| Publication number | Publication date |
|---|---|
| US20030111612A1 (en) | 2003-06-19 |
| US20040211912A1 (en) | 2004-10-28 |
Similar Documents
| Publication | Publication Date | Title |
|---|---|---|
| US7022998B2 (en) | Radiation dose rate measurement | |
| US7902519B2 (en) | Monitoring | |
| JP2014157132A (en) | Radioactivity analyser and radioactivity analytic method | |
| EP0981765B1 (en) | Improvements in and relating to monitoring | |
| US7095030B2 (en) | Investigations of radioactivity | |
| KR102394944B1 (en) | Apparatus for measuring and amending activity concentration density of radioactive material and operation calibration methode thereof | |
| US20120245858A1 (en) | Apparatuses and methods for analysis of samples through multiple thicknesses | |
| Modzelewski et al. | Dependence of photon registration efficiency on LaBr3 (Ce) detector orientation for in situ radionuclide monitoring | |
| KR102249120B1 (en) | Analysis program and analysis system for radioactive contamination in and outside the body of the subject | |
| Beaumont et al. | Imaging of fast neutrons and gamma rays from 252Cf in a heavily shielded environment | |
| Miller et al. | Combining radiography and passive measurements for radiological threat localization in cargo | |
| Pastena et al. | A novel approach to the localization and estimation of radioactivity in contaminated waste packages via imaging techniques | |
| Swift | Materials and configuration from NMIS type neutron imaging and gamma spectroscopy | |
| JP5926362B1 (en) | Radioactivity concentration measuring apparatus and radioactivity concentration measuring method | |
| Nguyen et al. | Determination of nuclear material content of items originating from damaged spent fuel assemblies by using collimated gamma-spectrometric scanning | |
| Belhaj et al. | GUI development for SSDL to calibrate photon measuring equipment | |
| Kasparek | Feasibility of Enrichment Measurements with a Pixelated CdTe HEXITEC Detector: A Comparison of Methods | |
| EP3329302B1 (en) | Method and apparatus for detecting intrinsic radioactivity of radioactive samples | |
| Montz | Uranium Holdup Mass Quantification by Hybrid Gamma Imaging | |
| Creed et al. | Radiometric characterization process for locating radioactivity hold-up and measuring non-uniformly distributed sources-15342 | |
| Nelson et al. | Validation and uncertainty quantification of detector response functions for a 1 ″× 2 ″NaI collimated detector intended for inverse radioisotope source mapping applications | |
| Martz et al. | Experimental A ampersand PCT research and development efforts to characterize mixed-waste forms | |
| CN116034292A (en) | Radionuclide analysis device, radionuclide analysis method, and radionuclide analysis program | |
| Bronson | Finding, Identifying, Localizing, and Quantifying Hidden Radioactivity Using Non-Invasive InSitu Gamma Spectroscopy | |
| JP2021103153A (en) | Radioactivity analyzer |
Legal Events
| Date | Code | Title | Description |
|---|---|---|---|
| AS | Assignment |
Owner name: BNFL (IP) LIMITED, UNITED KINGDOM Free format text: ASSIGNMENT OF ASSIGNORS INTEREST;ASSIGNOR:BRITISH NUCLEAR FUELS PLC;REEL/FRAME:019805/0889 Effective date: 20020328 Owner name: BRITISH NUCLEAR FUELS PLC, UNITED KINGDOM Free format text: ASSIGNMENT OF ASSIGNORS INTEREST;ASSIGNORS:LIGHTFOOT, JOHN ADRIAN;HUGHES, KARL ANTHONY;REEL/FRAME:019805/0881 Effective date: 19991115 |
|
| AS | Assignment |
Owner name: BIL SOLUTIONS LIMITED, UNITED KINGDOM Free format text: ASSIGNMENT OF ASSIGNORS INTEREST;ASSIGNOR:BNFL (IP) LIMITED;REEL/FRAME:020206/0539 Effective date: 20071024 |
|
| AS | Assignment |
Owner name: VT NUCLEAR SERVICES LIMITED, UNITED KINGDOM Free format text: ASSIGNMENT OF ASSIGNORS INTEREST;ASSIGNOR:BIL SOLUTIONS LIMITED;REEL/FRAME:021371/0552 Effective date: 20080709 Owner name: VT NUCLEAR SERVICES LIMITED,UNITED KINGDOM Free format text: ASSIGNMENT OF ASSIGNORS INTEREST;ASSIGNOR:BIL SOLUTIONS LIMITED;REEL/FRAME:021371/0552 Effective date: 20080709 |
|
| FEPP | Fee payment procedure |
Free format text: PAYOR NUMBER ASSIGNED (ORIGINAL EVENT CODE: ASPN); ENTITY STATUS OF PATENT OWNER: LARGE ENTITY |
|
| FPAY | Fee payment |
Year of fee payment: 4 |
|
| REMI | Maintenance fee reminder mailed | ||
| LAPS | Lapse for failure to pay maintenance fees | ||
| STCH | Information on status: patent discontinuation |
Free format text: PATENT EXPIRED DUE TO NONPAYMENT OF MAINTENANCE FEES UNDER 37 CFR 1.362 |
|
| FP | Lapsed due to failure to pay maintenance fee |
Effective date: 20140404 |