US6963667B2 - System and method for signal matching and characterization - Google Patents
System and method for signal matching and characterization Download PDFInfo
- Publication number
- US6963667B2 US6963667B2 US09/760,052 US76005201A US6963667B2 US 6963667 B2 US6963667 B2 US 6963667B2 US 76005201 A US76005201 A US 76005201A US 6963667 B2 US6963667 B2 US 6963667B2
- Authority
- US
- United States
- Prior art keywords
- candidate
- signals
- signal
- interest
- values
- Prior art date
- Legal status (The legal status is an assumption and is not a legal conclusion. Google has not performed a legal analysis and makes no representation as to the accuracy of the status listed.)
- Expired - Lifetime, expires
Links
- 238000000034 method Methods 0.000 title claims abstract description 155
- 238000012512 characterization method Methods 0.000 title description 3
- 239000011159 matrix material Substances 0.000 claims description 153
- 230000006870 function Effects 0.000 claims description 28
- 230000009466 transformation Effects 0.000 claims description 25
- 238000005070 sampling Methods 0.000 claims description 14
- 125000004122 cyclic group Chemical group 0.000 claims description 13
- 238000005259 measurement Methods 0.000 claims description 9
- 238000012545 processing Methods 0.000 claims description 7
- 238000000354 decomposition reaction Methods 0.000 claims description 4
- 230000001154 acute effect Effects 0.000 claims 12
- 230000006399 behavior Effects 0.000 claims 12
- 238000007781 pre-processing Methods 0.000 abstract description 14
- 239000013598 vector Substances 0.000 description 31
- 230000008569 process Effects 0.000 description 17
- 238000012360 testing method Methods 0.000 description 12
- 238000004458 analytical method Methods 0.000 description 10
- 238000010586 diagram Methods 0.000 description 9
- 238000013459 approach Methods 0.000 description 7
- 238000004364 calculation method Methods 0.000 description 6
- 238000013527 convolutional neural network Methods 0.000 description 6
- 238000004891 communication Methods 0.000 description 5
- 230000003750 conditioning effect Effects 0.000 description 5
- 238000001914 filtration Methods 0.000 description 4
- 238000004519 manufacturing process Methods 0.000 description 4
- 238000012986 modification Methods 0.000 description 4
- 230000004048 modification Effects 0.000 description 4
- 238000004886 process control Methods 0.000 description 4
- 238000001228 spectrum Methods 0.000 description 4
- 238000005516 engineering process Methods 0.000 description 3
- 239000000284 extract Substances 0.000 description 3
- 230000001815 facial effect Effects 0.000 description 3
- 230000008901 benefit Effects 0.000 description 2
- 230000003925 brain function Effects 0.000 description 2
- 230000001413 cellular effect Effects 0.000 description 2
- 230000004217 heart function Effects 0.000 description 2
- 238000003384 imaging method Methods 0.000 description 2
- 238000003908 quality control method Methods 0.000 description 2
- 238000003860 storage Methods 0.000 description 2
- PXFBZOLANLWPMH-UHFFFAOYSA-N 16-Epiaffinine Natural products C1C(C2=CC=CC=C2N2)=C2C(=O)CC2C(=CC)CN(C)C1C2CO PXFBZOLANLWPMH-UHFFFAOYSA-N 0.000 description 1
- 238000012935 Averaging Methods 0.000 description 1
- 238000005481 NMR spectroscopy Methods 0.000 description 1
- 238000007405 data analysis Methods 0.000 description 1
- 230000001934 delay Effects 0.000 description 1
- 238000001514 detection method Methods 0.000 description 1
- 238000011161 development Methods 0.000 description 1
- 238000002059 diagnostic imaging Methods 0.000 description 1
- 230000000694 effects Effects 0.000 description 1
- 238000000802 evaporation-induced self-assembly Methods 0.000 description 1
- 230000007717 exclusion Effects 0.000 description 1
- 238000002474 experimental method Methods 0.000 description 1
- 238000013213 extrapolation Methods 0.000 description 1
- 230000004438 eyesight Effects 0.000 description 1
- 238000009434 installation Methods 0.000 description 1
- 230000007246 mechanism Effects 0.000 description 1
- 238000002620 method output Methods 0.000 description 1
- 238000010295 mobile communication Methods 0.000 description 1
- 230000003287 optical effect Effects 0.000 description 1
- 238000005457 optimization Methods 0.000 description 1
- 238000002600 positron emission tomography Methods 0.000 description 1
- 238000000513 principal component analysis Methods 0.000 description 1
- 230000008054 signal transmission Effects 0.000 description 1
- 230000003595 spectral effect Effects 0.000 description 1
- 238000000844 transformation Methods 0.000 description 1
- 238000002604 ultrasonography Methods 0.000 description 1
- 230000000007 visual effect Effects 0.000 description 1
- 238000011179 visual inspection Methods 0.000 description 1
Images

Classifications
-
- G—PHYSICS
- G06—COMPUTING; CALCULATING OR COUNTING
- G06F—ELECTRIC DIGITAL DATA PROCESSING
- G06F17/00—Digital computing or data processing equipment or methods, specially adapted for specific functions
- G06F17/10—Complex mathematical operations
- G06F17/15—Correlation function computation including computation of convolution operations
-
- G—PHYSICS
- G06—COMPUTING; CALCULATING OR COUNTING
- G06V—IMAGE OR VIDEO RECOGNITION OR UNDERSTANDING
- G06V10/00—Arrangements for image or video recognition or understanding
- G06V10/40—Extraction of image or video features
- G06V10/42—Global feature extraction by analysis of the whole pattern, e.g. using frequency domain transformations or autocorrelation
- G06V10/431—Frequency domain transformation; Autocorrelation
-
- G—PHYSICS
- G06—COMPUTING; CALCULATING OR COUNTING
- G06V—IMAGE OR VIDEO RECOGNITION OR UNDERSTANDING
- G06V10/00—Arrangements for image or video recognition or understanding
- G06V10/70—Arrangements for image or video recognition or understanding using pattern recognition or machine learning
- G06V10/74—Image or video pattern matching; Proximity measures in feature spaces
- G06V10/75—Organisation of the matching processes, e.g. simultaneous or sequential comparisons of image or video features; Coarse-fine approaches, e.g. multi-scale approaches; using context analysis; Selection of dictionaries
- G06V10/751—Comparing pixel values or logical combinations thereof, or feature values having positional relevance, e.g. template matching
- G06V10/7515—Shifting the patterns to accommodate for positional errors
-
- G—PHYSICS
- G06—COMPUTING; CALCULATING OR COUNTING
- G06F—ELECTRIC DIGITAL DATA PROCESSING
- G06F2218/00—Aspects of pattern recognition specially adapted for signal processing
Definitions
- the present invention relates to the field of signal processing, and more particularly to pattern matching and signal characterization.
- a great variety of systems may be characterized by the property that they receive a signal and attempt to match the received signal to one of a series of candidate or template signals.
- Such signal or pattern matching is common in diverse fields such as telecommunications, wireless telecommunications, radar, machine vision and control, system automation, manufacturing, quality control, acoustics, optics, measurement, filtering, data analysis, and others.
- Signal types may include 1-dimensional (1-D) signals, 2-D signals, such as images, as well as 3-D and higher dimensional data sets or signals. Signals may also be either analog or digital signals.
- the signal matching task may be greatly aided by the use of transforms, such as the well known Fourier Transform.
- the Fourier Transform may be used to recast the signal data into the frequency domain, which can make certain characteristics or underlying structure more apparent, and thus easier to characterize.
- the signal is usually a time-varying voltage or current.
- Fourier theory teaches that such signals may be represented as a superposition of sinusoidal signals of various frequencies and phase values.
- the Fourier Transform in essence, decomposes or separates a signal waveform or function into sinusoids of different frequency, amplitude, and/or phase, which sum to the original waveform, i.e., the Fourier transform identifies or determines the different frequency sinusoids and their respective amplitudes that can be combined to represent the original signal. Understanding this aspect of a signal is important in determining how the signal will behave, e.g., when it passes through filters, amplifiers and communication channels.
- Fourier analysis provides a means to determine the frequency spectrum of a given signal, i.e., to determine the frequency content of a signal. Even discrete digital communications which use 0's or 1's to send information still have frequency content.
- the Fourier Transform may be used to move the signal data from the time domain to the frequency domain where the spectral content of the signal may be easily analyzed or compared to other transformed signals.
- the candidate signals are shifted and noise-perturbed versions of each other.
- a signal generally comprises a series of values, and thus may be thought of as a vector.
- the candidate signals may comprise an initial signal or vector, and a sequence of signals or vectors which are each phase shifted some amount from its predecessor.
- FIGS. 1A and 1B One example of this process is shown in FIGS. 1A and 1B and described as follows.
- FIGS. 1 A and B Synignal Matching (Prior Art)
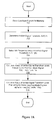
- FIGS. 1A and 1B illustrate a prior art method of determining a “best fit” or “closest match” between an input signal of interest and a set of N candidate signals f, wherein the candidate signals are shifted versions of each other.
- the signals will exhibit properties whereby Fourier techniques may be used in making the determination.
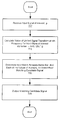
- FIG. 1A illustrates a preprocessing technique that may be used to preprocess the set f of candidate signals prior to receipt of the signal of interest. This preprocessing performed in FIG. 1A enables a faster and hence more “real time” determination of the closest candidate signal in the set of candidate signals f when the input signal is received as shown in FIG. 1 B.
- the set of candidate signals f may be stored in a memory.
- the set of candidate signals f comprises an initial signal f 0 and shifted versions of the signal f 0 , referred to as f 1 , f 2 , . . . f N ⁇ 1 .
- the method may include selecting a frequency, e.g., the k th frequency, that is present in each of these candidate signals.
- Step 104 may also be stated as selecting the k th row of a matrix W N wherein the matrix W N comprises the standard Fourier matrix.
- step 108 the method computes and stores the values of the Fourier transform at the k th frequency for each of the shifted versions of the first signal f 0 .
- the values of the Fourier transform at the k th frequency may be referred to as ⁇ (n), or alpha(n).
- This expression uses the shift invariant property of the Fourier transform to substantially reduce the number of calculations required, i.e., the fact that in the frequency domain the candidate signals are shifted versions of the first signal f 0 allows the Fourier transforms of the remainder of the candidate signals to be computed easily from the Fourier transform of the first candidate signal.
- the values of the transformation at the k th generalized frequency for the remaining set of N candidate signals may be computed by applying the Fourier transform at the k th generalized frequency to each of remaining candidate signals, as was applied to the first candidate frequency to each of remaining candidate signals, as was applied to the first candidate signal in 106 .
- FIG. 1A illustrates the preprocessing performed in FIG. 1A to determine the closest match of the set of candidate signals with the input signal g.
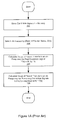
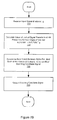
- FIG. 1B illustrates the method performed when an input signal of interest g is received to determine the closest match of the set of candidate signals with the input signal g.
- the input signal of interest g is received in step 122 .
- the method calculates the Fourier transform, e.g., using an FFT of g at the k th frequency.
- the value of the Fourier transform of g at the k th frequency may be referred to as alpha bar.
- W N (k) refers to the k th row vector of the matrix W N .
- step 126 the method determines the best match between ⁇ overscore ( ⁇ ) ⁇ and the ⁇ (n) values corresponding to each of the candidate signals. This operates to determine the closest candidate signal to the input signal of interest g. In step 128 this closest candidate signal may then be output as a final result.
- the method described in FIGS. 1A and 1B may be used when the set of candidate signals are shifted versions of each other, wherein this characteristic allows the use of Fourier transform techniques to greatly simplify and speed up the analysis.
- the method described in FIGS. 1A and 1B cannot be used.
- the problem of attempting to match a received input signal of interest with one of a set of candidate or template signals, wherein two or more of the signals comprised in the set of candidate or template signals are uncorrelated with each other arises in many diverse fields. Further, there are no fast techniques available which can be used to determine a closest match between an input signal of interest and a set of uncorrelated signals.
- the present invention comprises various embodiments of a system and method for determining or selecting a best match of a received input signal from a set of candidate signals, wherein two or more of the candidate signals are uncorrelated.
- the method may comprise a preprocessing phase and a runtime phase for enhanced performance.
- a unified signal transform may be determined from the set of candidate signals.
- the unified signal transform may be operable to convert each of the set of candidate signals to a generalized frequency domain, i.e., the unified signal transform may be operable to convert each of the set of candidate signals into a representation of generalized basis functions, wherein the basis functions represent the algebraic structure of the set of candidate signals.
- the unified signal transform may be operable to decompose the signal into generalized basis functions, wherein the basis functions represent the algebraic structure of the set of candidate signals.
- the unified signal transform may be considered a type of “generalized Fourier or Frequency Transform” that is designed specifically for the set of uncorrelated candidate signals.
- calculating the unified signal transform for the set of candidate signals may include:
- each of the candidate signals comprises a corresponding column of the matrix B;
- matrix X B ⁇ 1 may be calculate by any of a variety of methods well known in the art.
- the transform may be applied for one or more generalized frequencies to each of the candidate signals in the set to calculate corresponding generalized frequency component values for each of the candidate signals.
- the input signal of interest may be received.
- the unified signal transform may then be applied for the one or more generalized frequencies to the input signal of interest to calculate corresponding generalized frequency component values for the input signal of interest.
- the best match may then be determined between the one or more generalized frequency component values of the input signal of interest and the one or more generalized frequency component values of each of the candidate signals.
- information indicating a best match candidate signal from the set of candidate signals may be output.
- the set of candidate signals may comprise a number of candidate signals, wherein each of the candidate signals comprises a number of values, and wherein the number of values is equal to the number of candidate signals.
- the matrix B formed from the candidate signals may comprise a square matrix. In another embodiment, the matrix B may be regular.
- the initial set of N candidate signals may be manipulated.
- at least one of the candidate signals may comprise a set of M values, wherein M is not equal to N.
- the candidate signal data may be “padded” or extended to provide a square matrix B.
- additional N ⁇ M values may be provided for the “short” candidate signal, thereby ensuring that each one of the set of candidate signals comprises N values.
- providing additional N ⁇ M values may comprise interpolating or extrapolating two or more of the M values to generate the additional N ⁇ M values.
- a curve may be fit to the M values for the “short” candidate signal, then sampled to generate N values for the candidate signal, thereby ensuring that each one of the set of candidate signals comprises N values.
- the number of initial candidate signals may be less than the number of values in each candidate signal.
- additional candidate signals (of N values each) may be provided to ensure a square matrix B.
- the additional candidate signals may be chosen or generated arbitrarily.
- the best match candidate signal may be processed to determine if the best match candidate is an acceptable match.
- the best match candidate signal may be processed to determine characteristics of the received input signal of interest.
- the determined best match candidate signal may comprise a (substantially) noise-free version of the input signal of interest, and thus may be more suitable for determining characteristics of the input signal.
- the input signal of interest and the candidate signals may be 1-dimensional signals, 2-dimensional signals, 3-dimensional signals, or signals of a dimensionality greater than 3.
- the input signal of interest and the candidate signals may comprise one or more of image data, measurement data, acoustic data, seismic data, financial data, stock data, futures data, business data, scientific data, medical data, insurance data, musical data, biometric data, and telecommunications signals. It should be noted that these examples are meant to be illustrative only, and are not intended to limit the domain of application of the method.
- FIGS. 1A and 1B are flowcharts of a method for signal matching, according to the prior art
- FIG. 2 illustrates a computer system which may perform a method according to one embodiment of the present invention
- FIGS. 3A and 3B illustrate representative instrumentation and process control systems which may perform a method according to one embodiment of the present invention
- FIG. 4A is a diagram of a telecommunications system, according to one embodiment
- FIG. 4B is a diagram of a wireless telecommunications system, according to one embodiment
- FIG. 5 illustrates a machine vision system, according to one embodiment
- FIG. 6 is a block diagram of a computer system according to one embodiment of the invention.
- FIG. 7A is a flowchart diagram illustrating a preprocessing step performed on the set of candidate signals according to one embodiment of the invention.
- FIG. 7B is a flowchart diagram illustrating a method for determining a closest match between an input signal of interest and one of the set of candidate signals according to one embodiment of the invention
- FIG. 8 is a flowchart illustrating a method for calculating the unified signal transform, according to one embodiment
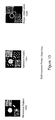
- FIG. 9A is an example test image for an industrial pattern matching application, according to one embodiment.
- FIG. 9B is an example template image for an industrial pattern matching application, according to one embodiment.
- FIG. 9C illustrates a classic correlation method for an industrial pattern matching application, according to one embodiment
- FIG. 10 illustrates shift invariant pattern matching for an industrial pattern matching application, according to one embodiment
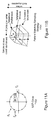
- FIG. 11A illustrates a unified signal transform unit circle in the complex plane, according to one embodiment
- FIG. 11B illustrates a pattern matching sampling strategy, according to one embodiment.
- FIG. 2 Computer System
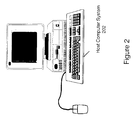
- FIG. 2 illustrates an exemplary computer system according to one embodiment of the invention.
- the computer system 202 may store and/or execute a software program which performs the method described in FIGS. 7A , 7 B, and 8 below.
- the computer system 202 may include a display device, such as a monitor, as well as a chassis and one or more I/O devices, such as a keyboard and/or mouse.
- the computer system may take any of various forms, such as a personal computer, or any type of device which includes a processor that executes instructions from a memory medium, or which includes programmable logic that has been configured to perform the methods described in FIGS. 7A , 7 B, and 8 .
- Exemplary computer systems include a personal computer, mainframe computer, a personal computing device (PDA), television, embedded device, and other systems.
- PDA personal computing device
- the term computer system is intended to encompass any of various devices which include a processor that can execute instructions from a memory medium and/or may include a programmable logic device that can be configured to execute a method or algorithm, such as that described in FIGS. 7A and 7B , and 8 .
- the method of the present invention may be implemented in any of various types of devices and any of various types of applications.
- Example applications where the method described herein may be used include instrumentation systems, industrial automation or process control systems, telecommunication systems, machine vision systems and any other application where it is desirable to determine a best match or closest fit between an input signal of interest and a set of candidate signals, wherein two or more of the candidate signals may be uncorrelated with respect to each other.
- matched filter detection logic in a telecommunication system, as well as analysis and/or pattern matching related to image data, measurement data, acoustic data, seismic data, financial data, stock data, futures data, business data, scientific data, medical data, insurance data, musical data, biometric data, and telecommunications signals, among others.
- FIGS. 3A , 3 B, 4 A, 4 B and 5 illustrate various exemplary applications where the invention may be used. However, it is noted that the invention is not limited to these applications, but rather may be used in any of various applications.
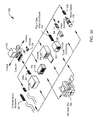
- FIGS. 3 A and 3 B Instrumentation and Industrial Automation Systems
- FIGS. 3A and 3B illustrate exemplary measurement and automation systems that may include or execute software programs according to one embodiment of the present invention. These programs may of course be stored in or used by other types of systems as desired.
- FIG. 3A illustrates an exemplary instrumentation control system 300 .
- the system 300 may comprise a host computer 202 which connects to one or more devices or instruments.
- the host computer 202 may comprise a CPU, a display, memory, and one or more input devices such as a mouse or keyboard, as shown.
- the host computer 202 connects through the one or more instruments to analyze, measure, or control a unit under test (UUT) or process 350 .
- UUT unit under test
- the one or more instruments may include a GPIB instrument 312 and associated GPIB interface card 322 , a data acquisition board 314 and associated signal conditioning circuitry 324 , a VXI instrument 316 , a PXI instrument 318 , a video device 332 and associated image acquisition card 334 , a motion control device 336 and associated motion control interface card 338 , and/or one or more computer based instrument cards 342 , among other types of devices.
- the GPIB instrument 312 may be coupled to the computer 202 via the GPIB interface card 322 provided by the computer 202 .
- the video device 332 may be coupled to the computer 202 via the image acquisition card 334
- the motion control device 336 may be coupled to the computer 202 through the motion control interface card 338 .
- the data acquisition board 314 may be coupled to the computer 202 , and may interface through signal conditioning circuitry 324 to the UUT.
- the signal conditioning circuitry 324 may comprise an SCXI (Signal Conditioning eXtensions for Instrumentation) chassis comprising one or more SCXI modules 326 .
- the GPIB card 322 , the image acquisition card 334 , the motion control interface card 338 , and the DAQ card 314 are typically plugged in to an I/O slot in the computer 202 , such as a PCI bus slot, a PC Card slot, or an ISA, EISA or MicroChannel bus slot provided by the computer 202 .
- I/O slot such as a PCI bus slot, a PC Card slot, or an ISA, EISA or MicroChannel bus slot provided by the computer 202 .
- these cards 322 , 334 , 338 and 314 are shown external to computer 202 for illustrative purposes.
- the VXI chassis or instrument 316 may be coupled to the computer 202 via a VXI bus, MXI bus, or other serial or parallel bus provided by the computer 202 .
- the computer 202 preferably includes VXI interface logic, such as a VXI, MXI or GPIB interface card (not shown), which interfaces to the VXI chassis 316 .
- VXI interface logic such as a VXI, MXI or GPIB interface card (not shown), which interfaces to the VXI chassis 316 .
- the PXI chassis or instrument may be coupled to the computer 202 through the computer's PCI bus.
- a serial instrument may also be coupled to the computer 202 through a serial port, such as an RS-232 port, USB (Universal Serial bus) or IEEE 1394 or 1394.2 bus, provided by the computer 202 .
- a serial port such as an RS-232 port, USB (Universal Serial bus) or IEEE 1394 or 1394.2 bus, provided by the computer 202 .
- USB Universal Serial bus
- IEEE 1394 or 1394.2 bus provided by the computer 202 .
- the instruments are coupled to the unit under test (UUT) or process 350 , or are coupled to receive field signals, typically generated by transducers.
- the system 300 may be used in a data acquisition and control application, in a test and measurement application, a process control application, or a man-machine interface application.
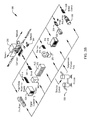
- FIG. 3B illustrates an exemplary industrial automation system 360 .
- the industrial automation system 360 is similar to the instrumentation or test and measurement system 300 shown in FIG. 3 A. Elements which are similar or identical to elements in FIG. 3A have the same reference numerals for convenience.
- the system 360 comprises a computer 202 which connects to one or more devices or instruments.
- the computer 202 comprises a CPU, a display screen, memory, and one or more input devices such as a mouse or keyboard as shown.
- the computer 202 may connect through the one or more devices to a process or device 350 to perform an automation function, such as MMI (Man Machine Interface), SCADA (Supervisory Control and Data Acquisition), portable or distributed data acquisition, process control, advanced analysis, or other control.
- MMI Man Machine Interface
- SCADA Supervisory Control and Data Acquisition
- the one or more devices may include a data acquisition board 314 and associated signal conditioning circuitry 324 , a PXI instrument 318 , a video device 332 and associated image acquisition card 334 , a motion control device 336 and associated motion control interface card 338 , a fieldbus device 370 and associated fieldbus interface card 372 , a PLC (Programmable Logic Controller) 376 , a serial instrument 382 and associated serial interface card 384 , or a distributed data acquisition system, such as the Fieldpoint system available from National Instruments, among other types of devices.
- a data acquisition board 314 and associated signal conditioning circuitry 324 a PXI instrument 318 , a video device 332 and associated image acquisition card 334 , a motion control device 336 and associated motion control interface card 338 , a fieldbus device 370 and associated fieldbus interface card 372 , a PLC (Programmable Logic Controller) 376 , a serial instrument 382 and associated serial interface card 384 , or a distributed data acquisition system
- the DAQ card 314 , the PXI chassis 318 , the video device 332 , and the image acquisition card 336 are preferably connected to the computer 202 as described above.
- the serial instrument 382 is coupled to the computer 202 through a serial interface card 384 , or through a serial port, such as an RS-232 port, provided by the computer 202 .
- the PLC 376 couples to the computer 202 through a serial port, Ethernet port, or a proprietary interface.
- the fieldbus interface card 372 is preferably comprised in the computer 202 and interfaces through a fieldbus network to one or more fieldbus devices.
- Each of the DAQ card 314 , the serial card 384 , the fieldbus card 372 , the image acquisition card 334 , and the motion control card 338 are typically plugged in to an I/O slot in the computer 202 as described above. However, these cards 314 , 384 , 372 , 334 , and 338 are shown external to computer 202 for illustrative purposes. In typical industrial automation systems a device will not be present of each interface type, and in fact many systems may only have one or more devices of a single interface type, such as only PLCs. The devices are coupled to the device or process 350 .
- the host computer 202 shown in FIGS. 3A and 3B may execute a software program which performs the method described in FIGS. 7A , 7 B, and 8 .
- the host computer 202 may preprocess a set of candidate signals as shown in FIG. 7 A.
- the host computer 202 may also receive an input signal of interest that is measured or acquired by one of the instruments of devices shown in FIGS. 3A and 3B and perform the method shown in FIG. 7B to determine a “best fit” or “closest match” between the input signal of interest and a candidate signal from a set of candidate signals S.
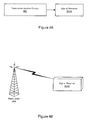
- FIGS. 4 A and 4 B Telecommunications Systems
- FIGS. 4A and 4B illustrate wired and wireless telecommunications systems, respectively, which are exemplary examples of applications for the methods described in FIGS. 7A and 7B .
- a telecommunication device 402 may be coupled to a signal receiver 404 A.
- the telecommunication device 402 may be operable to transmit signals or data to the signal receiver 404 A which may be operable to receive the transmitted signals or data.
- the signal receiver 404 A may include various filters to characterize and/or select a waveform of interest from a received signal.
- a filter is a device that selectively sorts signals and passes through a desired range of signals while suppressing the others. This kind of filter may be used to suppress noise or to separate signals into bandwidth channels.
- the received signal may have a high noise content which may obscure the waveform or signal of interest, and so a pattern selection process may be applied to extract or recognize the desired waveform or signal from the received signal.
- the received signal may comprise any one of a plurality of waveforms from which a desired waveform is to be characterized and selected.
- the present method may be applied to find a best match between the received signal and a set of candidate signals.
- the presence of noise in the received signal must be dealt with.
- a Caller ID process in a telephony device extracts identification information from the incoming signal to determine the origin of the telephone call. This information may be in the form of a digital signal and may contain noise as well. The Caller ID process must therefore perform signal matching to characterize the identification signal as a recognizable waveform.
- FIG. 4B illustrates a wireless telecommunication system, according to one embodiment.
- a radio tower 406 may be operable to broadcast signals in a wireless manner to a wireless receiver 404 B.
- the wireless receiver 404 B may be operable to receive the signals and select out a waveform or signal of interest from the received signals.
- transmitted signals include noise which must be filtered out to make the signals usable. This is especially true with wireless communications because any number of signals may be present simultaneously in the same medium (the airways), including noise from sources as diverse as electrical equipment and solar winds. Thus, filtering is central to the operations of cellular telephony or any other wireless telecommunications systems.
- Systems for cellular telephony include TDMA (Time Division Multiple Access) used by GSM (Global System for Mobile Communications), CDMA (Code Division Multiple Access), and FDMA (Frequency Division Multiple Access), each of which provides a way to multiplex wireless communications to increase the effective bandwidth of the limited wireless spectrum.
- TDMA Time Division Multiple Access
- GSM Global System for Mobile Communications
- CDMA Code Division Multiple Access
- FDMA Frequency Division Multiple Access
- One embodiment of the invention may involve receiving an input CDMA signal of interest g and determining a best match for g among a set of candidate signals or codes in the CDMA system.
- FIG. 5 A Machine Vision System
- FIG. 5 illustrates one embodiment of a machine vision system.
- the machine vision system comprises a host computer 202 and a video source 512 .
- the video source 512 produces an analog or digital video signal which comprises a sequence of video frames, or other data desired to be acquired.
- the analog or digital video signal is provided to the host computer 202 for storage and/or processing.
- a common task is to recognize the presence or absence of particular forms or objects, also called Blobs (Binary Large Objects) in a video frame.
- Blobs Binary Large Objects
- a machine vision system may be deployed in a manufacturing plant to inspect circuit boards for quality control. The system may specifically look for proper placement and orientation of components, such as computer chips.
- This task requires pattern matching in that the system must process image information, looking for an object or Blob which matches one of a set of candidate forms.
- these objects may constitute 2D signals.
- 2D image information may be processed to generate characteristic 1D signals which may be matched with candidate 1D signals.
- a horizontal scan or sampling of a 2D image may be used to generate characteristic feature points, such as at the edges of objects.
- image information may be sampled in a certain region of the object. The resulting pixel information may be interpreted as a 1D signal, and used to characterize the 2D image. It is noted that the present method is not limited to 1D or 2D signals, but may be applied to signals or data sets of any dimensionality.
- Machine vision systems such as described above are often required to process the image data in or near real-time, which places severe constraints on the performance of pattern matching methods.
- Various embodiments of the present method, described below, provide an extremely fast and efficient way of determining a “best match” of a received signal from or among a set of candidate signals.
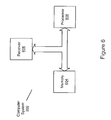
- FIG. 6 Computer System Block Diagram
- FIG. 6 is an exemplary embodiment, including a processor 608 which is operable to execute program instructions, a memory medium 604 which is operable to store program instructions and data, and a receiver 606 which is operable to receive signals or data from an external source.
- FIG. 6 is an exemplary block diagram of the computer system illustrated in FIG. 2 , such as may be used in any of the systems shown in FIGS. 3-5 . It is noted that any type of computer system configuration or architecture can be used in conjunction with the system and method described herein, as desired, and that FIG. 6 illustrates a representative PC embodiment. It is also noted that the computer system may be a general purpose computer system such as illustrated in FIGS.
- the computer 202 may have various other components, such as one or more buses, a power supply, I/O devices, chipset logic, or other components as is conventional in various types of computer systems.
- the computer system 202 preferably includes a memory medium on which software according to an embodiment of the present invention may be stored.
- the memory medium may store a set of candidate signals S, wherein two or more of the candidate signals may be partially or completely uncorrelated with respect to each other. In one embodiment, a majority or all of the signals in the set of candidate signals S are uncorrelated with respect to each other.
- the memory medium may also store a software program for preprocessing the set of candidate signals S as described below with reference to FIG. 7 A.
- the memory medium may further store a software program for analyzing an input signal of interest to determine a best match between the input signal of interest and one of the set of candidate signals S.
- memory medium is intended to include an installation medium, e.g., a CD-ROM, floppy disks, or tape device; a computer system memory or random access memory (RAM) such as DRAM, SRAM, EDO RAM, RRAM, etc.; or a non-volatile memory such as a magnetic media, e.g., a hard drive, or optical storage.
- the memory medium may comprise other types of memory as well, or combinations thereof.
- the memory medium may be located in a first computer in which the software program is stored or executed, or may be located in a second different computer which connects to the first computer over a network, such as the Internet. In the latter instance, the second computer provides the program instructions to the first computer for execution.
- the computer system 202 may take various forms, including a personal computer system, mainframe computer system, workstation, network appliance, Internet appliance, personal digital assistant (PDA), television set-top box, or other device.
- PDA personal digital assistant
- the term “computer system” can be broadly defined to encompass any device having at least one processor which executes instructions from a memory medium, or any device which includes programmable logic that is configurable to perform a method or algorithm.
- Various embodiments further include receiving or storing instructions and/or data implemented in accordance with the foregoing description upon a carrier medium.
- Suitable carrier media include a memory medium as described above, as well as signals such as electrical, electromagnetic, or digital signals, conveyed via a communication medium such as networks and/or a wireless link.
- the software programs as described herein may be designed for use in measurement systems, including systems which perform data acquisition/generation, analysis, and/or display, or for use in automation systems.
- the software programs may be designed for use in a telecommunications systems.
- the software programs may be designed for use in business, financial, scientific, biometric, or medical analysis, among others.
- the present invention can be used for a plethora of applications and is not limited to the applications shown herein.
- the applications described herein are exemplary only, and the methods described herein may be used for any of various purposes and may be stored in and execute on any of various types of systems to perform any of various applications.
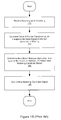
- FIGS. 7A and 7B illustrate one embodiment of a method for determining a “closest match” or “best match” between an input signal of interest and one of a set of candidate signals. Stated another way, FIGS. 7A and 7B illustrate one embodiment of a method for determining a “best match” or “closest match” of an input signal of interest from a set of candidate signals. It should be noted that two or more of the candidate signals are uncorrelated, i.e., are not shifted versions of one another. In one embodiment, all of the candidate signals are uncorrelated with each other.
- FIG. 7 A Preprocessing the Set of Candidate Signals
- FIG. 7A is a flowchart diagram illustrating one embodiment of a method for preprocessing a set of N candidate signals, which may also be referred to as vectors.
- the set of N candidate signals may be partially or completely uncorrelated.
- the term “uncorrelated” is intended to include the case where two or more of the signals in the set of N candidate signals are uncorrelated. In a typical scenario, a majority or all of the signals in the set of candidate signals may be uncorrelated.
- the set of N candidate signals may be stored in a memory medium.
- the set of N candidate signals may be stored in a memory medium comprised on the computer 202 which performs the method of FIG. 7B or the set of candidate signals may be stored in a different computer system.
- the preprocessing method described in FIG. 7A may be performed by the same computer system which implements the method of FIG. 7B , or may be performed in a different computer system as desired.
- each of the N candidate signals is comprised of N values, i.e., the number of values in each candidate signal is equal to the number of candidate signals.
- a signal transform referred to herein as the “unified signal transform” may be determined for the set of N candidate signals.
- the unified signal transform may include a set of basis functions which describe an algebraic structure of the set of candidate signals.
- the unified signal transform determined in step 704 comprises a completely new type of signal transform heretofore unknown in the prior art.
- This new transform which is referred to herein as a unified signal transform, converts a signal into a representation of, or comprising, generalized basis functions, wherein the basis functions represent the algebraic structure of the set of candidate signals. Stated another way, the signal transform is operable to decompose the signal into a form represented by generalized basis functions.
- the basis functions represent the algebraic structure of the set of signals.
- the unified signal transform may be used to convert a signal into a domain referred to as the “generalized frequency domain”.
- the unified signal transform described herein is the first and only signal transform able to project a set of uncorrelated signals into a generalize frequency domain.
- the unified signal transform described herein may be considered a superset or generalization of a plurality of existing transforms, including the Fourier transform and the Haar transform.
- the Fourier transform may decompose a signal into frequency components of a set of sinusoidal waveforms
- the unified signal transform described herein decomposes a signal into components of a set of generalized basis functions, also referred to as generalized frequency components.
- the generalized basis functions reduce to the sinusoidal waveforms used in Fourier analysis, i.e., the unified signal transform reduces to the standard Fourier transform.
- the generalized basis functions may reduce to the Haar, Walsh, or Hadamar transform basis functions, among others.
- the transform that is determined in step 704 may be considered a more generalized or unifying signal transform for the set of N signals.
- the operation of determining the unified signal transform for the set of N signals is described in greater detail in the flowchart of FIG. 8 .
- the final result of the unified signal transform is a transform that may be represented as X B ⁇ 1 (k).
- step 706 the method selects the k th row of X B ⁇ 1 (k). This operates to select the k th “generalized frequency” of the transform, which may be applied to a signal to calculate the k th generalized frequency component of that signal.
- step 710 the method computes and stores values of the transformation at the k th generalized frequency for the remaining N ⁇ 1 candidate signals.
- This expression uses the shift invariant property of the transform to substantially reduce the number of calculations required.
- the values of the transformation at the k th generalized frequency for the remaining N ⁇ 1 candidate signals may be computed by applying the unified transform at the k th generalized frequency to each of remaining candidate signals, as was applied to the first candidate signal in 708 .
- one or more values of the signal transform applied to each of the candidate signals may be calculated at at least one generalized frequency, k.
- the signal transform may be applied to each of the set of candidate signals at more than one generalized frequency to produce a plurality of transformation values for each candidate signal.
- the method has computed and stored the values of the unified signal transformation for at least one generalized frequency (e.g., the k th generalized frequency) for each of the signals in the set of candidate signals. Therefore, in summary, the method may calculate one or more values of the unified signal transform (“the transformation”) for each of the set of candidate signals at at least one generalized frequency, wherein, for each respective one of the set of candidate signals, the transformation comprises the signal transform applied to a respective one of the set of candidate signals.
- transformation refers to the values which result from the application of the transform (the unified signal transform) to a signal.
- the unified signal transform for at least one generalized frequency may be applied to each of the set of candidate signals to calculate a corresponding at least one generalized frequency component value for each of the set of candidate signals.
- the preprocessing method shown in FIG. 7A may compute the signal transform determined in step 704 for the set of candidate signals at the k th generalized frequency for each of the set of candidate signals.
- the signal transform is the unified signal transform.
- other types of signal transforms which exhibit the properties of the unified signal transform described herein may be used.
- only the values of the transformation at the k th generalized frequency are computed.
- the unified signal transformation of the input signal g may also be performed at the k th generalized frequency and a best match determination can be performed between the transformation value of the input signal at the k th generalized frequency and the precomputed values of the transformation at the k th generalized frequency for each of the set of candidate signals.
- FIG. 7 B Receive Input Signal g and Determine Best Match
- FIG. 7B is a flowchart diagram illustrating operation of the processing which is performed when an input signal of interest g is received. As described above, the problem is to determine the best match between the input signal of interest g and one signal from the set of candidate signals.
- the input signal of interest may be received.
- the input signal of interest g may be received in any of various ways and for any of various applications.
- the input signal of interest may be a received telecommunications signal that corresponds to one of a set of codes or candidate signals.
- Other examples of input signals may include, but are not limited to, biometric feature signals, images, signals of heart or brain function, such as electrocardiograms (EKG) or electroencephalograms (EEG), stock price data, or other signals or data sets.
- step 724 the method calculates the transformation of the input signal g at the k th generalized frequency using the unified signal transform determined in step 704 of FIG. 7 A.
- the value of the unified signal transformation of g at the k th generalized frequency may be referred as ⁇ overscore ( ⁇ ) ⁇ , or alpha-bar.
- one or more values of the signal transform applied to the input signal of interest may be calculated at one or more generalized frequencies, k.
- a plurality of the signal transform values are calculated for a plurality of different generalized frequencies k 1 , k 2 , etc., for each of the set of candidate signals, then a corresponding plurality of signal transform values are calculated for the same plurality of different generalized frequencies k 1 , k 2 , etc. for the input signal of interest.
- step 726 the method determines the best match between ⁇ overscore ( ⁇ ) ⁇ and ⁇ (n) values of the candidate signals determined in step 708 and 710 .
- the method determines the best match between the at least one generalized frequency component value of the input signal of interest and the at least one generalized frequency component value of each of the set of candidate signals.
- a best match is found between the value of the unified signal transform of the input signal g at the k th generalized frequency compared and the value of the unified signal transform of each of the signals in the set of candidate signals at the k th generalized frequency.
- a best match is determined between the one or more values of the transformation of the input signal of interest and the one or more values of the transformation for each of the set of candidate signals.
- the method determines the best match by finding an ⁇ (n) value that has the smallest distance to, or differs the least from, the computed ⁇ overscore ( ⁇ ) ⁇ value. This may be accomplished by calculating the difference between each of the ⁇ (n) values and ⁇ overscore ( ⁇ ) ⁇ (e.g., subtracting each of the respective ⁇ (n) values from ⁇ overscore ( ⁇ ) ⁇ ) and then determining a smallest difference between or among the ⁇ (n) values and ⁇ overscore ( ⁇ ) ⁇ . The best match between each of the ⁇ (n) values and ⁇ overscore ( ⁇ ) ⁇ may also be determined using other methods, as desired.
- the method outputs the closest signal of the set of candidate signals, i.e., the signal that produces the best match with respect to the input signal.
- information is output indicating a closest match candidate signal of the set of candidate signals.
- This information may be an index or label indicating the “best match” candidate signal, or may comprise the “best match” signal itself.
- the “best match” candidate signal may be output in various ways. For example, the “best match” candidate signal may be displayed on a display screen and/or saved or logged to file. Alternatively, the “best match” candidate signal may be provided to other components or logic circuitry in the system for processing. For example, in a telecommunication application, the “best match” candidate signal may be provided to other telecommunication logic to decode, interpret, or further process the received signal.
- the best match candidate signal may be processed to determine if the best match candidate is an acceptable match. For example, if the received input signal of interest is not represented among the set of candidate signals, a “best match” may still be found, but which, after further analysis, may be determined to be an inappropriate match for the input signal. If the determined best match candidate is not acceptable, then information to that effect may be output.
- the best match candidate signal may be processed to determine characteristics of the received input signal of interest.
- the determined best match candidate signal may comprise a (substantially) noise-free version of the input signal of interest, and thus may be more suitable for determining characteristics of the input signal.
- FIGS. 8 Unified Signal Transform Calculation
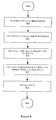
- FIG. 8 is a flowchart of a calculation of the unified transform mentioned above with reference to FIG. 7A ( 704 ), according to one embodiment.
- the unified transform is preferably calculated in a preprocessing phase of the pattern matching process for improved performance.
- a first matrix B is formed from the set of candidate signals.
- the set of candidate signals comprises N candidate signals, each of which comprises N values, wherein the number of values is equal to the number of candidate signals.
- the values from each of the candidate signals comprise a corresponding column of the first matrix B, such that a first candidate signal comprises a first column of the matrix B, a second candidate signal comprises a second column of B, and so on.
- the fact that the number of values in each candidate signal (column) is equal to the number of candidate signals (columns) means that the resulting first matrix B is square, i.e., the number of columns in the first matrix is equal to the number of rows in the first matrix.
- the first matrix B is a regular matrix, i.e., is not singular.
- the first matrix is a regular N ⁇ N matrix.
- auxiliary data may be generated to fulfill this requirement, as described in more detail below.
- a matrix B′ may be defined, wherein the matrix B′ comprises a column-wise cyclic shifted matrix B.
- each column vector in matrix B may be shifted one position (to the left or right, depending upon the sign of the shift), with the end column “wrapping” around to the other side of the matrix.
- a matrix A may be defined which comprises a cyclic shift matrix, such that multiplying matrix A times matrix B performs a column-wise cyclic shift on matrix B, thereby generating matrix B′.
- X B comprises a matrix of normalized columnar eigenvectors of matrix B, wherein ⁇ comprises a diagonal matrix of eigenvalues of matrix B, and wherein X B ⁇ 1 comprises an inverse matrix of matrix X B .
- the matrix X B ⁇ 1 is calculated to generate the unified signal transform.
- the matrix X B ⁇ 1 may be calculated by any of various methods, as is well known in the art.
- the eigenvalues for the matrix A may be calculated via the method of determinants, then used to determine the corresponding eigenvectors.
- the eigenvectors may then be used to form the matrix X B .
- the inverse of X B may be calculated to give X B ⁇ 1 . It is noted that this method becomes unfeasible for large matrices, and so in the preferred embodiments, more efficient methods of solving for X B ⁇ 1 may be employed. Examples of more efficient methods include iterative methods, and methods based on standard Fourier matrices.
- the matrix X B ⁇ 1 comprises the unified signal transform which may be applied to each of the candidate signals and the received signal of interest, as described above with reference to FIGS. 7A and 7B .
- applying the unified signal transform X B ⁇ 1 to a signal at a selected generalized frequency may comprise selecting a single row of the unified signal transform matrix X B ⁇ 1 corresponding to the selected generalized frequency, and multiplying the row (as a vector) times the signal (also as a vector).
- applying the transform to the signal may be reduced from a matrix multiplication to a vector multiplication, greatly improving the performance of the method.
- the number of values for each candidate signal may not be equal to the number of candidate signals.
- the matrix B is assumed to be square (number of rows equals number of columns).
- the data set may be extended to provide the correct form for the matrix.
- one or more auxiliary candidate signals may be added to the set of candidate signals as appropriate to make the total number of candidate signals equal to the number of values in each candidate signal.
- the auxiliary candidate signals may comprise arbitrary signals containing the same number of values as each of the original candidate signals.
- the auxiliary candidate signals may be generated by averaging one or more of the original candidate signals.
- additional auxiliary values may be generated so as to complete the form of each of these candidate signals, i.e., increase the number of values in each candidate signal to match the number of candidate signals.
- the additional values may be determined through interpolation, extrapolation, or both.
- the original values may be used to generate a function or curve, which may then be sampled to generate the correct number of values.
- a different, but functionally equivalent data set may be generated from the original values of the candidate signal, but having the appropriate number of values. The same techniques may be applied to the input signal of interest, as well.
- the intent is to ensure that the number of candidate signals and the number of values in each candidate signal (as well as the input signal of interest) are equal.
- the matrix B generated from the candidate signals according to the method described above is regular, i.e., is not singular.
- the matrix B is not required to be square, and thus no manipulation of the candidate signals is required when the number of values for each candidate signal does not equal the number of candidate signals.
- Pattern matching is an important technique in digital image processing.
- the evolution of computer technology has enabled many practical applications based on pattern matching, especially in industrial automation.
- One example of an automated pattern matching process is the visual inspection of circuit boards.
- a typical task is to determine a missing component in circuit boards on a production line.
- the procedure generally operates on a digital picture of the circuit board.
- a search of the image is made for a predefined template corresponding to the desired component, i.e., given a test image I, the location of the template I t within this image is determined.
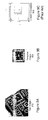
- Typical test and template images are shown in FIGS. 9A and 9B .
- the method described below uses a statistical sampling approach to pattern matching.
- a new generalized transform (the unified signal transform, described above with reference to FIGS. 7-8 ) and some of its properties are described. This transform provides the basis for the robust real-time scaling invariant and/or rotation invariant pattern matching method described above with reference to FIGS. 3-8 .
- Normalized cross correlation is the most common way to find a template in an image. The following is the basic concept of correlation: Consider a sub-image w(x,y) of size K ⁇ L within an image f(x,y) of size M ⁇ N, where K ⁇ M and L ⁇ N.
- ⁇ overscore (w) ⁇ (calculated only once) is the average intensity value of the pixels in the template w.
- the variable ⁇ overscore (f) ⁇ (i,j) is the average value of f in the region coincident with the current location of w.
- the value of C lies in the range ⁇ 1 to 1 and is independent of scale changes in the intensity values of f and w.
- FIG. 9C illustrates the correlation procedure. Assume that the origin of the image f is at the top left corner. Correlation is the process of moving the template or sub-image w around the image area and computing the value C in that area. The maximum value of C indicates the position where w best matches f. Since the underlying mechanism for correlation is based on a series of multiplication operations, the correlation process is time consuming. With new technologies such as Intel Corporation's MMX multimedia chip instructions, multiplications can be done in parallel, and the overall computation time can be reduced considerably. The basic normalized cross correlation operation does not meet speed requirements for many applications.
- Normalized cross correlation is a good technique for finding patterns in an image as long as the patterns in the image are not scaled or rotated.
- cross correlation can detect patterns of the same size up to a rotation of 5° to 10°. Extending correlation to detect patterns that are invariant to scale changes and rotation is difficult.
- Approaches based on multidimensional Discrete Fourier Transforms and Principal Component Analysis have been proposed, but are generally considered to be inadequate, due to the slowness of the learning phase and requirements for non-integer operations.
- Low discrepancy sequences have been successfully used in a variety of applications that require spatial or multidimensional sampling.
- a low discrepancy sequence can be described as a sequence that samples a given space as uniformly as possible. Thus, the density of points in relation to the space volume is almost constant.
- a template image may be subsampled according to a two-dimensional low discrepancy sequence.
- a set S of N coordinates of the template may be formed and the correlation computed only in relation to these coordinates.
- the method has two stages. In the first, possible matches are computed based on a subsampled correlation. A threshold in the correlation value determines the exclusion or inclusion of a match. In the second, the edge information of the template is used to accurately locate the potential match indicated by the first stage. Typically, for a 100 ⁇ 100 template, a set of 61 points is enough to provide a robust correlation basis (160 times faster) for the first stage candidate list generation procedure.
- a Halton low discrepancy sequence can be used. Typically, 61-70 points from the template should be selected.
- Theorem 1 proves the shift invariance property for the GT.
- Theorem 2 shows that if the vectors f i are shifted versions of each other, then X B ⁇ 1 is the Fourier matrix.
- Theorem 3 provides a way to compute the UST in an efficient manner. For proofs of the theorems, please refer to the Theorems section, below.
- Choosing a frequency in the UST domain corresponds to selecting a line of the matrix X B ⁇ 1 .
- is the radius of the circle at frequency k. Theorem 3 states that for a unitary transform this radius is given by 1/d k . Moreover, the sequence 1/d k (k 0, . . . , N ⁇ 1) forms a spectrum equivalent to the Fourier spectrum.
- a scaling invariant pattern matching algorithm based on the Projection Match algorithm and in statistical sampling is presented below.
- the algorithm explores the finite range of the scaling factor to create an efficient image matching process.
- FIG. 11B presents the sampling process that generates the set ⁇ f 0 , . . . , f N ⁇ 1 ⁇ .
- the template is rescaled (using bilinear interpolation) to N different discrete scaling factors, evenly distributed in the finite range. At each scaling factor, the same N distinct Halton points (in reference to the center of the image) are sampled. Note that the template image rescaled to the smallest scale determines the extent of the sampling area.
- the matching phase comprises sliding the sampling structure defined by the statistical sampling over the test image (as in FIG. 10 ), and at each pixel location extracting the corresponding vector ⁇ overscore (f) ⁇ . Then, finding the vector f closest to ⁇ overscore (f) ⁇ determines a match. A full normalized correlation between the chosen vector f and ⁇ overscore (f) ⁇ determines a score. The best match is the match with highest score among all pixel locations. This procedure is presented below.
- STEP1 Shift the set of reference coordinates to the pixel (i,j). Extract the intensity (pixel) values to ⁇ overscore (f) ⁇ .
- STEP3 Find line vector in P closest to ⁇ overscore (p) ⁇ (Randomized Correlator could be used)
- STEP4 Compute normalized correlation between f i (corresponding to the line vector in STEP3) and ⁇ overscore (f) ⁇ , referred to as the score.
- the main advantage of the pattern matching algorithm presented above is its relatively low computational complexity compared to classical procedures.
- the template is of size M ⁇ M
- the test image is of size N ⁇ N and that K discrete scale steps are used. In all cases, complexity will be measured as number of required multiplications. Assume also that M ⁇ N.
- the classic correlation approach would be to compute the correlation of the test image with the K rescaled template images.
- the classic statistical sampling approach would incorporate statistical sampling into the correlation computation.
- the algorithm proposed above incorporates UST projection and a randomized correlator to reduce computation even further. The number of multiplications for each method is presented below.
- the scale invariant pattern matching algorithm has been implemented in the National Instruments LabVIEW development environment. Based on experiments, the suggested number of Halton samples required has been determined to be between 60-80 (N) and the number of projection vectors between 4 and 8 (K).
- a new method for real-time scale invariant and/or rotation invariant pattern matching is presented based on the shift invariance property of a new transform which is computed for a given set of basis signals.
- One advantage of the proposed approach is that any affine transform may be included as part of the method.
- the generalized basis functions may reduce to the Haar transform basis functions.
- pattern matching applications are intended to be illustrative, and are not intended to limit the scope or domain of applicability of the present method.
- an exemplary application of pattern matching relates to matched filtering in telecommunications systems.
- Such filtering provides a way to discriminate a signal waveform from a noisy signal background.
- the input signal of interest may be a received biometric feature signal, such as fingerprint, voice pattern information, facial feature information, or any other biometric feature signal, which corresponds to one of a set of identified biometric candidate signals.
- a successful match between the received biometric feature signal and a candidate signal may be used to positively identify a user to determine whether to provide the user access to a secure system, such as a secure building, smart card, or restricted computer system, among others.
- Other uses for such biometric pattern matching may include forensic, anthropologic, and physiologic applications.
- pattern matching is commonly used in machine vision systems for inspecting parts in automated manufacturing or assembly lines.
- a template image of a feature or component must be matched to a sub-region of one of a number of candidate images.
- the presence and orientation of a computer chip may be determined for a circuit board on an assembly line, and if the computer chip is found to be missing or misaligned, the circuit board may be rejected.
- Another example of 2D pattern matching is related to visual identification of human faces, e.g., image matching may be used to identify a person by matching a received facial image to one of a set of candidate facial images, such as from an FBI image database.
- Yet another application of 2D image pattern matching is related to the interpretation of images for medical diagnostics, such as images produced by positron emission tomography, x-rays, nuclear magnetic resonance, or other medical imaging technologies.
- Image matching applications are not limited to 2-dimensional images.
- some medical scanning devices are able to produce 3-dimensional images of a patient's body parts, such as computer assimilated ultra-sound images.
- Such 3D images may be matched to known 3D candidate images for diagnostic purposes.
- a received signal or image of heart or brain function such as an electrocardiogram (EKG) or electroencephalogram (EEG) may be matched with archetypal patterns characterizing specific conditions for diagnostic purposes.
- EKG electrocardiogram
- EEG electroencephalogram
- Pattern matching also has myriad applications in the areas of finance, business, and the stock and bonds markets.
- the input signal of interest may be a stock price history
- the candidate signals may be a set of characteristic stock price waveforms indicating various archetypal performance scenarios.
Landscapes
- Engineering & Computer Science (AREA)
- Physics & Mathematics (AREA)
- Theoretical Computer Science (AREA)
- General Physics & Mathematics (AREA)
- Computer Vision & Pattern Recognition (AREA)
- Multimedia (AREA)
- Mathematical Analysis (AREA)
- Computing Systems (AREA)
- Computational Mathematics (AREA)
- Data Mining & Analysis (AREA)
- Mathematical Physics (AREA)
- Databases & Information Systems (AREA)
- Software Systems (AREA)
- Pure & Applied Mathematics (AREA)
- Mathematical Optimization (AREA)
- General Engineering & Computer Science (AREA)
- Algebra (AREA)
- Health & Medical Sciences (AREA)
- Artificial Intelligence (AREA)
- Evolutionary Computation (AREA)
- General Health & Medical Sciences (AREA)
- Medical Informatics (AREA)
- Complex Calculations (AREA)
Abstract
Description
F k =W N(k)*f 0,
where Fk is calculated above in 106.
{overscore (α)}=W N(k)*g,
F k =X B −1(k)*f 0,
where Fk is calculated above in 708.
This expression uses the shift invariant property of the transform to substantially reduce the number of calculations required. In another embodiment, the values of the transformation at the kth generalized frequency for the remaining N−1 candidate signals may be computed by applying the unified transform at the kth generalized frequency to each of remaining candidate signals, as was applied to the first candidate signal in 708. In one embodiment, one or more values of the signal transform applied to each of the candidate signals may be calculated at at least one generalized frequency, k. In one embodiment, the signal transform may be applied to each of the set of candidate signals at more than one generalized frequency to produce a plurality of transformation values for each candidate signal.
{overscore (α)}=X B −1(k)g.
A=XBΛXB −1,
where i=0, 1, . . . M−1, j=0, 1 . . . N−1, {overscore (w)} (calculated only once) is the average intensity value of the pixels in the template w. The variable {overscore (f)}(i,j) is the average value of f in the region coincident with the current location of w. The value of C lies in the range −1 to 1 and is independent of scale changes in the intensity values of f and w.
- P1) AB=B′, where B′ is the matrix B with a column-wise shift (i.e. fi+1 mod N corresponds to the column i of B′). B is regular and so is B′. Thus A=B′B−1.
- P2) AN=I (N×N identity). Thus, eigenvalues of A are given by
- P3) The matrix A can be decomposed as A=XBVXB −1, where V is the N×N diagonal matrix formed by the eigenvalues
- Theorem 1: The matrix XB −1 defines a shift invariant transformation for the set of vectors fi.
- Theorem 2: If the vectors fi are shifted versions of each other (i.e. fi=f([n+i]N)) then XB −1 is the Fourier matrix).
- Theorem 3: Given a regular matrix B the generalized transform can be computed as XB −1=D−1WNB−1, where D is an arbitrary complex diagonal matrix. To define a unitary transform the diagonal elements of D should be set to
where Bi inv(k) represents the Discrete Fourier Transform of the ith column of B−1.
- STEP1: Compute and store P=FB, where F is an arbitrary K×N matrix. (Done once at learn time)
- STEP2: Compute {overscore (p)}=F{overscore (f)}
- STEP3: Find the closest line-vector to {overscore (p)}, among the lines of P.
- STEP1: For the matrix B compute XB −1 unitary, according to Theorem 3.
- STEP2: Select K/2 frequencies (K integer) of the UST of B according to the optimization below, where g(k) is the UST of f0 at frequency k(f0 is the first column of B).
- STEP3: Set the lines of F to be the real and imaginary parts of the selected k/2 lines of XB −1. The kth frequency corresponds to the kth line of XB −1.
- Inputs: template Image, scaling factor range (s0,s1) and N (matching granularity). Define Δs=(s1−s0)/N.
- STEP1: Create 2D Holton set for rectangle of size s0X by s0Y, where (X,Y) is the template size. Store the set of N reference coordinates S={(x0,y0), . . . , (xN−1,yN−1)}.
- STEP2: For i=1 to N{
- Rescale template image to scaling factor s=s0+iΔs
- Extract the pixel values of the N Holton samples (image center as reference)→results in fi}
- STEP3: Set each fi as a column of B and compute the projection matrix F as suggested in Table 1(b). Randomized Correlator for lines of P can be determined in this step.
- Inputs: Test Image, learnt data.
- For each pixel (i,j) do:
| Algorithm | Number of Multiplications | ||
| Classic Correlation | KM2N2 | ||
| Classic Statistical Sampling | K2N2 | ||
| Proposed Method | ((p + 1)K + O(p))N2 ≈ 2KN2 | ||
- Theorem 1: The matrix XB −1 defines a shift invariant transformation for the set of vectors fi.
- Proof: From the definition of the matrix A, it is clear that fp=Apf0. Using property P3 we can write fp=XBVpXB −1f0, resulting finally in XB −1fp=VpXB −1f0, which is the matrix form of the shift invariance property of the DFT (note that for a DFT fp=f([n+p]N)).
- Theorem 2: If the vectors fi are shifted versions of each other (i.e. fi=f([n+i]N)) then XB −1 is the Fourier matrix.
- Proof: For the specified set of vectors, B′=I′B where I′ is the column-wise shifted identity matrix
It is clear then that A=I′. If we set XB −1=WN, where WN is the DFT matrix, then I′=WN −1VWN which can be verified by direct computation. - Theorem 3: Given a regular matrix B the generalized transform can be computed as XB −1=D−1WNB−1, where D is an arbitrary complex diagonal matrix. To define a unitary transform the diagonal elements of D should be set to
where Bi inv(k) represents the Discrete Fourier Transform of the ith column of B−1. - Proof: Using P1, B′=I′B, and I′=WN −1VWN (Theorem 2) one can equate XBVXB −1B=BWN −1VWN. This directly implies that XB −1=D−1WNB−1, where D is an arbitrary diagonal matrix. Moreover, each column of WNB−1 is Bi inv(k) (for k−0, . . . , N−1). The definition of an unitary transform requires that every line of WNB−1 have unit norm. It is clear then that
The two free parameters b11 and b31 are chosen in such a manner that B is regular. It can be shown that
which results in the Walsh-matrix
Example Applications
Claims (46)
Priority Applications (3)
| Application Number | Priority Date | Filing Date | Title |
|---|---|---|---|
| US09/760,052 US6963667B2 (en) | 2001-01-12 | 2001-01-12 | System and method for signal matching and characterization |
| US09/832,912 US6807305B2 (en) | 2001-01-12 | 2001-04-10 | System and method for image pattern matching using a unified signal transform |
| US11/105,761 US7233700B2 (en) | 2001-01-12 | 2005-04-14 | System and method for signal matching and characterization |
Applications Claiming Priority (1)
| Application Number | Priority Date | Filing Date | Title |
|---|---|---|---|
| US09/760,052 US6963667B2 (en) | 2001-01-12 | 2001-01-12 | System and method for signal matching and characterization |
Related Child Applications (2)
| Application Number | Title | Priority Date | Filing Date |
|---|---|---|---|
| US09/832,912 Continuation-In-Part US6807305B2 (en) | 2001-01-12 | 2001-04-10 | System and method for image pattern matching using a unified signal transform |
| US11/105,761 Continuation US7233700B2 (en) | 2001-01-12 | 2005-04-14 | System and method for signal matching and characterization |
Publications (2)
| Publication Number | Publication Date |
|---|---|
| US20020150298A1 US20020150298A1 (en) | 2002-10-17 |
| US6963667B2 true US6963667B2 (en) | 2005-11-08 |
Family
ID=25057940
Family Applications (2)
| Application Number | Title | Priority Date | Filing Date |
|---|---|---|---|
| US09/760,052 Expired - Lifetime US6963667B2 (en) | 2001-01-12 | 2001-01-12 | System and method for signal matching and characterization |
| US11/105,761 Expired - Lifetime US7233700B2 (en) | 2001-01-12 | 2005-04-14 | System and method for signal matching and characterization |
Family Applications After (1)
| Application Number | Title | Priority Date | Filing Date |
|---|---|---|---|
| US11/105,761 Expired - Lifetime US7233700B2 (en) | 2001-01-12 | 2005-04-14 | System and method for signal matching and characterization |
Country Status (1)
| Country | Link |
|---|---|
| US (2) | US6963667B2 (en) |
Cited By (7)
| Publication number | Priority date | Publication date | Assignee | Title |
|---|---|---|---|---|
| US20040156556A1 (en) * | 2001-04-25 | 2004-08-12 | Lopez Javier Olivan | Image processing method |
| US20050033523A1 (en) * | 2002-07-09 | 2005-02-10 | Mototsugu Abe | Similarity calculation method and device |
| US20050177314A1 (en) * | 2001-01-12 | 2005-08-11 | National Instruments Corporation | System and method for signal matching and characterization |
| US20070124298A1 (en) * | 2005-11-29 | 2007-05-31 | Rakesh Agrawal | Visually-represented results to search queries in rich media content |
| US20110110191A1 (en) * | 2009-11-10 | 2011-05-12 | Sherilyn Williams-Stroud | Method for determining discrete fracture networks from passive seismic signals and its application to subsurface reservoir simulation |
| US9135497B2 (en) | 2012-01-27 | 2015-09-15 | National Instruments Corporation | Identifying randomly distributed microparticles in images to sequence a polynucleotide |
| CN106650109A (en) * | 2016-12-26 | 2017-05-10 | 中核控制系统工程有限公司 | Nuclear power plant man-machine interface pixel pattern |
Families Citing this family (14)
| Publication number | Priority date | Publication date | Assignee | Title |
|---|---|---|---|---|
| US9310892B2 (en) | 2000-11-06 | 2016-04-12 | Nant Holdings Ip, Llc | Object information derived from object images |
| US7680324B2 (en) | 2000-11-06 | 2010-03-16 | Evryx Technologies, Inc. | Use of image-derived information as search criteria for internet and other search engines |
| US8224078B2 (en) | 2000-11-06 | 2012-07-17 | Nant Holdings Ip, Llc | Image capture and identification system and process |
| US7565008B2 (en) | 2000-11-06 | 2009-07-21 | Evryx Technologies, Inc. | Data capture and identification system and process |
| US7899243B2 (en) | 2000-11-06 | 2011-03-01 | Evryx Technologies, Inc. | Image capture and identification system and process |
| EP1225545A1 (en) * | 2001-01-23 | 2002-07-24 | Koninklijke Philips Electronics N.V. | Image processing method for tracking the deformation of an organ in time |
| US7233699B2 (en) * | 2002-03-18 | 2007-06-19 | National Instruments Corporation | Pattern matching using multiple techniques |
| US7327307B2 (en) * | 2005-07-07 | 2008-02-05 | Raytheon Company | Radar system with adaptive waveform processing and methods for adaptively controlling the shape of a radar ambiguity function |
| JP4952026B2 (en) * | 2006-03-31 | 2012-06-13 | 株式会社日立製作所 | Biometric information authentication apparatus and authentication method |
| US20100237991A1 (en) * | 2009-03-17 | 2010-09-23 | Prabhu Krishnanand | Biometric scanning arrangement and methods thereof |
| CN104658073A (en) * | 2013-11-20 | 2015-05-27 | 鸿富锦精密工业(武汉)有限公司 | Iris key and method for unlocking electronic apparatus therewith |
| CN109065058B (en) * | 2018-09-30 | 2024-03-15 | 合肥鑫晟光电科技有限公司 | Voice communication method, device and system |
| CN112149728B (en) * | 2020-09-22 | 2023-11-17 | 成都智遥云图信息技术有限公司 | Rapid multi-mode image template matching method |
| CN112257560B (en) * | 2020-10-20 | 2022-01-07 | 华北电力大学 | Microseismic event detection method and system by utilizing cumulative similarity |
Citations (7)
| Publication number | Priority date | Publication date | Assignee | Title |
|---|---|---|---|---|
| US5109431A (en) * | 1988-09-22 | 1992-04-28 | Hitachi, Ltd. | Pattern discrimination method and apparatus using the same |
| US5619596A (en) * | 1993-10-06 | 1997-04-08 | Seiko Instruments Inc. | Method and apparatus for optical pattern recognition |
| US5915034A (en) * | 1995-05-02 | 1999-06-22 | Yamatake-Honeywell, Co., Ltd. | Pattern collation apparatus based on spatial frequency characteristics |
| US6137896A (en) * | 1997-10-07 | 2000-10-24 | National Research Council Of Canada | Method of recognizing faces using range images |
| US6240372B1 (en) * | 1997-11-14 | 2001-05-29 | Arch Development Corporation | System for surveillance of spectral signals |
| US6249594B1 (en) * | 1997-03-07 | 2001-06-19 | Computerized Medical Systems, Inc. | Autosegmentation/autocontouring system and method |
| US6404920B1 (en) * | 1996-09-09 | 2002-06-11 | Hsu Shin-Yi | System for generalizing objects and features in an image |
Family Cites Families (2)
| Publication number | Priority date | Publication date | Assignee | Title |
|---|---|---|---|---|
| US5216750A (en) * | 1990-06-07 | 1993-06-01 | Texas Instruments Incorporated | Computation system and method using hamming distance |
| US6963667B2 (en) * | 2001-01-12 | 2005-11-08 | National Instruments Corporation | System and method for signal matching and characterization |
-
2001
- 2001-01-12 US US09/760,052 patent/US6963667B2/en not_active Expired - Lifetime
-
2005
- 2005-04-14 US US11/105,761 patent/US7233700B2/en not_active Expired - Lifetime
Patent Citations (7)
| Publication number | Priority date | Publication date | Assignee | Title |
|---|---|---|---|---|
| US5109431A (en) * | 1988-09-22 | 1992-04-28 | Hitachi, Ltd. | Pattern discrimination method and apparatus using the same |
| US5619596A (en) * | 1993-10-06 | 1997-04-08 | Seiko Instruments Inc. | Method and apparatus for optical pattern recognition |
| US5915034A (en) * | 1995-05-02 | 1999-06-22 | Yamatake-Honeywell, Co., Ltd. | Pattern collation apparatus based on spatial frequency characteristics |
| US6404920B1 (en) * | 1996-09-09 | 2002-06-11 | Hsu Shin-Yi | System for generalizing objects and features in an image |
| US6249594B1 (en) * | 1997-03-07 | 2001-06-19 | Computerized Medical Systems, Inc. | Autosegmentation/autocontouring system and method |
| US6137896A (en) * | 1997-10-07 | 2000-10-24 | National Research Council Of Canada | Method of recognizing faces using range images |
| US6240372B1 (en) * | 1997-11-14 | 2001-05-29 | Arch Development Corporation | System for surveillance of spectral signals |
Non-Patent Citations (6)
| Title |
|---|
| Cantoni et al. "2-D Object Recognition by Multiscale Tree Matching" Pattern Recognition, vol. 31, No. 10, 1998, pp. 1443-1454. |
| Dinesh Nair and Lothar Wenzel, Application of Low Discrepancy Sequences and Classical Control Strategies for Image Registration International Society of Information Fusion, Jul. 1999, pp. 706-714. |
| Goodrich et al. "Short Papers" IEEE vol. 21, No. 4, Apr. 1999, pp. 371-379. |
| Michihiro Uenohara et al. "Use of Fourier and Karhunen-Loeve Decomposition for Fast Pattern Matching with a Large Set of Templates" IEEE vol. 19, No. 8, Aug. 1997, pp 891-898. |
| Nair et al. "Image Processing and Low Discrepancy Sequences" SPIE vol. 3807, Jul. 1999, pp. 102-111. |
| Robert L. Cook, "Stochastic Sampling in Computer Graphics" ACM vol. 5, No. 1, Jan. 1986, pp. 51-72. |
Cited By (11)
| Publication number | Priority date | Publication date | Assignee | Title |
|---|---|---|---|---|
| US20050177314A1 (en) * | 2001-01-12 | 2005-08-11 | National Instruments Corporation | System and method for signal matching and characterization |
| US7233700B2 (en) * | 2001-01-12 | 2007-06-19 | National Instuments Corporation | System and method for signal matching and characterization |
| US20040156556A1 (en) * | 2001-04-25 | 2004-08-12 | Lopez Javier Olivan | Image processing method |
| US20050033523A1 (en) * | 2002-07-09 | 2005-02-10 | Mototsugu Abe | Similarity calculation method and device |
| US7260488B2 (en) * | 2002-07-09 | 2007-08-21 | Sony Corporation | Similarity calculation method and device |
| US20070124298A1 (en) * | 2005-11-29 | 2007-05-31 | Rakesh Agrawal | Visually-represented results to search queries in rich media content |
| US20110110191A1 (en) * | 2009-11-10 | 2011-05-12 | Sherilyn Williams-Stroud | Method for determining discrete fracture networks from passive seismic signals and its application to subsurface reservoir simulation |
| US8902710B2 (en) * | 2009-11-10 | 2014-12-02 | Microseismic, Inc. | Method for determining discrete fracture networks from passive seismic signals and its application to subsurface reservoir simulation |
| US9135497B2 (en) | 2012-01-27 | 2015-09-15 | National Instruments Corporation | Identifying randomly distributed microparticles in images to sequence a polynucleotide |
| CN106650109A (en) * | 2016-12-26 | 2017-05-10 | 中核控制系统工程有限公司 | Nuclear power plant man-machine interface pixel pattern |
| CN106650109B (en) * | 2016-12-26 | 2020-05-22 | 中核控制系统工程有限公司 | Nuclear power station man-machine interface primitive design method |
Also Published As
| Publication number | Publication date |
|---|---|
| US20020150298A1 (en) | 2002-10-17 |
| US7233700B2 (en) | 2007-06-19 |
| US20050177314A1 (en) | 2005-08-11 |
Similar Documents
| Publication | Publication Date | Title |
|---|---|---|
| US7233700B2 (en) | System and method for signal matching and characterization | |
| US6807305B2 (en) | System and method for image pattern matching using a unified signal transform | |
| Krisshna et al. | Face recognition using transform domain feature extraction and PSO-based feature selection | |
| JP7490141B2 (en) | IMAGE DETECTION METHOD, MODEL TRAINING METHOD, IMAGE DETECTION APPARATUS, TRAINING APPARATUS, DEVICE, AND PROGRAM | |
| Figueiredo et al. | Majorization–minimization algorithms for wavelet-based image restoration | |
| Chen et al. | Color image analysis by quaternion-type moments | |
| Comer et al. | Morphological operations for color image processing | |
| US8693765B2 (en) | Method for recognizing shapes and system implementing said method | |
| US9171226B2 (en) | Image matching using subspace-based discrete transform encoded local binary patterns | |
| US8098938B1 (en) | Systems and methods for descriptor vector computation | |
| Michel et al. | Scale invariant and deformation tolerant partial shape matching | |
| CN110082135A (en) | Equipment fault recognition methods, device and terminal device | |
| Rodriguez-Aragon et al. | Singular spectrum analysis for image processing | |
| Wang et al. | Geometric algebra in signal and image processing: A survey | |
| Laparra et al. | Principal polynomial analysis | |
| Xia et al. | Bidimensional multivariate empirical mode decomposition with applications in multi-scale image fusion | |
| Lajevardi | Structural similarity classifier for facial expression recognition | |
| Gruber et al. | Denoising using local projective subspace methods | |
| CN109064464B (en) | Method and device for detecting burrs of battery pole piece | |
| Hirata Junior et al. | Multiresolution design of aperture operators | |
| Ouyang et al. | Segmented gray-code kernels for fast pattern matching | |
| Le et al. | Locality and relative distance-aware non-local networks for hand-raising detection in classroom video | |
| Abbad et al. | Post-processing of dimensionality reduction methods for face recognition | |
| Benkuider et al. | Content Based Image Retrieval using the Generalized Gamma Density to model BEMD's IMF. | |
| CN114359905B (en) | Text recognition method and device, electronic equipment and storage medium |
Legal Events
| Date | Code | Title | Description |
|---|---|---|---|
| AS | Assignment |
Owner name: NATIONAL INSTRUMENTS CORPORATION, TEXAS Free format text: ASSIGNMENT OF ASSIGNORS INTEREST;ASSIGNORS:RAJAGOPAL, RAM;WENZEL, LOTHAR;NAIR, DINESH;AND OTHERS;REEL/FRAME:011493/0809 Effective date: 20010105 |
|
| STCF | Information on status: patent grant |
Free format text: PATENTED CASE |
|
| CC | Certificate of correction | ||
| FPAY | Fee payment |
Year of fee payment: 4 |
|
| FPAY | Fee payment |
Year of fee payment: 8 |
|
| FPAY | Fee payment |
Year of fee payment: 12 |
|
| AS | Assignment |
Owner name: WELLS FARGO BANK, NATIONAL ASSOCIATION, NORTH CAROLINA Free format text: SECURITY INTEREST;ASSIGNORS:NATIONAL INSTRUMENTS CORPORATION;PHASE MATRIX, INC.;REEL/FRAME:052935/0001 Effective date: 20200612 |
|
| AS | Assignment |
Owner name: WELLS FARGO BANK, NATIONAL ASSOCIATION, NORTH CAROLINA Free format text: SECURITY INTEREST;ASSIGNOR:NATIONAL INSTRUMENTS CORPORATION;REEL/FRAME:057280/0028 Effective date: 20210618 |
|
| AS | Assignment |
Owner name: NATIONAL INSTRUMENTS CORPORATION, TEXAS Free format text: RELEASE OF SECURITY INTEREST IN PATENTS (REEL/FRAME 057280/0028);ASSIGNOR:WELLS FARGO BANK, NATIONAL ASSOCIATION, AS ADMINISTRATIVE AGENT;REEL/FRAME:065231/0466 Effective date: 20231011 Owner name: PHASE MATRIX, INC., CALIFORNIA Free format text: RELEASE OF SECURITY INTEREST IN PATENTS (REEL/FRAME 052935/0001);ASSIGNOR:WELLS FARGO BANK, NATIONAL ASSOCIATION, AS ADMINISTRATIVE AGENT;REEL/FRAME:065653/0463 Effective date: 20231011 Owner name: NATIONAL INSTRUMENTS CORPORATION, TEXAS Free format text: RELEASE OF SECURITY INTEREST IN PATENTS (REEL/FRAME 052935/0001);ASSIGNOR:WELLS FARGO BANK, NATIONAL ASSOCIATION, AS ADMINISTRATIVE AGENT;REEL/FRAME:065653/0463 Effective date: 20231011 |