US5214593A - Method and apparatus for extending the linear dynamic range of absorbance detectors including multi-lightpath flow cells - Google Patents
Method and apparatus for extending the linear dynamic range of absorbance detectors including multi-lightpath flow cells Download PDFInfo
- Publication number
- US5214593A US5214593A US07/610,416 US61041690A US5214593A US 5214593 A US5214593 A US 5214593A US 61041690 A US61041690 A US 61041690A US 5214593 A US5214593 A US 5214593A
- Authority
- US
- United States
- Prior art keywords
- sample
- absorbance
- passageway
- fluid
- passing
- Prior art date
- Legal status (The legal status is an assumption and is not a legal conclusion. Google has not performed a legal analysis and makes no representation as to the accuracy of the status listed.)
- Expired - Lifetime
Links
- 238000002835 absorbance Methods 0.000 title claims abstract description 226
- 238000000034 method Methods 0.000 title claims abstract description 48
- 239000012530 fluid Substances 0.000 claims description 54
- 238000012545 processing Methods 0.000 claims description 12
- 230000000694 effects Effects 0.000 claims description 10
- 238000002156 mixing Methods 0.000 claims description 7
- 238000012360 testing method Methods 0.000 claims description 5
- 238000012935 Averaging Methods 0.000 claims description 4
- 230000001678 irradiating effect Effects 0.000 claims 2
- 230000004044 response Effects 0.000 description 33
- 238000012937 correction Methods 0.000 description 12
- 238000004364 calculation method Methods 0.000 description 11
- 230000008859 change Effects 0.000 description 11
- 230000009977 dual effect Effects 0.000 description 11
- 230000035945 sensitivity Effects 0.000 description 9
- 238000004128 high performance liquid chromatography Methods 0.000 description 8
- 235000013405 beer Nutrition 0.000 description 7
- 230000008901 benefit Effects 0.000 description 7
- BJDCWCLMFKKGEE-CMDXXVQNSA-N chembl252518 Chemical compound C([C@@](OO1)(C)O2)C[C@H]3[C@H](C)CC[C@@H]4[C@@]31[C@@H]2O[C@H](O)[C@@H]4C BJDCWCLMFKKGEE-CMDXXVQNSA-N 0.000 description 7
- 238000010586 diagram Methods 0.000 description 6
- 238000013459 approach Methods 0.000 description 5
- 150000001875 compounds Chemical class 0.000 description 5
- 239000003990 capacitor Substances 0.000 description 4
- 238000004587 chromatography analysis Methods 0.000 description 4
- 238000005259 measurement Methods 0.000 description 4
- 230000008569 process Effects 0.000 description 4
- 238000000926 separation method Methods 0.000 description 4
- 230000001174 ascending effect Effects 0.000 description 3
- 238000006243 chemical reaction Methods 0.000 description 3
- 238000001914 filtration Methods 0.000 description 3
- 229920006395 saturated elastomer Polymers 0.000 description 3
- 238000004458 analytical method Methods 0.000 description 2
- 230000008033 biological extinction Effects 0.000 description 2
- 238000010276 construction Methods 0.000 description 2
- 230000003247 decreasing effect Effects 0.000 description 2
- 238000001514 detection method Methods 0.000 description 2
- 230000004907 flux Effects 0.000 description 2
- 230000006872 improvement Effects 0.000 description 2
- 230000003287 optical effect Effects 0.000 description 2
- 238000002834 transmittance Methods 0.000 description 2
- 230000001427 coherent effect Effects 0.000 description 1
- 238000004891 communication Methods 0.000 description 1
- 230000008878 coupling Effects 0.000 description 1
- 238000010168 coupling process Methods 0.000 description 1
- 238000005859 coupling reaction Methods 0.000 description 1
- 238000013461 design Methods 0.000 description 1
- 238000005111 flow chemistry technique Methods 0.000 description 1
- 238000009499 grossing Methods 0.000 description 1
- 230000010354 integration Effects 0.000 description 1
- 238000012886 linear function Methods 0.000 description 1
- 230000007774 longterm Effects 0.000 description 1
- 238000004519 manufacturing process Methods 0.000 description 1
- 239000000203 mixture Substances 0.000 description 1
- 238000012544 monitoring process Methods 0.000 description 1
- 238000004262 preparative liquid chromatography Methods 0.000 description 1
- 238000011084 recovery Methods 0.000 description 1
- 230000009467 reduction Effects 0.000 description 1
- 230000002040 relaxant effect Effects 0.000 description 1
- 239000002904 solvent Substances 0.000 description 1
- 230000007704 transition Effects 0.000 description 1
Images


Classifications
-
- G—PHYSICS
- G01—MEASURING; TESTING
- G01N—INVESTIGATING OR ANALYSING MATERIALS BY DETERMINING THEIR CHEMICAL OR PHYSICAL PROPERTIES
- G01N21/00—Investigating or analysing materials by the use of optical means, i.e. using sub-millimetre waves, infrared, visible or ultraviolet light
- G01N21/17—Systems in which incident light is modified in accordance with the properties of the material investigated
- G01N21/25—Colour; Spectral properties, i.e. comparison of effect of material on the light at two or more different wavelengths or wavelength bands
- G01N21/27—Colour; Spectral properties, i.e. comparison of effect of material on the light at two or more different wavelengths or wavelength bands using photo-electric detection ; circuits for computing concentration
- G01N21/274—Calibration, base line adjustment, drift correction
-
- G—PHYSICS
- G01—MEASURING; TESTING
- G01N—INVESTIGATING OR ANALYSING MATERIALS BY DETERMINING THEIR CHEMICAL OR PHYSICAL PROPERTIES
- G01N21/00—Investigating or analysing materials by the use of optical means, i.e. using sub-millimetre waves, infrared, visible or ultraviolet light
- G01N21/84—Systems specially adapted for particular applications
- G01N21/85—Investigating moving fluids or granular solids
-
- G—PHYSICS
- G01—MEASURING; TESTING
- G01N—INVESTIGATING OR ANALYSING MATERIALS BY DETERMINING THEIR CHEMICAL OR PHYSICAL PROPERTIES
- G01N2201/00—Features of devices classified in G01N21/00
- G01N2201/06—Illumination; Optics
- G01N2201/066—Modifiable path; multiple paths in one sample
- G01N2201/0662—Comparing measurements on two or more paths in one sample
-
- G—PHYSICS
- G01—MEASURING; TESTING
- G01N—INVESTIGATING OR ANALYSING MATERIALS BY DETERMINING THEIR CHEMICAL OR PHYSICAL PROPERTIES
- G01N2201/00—Features of devices classified in G01N21/00
- G01N2201/12—Circuits of general importance; Signal processing
- G01N2201/126—Microprocessor processing
-
- G—PHYSICS
- G01—MEASURING; TESTING
- G01N—INVESTIGATING OR ANALYSING MATERIALS BY DETERMINING THEIR CHEMICAL OR PHYSICAL PROPERTIES
- G01N30/00—Investigating or analysing materials by separation into components using adsorption, absorption or similar phenomena or using ion-exchange, e.g. chromatography or field flow fractionation
- G01N30/02—Column chromatography
- G01N30/62—Detectors specially adapted therefor
- G01N30/74—Optical detectors
Definitions
- the present invention relates to absorbance detectors such as those commonly used in high performance liquid chromatography (HPLC), and, more particularly, to a novel method and accompanying apparatus for automatically extending the linear dynamic range of such detectors.
- HPLC high performance liquid chromatography
- A the absorbance in absorbance units (AU)
- ⁇ the molar extinction coefficient of the sample or the molar absorptivity
- l the pathlength of the measurement cell in cm.
- Beer's Law breaks down at higher absorbances and nonlinearities occur. There are a number of reasons for such nonlinearities aside from the chemistry of the sample. Some of the more common reasons are outlined below:
- Light at wavelengths removed from a selected wavelength is absorbed at a different rate by a sample than light at the selected wavelength because ⁇ is a function of wavelength.
- Stray light can be caused by overlapping orders from a grating in the associated system monochromator or by light at other wavelengths that is scattered inside the instrument and get through the flow cell to the photodetector. Stray light can cause a detected background signal which is not absorbed by the sample at the same rate as the selected wavelength. Such a background will cause a distortion to Beer's Law.
- the finite bandwidth of the monochromator also is sufficient to cause nonlinearities even if stray light does not exist at wavelengths far removed from the selected wavelength.
- Bandwidths are typically 5 to 10 nm in HPLC Absorbance detector.
- the molar extinction coefficient of most compounds, at certain wavelengths, can easily vary over a 5 to 10 nm wavelength range by amounts sufficient to cause non Beer's Law behavior.
- Instrument bandwidth limits linear response to less than 2 AU in most HPLC absorbance detectors.
- the present invention satisfies such needs by providing a method and apparatus for automatically extending the linear dynamic range of absorbance detectors including multi-lightpath flow cells.
- the method and apparatus of the present invention are as embodied in the DYNAMAX Model UV-1 HPLC absorbance detector soon to be released by the Rainin Instrument Co., Inc., the assignee of the present invention.
- the improvement provided by the present invention is a method and associated apparatus for extending the linear dynamic range of an absorbance detector including a multiple light path flow cell having at least a relatively long sample beam passageway and a relatively short reference beam passageway, each passing the sample fluid under test and including photo detector means for receiving the sample and reference beams and for developing output signals which are measures of the absorbance of the sample and reference beams in the sample fluid.
- the method comprises the steps of and includes apparatus for
- the developing of the linearized relative absorbance (A 1 ') comprises multiplying A 2 ' by the ratio of A 1 to A 2 or a ratio of a difference (A D ) between A 1 and A 2 to A 2 , e.g. A D /A 2 .
- FIG. 1 and FIG. 2 are block diagrams of hardware methods of calculation absorbance from two different pathlengths.
- FIG. 3 is an alternate configuration including a single logratiometer.
- FIG. 4 graphically illustrates a hypothetical response of the systems shown in FIGS. 1, 2 and 3 to a compound at different concentrations.
- FIG. 5 illustrates a typical chromatogram with the absorbance signals A D , A 2 and extended A 2 superimposed on A D .
- FIG. 6a illustrates a logratiometer analog to digital converter useful in the present invention while FIG. 6b is a timing diagram for the circuit of FIG. 6a.
- FIG. 7 is a basic flow chart for the software control of the microprocessor of FIG. 3 illustrating the control processing sequence.
- FIG. 8 is a more detailed showing of the control processing sequence of FIG. 7.
- FIG. 9 is a flow chart of the software routines for the calculating of peak path difference ratios and relative absorbance extension of dynamic range in the methods of the present invention.
- FIG. 10 is a flow chart of the ratio calibration algorithm for the calculation of the peak path difference ratio referenced in FIG. 9.
- FIGS. 11a and 11b combine to illustrate the flow chart of the software routine filter reference referenced in FIG. 9.
- FIG. 12 illustrates a triple beam and pathlength system for improved absorbance detection.
- FIGS. 1 and 2 illustrate block diagrams of hardware methods where absorbance is calculated from two different pathlengths simultaneously.
- a flow cell (10) with two different optical pathlengths is illustrated.
- Light beam 2 is shown passing through a short pathlength, L 2
- light beam 1 is shown passing through a longer pathlength, L 1 .
- Flow of the sample through the flow cell can be in either direction but is illustrated as going through the short path first and then exiting from the long path.
- both pathlengths would be in the same physical space, but construction of such a cell and associated optics is complex.
- the two flow cells are shown as being separate and connected in series. The connecting volume between the two cells is kept very small to minimize the effects of the separation volume between the two pathlengths.
- the light beams (1 and 2) are directed to a pair of photodetectors (diodes) 4 and 6 respectively and the resulting signals are amplified by a pair of amplifiers (8 and 12) with outputs which represent the optical flux through each pathlength of the flow cell (T 1 and T 2 ).
- a logratiometer (14) outputs the absorbance in the long pathlength , L 1
- a logratiometer (16) calculates the absorbance in the short pathlength, L 2 , by comparing them to a reference signal.
- the reference signal (REF output from amplifier 18) is from a third detected light beam through a third pathlength, L 3 , or just air as shown in FIGS. 2 and 3.
- it can also be from a fixed reference voltage at the expense of increased noise on the calculated absorbances.
- the logratiometer (14) outputs the absorbance in beam 1 minus the absorbance in beam 2. Since the absorbance is proportional to pathlength, the output represents the equivalent absorbance in a pathlength of L 1 -L 2 .
- This method has the advantage of providing true dual beam performance on the path difference signal without the need for a third optics beam (the third optic beam in FIG. 2 is optional and is only necessary to provide true dual beam operation for the short pathlength).
- FIG. 3 shows an alternate configuration which only requires one logratiometer (22) wherein the three inputs (T 1 , T 2 , and T 3 ) are multiplexed by a conventional multiplexer (24) at a sufficiently high rate between the different configurations so that the different outputs are essentially acquired simultaneously.
- a microprocessor (26) is used, the logratiometers could be effected in the software.
- the A-D (22) itself take the log of the signals while converting to the digital domain for processing in the microprocessor (26), display by a control panel display (28) and subsequent digital to analog conversion by a D-A converter (30).
- FIG. 4 graphically illustrates a hypothetical response of the systems shown in FIGS. 1, 2 and 3 to a compound at different concentrations.
- the "Long path” curve shows the long path or the path difference absorbance and the “Short Path” curve shows the absorbance from the short path.
- the ratio between the two responses as shown is approximately 5 (that is, the long path or path difference is about 5 times as long as the short path).
- noticeable non linearities are exhibited when compared to the extended "Ideal Response" lines above a response of about 1 AU, which corresponds to a concentration of 4, for the long response and a concentration of 20 for the short path.
- such an extended range instrument would calculate the ratio between the two responses when both signals were linear and then multiply the short path response by the ratio (ratio value of 5 below a sample concentration of 4 as illustrated in FIG. 4).
- One continuous absorbance output then is generated from the two signals and represents the long pathlength at lower concentrations and changes over to the short path absorbance multiplied by the response ratio for higher absorbances when the long pathlength starts going nonlinear.
- the "Extended" output which represents the combination of the two absorbance signals is linear to a concentration of 20 and produces a linear response to about 5 AU relative to the long path instead of only 1 AU.
- the linear dynamic range of the L instrument is extended by a factor of 5 in this example.
- the user automatically gets the benefit of the high sensitivity (low noise) of the long pathlength for small sample concentrations and simultaneously gets the linear response to high sample concentrations from the short pathlength without having to change flow cells or switch ranges.
- a ratio of long pathlength to short pathlength of 10 would extend the linear dynamic range of an instrument by a factor of 10 by this simple technique.
- a typical HPLC detector with a pathlength ratio of 10 using this technique would have a linear dynamic range of about 1 million to 1.
- the extended signal looks to the user just as if the long pathlength had a fantastically large range.
- the short pathlength signal is simply scaled up to match the response factor of the long pathlength; therefore, the actual output is a relative absorbance rather than an absolute absorbance.
- Extending the linear range by this technique allows for two benefits.
- the first benefit is that the user does not have to change flow cells as often.
- the second benefit of this technique is that it can be used to the improve the light throughput of the optics by relaxing the requirement for narrow bandwidths. More light throughput allows the signal to noise ratio to be increased for small absorbance signals thus improving sensitivity for small absorbance changes. Since the linear range is extended for a given bandwidth, the bandwidth can be increased, allowing more light through the optics, and still allow the instrument to have a larger linear range than it would with a smaller bandwidth not using the extended range technique.
- a D is generated from the pathlength difference between the long path and the short path rather than just the long pathlength. This is preferred because it gives lower noise operation and it does not require a third optic beam for low noise operation on the long pathlength. Generally the longer path absorbance signal will deviate from Beer's Law first while the shorter path signal remains linear.
- K A is memorized in a table, as the concentration increases in the flow cell for each chromatrographic peak, K A can be used to further extend the linear dynamic range beyond the simple, first order, implementation of extended range.
- the nonlinearities in the short pathlength track those in the long pathlength for equivalent absorbances for a given peak.
- the short path signal is still linear the nonlinear nature of the long pathlength is studied and the resulting nonlinearity characteristic is used to correct the extension of the short path when it begins to experience nonlinearities.
- the nonlinear nature of the long pathlength above a concentration of 4 is tracked and memorized.
- K A memorized response ratios
- This second order correction on the response of the extended range output theoretically extends the linear dynamic range by another factor of K o such that for a path ratio of 10, the linear dynamic range could be extended by factor of 100, provided that A D continues to respond.
- K o the linear dynamic range
- a D saturates at some point and no longer responds to any further increase in absorbance in the long path since the detected signal becomes so small.
- using this second order correction technique can accurately linearize the extended range response beyond K o times the maximum value expected for A D .
- the trace labelled "Extended 2nd order" in FIG. 4 is linear to a concentration well above 50 units corresponding to a relative absorbance above 12.5 AU.
- Instantaneous (not averaged) calculated values of K o using measured absorbance values in the linear range of both absorbances can be quite different than the actual ratio of pathlengths due to various sources of error as mentioned above for K A .
- Single beam operation on the short pathlength with a relatively noisy lamp will cause the instantaneous value of K o to be noisy (single beam operation on the short path implies that only two beams are used in the system and a fixed voltage reference is used for the short pathlength as shown in FIG. 1).
- the finite separation volume between the two different pathlengths together with the change in absorbance as a function of volume causes the calculated K o to be different on different portions of a chromatographic peak.
- K o should be determined by filtering data over sufficient time or by averaging data over a sufficient number of chromatographic peaks to guarantee that a stable, accurate value that represents the true ratio of flow cell pathlengths can be calculated.
- the reference signal In the short pathlength configuration (FIG. 1) the reference signal is a fixed voltage so the lamp amplitude variations effect the absorbance signal directly.
- a 2% peak to peak lamp white noise at a 30 Hz rate translates to an absorbance noise of 1.4 ⁇ 10 -3 AU peak to peak when filtered by a 0.4 second time constant.
- the short pathlength signal is multiplied by K o when it is extended to a relative absorbance equivalent to a theoretical absorbance determined from a path difference measurement; therefore, its noise is also multiplied by K o .
- the resulting noise for the extended short pathlength absorbance will be on the order of 1 ⁇ 10 -2 AU peak to peak when filtered by a 0.4 second time constant as compared to a noise of about 2 ⁇ 10 -5 AU peak to peak for the path difference absorbance signal.
- the relative absorbance from the single beam determination of the short pathlength signal is about 500 times noisier than the dual beam determination from the longer path difference signals, it nevertheless is a useful signal.
- the path difference absorbance signal is typically linear to well over 1 AU so that an instrument with an extended range feature does not have to use the noisier short path signal until typically absorbances above 1 AU are indicated.
- the noise on the signal will typically be less than 1% when filtered by time constants above 0.4 seconds. Noise levels of this magnitude will allow chromatographic peak heights to be determined to better than 1% accuracy. Peak areas can be determined much more accurately since the noise is integrated over the width of the peak.
- the ability of an instrument to indicate relative absorbance to 10 AU and above would be very useful to chromatographers working with concentrated or large samples such as in preparative or semi-preparative liquid chromatography applications.
- K o should be stable to within 0.1% day in and day out for normal operation of the absorbance detector. There are three ways this can be done: 1.) K o can be predetermined for a given flow cell when it is constructed and this value can be manually entered into the detector by the user when the flow cell is installed in the detector. 2.) K o can be encoded on individual flow cells and automatically read as a constant by the detector. Or, 3.) K o can be automatically calculated by a detector by using the response from the two different pathlengths.
- the first two methods listed above guarantee stability of K o , however, both methods require careful determination of K o when the flow cell is fabricated which increases the manufacturing cost. In addition, the first method requires the user to enter this value into the instrument which may not always be done correctly.
- the second method although more reliable than the first, has the additional cost of an encoder.
- the third method is the lowest cost, the most convenient for the user, and theoretically, with the proper algorithm, the most accurate.
- K o must also be accurate. K o should be accurate to within 1% of its actual value.
- the short path typically has a pathlength of 0.5 to 1 mm. A 1% variation in this pathlength is equivalent to 0.005 to 0.01 mm. If a flow cell is taken apart to be rebuilt or cleaned by the user, it is possible that the spacing between the windows on the short path will change by more than 1% when the flow cell is reassembled. Such an operation would require that K o be determined again; this would require that the flow cell be sent back to the factory for such operations if methods 1 or 2 were used. Only automatic determination of K o by the detector (method 3) would guarantee that K o is determined accurately enough after a user disassembles and reassembles a flow cell.
- K o In order to automatically determine K o with a long term stability of 0.1% and an accuracy of 1% certain requirements exist when a Xe lamp, with a worst case noise of 5% peak to peak, and a flow cell with a delay volume on the order of 10 to 20 ⁇ l between the pathlengths are used. K o must be averaged over a large number of points to reduce the noise and average the derivative errors. A D and A 2 are used to determine K o only when both signals are in their linear range. Consistent errors on either signal will be transferred to K o . Therefore, it is important that both absorbance signals be accurate to within 1% and reproducible to within 0.1% when calculating K o .
- a D and A 2 are both defined to have zero absorbance at the same point in time when a user presses an auto zero button of the DYNAMAX UV-1 during baseline determination of a chromatogram as described hereinafter.
- the corresponding zero offsets both must be accurate to within 0.1% in order to assure that new calculated values for K o will be within 0.1% of the calculated values before auto zero was last pressed by the user. Since the noise on A D is so low, only one data point is required to determine its offset. However, because the noise on A 2 is large, its zero offset must be averaged over a large number of points in order to guarantee 0.1% precision in extended range.
- FIG. 5 illustrates a typical chromatogram with the absorbance signals A D ,A 2 and the extended D 2 superimposed on A D .
- the response of A 2 is one eighth that of A D so that K o is equal to 8.
- a D will not respond above its +limit because it clips at this point.
- extended range is activated, at some point before the +limit (for example: 10% of +limit) the relative absorbance, calculated from A 2 , is blended with A D .
- the contribution from A D is decreased in the blend until it makes no contribution when the +limit is reached.
- +limit the extended range output is solely determined from extending A 2 .
- the signals are blended over a finite region in order to minimize sudden discontinuities in the output due to absorbance derivative errors or small errors in the measured constants.
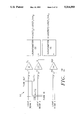
- FIG. 6a A method that has been found to be convenient with the use of a Xe flash lamp flashing at rates up to 120 Hz is illustrated in FIG. 6a with its corresponding timing diagrams illustrated in FIG. 6b.
- sample and reference photodiodes (32 and 34) are reversed biased by V-BIAS to improve their response and recovery without resulting in saturation or non linearities to light pulses from the Xe flash light source.
- the high speed current pulses (1 to 2 ⁇ s widths) are integrated by the attached capacitors (36 and 38).
- the resulting voltage across each capacitor is amplified by an amplifier (40, 42) and AC coupled into the sample and hold circuit (44, 46) for each channel.
- AC coupling essentially eliminates any effects from DC leakage currents, dark currents, offset currents or voltages in the amplifiers or photodiodes.
- Resistors (48 and 50) across each capacitor (36 and 38) essentially discharge the capacitors to zero before the next current pulse arrives.
- the voltage at the output of each sample and hold represents the integrated light flux in the pulse striking each photodiode with minimal carry over from the previous flash.
- Low carry over from the previous flash allows the detector to have an extremely fast response time and low sensitivity to lamp noise. Fast response time allows good performance in multiwavelength applications where wavelength is rapidly multiplexed.
- each sample and hold circuit goes into a comparator (52,54).
- the reference input to each comparator is connected to the output of a exponential ramp generator (56 powered from V REF).
- the outputs of each comparator connects to logic (58) which produces a gate signal to gate a high speed counter (60) on and off to generate a digital count which is proportional to the difference of the log of the reference signal and the log of the sample signal.
- FIG. 6b illustrates the timing of these signals.
- the reference and sample signals are compared to this ramp by separate comparators.
- Each comparator (52, 54) changes its output state when the ramp passes below the signal level as indicated on the timing diagram.
- the programmable logic block (58) produces the gate signal as indicated on the timing diagram as well as determines the sign bit depending on which signal is larger.
- the counter (60) is reset to zero count.
- the resulting count is proportional to the logratio of the reference signal to the sample signal (i.e.; log reference-log sample
- the counter counts a 29.376 MHz clock so that a maximum count of 454,447 counts can be accumulated in a 15.47 ms period corresponding to about 2.22 AU (10 Volts to 60 mV). This produces a resolution of about 5 ⁇ AU per count at a 60 Hz rate which is much smaller than the lowest shot noise expected from the system at this bandwidth.
- the microprocessor (26 in FIG. 3) inputs and processes the counter data and sign bit for each period with appropriate offsets and scaling factor when calculating absorbance as well as absorbance limits.
- a user defines zero AU when he presses the Auto Zero button on the control panel of the DYNAMAX UV-1. The counter count at zero AU becomes the zero offset value.
- the zero offset for a path difference signal would be the count S-R and the offset for the reference signal would be the count at R.
- the zero offset value is subtracted from the counter count when absorbance is calculated. Therefore, the +limit for absorbance count is the counter +limit minus the zero offset count.
- Absorbance counts and limit counts are scaled by the 5 ⁇ AU per count scaling factor before being outputed.
- Variance the rms precision required (i.e.; 0.1%), where rms is the root mean square which is approximately one-sixth of the peak to peak value.
- Threshold the absorbance of A D above which K o is calculated.
- the ratio of improvement can be calculated as:
- a Xe lamp with 5% peak to peak noise (0.02 AU P-P), a desired Variance of 0.1%, a K o of 8, and a Threshold of 0.5 AU will require N ⁇ 2850 points.
- the instrument should theoretically average 2850 points of A 2 in order to determine the A 2 zero offset to sufficient accuracy. This obviously is not practical to do all at once without regard to changes in the baseline since 2850 points represents 95 seconds of data at 30 Hz.
- the baseline could easily change to values other than zero in this length of time. If one assumes that the baseline is steady for at least one second after auto zero is pressed, at least 30 points can be averaged without regard to changes.
- K o is known to have an accurate value, additional points, after the initial 30, can also be averaged by correcting A 2 for changes in absorbance by subtracting the quantity (A D /K o ) from A 2 before it is averaged.
- the baseline points can be corrected for and averaged as baseline points as long as (A D ) is less than 0.3 AU (Baseline Calculate Limits shown on FIG. 5).
- the Baseline Calculate Limit should be decreased to something less than 0.3 AU.
- a baseline averaging routine based on the above method could be active all the time so that at anytime when (A D ) is less than the Baseline Calculate Limit those points would be corrected and averaged. This would allow the baseline zero offset value for A 2 to be kept current with an average of thousands of points at 30 Hz while in the extended range mode.
- the routine could also be used even if the instrument were not in an extended range mode, provided the instrument switches to the short path configuration to determine A 2 occasionally, such as once per second (during non extended range operation, the instrument should spend most of its time reading the path difference signal in order to optimize the signal to noise ratio on A D ). If K o is not known to be accurate, the baseline limit should be reduced to 0.01 AU so as not to introduce excessive errors in the averaged A 2 zero offset due to an improper K o .
- N must also be large enough to assure that both sides of a chromatographic peak are included in the average with similar weights. This is so that the errors due to the finite size of the flow cell in combination with the value of d(AU)/dV will be smoothed out and not cause excessive variations in K o . In general, the errors caused by this effect have similar magnitudes and opposite signs on either side of a peak so that the integrated error, over one peak, is approximately zero. Likewise, errors due to less than ideal sweep out characteristics of the flow cells tend to average to zero over an entire peak. Because of these facts, the ideal method would be to average K o over an entire peak.
- t 4 time when A D (t) passes through threshold on descending side of peak.
- K opeak is calculated once for each peak.
- the sum of t is simply the number of data points summed and represents the total weight for the peak. If the total peak weight is greater than about 3000 the variance due to noise from the lamp will be less than 0.1% when using a fixed voltage reference on A 2 .
- K o is only change at the end of a user definable calibration period or it can be directly changed by the user.
- a user selects when calibration takes place and the number of chromatographic peaks to be used for determining K o . In this manner, the user can control such parameters as the absorbing compound used, the wavelength monitored, and the volume width of the peaks in order to reduce errors due to non linear response on the long path and the derivative of absorbance versus volume. Reduction of these errors will result in a more accurate K o determinination.
- the number of peaks selected together with their width determines the total number of data points averaged and hence the variance of K.sub. o due to noise on the short path signal.
- the current K o is used to extend the relative absorbance and a bi-polar pulse is superimposed on the output to indicate to the user that the peaks are being used for calibration and the current K o is in question and will change at the end of the calibration period.
- the resulting Error signal is integrated over two portions.
- the first portion is the baseline determined by the value of A D compared to the Baseline Calculate Limit, and the second portion is the peak determined by the value of A D compared to the Threshold value.
- the integrated value of these two portions are compared to each other and their difference is used to adjust the value of K o .
- K o is adjusted in such a way that it nulls the difference between the two integrated signals to a zero value.
- the microprocessor (26) preferably comprises a Motorola 68000 general purpose 16-bit microprocessor
- the software routines and extended range algorithm are as depicted in FIGS. 7-11.
- the three major processes or tasks of the detector software are embodied in a function handler processor, a request processor and a control sequence processor.
- the detector software in the microprocessor (26) starts when power is turned on. This initializes the detector hardware, the operating system and the three software processors.
- the function handler receives user keyboard inputs, digital inputs and analog external wavelength inputs.
- the A/D converter (22) converts the analog voltage to a digital signal.
- the function handler takes the digital signal and converts it to a wavelength.
- the function handler reads and interprets all input data, decides what the user is asking, converts what is being asked into a request of the detector and sends requests to the request processor.
- the request processor controls the function handler and control sequence processor and executes user requests from the function handler to develop software and hardware control signals for changing wavelength and recorder and integrator range and response times.
- the control sequence processor continually repeats the following sequence:
- filter reference routine see "filter--ref" in FIGS. 11a and 11b.
- path--dif and filter--ref are executed at 1 Hz intervals or every other iteration of the control sequence when the sample passageway is approaching saturation.
- the extended range algorithm illustrated in FIG. 9 depends upon the use of a path difference flow cell. As previously described, such a cell passes a fluid sample through both a sample and a reference passageway. The extended range algorithm calculates the ratio of the path lengths as sample path length minus reference path length divided by reference path length. The path difference ratio will range from about 1.5 to 30 depending on the design of the flow cell.
- a path difference ratio Once a path difference ratio is established, it can be used to continue the calculation of a relative absorbance after the sample path saturates by then multiplying the reference path absorbance by the path difference ratio.
- the extended range routine is used to effect such a calculation of relative absorbance when the recorder output time response is greater than or equal to 1.0 second and the recorder range is greater than or equal to 1.5 AU full scale.
- FIG. 7 is a rather general flow chart of the flow processing sequence
- FIG. 8 illustrates a more detailed version of the control processing sequence for the FIG. 3 detector system.
- A(D) and A(2) are referenced. They are the same as the previously described, A D (the measured path difference absorbance) and A 2 (the measured short path absorbance).
- the reference routines filter--path, path--dif and extend--range are the routines illustrated in flow chart form in FIGS. 9 and 11a and 11b.
- the referenced calibrating mode "calc--ratio" in FIG. 9 is the routine illustrated in the flow chart of FIG. 10.
- the path difference routine is executed whenever a logratio and a reference absorbance reading have been made. Such readings are used to calculate the path difference ratio K o when a ratio calibration period has been requested by the user.
- the purpose of the routine is to calculate a path difference ratio for the flow cell used in the detector system for each chromatographic peak occurring during a ratio calibration period. The calculation is executed when the sample path is not saturated and there is an absorbance greater that 0.5 AU. If the sample path is saturated, the routine path--dif provides and indication that saturation has occurred. If the sample path has not reached saturation and there is enough absorbance, the path difference routine calculates the path difference ratio for each data set and sums all such ratio reading over an entire absorbance peak.
- a peak is defined as beginning when the absorbance is equal to or greater than 0.5 AU and as ending when the absorbance falls below 0.4 AU.
- an average ratio is calculated ("peakK o "), and saved in the system along with its weight (W) for further processing to determine K o at the end of the calibration period.
- the extended range routine illustrated in FIG. 9 inputs a logratio reading of the path difference absorbance A D and the short or reference path absorbance A 2 .
- the routine calculates a relative absorbance reading (A 1 ' previously described) which may be smoothed before the sample path saturates or computed from the short or reference path absorbance only.
- a D is not equal to or greater that its +Limit
- the routine calculates a blending or smoothing ratio r which specifies the percentage of the short reference path absorbance A 2 to be used in calculating the absorbance A 1 '.
- the extended range routine calculates a new absorbance value based upon the short path absorbance only. If sample path saturation has not occurred, the routine will use a portion of A D and A 2 to determine the absorbance output A 1 '. Preferably, blending is accomplished when A D is between 10 and 100% of saturation.
- FIG. 10 illustrates the ratio calibration algorithm for the calculation of the path difference ratio, K o .
- this routine (calc ratio) is scheduled by the path--dif routine after Ratio Calculation has calculated and saved the required number of peak values which defines the end of the ratio calibration period.
- the calc--ratio routine waits for the Ratio Calibration to be complete and then finds the peak average of all the accepted peak ratios. From such findings, the routine locates the individual peak ratio that diverges from the average the most and is over 2% in its divergence. Any such divergent peak ratio is marked as unacceptable and K o is calculated again without the marked peak. The above process is repeated until no such divergent peak ratios are found.
- the resulting calibrated peak difference ratio K o is set to the saved average peak ratio and is not changed again until the user decides to repeat the ratio calibration period.
- the routine includes the subroutine of filter reference, whether or not the extended range routine is to be executed.
- the filter reference routine (filter--ref) is as illustrated in the flow charts of FIGS. 11a and 11b.
- the filter--ref routine is input absorbance A D , short path absorbance A 2 and an extended range mode indicator.
- the purpose of the routine is to generate a reference path offset.
- the routine averages the reference path absorbance A 2 and filter the value as long as the absorbance is less than 0.01 AU (or 0.1 AU if the path difference ratio K o is good). More particularly, at autozero, filter--ref averages at most 100 reference data points to generate a new reference offset. This value is flagged as good and is used by path--dif in calculating the path difference ratio.
- the filter--ref routine continues to filter the reference offset as long as the absorbance is not above 0.01 AU or 0.1 AU if the path difference ratio is accurate.
- the reference offset must be recalculated for the new wavelength.
- the filter--ref routine does this by filtering the reference offset with reference data points for a minimum of 7500 times. Such filtering is accomplished only if the absorbance is below the previously described limits. Until a new reference offset is established for the new wavelength, the flag is set to bad and no ratio calculations are performed in the path--dif routine and no reference data extensions are computed in the extend--range routine.
- V d the effective delay volume between the two different pathlengths
- V d /f can be determined when K o is substituted for K A and the left hand side of the above equation is averaged over an entire peak.
- K A can be calculated real time from the above equation once V d /f is known from the previous peak (assuming that A 2 is a low noise signal). For safer, more fail proof operation the detector should be given the actual flow rate from the system pump.
- a preferred method for applying the second order correction to extended range is to use a third pathlength in a third optic beam as illustrated in FIG. 3.
- a short pathlength functioning as a first short pathlength (L 3 ) is added in series with the first two pathlengths (L 1 , L 2 ) on the opposite side of the long pathlength (L 1 ).
- K o (1,2), K o (1,3) and k can be determined very accurately with averaged data over many complete peaks. From the above equations the real time K A (1,2) and K A (1,3) can be determined from measured values as follows:
- K A (1,2) and K A (1,3) values should be stored in a table along with the associated value of A 1 for each ascending side of a peak so that they can be used for calculating the relative absorbance in extended range for the same peak.
- Extended range relative absorbances with second order correction can be determined with any of the following three equations:
- the last equation takes the average of extended relative absorbance from both short pathlengths which, in general, should be more accurate.
- the average relative absorbance also averages out any time shift between A 1 and A 1 extended due to V d .
- the third equation is the preferred equation to use because of its improved accuracy.
- a D (1,2) or A D (1,3) can be substituted for A 1 with appropriate changes to the above equations without effecting the end result of a second order corrected extended range.
- the three pathlength flow cell can be constructed so that it contains only one short pathlength which is placed between two longer pathlengths as illustrated in FIG. 2.
- the triple pathlength system described above for second order correction to extended range also has some unique advantages in normal (non extended range) operation when the signals are properly combined.
- An ideal absorbance detector should not respond to the refractive index (RI) or the derivatives of RI of the sample fluid.
- Absorbance detectors designed to have low RI sensitivity still have residue sensitivity to RI, especially steep RI gradients or derivatives of RI.
- the pathdifference absorbance signal from a dual beam, dual pathlength flow cell absorbance detector (described earilier and illustrated in FIG. 2) still has a small residual sensitivity to RI derivatives. The sign of the error due to changes in RI is determined by the direction of flow through the flow cell. Signals from triple pathlength flow cells illustrated in FIG. 3 and FIG.
Landscapes
- Physics & Mathematics (AREA)
- Engineering & Computer Science (AREA)
- Mathematical Physics (AREA)
- Theoretical Computer Science (AREA)
- Spectroscopy & Molecular Physics (AREA)
- Health & Medical Sciences (AREA)
- Life Sciences & Earth Sciences (AREA)
- Chemical & Material Sciences (AREA)
- Analytical Chemistry (AREA)
- Biochemistry (AREA)
- General Health & Medical Sciences (AREA)
- General Physics & Mathematics (AREA)
- Immunology (AREA)
- Pathology (AREA)
- Investigating Or Analysing Materials By Optical Means (AREA)
Abstract
Description
A=εcl
A=log(I.sub.o /I) (Beer's Law)
and:
I.sub.o /I=1/T (Definition of transmittance)
A.sub.D /A.sub.2 =(εcl.sub.1 -εcl.sub.2)/εcl.sub.2 =(l.sub.1 -l.sub.2)l.sub.2 =K.sub.o
K.sub.A =A.sub.D /A.sub.2
Ideal Extended Response (long path)=K.sub.o.sup.2 *A.sub.2 /K.sub.A
Averaged Baseline Noise(P--P)≦6*Variance*Threshold/K.sub.o
Noise Ratio=Fast Noise/Averaged Baseline Noise
Fast Noise=the noise on A.sub.2 with no averaging
N≧(Fast Noise*K.sub.o /6*Variance*Threshold).sup.2
K.sub.o Noise Ratio=Fast Noise*K.sub.o /6*Variance*A.sub.D
N≧(Fast Noise*K.sub.o /6*Variance*A.sub.D).sup.2
Error=A.sub.D -A.sub.2 *K.sub.o
A.sub.2 *K.sub.A =A.sub.1 +V.sub.d *(dA.sub.1 /dV)
(dA.sub.1 /dV)=(dA.sub.1 /dt)/f
(A.sub.2 *K.sub.A -A.sub.1)/(dA.sub.1 /dt)=v.sub.d /f
A.sub.2 *K.sub.A(1,2) =A.sub.1 +V.sub.d(1,2) *(dA.sub.1 /dV)
A.sub.3 *K.sub.A(1,3) =A.sub.1 -V.sub.d(1,3) *(dA.sub.1 /dV)
Rearranging:
(A.sub.1 -A.sub.2 *K.sub.A(1,2))/(dA.sub.1 /dV)=-V.sub.d(1,2)
(A.sub.1 -A.sub.3 *K.sub.A(1,3))/(dA.sub.1 /dV)=V.sub.d(1,3)
By flow cell construction:
V.sub.d(1,2) =V.sub.d(1,3)
Therefore:
A.sub.1 -A.sub.2 *K.sub.A(1,2) =-A.sub.1 +A.sub.3 *K.sub.A(1,3)
Or:
A.sub.1 =(A.sub.3 *K.sub.A(1,3) +A.sub.2 *K.sub.A(1,2))/2
K.sub.A(1,2) /K.sub.A(1,3) =K.sub.o(1,2) /K.sub.o(1,3) =l.sub.3 /l.sub.2 =k(a constant)
K.sub.A(1,3) =2A.sub.1 /(A.sub.3 +k*A.sub.2)
K.sub.A(1,2) =2A.sub.1 /(A.sub.2 +A.sub.3 /k)
A.sub.1 extended=K.sub.o(1,3).sup.2 *A.sub.3 /K.sub.A(1,3)
A.sub.1 extended=K.sub.o(1,2).sup.2 *A.sub.2 /K.sub.A(1,2)
or
A.sub.1 extended=(K.sub.o(1,3).sup.2 *A.sub.3 /K.sub.A(1,3) +K.sub.o(1,2).sup.2 *A.sub.2 /K.sub.A(1,2))/2
Claims (18)
Priority Applications (1)
| Application Number | Priority Date | Filing Date | Title |
|---|---|---|---|
| US07/610,416 US5214593A (en) | 1990-11-07 | 1990-11-07 | Method and apparatus for extending the linear dynamic range of absorbance detectors including multi-lightpath flow cells |
Applications Claiming Priority (1)
| Application Number | Priority Date | Filing Date | Title |
|---|---|---|---|
| US07/610,416 US5214593A (en) | 1990-11-07 | 1990-11-07 | Method and apparatus for extending the linear dynamic range of absorbance detectors including multi-lightpath flow cells |
Publications (1)
| Publication Number | Publication Date |
|---|---|
| US5214593A true US5214593A (en) | 1993-05-25 |
Family
ID=24444926
Family Applications (1)
| Application Number | Title | Priority Date | Filing Date |
|---|---|---|---|
| US07/610,416 Expired - Lifetime US5214593A (en) | 1990-11-07 | 1990-11-07 | Method and apparatus for extending the linear dynamic range of absorbance detectors including multi-lightpath flow cells |
Country Status (1)
| Country | Link |
|---|---|
| US (1) | US5214593A (en) |
Cited By (23)
| Publication number | Priority date | Publication date | Assignee | Title |
|---|---|---|---|---|
| WO1998045575A1 (en) * | 1997-04-10 | 1998-10-15 | Schlumberger Technology B.V. | Method and apparatus for the downhole compositional analysis of formation gases |
| WO2000031512A1 (en) * | 1998-11-20 | 2000-06-02 | Waters Investments Limited | Dual pathlength system for light absorbance detection |
| US6191421B1 (en) * | 1996-10-03 | 2001-02-20 | Nihon Kohden Corporation | Gas analyzer using infrared radiation to determine the concentration of a target gas in a gaseous mixture |
| US20060233546A1 (en) * | 2004-08-04 | 2006-10-19 | Finisar Corporation | Methods for testing optical transmitter components |
| WO2006125470A1 (en) * | 2005-05-24 | 2006-11-30 | Agilent Technologies, Inc. | Multi-path flow cell correction |
| EP1354195B1 (en) * | 2001-01-26 | 2008-08-13 | Smithkline Beecham Corporation | System and method for in vitro analysis of therapeutic agents |
| DE102008001096A1 (en) | 2008-04-09 | 2008-09-11 | Agilent Technologies Inc., Santa Clara | Signal sequences evaluating method for use during e.g. high performance liquid chromatography process, involves comparing characteristic of event with preset threshold, and combining signal sequences or their events by selection of events |
| US20120069340A1 (en) * | 2009-05-20 | 2012-03-22 | Agilent Technologies, Inc. | Flow cell exploiting radiation within cell wall |
| US20120127470A1 (en) * | 2010-11-21 | 2012-05-24 | Reach Devices | Optical System Design for Wide Range Optical Density Measurements |
| WO2012163416A1 (en) | 2011-05-31 | 2012-12-06 | Agilent Technologies, Inc. | Expanded linear range by use of two flow cell detectors with long and short parh |
| WO2014021099A1 (en) * | 2012-08-03 | 2014-02-06 | 株式会社 日立ハイテクノロジーズ | Liquid chromatographic analyzer |
| EP2767821A1 (en) * | 2013-02-15 | 2014-08-20 | B. Braun Avitum AG | Photometric measuring device and method for measuring an optical absorbency of a fluid with a variable concentration of at least one light absorbent substance, and blood processing device with such a measuring device |
| US20150238672A1 (en) * | 2014-02-24 | 2015-08-27 | Fresenius Medical Care Holdings, Inc. | Self calibrating blood chamber |
| CN105308451A (en) * | 2013-08-05 | 2016-02-03 | 株式会社岛津制作所 | Data processing device for chromatograph and data processing method for chromatograph |
| EP3199937A1 (en) * | 2016-01-28 | 2017-08-02 | Minitüb GmbH | Counting compartment and method for sample analysis |
| WO2017144607A1 (en) * | 2016-02-23 | 2017-08-31 | Ge Healthcare Bio-Sciences Ab | A method and a measuring device for measuring the absorbance of a substance in at least one solution |
| WO2018087279A1 (en) * | 2016-11-11 | 2018-05-17 | Mikrowellen Labor Technik Ag | Spectrometer having a discharge lamp with a plurality of beam paths |
| US20210080368A1 (en) * | 2019-09-12 | 2021-03-18 | Cytonome/St, Llc | Systems and methods for extended dynamic range detection of light |
| JP2021515239A (en) * | 2017-12-23 | 2021-06-17 | ルマサイト リミティド ライアビリティ カンパニー | Microfluidic chip device Microfluidic chip device for photopower measurement and cell imaging using dynamics |
| WO2021249725A1 (en) | 2020-06-08 | 2021-12-16 | Cytiva Sweden Ab | Method and apparatus for determining optical density of a solution |
| WO2021254889A1 (en) | 2020-06-16 | 2021-12-23 | Cytiva Sweden Ab | Optical flow cell for bioprocessing |
| US11543344B2 (en) * | 2016-02-26 | 2023-01-03 | Cytiva Sweden Ab | Apparatus and method for measuring the light absorbance of a substance in a solution |
| US11913870B2 (en) | 2017-12-23 | 2024-02-27 | Lumacyte, Inc. | Microfluidic chip device for optical force measurements and cell imaging using microfluidic chip configuration and dynamics |
Citations (6)
| Publication number | Priority date | Publication date | Assignee | Title |
|---|---|---|---|---|
| US4348115A (en) * | 1980-02-15 | 1982-09-07 | Phillips Petroleum Company | Chromatographic analyzer detector and method |
| US4581714A (en) * | 1983-09-09 | 1986-04-08 | Sensormedics Corporation | Method of calibrating and linearizing the output of fluid measuring instruments |
| US4587624A (en) * | 1981-12-24 | 1986-05-06 | Olympus Optical Co., Ltd. | Method and apparatus for correcting a curve relating an absorbance to a concentration |
| US4815847A (en) * | 1986-03-08 | 1989-03-28 | Gruen Optik Wetzlar Gmbh | Process and device for the generation of a linearly dependent measurement signal |
| US4848904A (en) * | 1988-02-16 | 1989-07-18 | Applied Biosystems Inc. | Dual beam multichannel spectrophotometer with a unique logarithmic data converter |
| US4935875A (en) * | 1987-12-02 | 1990-06-19 | Data Chem, Inc. | Chemical analyzer |
-
1990
- 1990-11-07 US US07/610,416 patent/US5214593A/en not_active Expired - Lifetime
Patent Citations (6)
| Publication number | Priority date | Publication date | Assignee | Title |
|---|---|---|---|---|
| US4348115A (en) * | 1980-02-15 | 1982-09-07 | Phillips Petroleum Company | Chromatographic analyzer detector and method |
| US4587624A (en) * | 1981-12-24 | 1986-05-06 | Olympus Optical Co., Ltd. | Method and apparatus for correcting a curve relating an absorbance to a concentration |
| US4581714A (en) * | 1983-09-09 | 1986-04-08 | Sensormedics Corporation | Method of calibrating and linearizing the output of fluid measuring instruments |
| US4815847A (en) * | 1986-03-08 | 1989-03-28 | Gruen Optik Wetzlar Gmbh | Process and device for the generation of a linearly dependent measurement signal |
| US4935875A (en) * | 1987-12-02 | 1990-06-19 | Data Chem, Inc. | Chemical analyzer |
| US4848904A (en) * | 1988-02-16 | 1989-07-18 | Applied Biosystems Inc. | Dual beam multichannel spectrophotometer with a unique logarithmic data converter |
Non-Patent Citations (2)
| Title |
|---|
| Goraczko, A. et al., "The Universal Analytical-Preparative Flow Cell", Journal of High Resolution Chromatography & Chromatography Communications, vol. 9, p. 255 (Apr. 1986). |
| Goraczko, A. et al., The Universal Analytical Preparative Flow Cell , Journal of High Resolution Chromatography & Chromatography Communications, vol. 9, p. 255 (Apr. 1986). * |
Cited By (41)
| Publication number | Priority date | Publication date | Assignee | Title |
|---|---|---|---|---|
| US6191421B1 (en) * | 1996-10-03 | 2001-02-20 | Nihon Kohden Corporation | Gas analyzer using infrared radiation to determine the concentration of a target gas in a gaseous mixture |
| US5859430A (en) * | 1997-04-10 | 1999-01-12 | Schlumberger Technology Corporation | Method and apparatus for the downhole compositional analysis of formation gases |
| WO1998045575A1 (en) * | 1997-04-10 | 1998-10-15 | Schlumberger Technology B.V. | Method and apparatus for the downhole compositional analysis of formation gases |
| WO2000031512A1 (en) * | 1998-11-20 | 2000-06-02 | Waters Investments Limited | Dual pathlength system for light absorbance detection |
| US6342948B1 (en) | 1998-11-20 | 2002-01-29 | Waters Investments Limited | Dual pathlength system for light absorbance detection |
| EP1354195B1 (en) * | 2001-01-26 | 2008-08-13 | Smithkline Beecham Corporation | System and method for in vitro analysis of therapeutic agents |
| US7414386B2 (en) * | 2004-08-04 | 2008-08-19 | Finisar Corporation | Methods for testing optical transmitter components |
| US20060233546A1 (en) * | 2004-08-04 | 2006-10-19 | Finisar Corporation | Methods for testing optical transmitter components |
| US7847944B2 (en) | 2005-05-24 | 2010-12-07 | Agilent Technologies, Inc. | Multi-path flow cell correction |
| WO2006125470A1 (en) * | 2005-05-24 | 2006-11-30 | Agilent Technologies, Inc. | Multi-path flow cell correction |
| DE102008001096A1 (en) | 2008-04-09 | 2008-09-11 | Agilent Technologies Inc., Santa Clara | Signal sequences evaluating method for use during e.g. high performance liquid chromatography process, involves comparing characteristic of event with preset threshold, and combining signal sequences or their events by selection of events |
| US20120069340A1 (en) * | 2009-05-20 | 2012-03-22 | Agilent Technologies, Inc. | Flow cell exploiting radiation within cell wall |
| US20120127470A1 (en) * | 2010-11-21 | 2012-05-24 | Reach Devices | Optical System Design for Wide Range Optical Density Measurements |
| US8570521B2 (en) * | 2010-11-21 | 2013-10-29 | Reach Devices, LLC | Optical system design for wide range optical density measurements |
| WO2012163416A1 (en) | 2011-05-31 | 2012-12-06 | Agilent Technologies, Inc. | Expanded linear range by use of two flow cell detectors with long and short parh |
| CN103582813A (en) * | 2011-05-31 | 2014-02-12 | 安捷伦科技有限公司 | Expanded linear range by use of two flow cell detectors with long and short path |
| WO2014021099A1 (en) * | 2012-08-03 | 2014-02-06 | 株式会社 日立ハイテクノロジーズ | Liquid chromatographic analyzer |
| EP2767821A1 (en) * | 2013-02-15 | 2014-08-20 | B. Braun Avitum AG | Photometric measuring device and method for measuring an optical absorbency of a fluid with a variable concentration of at least one light absorbent substance, and blood processing device with such a measuring device |
| JP6011729B2 (en) * | 2013-08-05 | 2016-10-19 | 株式会社島津製作所 | Chromatograph data processing apparatus and chromatographic data processing method |
| US10309940B2 (en) | 2013-08-05 | 2019-06-04 | Shimadzu Corporation | Data processing device for chromatograph and data processing method for chromatograph |
| CN105308451A (en) * | 2013-08-05 | 2016-02-03 | 株式会社岛津制作所 | Data processing device for chromatograph and data processing method for chromatograph |
| US9308306B2 (en) * | 2014-02-24 | 2016-04-12 | Fresenius Medical Care Holdings, Inc. | Self calibrating blood chamber |
| US9849225B2 (en) * | 2014-02-24 | 2017-12-26 | Fresenius Medical Care Holdings, Inc. | Self calibrating blood chamber |
| US20150238672A1 (en) * | 2014-02-24 | 2015-08-27 | Fresenius Medical Care Holdings, Inc. | Self calibrating blood chamber |
| US20160158427A1 (en) * | 2014-02-24 | 2016-06-09 | Fresenius Medical Care Holdings, Inc. | Self calibrating blood chamber |
| US10768087B2 (en) | 2016-01-28 | 2020-09-08 | Minitub Gmbh | Counting compartment and method for sample analysis |
| EP3199937A1 (en) * | 2016-01-28 | 2017-08-02 | Minitüb GmbH | Counting compartment and method for sample analysis |
| WO2017129819A1 (en) * | 2016-01-28 | 2017-08-03 | Minitüb GmbH | Counting compartment and method for sample analysis |
| WO2017144607A1 (en) * | 2016-02-23 | 2017-08-31 | Ge Healthcare Bio-Sciences Ab | A method and a measuring device for measuring the absorbance of a substance in at least one solution |
| US11499913B2 (en) | 2016-02-23 | 2022-11-15 | Cytiva Sweden Ab | Method and device for measuring absorbance of a substance in solution with multiple light rays |
| US11543344B2 (en) * | 2016-02-26 | 2023-01-03 | Cytiva Sweden Ab | Apparatus and method for measuring the light absorbance of a substance in a solution |
| US20190391072A1 (en) * | 2016-11-11 | 2019-12-26 | Mikrowellen Labor Technik Ag | Spectrometer Having a Discharge Lamp with a Plurality of Beam Paths |
| US11085873B2 (en) * | 2016-11-11 | 2021-08-10 | Mikrowellen Labor Technik Ag | Spectrometer having a discharge lamp with a plurality of beam paths |
| CN110114655A (en) * | 2016-11-11 | 2019-08-09 | 微波实验室技术股份公司 | Spectrometer with the discharge lamp with multiple optical paths |
| WO2018087279A1 (en) * | 2016-11-11 | 2018-05-17 | Mikrowellen Labor Technik Ag | Spectrometer having a discharge lamp with a plurality of beam paths |
| JP2021515239A (en) * | 2017-12-23 | 2021-06-17 | ルマサイト リミティド ライアビリティ カンパニー | Microfluidic chip device Microfluidic chip device for photopower measurement and cell imaging using dynamics |
| US11913870B2 (en) | 2017-12-23 | 2024-02-27 | Lumacyte, Inc. | Microfluidic chip device for optical force measurements and cell imaging using microfluidic chip configuration and dynamics |
| US20210080368A1 (en) * | 2019-09-12 | 2021-03-18 | Cytonome/St, Llc | Systems and methods for extended dynamic range detection of light |
| US11959847B2 (en) * | 2019-09-12 | 2024-04-16 | Cytonome/St, Llc | Systems and methods for extended dynamic range detection of light |
| WO2021249725A1 (en) | 2020-06-08 | 2021-12-16 | Cytiva Sweden Ab | Method and apparatus for determining optical density of a solution |
| WO2021254889A1 (en) | 2020-06-16 | 2021-12-23 | Cytiva Sweden Ab | Optical flow cell for bioprocessing |
Similar Documents
| Publication | Publication Date | Title |
|---|---|---|
| US5214593A (en) | Method and apparatus for extending the linear dynamic range of absorbance detectors including multi-lightpath flow cells | |
| US4998018A (en) | Two-wavelength type respiratory gas concentration measuring apparatus | |
| US4627008A (en) | Optical quantitative analysis using curvilinear interpolation | |
| US6107631A (en) | Self-calibration approach for tunable laser spectral absorption sensors | |
| JPH0255741B2 (en) | ||
| CA2026327C (en) | Spectrophotometric instrument with rapid scanning distortion correction | |
| US5387979A (en) | Spectrophotometric method and spectrophotometer for performing the method | |
| JPH0427494B2 (en) | ||
| US4596931A (en) | Method of eliminating measuring errors in photometric analysis | |
| KR20000029101A (en) | Process and device for measuring the amount of impurities in a gas sample to be analysed | |
| US5801829A (en) | Method for measurment and compensation of stray light in a spectrometer | |
| DE3116344C2 (en) | ||
| JP2001516016A (en) | NDIR photometer for measuring multiple components | |
| EP0261452B1 (en) | Gas analyzer | |
| EP0420858B1 (en) | An improved set point control circuit for an infrared gas analyzer | |
| GB2059574A (en) | Absorption cell gas monitor | |
| JP3314630B2 (en) | Chromatographic apparatus and chromatographic analysis method | |
| US4145139A (en) | Zig zag scanning densitometer with base line and impurity correction | |
| US4417812A (en) | Circuit arrangement for determining the characteristics of liquids and/or gases, in particular the hemoglobin content of the blood | |
| JPH0249459B2 (en) | KYUKOBUNSEKIKEI | |
| US6411380B1 (en) | Detection device for a spectrophotometer | |
| JPH0943056A (en) | Instrument for measuring intensity of light | |
| EP0227038A2 (en) | Atomic absorption spectrophotometer | |
| JPH0720584Y2 (en) | UV detector | |
| SU1695142A1 (en) | Photometer for measurement of substance concentration with the use of indication strips |
Legal Events
| Date | Code | Title | Description |
|---|---|---|---|
| AS | Assignment |
Owner name: RAININ INSTRUMENT CO., INC., CALIFORNIA Free format text: ASSIGNMENT OF ASSIGNORS INTEREST.;ASSIGNORS:MAGNUSSEN, HAAKON T. JR.;MOELLER, ROY P.;REEL/FRAME:005507/0366 Effective date: 19901107 |
|
| STCF | Information on status: patent grant |
Free format text: PATENTED CASE |
|
| FEPP | Fee payment procedure |
Free format text: PAT HLDR NO LONGER CLAIMS SMALL ENT STAT AS SMALL BUSINESS (ORIGINAL EVENT CODE: LSM2); ENTITY STATUS OF PATENT OWNER: LARGE ENTITY |
|
| FPAY | Fee payment |
Year of fee payment: 4 |
|
| AS | Assignment |
Owner name: VARIAN ASSOCIATES, INC., CALIFORNIA Free format text: ASSIGNMENT OF ASSIGNORS INTEREST;ASSIGNOR:RAININ INSTRUMENTS CO., INC.;REEL/FRAME:009570/0263 Effective date: 19981015 |
|
| AS | Assignment |
Owner name: VARIAN, INC., CALIFORNIA Free format text: ASSIGNMENT OF ASSIGNORS INTEREST;ASSIGNOR:VARIAN ASSOCIATES, INC;REEL/FRAME:009901/0890 Effective date: 19990406 |
|
| FEPP | Fee payment procedure |
Free format text: PAYOR NUMBER ASSIGNED (ORIGINAL EVENT CODE: ASPN); ENTITY STATUS OF PATENT OWNER: LARGE ENTITY |
|
| FPAY | Fee payment |
Year of fee payment: 8 |
|
| FPAY | Fee payment |
Year of fee payment: 12 |
|
| AS | Assignment |
Owner name: AGILENT TECHNOLOGIES, INC., CALIFORNIA Free format text: ASSIGNMENT OF ASSIGNORS INTEREST;ASSIGNOR:VARIAN, INC.;REEL/FRAME:025368/0230 Effective date: 20101029 |