US20180217221A1 - Method for calibrating a radio frequency test instrument and radio frequency test instrument - Google Patents
Method for calibrating a radio frequency test instrument and radio frequency test instrument Download PDFInfo
- Publication number
- US20180217221A1 US20180217221A1 US15/419,869 US201715419869A US2018217221A1 US 20180217221 A1 US20180217221 A1 US 20180217221A1 US 201715419869 A US201715419869 A US 201715419869A US 2018217221 A1 US2018217221 A1 US 2018217221A1
- Authority
- US
- United States
- Prior art keywords
- frequency
- radio frequency
- matrix
- frequency response
- measurement
- Prior art date
- Legal status (The legal status is an assumption and is not a legal conclusion. Google has not performed a legal analysis and makes no representation as to the accuracy of the status listed.)
- Granted
Links
- 238000012360 testing method Methods 0.000 title claims abstract description 49
- 238000000034 method Methods 0.000 title claims abstract description 40
- 238000005259 measurement Methods 0.000 claims abstract description 140
- 239000011159 matrix material Substances 0.000 claims abstract description 96
- 238000012545 processing Methods 0.000 claims description 8
- 238000001228 spectrum Methods 0.000 claims description 4
- 230000007274 generation of a signal involved in cell-cell signaling Effects 0.000 claims description 3
- 238000012937 correction Methods 0.000 description 5
- 238000010586 diagram Methods 0.000 description 5
- 238000013500 data storage Methods 0.000 description 2
- 238000004364 calculation method Methods 0.000 description 1
- 230000004936 stimulating effect Effects 0.000 description 1
- 239000011800 void material Substances 0.000 description 1
Images


Classifications
-
- G—PHYSICS
- G01—MEASURING; TESTING
- G01R—MEASURING ELECTRIC VARIABLES; MEASURING MAGNETIC VARIABLES
- G01R35/00—Testing or calibrating of apparatus covered by the other groups of this subclass
- G01R35/005—Calibrating; Standards or reference devices, e.g. voltage or resistance standards, "golden" references
-
- G—PHYSICS
- G01—MEASURING; TESTING
- G01R—MEASURING ELECTRIC VARIABLES; MEASURING MAGNETIC VARIABLES
- G01R23/00—Arrangements for measuring frequencies; Arrangements for analysing frequency spectra
- G01R23/16—Spectrum analysis; Fourier analysis
Definitions
- the invention relates to a method for calibrating a radio frequency test instrument and a radio frequency test instrument.
- radio frequency test instrument for instance a spectrum analyzer
- hardware imperfection such as a frequency response being not perfectly flat.
- the frequency response can be measured at the customer in the field using a so called “self-alignment” function or in the factory using a so called “factory calibration”.
- the frequency response can be compensated during operation of the radio frequency test instrument by adjusting at least one filter appropriately which inverts the frequency response. For instance, an equalization filter is applied for compensating purposes.
- the goal is to have a very fine resolution for the equalization filters over the measurement bandwidth and a very good fitting equalization filter for the radio frequencies to be processed by the radio frequency test instrument.
- the frequency response is influenced by an intermediate frequency part and a radio frequency part.
- the part of the frequency response originating from the radio frequency path of the analyzer is relatively flat within a bandwidth of 1 GHz, for instance.
- this flat frequency response is superposed by a frequency response of the intermediate frequency with higher ripples over the corresponding bandwidth.
- both influences cannot be measured separately as they depend on each other.
- the resulting frequency response of the radio frequency test instrument can be separated in a so called fast influence and a so called slow influence for every single radio frequency tested.
- a signal generator and a power meter are used.
- the signal generator transmits a single tone at a known frequency.
- the actual power of the tone is measured with the power meter in order to determine the frequency response.
- this measurement takes a long time for determining the frequency response for a high bandwidth.
- Another method relates to the usage of an external comb generator that has to be calibrated initially for the different radio frequencies.
- the calibration takes some time and, further, a void calibration of said comb generator results in radio frequency test instruments being calibrated inappropriately. Particularly, factory calibrated radio frequency test instruments would have to be returned for recalibration purposes.
- a drifting of the comb generator over the time has to be taken into account while calibrating radio frequency test instruments.
- Another method relates to an intermediate filter calculation as a fine frequency response measurement is performed such that the frequency response can be calculated with high accuracy for a few radio frequencies in order to set the equalization filter with regard to the determined frequency response. Then, a coarse frequency response measurement is performed while the equalization filters are set and applied. The frequency response is calculated again and the settings for the equalization filters are determined again. Afterwards, both settings for the equalization filters are combined and applied.
- the calibration time increases with the number of fine frequency response measurements performed, in particular the number of different radio frequencies used for the fine frequency response measurement.
- the fine and coarse measurement depend from each other resulting in a possible propagation of errors.
- the equalization filters have to be set and applied for the coarse measurements which may also result in an additional error source.
- the invention provides a method for calibrating a radio frequency test instrument, with the following steps:
- the invention provides a radio frequency test instrument being configured to perform a method as described above.
- said radio frequency test instrument is at least one of a spectrum analyzer, an oscilloscope and any other suitable test instrument.
- the invention is based on the finding that the calibration can be done fast and with high accuracy while performing two different measurements using different radio frequency and intermediate frequency grids, in particular with regard to the intermediate frequency grid.
- the first measurement relating to the first frequency response ensures a high absolute accuracy.
- the first measurement usually takes long as it provides a high absolute accuracy.
- the second measurement is done in a very fast manner such that a fine intermediate frequency grid can be used.
- the absolute accuracy of the second measurement is reduced with regard to the first measurement.
- the data obtained by these different measurements are combined with each other in order to use the information in a most efficient manner such that a frequency response with fine resolution is acquired for the radio frequency desired.
- the frequency response determined may be a very detailed one.
- the first frequency response measurement is done with a coarse radio frequency and coarse intermediate frequency grid whereas the second frequency response measurement is done with a fine radio frequency and fine intermediate frequency grid.
- the first frequency response measurement is done with a fine radio frequency and coarse intermediate frequency grid whereas the second frequency response measurement is done with a coarse radio frequency and fine intermediate frequency grid.
- the radio frequency grid applied depends on the radio frequency test instrument used. Accordingly, the grids for the first and second frequency response measurements are also called fine intermediate frequency grid and coarse intermediate frequency grid respectively in order to emphasize that the resolution of the radio frequencies during these measurements may be coarse or fine.
- the matrices with representative points have to be very dense in order to get a complete representation of the frequency responses for all input frequencies within the required accuracy. However, that would result in a very long calibration cycle, both in factory calibration and in self alignment. To reduce the calibration time, the corresponding frequency response is interpolated from a less dense matrix which can be measured in a reasonable time. Generally, the user can select a certain radio frequency as the desired one wherein this radio frequency is used for interpolating the measurement points of the dedicated matrix.
- the first matrix is interpolated in the direction of the radio frequency desired wherein the first matrix relates to the first frequency response measurement having a high accuracy, but reduced number of measurement values in order ensure that the first frequency response can be done in a reasonable time.
- the interpolation in the direction of the radio frequency desired is done such that the grids of both matrices correspond to each other with regard to the direction of the radio frequency desired. This ensures that both matrices can be compared and combined easily, in particular with regard to the radio frequency desired.
- no interpolation is necessary if the radio frequency desired is already part of the measured first matrix and/or the measured second matrix.
- an adapted version of said second matrix may be generated comprising the measurement points corresponding to said radio frequency and coarse intermediate frequency grid. Accordingly, the second matrix relating to the radio frequency and fine intermediate frequency can be reduced such that a subsampled version is provided which relates to a virtual coarse measurement that can be used for comparing with the first matrix being measured in a coarse manner, in particular by using a coarse intermediate frequency grid.
- the subsampled version of the second matrix and the first matrix substantially have the same density with regard to the intermediate frequency direction. Accordingly, both matrices can be combined easily.
- the adapted version can be obtained by interpolating the data of the second matrix from a fine grid to a coarse grid.
- said adapted version and said first matrix are processed in order to obtain a coarse difference matrix.
- the adapted version is subtracted from said first matrix with regard to the amplitudes in dB. If the amplitudes are in the linear domain, the first matrix is divided by said adapted version.
- This processing step provides a correcting factor, namely the coarse difference matrix, that can be applied to the second matrix having a reduced absolute accuracy for correcting purposes.
- the coarse difference matrix is used to correct the absolute accuracy of the second matrix, in particular its different values. This correction can be done since the second frequency response measurement ensures a high relative accuracy such that the measurement points are correct in relation to each other.
- the difference matrix representing the correction factor provides a curve shape of the correction needed, in particular for correcting an additional unknown slope that occurs due to the measurement. This unknown slope may combine with the slow influence on the frequency response of the test instrument during the fast and fine second frequency response measurement.
- data points of said coarse difference matrix are interpolated to obtain a fine difference matrix, said fine difference matrix comprising data points corresponding to said grid of the second matrix, in particular to said radio frequency and fine intermediate frequency grid.
- the fine difference matrix has the same density as the second matrix as both have the same grid with regard to the intermediate frequency.
- the interpolation of the difference matrix is done in intermediate frequency direction.
- the difference matrix corresponds to the intermediate frequency grid of the second matrix.
- Said fine difference matrix may be combined with said second matrix such that the frequency response for said radio frequency desired is determined. Accordingly, the measured fine data having a reduced absolute accuracy are corrected with regard to their absolute accuracy while using the fine difference matrix.
- the incorrect slope is corrected appropriately, in particular the slow influence and the unknown slope that occurs during the second frequency response measurement.
- said second matrix is corrected by compensating an incorrect slope resulting from imperfect frequency response, in particular imperfect comb frequency response measurement.
- the reduced absolute accuracy of the data obtained by the second measurement is corrected since the unknown slope causing the reduced absolute accuracy is determined and compensated appropriately.
- the incorrect slope to be compensated corresponds to the slow influence of the test instrument and the unknown slope that occurs due to the second frequency response measurement.
- a model of the hardware of said radio frequency test instrument is used for interpolating.
- the usage of the model ensures that fewer measurement points are needed to get the same accuracy. Therefore, the measurement time can be reduced while maintaining the absolute accuracy.
- a model of the influence of the frequency may be used for interpolating. This model also ensures that fewer measurement points are needed to get the same accuracy.
- a higher accuracy may be obtained in the same time or the same accuracy may be obtained in shorter time.
- said first frequency response is done by using a power meter.
- a power meter typically provides measurement data with a high absolute accuracy. However, as the measurement done with the power meter takes long, a coarse grid is used in order to reduce the total measurement time. The measurement points in the radio frequency and coarse intermediate frequency grid have a high absolute accuracy.
- Said second frequency response measurement may be performed with a modulated signal, said modulated signal spanning said specified bandwidth. This ensures that several intermediate frequencies are stimulated at once. Accordingly, such a modulated signal is suitable for the second frequency response measurement with the radio frequency and fine intermediate frequency grid.
- said second frequency response measurement is done by using a comb generator.
- a comb generator can be used as it generates a comb signal that also stimulates several intermediate frequencies at once.
- the comb generator is suitable for the second measurement.
- a comb signal is mixed up to a radio frequency signal having a desired frequency by using said comb generator.
- the comb generator may have a built-in mixer wherein a broadband comb signal is generated that is shifted to the complete frequency range of the radio frequency test instrument.
- the comb signal generated by the comb generator is mixed up for higher frequencies.
- said second frequency response measurement is done by using a signal generation unit being configured to generate a continuous wave signal, a multi-carrier signal or a multi-tone signal.
- a signal generation unit being configured to generate a continuous wave signal, a multi-carrier signal or a multi-tone signal.
- These different signals are also suitable for stimulating several intermediate frequencies at once such that a short measurement time for the second frequency response measurement is needed.
- said continuous wave signal is at least one of a stepped continuous wave signal, a perfect swept continuous wave signal and a normal swept continuous wave signal.
- These different signals ensure a fast measurement wherein several intermediate frequencies are stimulated simultaneously or in a fast sequence. For instance, the capture length is longer than the sweep time of the swept signal ensuring that the captured signal comprises all frequencies.
- these signals are suitable for providing measuring data used to create the fine radio frequency and fine intermediate frequency grid.
- said radio frequency and fine intermediate frequency grid comprises only one radio frequency. If the influence of the intermediate frequency is independent of the radio frequency, just one fine measurement at a certain radio frequency is necessary. That reduces the total measurement time significantly.
- the radio frequency and fine intermediate frequency grid may comprise only a few radio frequencies, for instance two. This might be helpful provided that an analog frontend is switched wherein the influence of the intermediate frequency part changes.
- the number of radio frequencies used for the matrix provided by the fine intermediate frequency grid can be reduced appropriately.
- said second frequency response measurement may be performed with a perfect sequence.
- This sequence can be used instead of a comb signal in order to stimulate several intermediate frequencies.
- an equalization filter is set based on said frequency response determined, in particular wherein said equalization filter set is applied. After having determined the frequency response for the desired frequency, the equalization filters are set appropriately in order to compensate the frequency response that will occur during operation of the radio frequency test instrument.
- the first and second frequency response measurements may be done different based on the radio frequency region selected.
- different methods can be applied for the first and second frequency response measurements in different radio frequency regions.
- the user can select a certain method to be applied.
- the radio frequency grid is adjusted appropriately based on the selection, for instance a fine radio frequency grid for a first radio frequency region and a coarse radio frequency grid for a second radio frequency region.
- FIG. 1 schematically shows a radio frequency test instrument according to the invention
- FIG. 2 shows a diagram representing calibration points used in a calibrating method of the test and measuring device according to the invention
- FIG. 3 shows an overview of the influences of frequency response and different measurements performed in a calibrating method of the test and measuring device according to a first embodiment of the invention
- FIG. 4 shows an overview of the influences of frequency response and different measurements performed in a calibrating method of the test and measuring device according to a second embodiment of the invention
- FIG. 5 shows an overview of correcting the second measurement done in a calibrating method of the test and measuring device according to the invention.
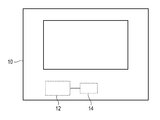
- a radio frequency test instrument 10 is shown that is used for measuring and analyzing radio frequency signals.
- the radio frequency test instrument 10 typically has a specified bandwidth than can be used during operation.
- the radio frequency test instrument 10 is established by a spectrum analyzer.
- the radio frequency test instrument 10 comprises a processing unit 12 and a data storage 14 which are connected with each other for exchanging data.
- the processing unit 12 is configured to perform a method for calibrating the radio frequency test instrument 10 that is described hereinafter.
- the method for calibrating the radio frequency test instrument 10 comprises a first step wherein a first frequency response is measured while using a radio frequency and coarse intermediate frequency grid. The data obtained from this first measurement are used to create a first matrix.
- the method for calibrating the radio frequency test instrument 10 comprises another step wherein a second frequency response is measured while using a radio frequency and fine intermediate frequency grid. Again, a second matrix is created by the data obtained from this second measurement.
- the first frequency response is measured with a coarse radio frequency and coarse intermediate frequency grid whereas the second frequency response is measured with a fine radio frequency and fine intermediate frequency grid.
- the radio frequencies grid can be different with regard to the radio frequencies.
- FIG. 2 such a matrix is shown for illustrating purposes.
- the matrix comprises several calibration points in intermediate frequency (x axis) and in radio frequency (y axis). All these calibration points may comprise amplitude and/or phase information.
- the matrices created by the first and second frequency response measurements are stored in the data storage 14 for further processing.
- the calibration points may also be called measurement points as they have been measured directly.
- the matrices have to be very dense in order to get a complete representation of the frequency response for all input frequencies within the required accuracy.
- the calibration time is reduced by using the first measurement wherein the frequency response is measured using a coarse radio frequency and coarse intermediate frequency grid.
- This first measurement is done with a power meter, for instance. This ensures that the absolute accuracy of the different measurement points is very high. However, the density of the first matrix is not as high as needed. Thus, the first matrix is interpolated in direction of the radio frequency desired in order to increase the density at least partly. Thus, the processing time is reduced.
- This radio frequency desired corresponds to a radio frequency that is selected by the user of the radio frequency test instrument 10 .
- the second matrix representing the second measurement with the (fine) radio frequency and fine intermediate frequency grid has a high density with respect to the original first matrix, in particular prior to its interpolation in the direction of the radio frequency desired.
- the second matrix can also be interpolated in the direction of the radio frequency desired in order to increase the density of the second matrix as well at least partly in short time.
- the first and second matrices have the same density with regard to the radio frequency desired after interpolating the first matrix and optionally interpolating the second matrix in the direction of the radio frequency desired. This ensures that both matrices can be compared and combined easily during further processing as will be described later, in particular with regard to the radio frequency desired.
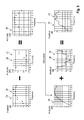
- the influences on the frequency response of the radio frequency part 18 , 20 are illustrated for two different radio frequencies RF 1 and RF 2 . Further, the influence of the intermediate frequency part 22 is shown that is substantially fixed for the different radio frequencies. In general, the frequency response of the intermediate frequency part may have more ripples than the frequency of the radio frequency part. However, both influences, e.g. the radio frequency part and the intermediate frequency part, cannot be measured separately.
- a first frequency response measurement 24 for the second radio frequency RF 2 is shown wherein a coarse radio frequency and coarse intermediate frequency grid has been used. Thus, only several distributed measurement points are shown in the corresponding diagram. However, a fine radio frequency and coarse intermediate frequency grid could also be used.
- a second frequency response measurement 26 is shown wherein a fine radio frequency and fine intermediate frequency grid has been used. This second measurement 26 relates to the first radio frequency RF 1 . However, a coarse radio frequency and fine intermediate frequency grid could also be used.
- the second frequency response measurement 26 with the (fine) radio frequency and fine intermediate frequency grid as well as the first frequency response measurement 24 can be interpolated in the direction of the radio frequency desired in order to obtain the diagrams shown in FIG. 3 .
- the second frequency response measurement 26 (RF 1 fine measurement) can be adapted such that an adapted version 28 of the second matrix is provided, for instance a subsampled version while subsampling the second matrix.
- This adapted version 28 has a reduced density with regard to the intermediate frequency wherein the reduced density relates to the one of the first matrix obtained by the first frequency response measurement 24 with the (coarse) radio frequency and coarse intermediate frequency grid.
- This adapted version 28 corresponds to a matrix obtained by using a coarse radio frequency and coarse intermediate frequency grid.
- the adapted version 28 can be deemed as a virtual coarse measurement.
- the adapted version 28 is also labeled as RF 1 coarse measurement.
- the grids of the matrices relating to the adapted version 28 and the first frequency response measurement 24 are similar such that both matrices can be compared and combined.
- the first frequency response measurement 24 and the second frequency response measurement 26 are processed and combined such that the fine frequency response for a radio frequency desired can be obtained with high accuracy in reasonable time.
- diagram 30 shown in FIG. 3 represents the desired fine frequency response wherein it corresponds to a fine frequency response for the radio frequency that has been measured in a coarse manner, initially.
- the diagram 30 is derived from the first frequency response measurement 24 being coarse and the second frequency response measurement 26 being fine.
- the first frequency response measurement 24 with a (coarse) radio frequency and coarse intermediate frequency grid will be performed for each useable radio frequency despite the first radio frequency RF 1 that has been used for the second frequency response measurement 26 with fine grid.
- the first frequency response measurement 24 is very fast such that the whole measurement time is reduced.
- FIG. 4 it is shown that the frequency responses of the radio frequency test instrument 10 have for each radio frequency a “fast” influence 32 and a “slow” influence 34 .
- FIG. 4 shows a similar situation with regard to FIG. 3 wherein a first measurement 36 with a coarse radio frequency and coarse intermediate frequency grid is performed while using a power meter.
- the measurement time is reduced wherein the absolute accuracy of the measured points is high.
- a fine radio frequency and coarse intermediate frequency grid can also be used.
- a second measurement 38 with a fine radio frequency and fine intermediate frequency grid is done while using a comb generator.
- the comb generator generates a comb signal that is mixed up to a radio frequency signal having a desired frequency.
- a coarse radio frequency and fine intermediate frequency grid can also be used.
- the comb measurement e.g. the second measurement 38
- the comb measurement provides data on a very fine grid as several intermediate frequencies are stimulated simultaneously.
- an additional unknown slope occurs due the second measurement 38 performed by the comb generator.
- This additional unknown slope of the measurement combines with the slow influence 34 of the test instrument 10 such that a combined incorrect slope 40 occurs influencing the second measurement 38 in an unknown manner as shown in FIG. 4 .
- the incorrect slope 40 results in a reduced accuracy with regard to the absolute values measured by the second measurement 38 . Nevertheless, the relative values of the comb measurement, e.g. the second measurement 38 , are accurate.
- Both, the coarse power meter measurement 36 and the comb measurement 38 are conducted for several radio frequencies.
- the first and second measurements 36 , 38 also provide data used to create a first matrix and a second matrix that can be interpolated in the direction of the radio frequency desired as already discussed with regard to FIG. 3 .
- an adapted version 42 of the second frequency response measurement 38 is also obtained that is additionally labeled as a coarse comb measurement.
- a desired frequency response 44 to be obtained is also shown in FIG. 4 that can be calculated as described hereinafter.
- the desired frequency responses 30 ( FIG. 3 ) and 44 ( FIG. 4 ) can be obtained by the combining technique that is shown in FIG. 5 and described hereinafter.
- FIG. 5 refers to the signals used for the different measurements as shown in FIGS. 3 and 4 .
- the matrix of the second frequency response measurement 26 , 38 can be reduced such that the adapted version 28 , 42 is generated having a similar intermediate frequency grid with regard to the first matrix representing the first frequency response measurement 24 , 36 .
- this adapted version 28 , 42 is subtracted from the first matrix relating to the first frequency response measurement 24 , 36 such that a coarse difference matrix 46 is obtained.
- the data points of this coarse difference matrix 46 are interpolated in intermediate frequency direction in order to create a fine difference matrix 48 having a fine grid with regard to the intermediate frequency.
- the fine difference matrix 48 comprises the same radio frequency and intermediate frequency grid as the second matrix relating to the second frequency response measurement 26 , 38 .
- the fine difference matrix 48 and the second matrix relating to the second frequency response measurement 26 , 38 are combined such that the frequency response for the radio frequency desired is obtained with high accuracy.
- This frequency response corresponds to the desired frequency response 30 , 44 shown in FIGS. 3 and 4 .
- the difference matrix 46 is generated by using the coarse matrix measured of the radio frequency desired.
- the coarse difference matrix 46 and the fine difference matrix 48 are used to correct the second matrix related to the second frequency response measurement 26 , 38 as the incorrect slope is compensated, in particular the unknown slope that occurs during the second measurement.
- a first model of the hardware of the test instrument 10 can be applied. Accordingly, the number of measuring points can be reduced resulting in a faster measurement.
- a second model of the influence of the frequency is used for the different interpolating steps. This second model also ensures that the number of measuring points required can be reduced for maintaining the desired accuracy. Thus, the measurement time can be reduced again.
- the frequency response measurements with fine intermediate frequency grid may be performed with a modulated signal that spans the bandwidth specified by the radio frequency test instrument 10 .
- said second frequency response measurement may be performed with a perfect sequence instead of a comb signal.
- the second frequency response measurement 26 is measured by using a signal generation unit that is configured to generate a continuous wave signal, a multi-carrier signal or a multi-tone signal.
- the continuous wave signal is at least one of a stepped continuous wave signal, a perfect swept continuous wave signal and a normal swept continuous wave signal.
- a coarse measurement and a fine measurement are conducted with regard to the intermediate frequency.
- the fine measurement refers to the RF 1 fine measurement and the coarse measurement to the RF 2 coarse measurement.
- the fine measurement refers to the comb measurement and the coarse measurement to the power meter measurement.
- the fine frequency response for the radio frequency desired is obtained that can be used for setting an equalization filter.
- This equalization filter set is applied during the operation of the radio frequency test instrument 10 such that the calibration of the radio frequency test instrument 10 is done quickly.
- the accuracy is improved while the calibration time is maintained. Moreover, the calibration is less complex which reduces the risk of failure.
- the first and second frequency response measurements 24 , 26 , 36 , 38 may be done different based on the radio frequency region selected at the radio frequency test instrument 10 .
- the user selects a certain radio frequency region wherein the radio frequency grid of the first and second frequency response measurements 24 , 26 , 36 , 38 is adjusted appropriately based on the selection. For instance, a fine radio frequency grid is used for a first radio frequency region whereas a coarse radio frequency grid is used for a second radio frequency region.
Landscapes
- Physics & Mathematics (AREA)
- General Physics & Mathematics (AREA)
- Monitoring And Testing Of Transmission In General (AREA)
Abstract
Description
- The invention relates to a method for calibrating a radio frequency test instrument and a radio frequency test instrument.
- It is known that a radio frequency test instrument, for instance a spectrum analyzer, shows hardware imperfection such as a frequency response being not perfectly flat.
- The frequency response can be measured at the customer in the field using a so called “self-alignment” function or in the factory using a so called “factory calibration”. Once the frequency response has been measured, it can be compensated during operation of the radio frequency test instrument by adjusting at least one filter appropriately which inverts the frequency response. For instance, an equalization filter is applied for compensating purposes. The goal is to have a very fine resolution for the equalization filters over the measurement bandwidth and a very good fitting equalization filter for the radio frequencies to be processed by the radio frequency test instrument.
- The frequency response is influenced by an intermediate frequency part and a radio frequency part. Usually, the part of the frequency response originating from the radio frequency path of the analyzer is relatively flat within a bandwidth of 1 GHz, for instance. On the other hand this flat frequency response is superposed by a frequency response of the intermediate frequency with higher ripples over the corresponding bandwidth. However, both influences cannot be measured separately as they depend on each other. In addition, the resulting frequency response of the radio frequency test instrument can be separated in a so called fast influence and a so called slow influence for every single radio frequency tested.
- In general, different methods are known to measure the amplitude of the frequency response to be used for calibrating the radio frequency test instrument.
- For instance, a signal generator and a power meter are used. The signal generator transmits a single tone at a known frequency. The actual power of the tone is measured with the power meter in order to determine the frequency response. However, this measurement takes a long time for determining the frequency response for a high bandwidth.
- Another method relates to the usage of an external comb generator that has to be calibrated initially for the different radio frequencies. However, the calibration takes some time and, further, a void calibration of said comb generator results in radio frequency test instruments being calibrated inappropriately. Particularly, factory calibrated radio frequency test instruments would have to be returned for recalibration purposes. In addition, a drifting of the comb generator over the time has to be taken into account while calibrating radio frequency test instruments.
- Another method relates to an intermediate filter calculation as a fine frequency response measurement is performed such that the frequency response can be calculated with high accuracy for a few radio frequencies in order to set the equalization filter with regard to the determined frequency response. Then, a coarse frequency response measurement is performed while the equalization filters are set and applied. The frequency response is calculated again and the settings for the equalization filters are determined again. Afterwards, both settings for the equalization filters are combined and applied. However, the calibration time increases with the number of fine frequency response measurements performed, in particular the number of different radio frequencies used for the fine frequency response measurement. In addition, the fine and coarse measurement depend from each other resulting in a possible propagation of errors. Moreover, the equalization filters have to be set and applied for the coarse measurements which may also result in an additional error source.
- Accordingly, there is a need for a method for calibrating a radio frequency test instrument that can be done fast, in a less complex manner and with a high accuracy.
- The invention provides a method for calibrating a radio frequency test instrument, with the following steps:
-
- a) Measuring a first frequency response using a radio frequency and coarse intermediate frequency grid;
- b) Creating a first matrix comprising data obtained from said first frequency response measuring;
- c) Measuring a second frequency response using a radio frequency and fine intermediate frequency grid;
- d) Creating a second matrix comprising data obtained from said second frequency response measuring; and
- e) Processing and combining said first matrix and said second matrix comprising data obtained from measurements performed with different radio frequency and intermediate frequency grids in order to determine a frequency response for a radio frequency desired.
- Further, the invention provides a radio frequency test instrument being configured to perform a method as described above. Particularly, said radio frequency test instrument is at least one of a spectrum analyzer, an oscilloscope and any other suitable test instrument.
- The invention is based on the finding that the calibration can be done fast and with high accuracy while performing two different measurements using different radio frequency and intermediate frequency grids, in particular with regard to the intermediate frequency grid. For instance, the first measurement relating to the first frequency response ensures a high absolute accuracy. However, the first measurement usually takes long as it provides a high absolute accuracy. Thus, the first measurement is done with a coarse intermediate frequency grid in order to reduce the total measurement time. In contrast thereto, the second measurement is done in a very fast manner such that a fine intermediate frequency grid can be used. However, the absolute accuracy of the second measurement is reduced with regard to the first measurement. The data obtained by these different measurements are combined with each other in order to use the information in a most efficient manner such that a frequency response with fine resolution is acquired for the radio frequency desired. The frequency response determined may be a very detailed one.
- Particularly, the first frequency response measurement is done with a coarse radio frequency and coarse intermediate frequency grid whereas the second frequency response measurement is done with a fine radio frequency and fine intermediate frequency grid. Alternatively, the first frequency response measurement is done with a fine radio frequency and coarse intermediate frequency grid whereas the second frequency response measurement is done with a coarse radio frequency and fine intermediate frequency grid. The radio frequency grid applied depends on the radio frequency test instrument used. Accordingly, the grids for the first and second frequency response measurements are also called fine intermediate frequency grid and coarse intermediate frequency grid respectively in order to emphasize that the resolution of the radio frequencies during these measurements may be coarse or fine.
- According to an aspect, for said radio frequency desired at least one of said first matrix and said second matrix is interpolated in the direction of said radio frequency desired. Generally, the matrices with representative points have to be very dense in order to get a complete representation of the frequency responses for all input frequencies within the required accuracy. However, that would result in a very long calibration cycle, both in factory calibration and in self alignment. To reduce the calibration time, the corresponding frequency response is interpolated from a less dense matrix which can be measured in a reasonable time. Generally, the user can select a certain radio frequency as the desired one wherein this radio frequency is used for interpolating the measurement points of the dedicated matrix. Particularly, the first matrix is interpolated in the direction of the radio frequency desired wherein the first matrix relates to the first frequency response measurement having a high accuracy, but reduced number of measurement values in order ensure that the first frequency response can be done in a reasonable time. Further, the interpolation in the direction of the radio frequency desired is done such that the grids of both matrices correspond to each other with regard to the direction of the radio frequency desired. This ensures that both matrices can be compared and combined easily, in particular with regard to the radio frequency desired. Particularly, no interpolation is necessary if the radio frequency desired is already part of the measured first matrix and/or the measured second matrix.
- In addition, an adapted version of said second matrix may be generated comprising the measurement points corresponding to said radio frequency and coarse intermediate frequency grid. Accordingly, the second matrix relating to the radio frequency and fine intermediate frequency can be reduced such that a subsampled version is provided which relates to a virtual coarse measurement that can be used for comparing with the first matrix being measured in a coarse manner, in particular by using a coarse intermediate frequency grid. The subsampled version of the second matrix and the first matrix substantially have the same density with regard to the intermediate frequency direction. Accordingly, both matrices can be combined easily. Further, the adapted version can be obtained by interpolating the data of the second matrix from a fine grid to a coarse grid.
- According to another aspect, said adapted version and said first matrix are processed in order to obtain a coarse difference matrix. For instance, the adapted version is subtracted from said first matrix with regard to the amplitudes in dB. If the amplitudes are in the linear domain, the first matrix is divided by said adapted version. This processing step provides a correcting factor, namely the coarse difference matrix, that can be applied to the second matrix having a reduced absolute accuracy for correcting purposes. Particularly, the coarse difference matrix is used to correct the absolute accuracy of the second matrix, in particular its different values. This correction can be done since the second frequency response measurement ensures a high relative accuracy such that the measurement points are correct in relation to each other. The difference matrix representing the correction factor provides a curve shape of the correction needed, in particular for correcting an additional unknown slope that occurs due to the measurement. This unknown slope may combine with the slow influence on the frequency response of the test instrument during the fast and fine second frequency response measurement.
- Particularly, data points of said coarse difference matrix are interpolated to obtain a fine difference matrix, said fine difference matrix comprising data points corresponding to said grid of the second matrix, in particular to said radio frequency and fine intermediate frequency grid. This ensures that a complete set of information is provided that can be used for the incorrect slow correction, in particular the slow correction and the unknown slope occurring during the second measurement. The fine difference matrix has the same density as the second matrix as both have the same grid with regard to the intermediate frequency. The interpolation of the difference matrix is done in intermediate frequency direction. Thus, the difference matrix corresponds to the intermediate frequency grid of the second matrix.
- Said fine difference matrix may be combined with said second matrix such that the frequency response for said radio frequency desired is determined. Accordingly, the measured fine data having a reduced absolute accuracy are corrected with regard to their absolute accuracy while using the fine difference matrix. The incorrect slope is corrected appropriately, in particular the slow influence and the unknown slope that occurs during the second frequency response measurement.
- Another aspect provides that said second matrix is corrected by compensating an incorrect slope resulting from imperfect frequency response, in particular imperfect comb frequency response measurement. The reduced absolute accuracy of the data obtained by the second measurement is corrected since the unknown slope causing the reduced absolute accuracy is determined and compensated appropriately. The incorrect slope to be compensated corresponds to the slow influence of the test instrument and the unknown slope that occurs due to the second frequency response measurement.
- According to an embodiment, a model of the hardware of said radio frequency test instrument is used for interpolating. The usage of the model ensures that fewer measurement points are needed to get the same accuracy. Therefore, the measurement time can be reduced while maintaining the absolute accuracy.
- Further, a model of the influence of the frequency may be used for interpolating. This model also ensures that fewer measurement points are needed to get the same accuracy.
- Generally, a higher accuracy may be obtained in the same time or the same accuracy may be obtained in shorter time.
- According to an embodiment, said first frequency response is done by using a power meter. A power meter typically provides measurement data with a high absolute accuracy. However, as the measurement done with the power meter takes long, a coarse grid is used in order to reduce the total measurement time. The measurement points in the radio frequency and coarse intermediate frequency grid have a high absolute accuracy.
- Said second frequency response measurement may be performed with a modulated signal, said modulated signal spanning said specified bandwidth. This ensures that several intermediate frequencies are stimulated at once. Accordingly, such a modulated signal is suitable for the second frequency response measurement with the radio frequency and fine intermediate frequency grid.
- Another aspect provides that said second frequency response measurement is done by using a comb generator. A comb generator can be used as it generates a comb signal that also stimulates several intermediate frequencies at once. Thus, the comb generator is suitable for the second measurement.
- Particularly, a comb signal is mixed up to a radio frequency signal having a desired frequency by using said comb generator. The comb generator may have a built-in mixer wherein a broadband comb signal is generated that is shifted to the complete frequency range of the radio frequency test instrument. Thus, the comb signal generated by the comb generator is mixed up for higher frequencies.
- According to an aspect, said second frequency response measurement is done by using a signal generation unit being configured to generate a continuous wave signal, a multi-carrier signal or a multi-tone signal. These different signals are also suitable for stimulating several intermediate frequencies at once such that a short measurement time for the second frequency response measurement is needed.
- Particularly, said continuous wave signal is at least one of a stepped continuous wave signal, a perfect swept continuous wave signal and a normal swept continuous wave signal. These different signals ensure a fast measurement wherein several intermediate frequencies are stimulated simultaneously or in a fast sequence. For instance, the capture length is longer than the sweep time of the swept signal ensuring that the captured signal comprises all frequencies. Thus, these signals are suitable for providing measuring data used to create the fine radio frequency and fine intermediate frequency grid.
- According to an embodiment, said radio frequency and fine intermediate frequency grid comprises only one radio frequency. If the influence of the intermediate frequency is independent of the radio frequency, just one fine measurement at a certain radio frequency is necessary. That reduces the total measurement time significantly.
- Alternatively, the radio frequency and fine intermediate frequency grid may comprise only a few radio frequencies, for instance two. This might be helpful provided that an analog frontend is switched wherein the influence of the intermediate frequency part changes.
- Generally, the number of radio frequencies used for the matrix provided by the fine intermediate frequency grid can be reduced appropriately.
- Moreover, said second frequency response measurement may be performed with a perfect sequence. This sequence can be used instead of a comb signal in order to stimulate several intermediate frequencies.
- Another aspect provides that an equalization filter is set based on said frequency response determined, in particular wherein said equalization filter set is applied. After having determined the frequency response for the desired frequency, the equalization filters are set appropriately in order to compensate the frequency response that will occur during operation of the radio frequency test instrument.
- Further, the first and second frequency response measurements may be done different based on the radio frequency region selected. Thus, different methods can be applied for the first and second frequency response measurements in different radio frequency regions. Accordingly, the user can select a certain method to be applied. Particularly, the radio frequency grid is adjusted appropriately based on the selection, for instance a fine radio frequency grid for a first radio frequency region and a coarse radio frequency grid for a second radio frequency region.
- The invention will now be described with reference to an exemplary embodiment that is shown in the drawings. In the drawings,
-
FIG. 1 schematically shows a radio frequency test instrument according to the invention, -
FIG. 2 shows a diagram representing calibration points used in a calibrating method of the test and measuring device according to the invention, -
FIG. 3 shows an overview of the influences of frequency response and different measurements performed in a calibrating method of the test and measuring device according to a first embodiment of the invention, -
FIG. 4 shows an overview of the influences of frequency response and different measurements performed in a calibrating method of the test and measuring device according to a second embodiment of the invention, and -
FIG. 5 shows an overview of correcting the second measurement done in a calibrating method of the test and measuring device according to the invention. - In
FIG. 1 , a radiofrequency test instrument 10 is shown that is used for measuring and analyzing radio frequency signals. The radiofrequency test instrument 10 typically has a specified bandwidth than can be used during operation. Particularly, the radiofrequency test instrument 10 is established by a spectrum analyzer. - The radio
frequency test instrument 10 comprises aprocessing unit 12 and adata storage 14 which are connected with each other for exchanging data. Theprocessing unit 12 is configured to perform a method for calibrating the radiofrequency test instrument 10 that is described hereinafter. - The method for calibrating the radio
frequency test instrument 10 comprises a first step wherein a first frequency response is measured while using a radio frequency and coarse intermediate frequency grid. The data obtained from this first measurement are used to create a first matrix. In addition, the method for calibrating the radiofrequency test instrument 10 comprises another step wherein a second frequency response is measured while using a radio frequency and fine intermediate frequency grid. Again, a second matrix is created by the data obtained from this second measurement. - In the shown embodiments, the first frequency response is measured with a coarse radio frequency and coarse intermediate frequency grid whereas the second frequency response is measured with a fine radio frequency and fine intermediate frequency grid. However, the radio frequencies grid can be different with regard to the radio frequencies.
- In
FIG. 2 , such a matrix is shown for illustrating purposes. The matrix comprises several calibration points in intermediate frequency (x axis) and in radio frequency (y axis). All these calibration points may comprise amplitude and/or phase information. The matrices created by the first and second frequency response measurements are stored in thedata storage 14 for further processing. The calibration points may also be called measurement points as they have been measured directly. - Generally, the matrices have to be very dense in order to get a complete representation of the frequency response for all input frequencies within the required accuracy. However, this would result in a very long calibration cycle, both in factory calibration and in self alignment. Thus, the calibration time is reduced by using the first measurement wherein the frequency response is measured using a coarse radio frequency and coarse intermediate frequency grid.
- This first measurement is done with a power meter, for instance. This ensures that the absolute accuracy of the different measurement points is very high. However, the density of the first matrix is not as high as needed. Thus, the first matrix is interpolated in direction of the radio frequency desired in order to increase the density at least partly. Thus, the processing time is reduced. This radio frequency desired corresponds to a radio frequency that is selected by the user of the radio
frequency test instrument 10. - Moreover, the second matrix representing the second measurement with the (fine) radio frequency and fine intermediate frequency grid has a high density with respect to the original first matrix, in particular prior to its interpolation in the direction of the radio frequency desired. However, the second matrix can also be interpolated in the direction of the radio frequency desired in order to increase the density of the second matrix as well at least partly in short time.
- Generally, the first and second matrices have the same density with regard to the radio frequency desired after interpolating the first matrix and optionally interpolating the second matrix in the direction of the radio frequency desired. This ensures that both matrices can be compared and combined easily during further processing as will be described later, in particular with regard to the radio frequency desired.
- In the left portion of
FIG. 3 , the influences on the frequency response of theradio frequency part intermediate frequency part 22 is shown that is substantially fixed for the different radio frequencies. In general, the frequency response of the intermediate frequency part may have more ripples than the frequency of the radio frequency part. However, both influences, e.g. the radio frequency part and the intermediate frequency part, cannot be measured separately. - In the right portion of
FIG. 3 , a firstfrequency response measurement 24 for the second radio frequency RF2 is shown wherein a coarse radio frequency and coarse intermediate frequency grid has been used. Thus, only several distributed measurement points are shown in the corresponding diagram. However, a fine radio frequency and coarse intermediate frequency grid could also be used. - In addition, a second
frequency response measurement 26 is shown wherein a fine radio frequency and fine intermediate frequency grid has been used. Thissecond measurement 26 relates to the first radio frequency RF1. However, a coarse radio frequency and fine intermediate frequency grid could also be used. - As already mentioned above, the second
frequency response measurement 26 with the (fine) radio frequency and fine intermediate frequency grid as well as the firstfrequency response measurement 24 can be interpolated in the direction of the radio frequency desired in order to obtain the diagrams shown inFIG. 3 . - For both
measurements intermediate frequency part 22 and the dedicatedradio frequency part - The second frequency response measurement 26 (RF1 fine measurement) can be adapted such that an adapted
version 28 of the second matrix is provided, for instance a subsampled version while subsampling the second matrix. This adaptedversion 28 has a reduced density with regard to the intermediate frequency wherein the reduced density relates to the one of the first matrix obtained by the firstfrequency response measurement 24 with the (coarse) radio frequency and coarse intermediate frequency grid. This adaptedversion 28 corresponds to a matrix obtained by using a coarse radio frequency and coarse intermediate frequency grid. Thus, the adaptedversion 28 can be deemed as a virtual coarse measurement. InFIG. 3 , the adaptedversion 28 is also labeled as RF1 coarse measurement. - The grids of the matrices relating to the adapted
version 28 and the firstfrequency response measurement 24 are similar such that both matrices can be compared and combined. - As will be described later, the first
frequency response measurement 24 and the secondfrequency response measurement 26 are processed and combined such that the fine frequency response for a radio frequency desired can be obtained with high accuracy in reasonable time. - For instance, diagram 30 shown in
FIG. 3 represents the desired fine frequency response wherein it corresponds to a fine frequency response for the radio frequency that has been measured in a coarse manner, initially. The diagram 30 is derived from the firstfrequency response measurement 24 being coarse and the secondfrequency response measurement 26 being fine. - Generally, the first
frequency response measurement 24 with a (coarse) radio frequency and coarse intermediate frequency grid will be performed for each useable radio frequency despite the first radio frequency RF1 that has been used for the secondfrequency response measurement 26 with fine grid. As already mentioned, the firstfrequency response measurement 24 is very fast such that the whole measurement time is reduced. - In
FIG. 4 it is shown that the frequency responses of the radiofrequency test instrument 10 have for each radio frequency a “fast”influence 32 and a “slow”influence 34. - In addition,
FIG. 4 shows a similar situation with regard toFIG. 3 wherein afirst measurement 36 with a coarse radio frequency and coarse intermediate frequency grid is performed while using a power meter. Thus, the measurement time is reduced wherein the absolute accuracy of the measured points is high. However, a fine radio frequency and coarse intermediate frequency grid can also be used. - In addition, a
second measurement 38 with a fine radio frequency and fine intermediate frequency grid is done while using a comb generator. The comb generator generates a comb signal that is mixed up to a radio frequency signal having a desired frequency. However, a coarse radio frequency and fine intermediate frequency grid can also be used. - The comb measurement, e.g. the
second measurement 38, provides data on a very fine grid as several intermediate frequencies are stimulated simultaneously. However, an additional unknown slope occurs due thesecond measurement 38 performed by the comb generator. This additional unknown slope of the measurement combines with theslow influence 34 of thetest instrument 10 such that a combinedincorrect slope 40 occurs influencing thesecond measurement 38 in an unknown manner as shown inFIG. 4 . - The
incorrect slope 40 results in a reduced accuracy with regard to the absolute values measured by thesecond measurement 38. Nevertheless, the relative values of the comb measurement, e.g. thesecond measurement 38, are accurate. - Both, the coarse
power meter measurement 36 and thecomb measurement 38 are conducted for several radio frequencies. - The first and
second measurements FIG. 3 . - Further, an adapted
version 42 of the secondfrequency response measurement 38 is also obtained that is additionally labeled as a coarse comb measurement. Further, a desiredfrequency response 44 to be obtained is also shown inFIG. 4 that can be calculated as described hereinafter. - The desired frequency responses 30 (
FIG. 3 ) and 44 (FIG. 4 ) can be obtained by the combining technique that is shown inFIG. 5 and described hereinafter. -
FIG. 5 refers to the signals used for the different measurements as shown inFIGS. 3 and 4 . - As already described, the matrix of the second
frequency response measurement version frequency response measurement - Then, this adapted
version frequency response measurement coarse difference matrix 46 is obtained. - The data points of this
coarse difference matrix 46 are interpolated in intermediate frequency direction in order to create afine difference matrix 48 having a fine grid with regard to the intermediate frequency. Thefine difference matrix 48 comprises the same radio frequency and intermediate frequency grid as the second matrix relating to the secondfrequency response measurement - Then, the
fine difference matrix 48 and the second matrix relating to the secondfrequency response measurement frequency response FIGS. 3 and 4 . - If another radio frequency is the desired one, the
difference matrix 46 is generated by using the coarse matrix measured of the radio frequency desired. - The
coarse difference matrix 46 and thefine difference matrix 48 are used to correct the second matrix related to the secondfrequency response measurement - For the different interpolating steps, a first model of the hardware of the
test instrument 10 can be applied. Accordingly, the number of measuring points can be reduced resulting in a faster measurement. - Alternatively or supplementary, a second model of the influence of the frequency is used for the different interpolating steps. This second model also ensures that the number of measuring points required can be reduced for maintaining the desired accuracy. Thus, the measurement time can be reduced again.
- In general, the frequency response measurements with fine intermediate frequency grid may be performed with a modulated signal that spans the bandwidth specified by the radio
frequency test instrument 10. - Particularly, said second frequency response measurement may be performed with a perfect sequence instead of a comb signal.
- For instance, the second
frequency response measurement 26 is measured by using a signal generation unit that is configured to generate a continuous wave signal, a multi-carrier signal or a multi-tone signal. For instance, the continuous wave signal is at least one of a stepped continuous wave signal, a perfect swept continuous wave signal and a normal swept continuous wave signal. These different signals ensure that several intermediate frequencies can be stimulated simultaneously or in a fast sequence as the capture length is longer than the sweep time. - Generally, a coarse measurement and a fine measurement are conducted with regard to the intermediate frequency.
- In
FIG. 3 , the fine measurement refers to the RF1 fine measurement and the coarse measurement to the RF2 coarse measurement. - In
FIG. 4 , the fine measurement refers to the comb measurement and the coarse measurement to the power meter measurement. - The steps described with regard to
FIG. 5 can be applied for both different cases as described above. - Afterwards, the fine frequency response for the radio frequency desired is obtained that can be used for setting an equalization filter.
- This equalization filter set is applied during the operation of the radio
frequency test instrument 10 such that the calibration of the radiofrequency test instrument 10 is done quickly. - The accuracy is improved while the calibration time is maintained. Moreover, the calibration is less complex which reduces the risk of failure.
- Moreover, the first and second
frequency response measurements frequency test instrument 10. The user selects a certain radio frequency region wherein the radio frequency grid of the first and secondfrequency response measurements
Claims (20)
Priority Applications (1)
| Application Number | Priority Date | Filing Date | Title |
|---|---|---|---|
| US15/419,869 US10422846B2 (en) | 2017-01-30 | 2017-01-30 | Method for calibrating a radio frequency test instrument and radio frequency test instrument |
Applications Claiming Priority (1)
| Application Number | Priority Date | Filing Date | Title |
|---|---|---|---|
| US15/419,869 US10422846B2 (en) | 2017-01-30 | 2017-01-30 | Method for calibrating a radio frequency test instrument and radio frequency test instrument |
Publications (2)
| Publication Number | Publication Date |
|---|---|
| US20180217221A1 true US20180217221A1 (en) | 2018-08-02 |
| US10422846B2 US10422846B2 (en) | 2019-09-24 |
Family
ID=62977289
Family Applications (1)
| Application Number | Title | Priority Date | Filing Date |
|---|---|---|---|
| US15/419,869 Active US10422846B2 (en) | 2017-01-30 | 2017-01-30 | Method for calibrating a radio frequency test instrument and radio frequency test instrument |
Country Status (1)
| Country | Link |
|---|---|
| US (1) | US10422846B2 (en) |
Cited By (1)
| Publication number | Priority date | Publication date | Assignee | Title |
|---|---|---|---|---|
| CN112986679A (en) * | 2021-04-27 | 2021-06-18 | 深圳市鼎阳科技股份有限公司 | Calibration compensation device and method for spectrum analyzer and spectrum analyzer |
Families Citing this family (1)
| Publication number | Priority date | Publication date | Assignee | Title |
|---|---|---|---|---|
| EP4057468A1 (en) * | 2021-03-12 | 2022-09-14 | Hitachi Energy Switzerland AG | Control method, computer program product, control system & use |
Family Cites Families (12)
| Publication number | Priority date | Publication date | Assignee | Title |
|---|---|---|---|---|
| US5684580A (en) * | 1995-05-01 | 1997-11-04 | Ashland Inc. | Hydrocarbon analysis and control by raman spectroscopy |
| US6700537B2 (en) * | 2000-08-31 | 2004-03-02 | Her Majesty The Queen In Right Of Canada, As Represented By The Minister Of Communications | Method for calibrating a wideband direction finding system |
| US7068987B2 (en) * | 2000-10-02 | 2006-06-27 | Conexant, Inc. | Packet acquisition and channel tracking for a wireless communication device configured in a zero intermediate frequency architecture |
| US6735422B1 (en) * | 2000-10-02 | 2004-05-11 | Baldwin Keith R | Calibrated DC compensation system for a wireless communication device configured in a zero intermediate frequency architecture |
| US20040219889A1 (en) * | 2003-04-29 | 2004-11-04 | Walter Honcharenko | Phase-combined transmitter module and modular transmitter system |
| US20070050154A1 (en) * | 2005-09-01 | 2007-03-01 | Albahri Tareq A | Method and apparatus for measuring the properties of petroleum fuels by distillation |
| US7649930B2 (en) | 2005-11-09 | 2010-01-19 | Tektronix, Inc. | Filter equalization using magnitude measurement data |
| US7720137B2 (en) | 2006-10-18 | 2010-05-18 | Tektronix, Inc. | Characterization of a frequency response for a frequency translation device |
| US8682597B2 (en) * | 2007-10-16 | 2014-03-25 | Exxonmobil Research And Engineering Company | Estimating detailed compositional information from limited analytical data |
| US8138975B2 (en) * | 2008-12-30 | 2012-03-20 | Trueposition, Inc. | Interference detection, characterization and location in a wireless communications or broadcast system |
| US8436768B2 (en) * | 2008-12-30 | 2013-05-07 | Trueposition, Inc. | Diversity time and frequency location receiver |
| US20100305872A1 (en) * | 2009-05-31 | 2010-12-02 | University Of Kuwait | Apparatus and Method for Measuring the Properties of Petroleum Factions and Pure Hydrocarbon Liquids by Light Refraction |
-
2017
- 2017-01-30 US US15/419,869 patent/US10422846B2/en active Active
Cited By (1)
| Publication number | Priority date | Publication date | Assignee | Title |
|---|---|---|---|---|
| CN112986679A (en) * | 2021-04-27 | 2021-06-18 | 深圳市鼎阳科技股份有限公司 | Calibration compensation device and method for spectrum analyzer and spectrum analyzer |
Also Published As
| Publication number | Publication date |
|---|---|
| US10422846B2 (en) | 2019-09-24 |
Similar Documents
| Publication | Publication Date | Title |
|---|---|---|
| JP4282897B2 (en) | Automated microwave test system with improved accuracy | |
| US12320882B2 (en) | Integrated vector network analyzer | |
| US6701265B2 (en) | Calibration for vector network analyzer | |
| US10969421B2 (en) | Integrated vector network analyzer | |
| KR101452281B1 (en) | Frequency response correction of a receiver with frequency conversion device | |
| CN110018455B (en) | Amplitude-phase consistency error calibration measurement method between satellite-borne SAR imaging receiving channels | |
| US10042029B2 (en) | Calibration of test instrument over extended operating range | |
| US8280667B2 (en) | Test apparatus, performance board and calibration board | |
| US8788234B2 (en) | Method of calibrating interleaved digitizer channels | |
| US10422846B2 (en) | Method for calibrating a radio frequency test instrument and radio frequency test instrument | |
| US20210018561A1 (en) | Measurement system and method for automated measurement of several contributions to signal degradation | |
| KR101294771B1 (en) | Filter equalization using magnitude measurement data | |
| CN107860973B (en) | A frequency response compensation method and system applied to a spectrum analyzer | |
| US11054450B2 (en) | Method of calibrating a measurement and analyzing device as well as method of measuring a frequency-converting device under test | |
| US6995571B1 (en) | Vector network analyzer mixer calibration using the unknown thru calibration | |
| TWI415386B (en) | Characterization of a frequency response for a frequency translation device | |
| Zhu et al. | Oscilloscope measurement bandwidth expansion using frequency response compensation | |
| JP2024133011A (en) | Test and measurement device, method for operating a test and measurement device, and method for calibrating a test and measurement device | |
| US10890609B2 (en) | Signal source, test system and method for testing a device under test | |
| Hu et al. | Calibrated non-linear vector network measurement without using a multi-harmonic generator | |
| US20040196051A1 (en) | System and method for calibrating balanced signals | |
| CN115656904B (en) | Magnetic resonance gradient delay automatic correction method, device, equipment and storage medium | |
| CN119966531A (en) | Method and device for measuring linearity of a circuit under test | |
| CN121721071A (en) | Correction Method and System for Multiplexed Signal Conversion Channels in Semiconductor Scanning Electron Microscopy | |
| Gorin | Achieving amplitude accuracy in modern spectrum analyzers |
Legal Events
| Date | Code | Title | Description |
|---|---|---|---|
| AS | Assignment |
Owner name: ROHDE & SCHWARZ GMBH & CO. KG, GERMANY Free format text: ASSIGNMENT OF ASSIGNORS INTEREST;ASSIGNORS:RUENGELER, MATTHIAS;FELDHAUS, GREGOR;SIGNING DATES FROM 20170324 TO 20170327;REEL/FRAME:045473/0745 |
|
| STPP | Information on status: patent application and granting procedure in general |
Free format text: DOCKETED NEW CASE - READY FOR EXAMINATION |
|
| STPP | Information on status: patent application and granting procedure in general |
Free format text: NOTICE OF ALLOWANCE MAILED -- APPLICATION RECEIVED IN OFFICE OF PUBLICATIONS |
|
| STPP | Information on status: patent application and granting procedure in general |
Free format text: PUBLICATIONS -- ISSUE FEE PAYMENT RECEIVED |
|
| STPP | Information on status: patent application and granting procedure in general |
Free format text: PUBLICATIONS -- ISSUE FEE PAYMENT VERIFIED |
|
| STCF | Information on status: patent grant |
Free format text: PATENTED CASE |
|
| MAFP | Maintenance fee payment |
Free format text: PAYMENT OF MAINTENANCE FEE, 4TH YEAR, LARGE ENTITY (ORIGINAL EVENT CODE: M1551); ENTITY STATUS OF PATENT OWNER: LARGE ENTITY Year of fee payment: 4 |