US11830583B2 - Systems and methods for characterizing extracellular vesicle (EV) population by predicting whether the EV originates from B, T, or dendritic cells - Google Patents
Systems and methods for characterizing extracellular vesicle (EV) population by predicting whether the EV originates from B, T, or dendritic cells Download PDFInfo
- Publication number
- US11830583B2 US11830583B2 US15/865,166 US201815865166A US11830583B2 US 11830583 B2 US11830583 B2 US 11830583B2 US 201815865166 A US201815865166 A US 201815865166A US 11830583 B2 US11830583 B2 US 11830583B2
- Authority
- US
- United States
- Prior art keywords
- hsa
- mir
- cell
- protein
- evs
- Prior art date
- Legal status (The legal status is an assumption and is not a legal conclusion. Google has not performed a legal analysis and makes no representation as to the accuracy of the status listed.)
- Active, expires
Links
- 238000000034 method Methods 0.000 title claims abstract description 142
- 210000001744 T-lymphocyte Anatomy 0.000 title claims description 16
- 210000003719 b-lymphocyte Anatomy 0.000 title claims description 13
- 210000004443 dendritic cell Anatomy 0.000 title claims description 10
- 238000012512 characterization method Methods 0.000 claims abstract description 16
- 210000004027 cell Anatomy 0.000 claims description 262
- 230000014509 gene expression Effects 0.000 claims description 87
- 238000005259 measurement Methods 0.000 claims description 78
- -1 hsa-miR-1 Proteins 0.000 claims description 40
- 239000002679 microRNA Substances 0.000 claims description 35
- 210000001808 exosome Anatomy 0.000 claims description 23
- 108091070501 miRNA Proteins 0.000 claims description 20
- 238000002493 microarray Methods 0.000 claims description 18
- 238000002474 experimental method Methods 0.000 claims description 16
- 238000012706 support-vector machine Methods 0.000 claims description 16
- 230000002596 correlated effect Effects 0.000 claims description 13
- 238000012360 testing method Methods 0.000 claims description 13
- 239000013598 vector Substances 0.000 claims description 13
- 108091032973 (ribonucleotides)n+m Proteins 0.000 claims description 6
- 238000010606 normalization Methods 0.000 claims description 5
- 238000009826 distribution Methods 0.000 claims description 4
- 108091053841 Homo sapiens miR-483 stem-loop Proteins 0.000 claims 4
- 108091060465 Homo sapiens miR-767 stem-loop Proteins 0.000 claims 4
- 108091060466 Homo sapiens miR-1224 stem-loop Proteins 0.000 claims 3
- 108091069004 Homo sapiens miR-125a stem-loop Proteins 0.000 claims 3
- 108091069090 Homo sapiens miR-149 stem-loop Proteins 0.000 claims 3
- 108091069088 Homo sapiens miR-150 stem-loop Proteins 0.000 claims 3
- 108091065981 Homo sapiens miR-155 stem-loop Proteins 0.000 claims 3
- 108091070489 Homo sapiens miR-17 stem-loop Proteins 0.000 claims 3
- 108091069033 Homo sapiens miR-188 stem-loop Proteins 0.000 claims 3
- 108091070493 Homo sapiens miR-21 stem-loop Proteins 0.000 claims 3
- 108091070494 Homo sapiens miR-22 stem-loop Proteins 0.000 claims 3
- 108091067572 Homo sapiens miR-221 stem-loop Proteins 0.000 claims 3
- 108091069527 Homo sapiens miR-223 stem-loop Proteins 0.000 claims 3
- 108091070371 Homo sapiens miR-25 stem-loop Proteins 0.000 claims 3
- 108091065449 Homo sapiens miR-299 stem-loop Proteins 0.000 claims 3
- 108091067007 Homo sapiens miR-324 stem-loop Proteins 0.000 claims 3
- 108091066896 Homo sapiens miR-331 stem-loop Proteins 0.000 claims 3
- 108091066985 Homo sapiens miR-335 stem-loop Proteins 0.000 claims 3
- 108091067008 Homo sapiens miR-342 stem-loop Proteins 0.000 claims 3
- 108091067286 Homo sapiens miR-363 stem-loop Proteins 0.000 claims 3
- 108091032537 Homo sapiens miR-409 stem-loop Proteins 0.000 claims 3
- 108091061676 Homo sapiens miR-411 stem-loop Proteins 0.000 claims 3
- 108091032103 Homo sapiens miR-425 stem-loop Proteins 0.000 claims 3
- 108091064366 Homo sapiens miR-513a-1 stem-loop Proteins 0.000 claims 3
- 108091064370 Homo sapiens miR-513a-2 stem-loop Proteins 0.000 claims 3
- 108091063808 Homo sapiens miR-574 stem-loop Proteins 0.000 claims 3
- 108091061649 Homo sapiens miR-625 stem-loop Proteins 0.000 claims 3
- 108091061677 Homo sapiens miR-654 stem-loop Proteins 0.000 claims 3
- 108091060463 Homo sapiens miR-671 stem-loop Proteins 0.000 claims 3
- 108091070377 Homo sapiens miR-93 stem-loop Proteins 0.000 claims 3
- 108091008065 MIR21 Proteins 0.000 claims 3
- 108091068853 Homo sapiens miR-100 stem-loop Proteins 0.000 claims 2
- 108091069016 Homo sapiens miR-122 stem-loop Proteins 0.000 claims 2
- 108091044921 Homo sapiens miR-1225 stem-loop Proteins 0.000 claims 2
- 108091044923 Homo sapiens miR-1226 stem-loop Proteins 0.000 claims 2
- 108091044926 Homo sapiens miR-1227 stem-loop Proteins 0.000 claims 2
- 108091044953 Homo sapiens miR-1228 stem-loop Proteins 0.000 claims 2
- 108091044954 Homo sapiens miR-1229 stem-loop Proteins 0.000 claims 2
- 108091044903 Homo sapiens miR-1234 stem-loop Proteins 0.000 claims 2
- 108091069087 Homo sapiens miR-125b-2 stem-loop Proteins 0.000 claims 2
- 108091069085 Homo sapiens miR-126 stem-loop Proteins 0.000 claims 2
- 108091069086 Homo sapiens miR-127 stem-loop Proteins 0.000 claims 2
- 108091069024 Homo sapiens miR-132 stem-loop Proteins 0.000 claims 2
- 108091069102 Homo sapiens miR-136 stem-loop Proteins 0.000 claims 2
- 108091067617 Homo sapiens miR-139 stem-loop Proteins 0.000 claims 2
- 108091069017 Homo sapiens miR-140 stem-loop Proteins 0.000 claims 2
- 108091068991 Homo sapiens miR-141 stem-loop Proteins 0.000 claims 2
- 108091068993 Homo sapiens miR-142 stem-loop Proteins 0.000 claims 2
- 108091068992 Homo sapiens miR-143 stem-loop Proteins 0.000 claims 2
- 108091068999 Homo sapiens miR-144 stem-loop Proteins 0.000 claims 2
- 108091069002 Homo sapiens miR-145 stem-loop Proteins 0.000 claims 2
- 108091092238 Homo sapiens miR-146b stem-loop Proteins 0.000 claims 2
- 108091068955 Homo sapiens miR-154 stem-loop Proteins 0.000 claims 2
- 108091067618 Homo sapiens miR-181a-2 stem-loop Proteins 0.000 claims 2
- 108091067627 Homo sapiens miR-182 stem-loop Proteins 0.000 claims 2
- 108091067605 Homo sapiens miR-183 stem-loop Proteins 0.000 claims 2
- 108091068954 Homo sapiens miR-185 stem-loop Proteins 0.000 claims 2
- 108091068956 Homo sapiens miR-186 stem-loop Proteins 0.000 claims 2
- 108091067635 Homo sapiens miR-187 stem-loop Proteins 0.000 claims 2
- 108091068998 Homo sapiens miR-191 stem-loop Proteins 0.000 claims 2
- 108091067995 Homo sapiens miR-192 stem-loop Proteins 0.000 claims 2
- 108091069034 Homo sapiens miR-193a stem-loop Proteins 0.000 claims 2
- 108091068960 Homo sapiens miR-195 stem-loop Proteins 0.000 claims 2
- 108091067982 Homo sapiens miR-197 stem-loop Proteins 0.000 claims 2
- 108091067484 Homo sapiens miR-199b stem-loop Proteins 0.000 claims 2
- 108091092296 Homo sapiens miR-202 stem-loop Proteins 0.000 claims 2
- 108091067468 Homo sapiens miR-210 stem-loop Proteins 0.000 claims 2
- 108091067471 Homo sapiens miR-211 stem-loop Proteins 0.000 claims 2
- 108091067580 Homo sapiens miR-214 stem-loop Proteins 0.000 claims 2
- 108091067573 Homo sapiens miR-222 stem-loop Proteins 0.000 claims 2
- 108091070397 Homo sapiens miR-28 stem-loop Proteins 0.000 claims 2
- 108091065453 Homo sapiens miR-296 stem-loop Proteins 0.000 claims 2
- 108091070395 Homo sapiens miR-31 stem-loop Proteins 0.000 claims 2
- 108091070383 Homo sapiens miR-32 stem-loop Proteins 0.000 claims 2
- 108091066902 Homo sapiens miR-330 stem-loop Proteins 0.000 claims 2
- 108091067013 Homo sapiens miR-337 stem-loop Proteins 0.000 claims 2
- 108091067010 Homo sapiens miR-338 stem-loop Proteins 0.000 claims 2
- 108091066993 Homo sapiens miR-339 stem-loop Proteins 0.000 claims 2
- 108091066899 Homo sapiens miR-340 stem-loop Proteins 0.000 claims 2
- 108091066970 Homo sapiens miR-346 stem-loop Proteins 0.000 claims 2
- 108091065456 Homo sapiens miR-34c stem-loop Proteins 0.000 claims 2
- 108091067258 Homo sapiens miR-361 stem-loop Proteins 0.000 claims 2
- 108091067259 Homo sapiens miR-362 stem-loop Proteins 0.000 claims 2
- 108091067254 Homo sapiens miR-367 stem-loop Proteins 0.000 claims 2
- 108091067253 Homo sapiens miR-369 stem-loop Proteins 0.000 claims 2
- 108091067564 Homo sapiens miR-373 stem-loop Proteins 0.000 claims 2
- 108091067243 Homo sapiens miR-377 stem-loop Proteins 0.000 claims 2
- 108091067552 Homo sapiens miR-379 stem-loop Proteins 0.000 claims 2
- 108091067557 Homo sapiens miR-380 stem-loop Proteins 0.000 claims 2
- 108091032093 Homo sapiens miR-422a stem-loop Proteins 0.000 claims 2
- 108091032109 Homo sapiens miR-423 stem-loop Proteins 0.000 claims 2
- 108091032108 Homo sapiens miR-424 stem-loop Proteins 0.000 claims 2
- 108091032638 Homo sapiens miR-431 stem-loop Proteins 0.000 claims 2
- 108091092306 Homo sapiens miR-432 stem-loop Proteins 0.000 claims 2
- 108091086503 Homo sapiens miR-450b stem-loop Proteins 0.000 claims 2
- 108091032542 Homo sapiens miR-452 stem-loop Proteins 0.000 claims 2
- 108091062137 Homo sapiens miR-454 stem-loop Proteins 0.000 claims 2
- 108091063813 Homo sapiens miR-455 stem-loop Proteins 0.000 claims 2
- 108091053854 Homo sapiens miR-484 stem-loop Proteins 0.000 claims 2
- 108091053855 Homo sapiens miR-485 stem-loop Proteins 0.000 claims 2
- 108091053840 Homo sapiens miR-486 stem-loop Proteins 0.000 claims 2
- 108091059229 Homo sapiens miR-486-2 stem-loop Proteins 0.000 claims 2
- 108091092234 Homo sapiens miR-488 stem-loop Proteins 0.000 claims 2
- 108091092228 Homo sapiens miR-490 stem-loop Proteins 0.000 claims 2
- 108091092229 Homo sapiens miR-491 stem-loop Proteins 0.000 claims 2
- 108091092305 Homo sapiens miR-493 stem-loop Proteins 0.000 claims 2
- 108091092307 Homo sapiens miR-494 stem-loop Proteins 0.000 claims 2
- 108091092303 Homo sapiens miR-497 stem-loop Proteins 0.000 claims 2
- 108091064508 Homo sapiens miR-501 stem-loop Proteins 0.000 claims 2
- 108091064509 Homo sapiens miR-502 stem-loop Proteins 0.000 claims 2
- 108091064365 Homo sapiens miR-505 stem-loop Proteins 0.000 claims 2
- 108091064362 Homo sapiens miR-508 stem-loop Proteins 0.000 claims 2
- 108091064367 Homo sapiens miR-509-1 stem-loop Proteins 0.000 claims 2
- 108091086508 Homo sapiens miR-509-2 stem-loop Proteins 0.000 claims 2
- 108091087072 Homo sapiens miR-509-3 stem-loop Proteins 0.000 claims 2
- 108091092274 Homo sapiens miR-512-1 stem-loop Proteins 0.000 claims 2
- 108091092275 Homo sapiens miR-512-2 stem-loop Proteins 0.000 claims 2
- 108091092284 Homo sapiens miR-515-1 stem-loop Proteins 0.000 claims 2
- 108091092278 Homo sapiens miR-515-2 stem-loop Proteins 0.000 claims 2
- 108091064511 Homo sapiens miR-516a-1 stem-loop Proteins 0.000 claims 2
- 108091064512 Homo sapiens miR-516a-2 stem-loop Proteins 0.000 claims 2
- 108091064417 Homo sapiens miR-518d stem-loop Proteins 0.000 claims 2
- 108091092281 Homo sapiens miR-520a stem-loop Proteins 0.000 claims 2
- 108091064446 Homo sapiens miR-520d stem-loop Proteins 0.000 claims 2
- 108091064441 Homo sapiens miR-524 stem-loop Proteins 0.000 claims 2
- 108091064471 Homo sapiens miR-525 stem-loop Proteins 0.000 claims 2
- 108091063565 Homo sapiens miR-532 stem-loop Proteins 0.000 claims 2
- 108091086504 Homo sapiens miR-541 stem-loop Proteins 0.000 claims 2
- 108091061666 Homo sapiens miR-542 stem-loop Proteins 0.000 claims 2
- 108091063807 Homo sapiens miR-545 stem-loop Proteins 0.000 claims 2
- 108091061687 Homo sapiens miR-548a-3 stem-loop Proteins 0.000 claims 2
- 108091063777 Homo sapiens miR-548b stem-loop Proteins 0.000 claims 2
- 108091061641 Homo sapiens miR-548c stem-loop Proteins 0.000 claims 2
- 108091061614 Homo sapiens miR-548d-1 stem-loop Proteins 0.000 claims 2
- 108091061568 Homo sapiens miR-548d-2 stem-loop Proteins 0.000 claims 2
- 108091063734 Homo sapiens miR-556 stem-loop Proteins 0.000 claims 2
- 108091063737 Homo sapiens miR-559 stem-loop Proteins 0.000 claims 2
- 108091063748 Homo sapiens miR-563 stem-loop Proteins 0.000 claims 2
- 108091063721 Homo sapiens miR-576 stem-loop Proteins 0.000 claims 2
- 108091063718 Homo sapiens miR-579 stem-loop Proteins 0.000 claims 2
- 108091063723 Homo sapiens miR-582 stem-loop Proteins 0.000 claims 2
- 108091063772 Homo sapiens miR-589 stem-loop Proteins 0.000 claims 2
- 108091061594 Homo sapiens miR-590 stem-loop Proteins 0.000 claims 2
- 108091061599 Homo sapiens miR-593 stem-loop Proteins 0.000 claims 2
- 108091061785 Homo sapiens miR-597 stem-loop Proteins 0.000 claims 2
- 108091061684 Homo sapiens miR-602 stem-loop Proteins 0.000 claims 2
- 108091061690 Homo sapiens miR-606 stem-loop Proteins 0.000 claims 2
- 108091061772 Homo sapiens miR-609 stem-loop Proteins 0.000 claims 2
- 108091061776 Homo sapiens miR-610 stem-loop Proteins 0.000 claims 2
- 108091061778 Homo sapiens miR-615 stem-loop Proteins 0.000 claims 2
- 108091061779 Homo sapiens miR-616 stem-loop Proteins 0.000 claims 2
- 108091061642 Homo sapiens miR-617 stem-loop Proteins 0.000 claims 2
- 108091061653 Homo sapiens miR-623 stem-loop Proteins 0.000 claims 2
- 108091061644 Homo sapiens miR-624 stem-loop Proteins 0.000 claims 2
- 108091061622 Homo sapiens miR-628 stem-loop Proteins 0.000 claims 2
- 108091061631 Homo sapiens miR-629 stem-loop Proteins 0.000 claims 2
- 108091061639 Homo sapiens miR-631 stem-loop Proteins 0.000 claims 2
- 108091061638 Homo sapiens miR-633 stem-loop Proteins 0.000 claims 2
- 108091061634 Homo sapiens miR-634 stem-loop Proteins 0.000 claims 2
- 108091061623 Homo sapiens miR-636 stem-loop Proteins 0.000 claims 2
- 108091086460 Homo sapiens miR-708 stem-loop Proteins 0.000 claims 2
- 108091086454 Homo sapiens miR-744 stem-loop Proteins 0.000 claims 2
- 108091062100 Homo sapiens miR-769 stem-loop Proteins 0.000 claims 2
- 108091086462 Homo sapiens miR-875 stem-loop Proteins 0.000 claims 2
- 108091086461 Homo sapiens miR-876 stem-loop Proteins 0.000 claims 2
- 108091086647 Homo sapiens miR-877 stem-loop Proteins 0.000 claims 2
- 108091086652 Homo sapiens miR-885 stem-loop Proteins 0.000 claims 2
- 108091086506 Homo sapiens miR-888 stem-loop Proteins 0.000 claims 2
- 108091087086 Homo sapiens miR-933 stem-loop Proteins 0.000 claims 2
- 108091087082 Homo sapiens miR-937 stem-loop Proteins 0.000 claims 2
- 108091087118 Homo sapiens miR-943 stem-loop Proteins 0.000 claims 2
- 108091070376 Homo sapiens miR-96 stem-loop Proteins 0.000 claims 2
- 108091007773 MIR100 Proteins 0.000 claims 2
- 108091007685 MIR541 Proteins 0.000 claims 2
- 108091007780 MiR-122 Proteins 0.000 claims 2
- 238000004806 packaging method and process Methods 0.000 claims 2
- 229940124598 therapeutic candidate Drugs 0.000 claims 2
- 108091068928 Homo sapiens miR-107 stem-loop Proteins 0.000 claims 1
- 108091044940 Homo sapiens miR-1231 stem-loop Proteins 0.000 claims 1
- 108091044936 Homo sapiens miR-1236 stem-loop Proteins 0.000 claims 1
- 108091044937 Homo sapiens miR-1237 stem-loop Proteins 0.000 claims 1
- 108091044938 Homo sapiens miR-1238 stem-loop Proteins 0.000 claims 1
- 108091067642 Homo sapiens miR-129-1 stem-loop Proteins 0.000 claims 1
- 108091069093 Homo sapiens miR-129-2 stem-loop Proteins 0.000 claims 1
- 108091066990 Homo sapiens miR-133b stem-loop Proteins 0.000 claims 1
- 108091069094 Homo sapiens miR-134 stem-loop Proteins 0.000 claims 1
- 108091068985 Homo sapiens miR-137 stem-loop Proteins 0.000 claims 1
- 108091069092 Homo sapiens miR-138-1 stem-loop Proteins 0.000 claims 1
- 108091069015 Homo sapiens miR-138-2 stem-loop Proteins 0.000 claims 1
- 108091068997 Homo sapiens miR-152 stem-loop Proteins 0.000 claims 1
- 108091070491 Homo sapiens miR-16-1 stem-loop Proteins 0.000 claims 1
- 108091068927 Homo sapiens miR-16-2 stem-loop Proteins 0.000 claims 1
- 108091068958 Homo sapiens miR-184 stem-loop Proteins 0.000 claims 1
- 108091067677 Homo sapiens miR-198 stem-loop Proteins 0.000 claims 1
- 108091067692 Homo sapiens miR-199a-1 stem-loop Proteins 0.000 claims 1
- 108091067467 Homo sapiens miR-199a-2 stem-loop Proteins 0.000 claims 1
- 108091070519 Homo sapiens miR-19b-1 stem-loop Proteins 0.000 claims 1
- 108091070495 Homo sapiens miR-19b-2 stem-loop Proteins 0.000 claims 1
- 108091067470 Homo sapiens miR-204 stem-loop Proteins 0.000 claims 1
- 108091067482 Homo sapiens miR-205 stem-loop Proteins 0.000 claims 1
- 108091069013 Homo sapiens miR-206 stem-loop Proteins 0.000 claims 1
- 108091067466 Homo sapiens miR-212 stem-loop Proteins 0.000 claims 1
- 108091067578 Homo sapiens miR-215 stem-loop Proteins 0.000 claims 1
- 108091067465 Homo sapiens miR-217 stem-loop Proteins 0.000 claims 1
- 108091067464 Homo sapiens miR-218-1 stem-loop Proteins 0.000 claims 1
- 108091067463 Homo sapiens miR-218-2 stem-loop Proteins 0.000 claims 1
- 108091069517 Homo sapiens miR-224 stem-loop Proteins 0.000 claims 1
- 108091070373 Homo sapiens miR-24-1 stem-loop Proteins 0.000 claims 1
- 108091070374 Homo sapiens miR-24-2 stem-loop Proteins 0.000 claims 1
- 108091070372 Homo sapiens miR-26a-1 stem-loop Proteins 0.000 claims 1
- 108091065428 Homo sapiens miR-26a-2 stem-loop Proteins 0.000 claims 1
- 108091086975 Homo sapiens miR-297 stem-loop Proteins 0.000 claims 1
- 108091086636 Homo sapiens miR-298 stem-loop Proteins 0.000 claims 1
- 108091068837 Homo sapiens miR-29b-1 stem-loop Proteins 0.000 claims 1
- 108091068845 Homo sapiens miR-29b-2 stem-loop Proteins 0.000 claims 1
- 108091086634 Homo sapiens miR-300 stem-loop Proteins 0.000 claims 1
- 108091065163 Homo sapiens miR-30c-1 stem-loop Proteins 0.000 claims 1
- 108091067641 Homo sapiens miR-30c-2 stem-loop Proteins 0.000 claims 1
- 108091066988 Homo sapiens miR-325 stem-loop Proteins 0.000 claims 1
- 108091067011 Homo sapiens miR-326 stem-loop Proteins 0.000 claims 1
- 108091067005 Homo sapiens miR-328 stem-loop Proteins 0.000 claims 1
- 108091066987 Homo sapiens miR-345 stem-loop Proteins 0.000 claims 1
- 108091067267 Homo sapiens miR-370 stem-loop Proteins 0.000 claims 1
- 108091067570 Homo sapiens miR-372 stem-loop Proteins 0.000 claims 1
- 108091067535 Homo sapiens miR-375 stem-loop Proteins 0.000 claims 1
- 108091067554 Homo sapiens miR-381 stem-loop Proteins 0.000 claims 1
- 108091067543 Homo sapiens miR-382 stem-loop Proteins 0.000 claims 1
- 108091067545 Homo sapiens miR-383 stem-loop Proteins 0.000 claims 1
- 108091033149 Homo sapiens miR-384 stem-loop Proteins 0.000 claims 1
- 108091053847 Homo sapiens miR-410 stem-loop Proteins 0.000 claims 1
- 108091053842 Homo sapiens miR-412 stem-loop Proteins 0.000 claims 1
- 108091061665 Homo sapiens miR-421 stem-loop Proteins 0.000 claims 1
- 108091032930 Homo sapiens miR-429 stem-loop Proteins 0.000 claims 1
- 108091032636 Homo sapiens miR-433 stem-loop Proteins 0.000 claims 1
- 108091032861 Homo sapiens miR-448 stem-loop Proteins 0.000 claims 1
- 108091032929 Homo sapiens miR-449a stem-loop Proteins 0.000 claims 1
- 108091092227 Homo sapiens miR-489 stem-loop Proteins 0.000 claims 1
- 108091092304 Homo sapiens miR-492 stem-loop Proteins 0.000 claims 1
- 108091092297 Homo sapiens miR-495 stem-loop Proteins 0.000 claims 1
- 108091092298 Homo sapiens miR-496 stem-loop Proteins 0.000 claims 1
- 108091092282 Homo sapiens miR-498 stem-loop Proteins 0.000 claims 1
- 108091064515 Homo sapiens miR-503 stem-loop Proteins 0.000 claims 1
- 108091064516 Homo sapiens miR-504 stem-loop Proteins 0.000 claims 1
- 108091064363 Homo sapiens miR-506 stem-loop Proteins 0.000 claims 1
- 108091064364 Homo sapiens miR-507 stem-loop Proteins 0.000 claims 1
- 108091064371 Homo sapiens miR-510 stem-loop Proteins 0.000 claims 1
- 108091092230 Homo sapiens miR-511 stem-loop Proteins 0.000 claims 1
- 108091064420 Homo sapiens miR-518a-1 stem-loop Proteins 0.000 claims 1
- 108091064422 Homo sapiens miR-518a-2 stem-loop Proteins 0.000 claims 1
- 108091064470 Homo sapiens miR-518b stem-loop Proteins 0.000 claims 1
- 108091064474 Homo sapiens miR-519b stem-loop Proteins 0.000 claims 1
- 108091092280 Homo sapiens miR-519c stem-loop Proteins 0.000 claims 1
- 108091064467 Homo sapiens miR-520c stem-loop Proteins 0.000 claims 1
- 108091064423 Homo sapiens miR-520h stem-loop Proteins 0.000 claims 1
- 108091064429 Homo sapiens miR-521-1 stem-loop Proteins 0.000 claims 1
- 108091064455 Homo sapiens miR-521-2 stem-loop Proteins 0.000 claims 1
- 108091064426 Homo sapiens miR-522 stem-loop Proteins 0.000 claims 1
- 108091064465 Homo sapiens miR-523 stem-loop Proteins 0.000 claims 1
- 108091064424 Homo sapiens miR-527 stem-loop Proteins 0.000 claims 1
- 108091063810 Homo sapiens miR-539 stem-loop Proteins 0.000 claims 1
- 108091086476 Homo sapiens miR-543 stem-loop Proteins 0.000 claims 1
- 108091063773 Homo sapiens miR-548a-1 stem-loop Proteins 0.000 claims 1
- 108091063768 Homo sapiens miR-548a-2 stem-loop Proteins 0.000 claims 1
- 108091063753 Homo sapiens miR-551a stem-loop Proteins 0.000 claims 1
- 108091063755 Homo sapiens miR-552 stem-loop Proteins 0.000 claims 1
- 108091063758 Homo sapiens miR-553 stem-loop Proteins 0.000 claims 1
- 108091063756 Homo sapiens miR-554 stem-loop Proteins 0.000 claims 1
- 108091063741 Homo sapiens miR-555 stem-loop Proteins 0.000 claims 1
- 108091063735 Homo sapiens miR-557 stem-loop Proteins 0.000 claims 1
- 108091063736 Homo sapiens miR-558 stem-loop Proteins 0.000 claims 1
- 108091063743 Homo sapiens miR-561 stem-loop Proteins 0.000 claims 1
- 108091063744 Homo sapiens miR-562 stem-loop Proteins 0.000 claims 1
- 108091063727 Homo sapiens miR-564 stem-loop Proteins 0.000 claims 1
- 108091063731 Homo sapiens miR-567 stem-loop Proteins 0.000 claims 1
- 108091063725 Homo sapiens miR-568 stem-loop Proteins 0.000 claims 1
- 108091063732 Homo sapiens miR-569 stem-loop Proteins 0.000 claims 1
- 108091063733 Homo sapiens miR-570 stem-loop Proteins 0.000 claims 1
- 108091063730 Homo sapiens miR-571 stem-loop Proteins 0.000 claims 1
- 108091063726 Homo sapiens miR-572 stem-loop Proteins 0.000 claims 1
- 108091063804 Homo sapiens miR-573 stem-loop Proteins 0.000 claims 1
- 108091063720 Homo sapiens miR-575 stem-loop Proteins 0.000 claims 1
- 108091063716 Homo sapiens miR-577 stem-loop Proteins 0.000 claims 1
- 108091063717 Homo sapiens miR-578 stem-loop Proteins 0.000 claims 1
- 108091063719 Homo sapiens miR-580 stem-loop Proteins 0.000 claims 1
- 108091063722 Homo sapiens miR-581 stem-loop Proteins 0.000 claims 1
- 108091063764 Homo sapiens miR-583 stem-loop Proteins 0.000 claims 1
- 108091063765 Homo sapiens miR-584 stem-loop Proteins 0.000 claims 1
- 108091063769 Homo sapiens miR-585 stem-loop Proteins 0.000 claims 1
- 108091063771 Homo sapiens miR-586 stem-loop Proteins 0.000 claims 1
- 108091063776 Homo sapiens miR-587 stem-loop Proteins 0.000 claims 1
- 108091063767 Homo sapiens miR-588 stem-loop Proteins 0.000 claims 1
- 108091061591 Homo sapiens miR-591 stem-loop Proteins 0.000 claims 1
- 108091061592 Homo sapiens miR-592 stem-loop Proteins 0.000 claims 1
- 108091061597 Homo sapiens miR-595 stem-loop Proteins 0.000 claims 1
- 108091061598 Homo sapiens miR-596 stem-loop Proteins 0.000 claims 1
- 108091061783 Homo sapiens miR-598 stem-loop Proteins 0.000 claims 1
- 108091061784 Homo sapiens miR-599 stem-loop Proteins 0.000 claims 1
- 108091061688 Homo sapiens miR-600 stem-loop Proteins 0.000 claims 1
- 108091061683 Homo sapiens miR-601 stem-loop Proteins 0.000 claims 1
- 108091061789 Homo sapiens miR-603 stem-loop Proteins 0.000 claims 1
- 108091061787 Homo sapiens miR-604 stem-loop Proteins 0.000 claims 1
- 108091061689 Homo sapiens miR-605 stem-loop Proteins 0.000 claims 1
- 108091061774 Homo sapiens miR-607 stem-loop Proteins 0.000 claims 1
- 108091061775 Homo sapiens miR-608 stem-loop Proteins 0.000 claims 1
- 108091061777 Homo sapiens miR-611 stem-loop Proteins 0.000 claims 1
- 108091061780 Homo sapiens miR-612 stem-loop Proteins 0.000 claims 1
- 108091061781 Homo sapiens miR-613 stem-loop Proteins 0.000 claims 1
- 108091061773 Homo sapiens miR-614 stem-loop Proteins 0.000 claims 1
- 108091061645 Homo sapiens miR-618 stem-loop Proteins 0.000 claims 1
- 108091061646 Homo sapiens miR-619 stem-loop Proteins 0.000 claims 1
- 108091061650 Homo sapiens miR-620 stem-loop Proteins 0.000 claims 1
- 108091061647 Homo sapiens miR-621 stem-loop Proteins 0.000 claims 1
- 108091061648 Homo sapiens miR-622 stem-loop Proteins 0.000 claims 1
- 108091061633 Homo sapiens miR-626 stem-loop Proteins 0.000 claims 1
- 108091061621 Homo sapiens miR-627 stem-loop Proteins 0.000 claims 1
- 108091061636 Homo sapiens miR-630 stem-loop Proteins 0.000 claims 1
- 108091061637 Homo sapiens miR-632 stem-loop Proteins 0.000 claims 1
- 108091061626 Homo sapiens miR-635 stem-loop Proteins 0.000 claims 1
- 108091061618 Homo sapiens miR-637 stem-loop Proteins 0.000 claims 1
- 108091061613 Homo sapiens miR-638 stem-loop Proteins 0.000 claims 1
- 108091061611 Homo sapiens miR-639 stem-loop Proteins 0.000 claims 1
- 108091061625 Homo sapiens miR-640 stem-loop Proteins 0.000 claims 1
- 108091061624 Homo sapiens miR-641 stem-loop Proteins 0.000 claims 1
- 108091061630 Homo sapiens miR-643 stem-loop Proteins 0.000 claims 1
- 108091061604 Homo sapiens miR-645 stem-loop Proteins 0.000 claims 1
- 108091061601 Homo sapiens miR-646 stem-loop Proteins 0.000 claims 1
- 108091061602 Homo sapiens miR-647 stem-loop Proteins 0.000 claims 1
- 108091061609 Homo sapiens miR-648 stem-loop Proteins 0.000 claims 1
- 108091061610 Homo sapiens miR-649 stem-loop Proteins 0.000 claims 1
- 108091061608 Homo sapiens miR-650 stem-loop Proteins 0.000 claims 1
- 108091061603 Homo sapiens miR-651 stem-loop Proteins 0.000 claims 1
- 108091061616 Homo sapiens miR-652 stem-loop Proteins 0.000 claims 1
- 108091061679 Homo sapiens miR-653 stem-loop Proteins 0.000 claims 1
- 108091061680 Homo sapiens miR-655 stem-loop Proteins 0.000 claims 1
- 108091061564 Homo sapiens miR-656 stem-loop Proteins 0.000 claims 1
- 108091061671 Homo sapiens miR-657 stem-loop Proteins 0.000 claims 1
- 108091061674 Homo sapiens miR-658 stem-loop Proteins 0.000 claims 1
- 108091061675 Homo sapiens miR-659 stem-loop Proteins 0.000 claims 1
- 108091061672 Homo sapiens miR-660 stem-loop Proteins 0.000 claims 1
- 108091061615 Homo sapiens miR-661 stem-loop Proteins 0.000 claims 1
- 108091061570 Homo sapiens miR-662 stem-loop Proteins 0.000 claims 1
- 108091086478 Homo sapiens miR-665 stem-loop Proteins 0.000 claims 1
- 108091060464 Homo sapiens miR-668 stem-loop Proteins 0.000 claims 1
- 108091086709 Homo sapiens miR-675 stem-loop Proteins 0.000 claims 1
- 108091067625 Homo sapiens miR-7-1 stem-loop Proteins 0.000 claims 1
- 108091067630 Homo sapiens miR-7-2 stem-loop Proteins 0.000 claims 1
- 108091060481 Homo sapiens miR-758 stem-loop Proteins 0.000 claims 1
- 108091086475 Homo sapiens miR-760 stem-loop Proteins 0.000 claims 1
- 108091087855 Homo sapiens miR-765 stem-loop Proteins 0.000 claims 1
- 108091062099 Homo sapiens miR-766 stem-loop Proteins 0.000 claims 1
- 108091087853 Homo sapiens miR-770 stem-loop Proteins 0.000 claims 1
- 108091061966 Homo sapiens miR-802 stem-loop Proteins 0.000 claims 1
- 108091086477 Homo sapiens miR-873 stem-loop Proteins 0.000 claims 1
- 108091086502 Homo sapiens miR-874 stem-loop Proteins 0.000 claims 1
- 108091086472 Homo sapiens miR-887 stem-loop Proteins 0.000 claims 1
- 108091086467 Homo sapiens miR-889 stem-loop Proteins 0.000 claims 1
- 108091086511 Homo sapiens miR-890 stem-loop Proteins 0.000 claims 1
- 108091086510 Homo sapiens miR-891b stem-loop Proteins 0.000 claims 1
- 108091086639 Homo sapiens miR-892a stem-loop Proteins 0.000 claims 1
- 108091086505 Homo sapiens miR-892b stem-loop Proteins 0.000 claims 1
- 108091087068 Homo sapiens miR-920 stem-loop Proteins 0.000 claims 1
- 108091087065 Homo sapiens miR-921 stem-loop Proteins 0.000 claims 1
- 108091087064 Homo sapiens miR-922 stem-loop Proteins 0.000 claims 1
- 108091087063 Homo sapiens miR-924 stem-loop Proteins 0.000 claims 1
- 108091070380 Homo sapiens miR-92a-1 stem-loop Proteins 0.000 claims 1
- 108091070381 Homo sapiens miR-92a-2 stem-loop Proteins 0.000 claims 1
- 108091087085 Homo sapiens miR-934 stem-loop Proteins 0.000 claims 1
- 108091087084 Homo sapiens miR-935 stem-loop Proteins 0.000 claims 1
- 108091087083 Homo sapiens miR-936 stem-loop Proteins 0.000 claims 1
- 108091087106 Homo sapiens miR-938 stem-loop Proteins 0.000 claims 1
- 108091087105 Homo sapiens miR-939 stem-loop Proteins 0.000 claims 1
- 108091087110 Homo sapiens miR-940 stem-loop Proteins 0.000 claims 1
- 108091087109 Homo sapiens miR-941-1 stem-loop Proteins 0.000 claims 1
- 108091087114 Homo sapiens miR-941-2 stem-loop Proteins 0.000 claims 1
- 108091087113 Homo sapiens miR-941-3 stem-loop Proteins 0.000 claims 1
- 108091087111 Homo sapiens miR-941-4 stem-loop Proteins 0.000 claims 1
- 108091045521 Homo sapiens miR-941-5 stem-loop Proteins 0.000 claims 1
- 108091087115 Homo sapiens miR-942 stem-loop Proteins 0.000 claims 1
- 108091087117 Homo sapiens miR-944 stem-loop Proteins 0.000 claims 1
- 108091070375 Homo sapiens miR-95 stem-loop Proteins 0.000 claims 1
- 108091068856 Homo sapiens miR-98 stem-loop Proteins 0.000 claims 1
- 208000037265 diseases, disorders, signs and symptoms Diseases 0.000 abstract description 72
- 201000010099 disease Diseases 0.000 abstract description 70
- 239000000126 substance Substances 0.000 abstract description 27
- 241000251539 Vertebrata <Metazoa> Species 0.000 abstract description 12
- 108090000623 proteins and genes Proteins 0.000 description 171
- 102000004169 proteins and genes Human genes 0.000 description 115
- 239000000523 sample Substances 0.000 description 92
- 229920002477 rna polymer Polymers 0.000 description 89
- 235000018102 proteins Nutrition 0.000 description 78
- 238000004422 calculation algorithm Methods 0.000 description 59
- 239000011159 matrix material Substances 0.000 description 39
- 206010028980 Neoplasm Diseases 0.000 description 38
- 201000011510 cancer Diseases 0.000 description 33
- 239000012472 biological sample Substances 0.000 description 32
- 102000053602 DNA Human genes 0.000 description 30
- 108020004414 DNA Proteins 0.000 description 30
- 108010052285 Membrane Proteins Proteins 0.000 description 30
- 239000012528 membrane Substances 0.000 description 30
- 239000000203 mixture Substances 0.000 description 30
- 150000001875 compounds Chemical class 0.000 description 28
- 238000002955 isolation Methods 0.000 description 28
- 210000004379 membrane Anatomy 0.000 description 28
- 230000006870 function Effects 0.000 description 27
- 108700011259 MicroRNAs Proteins 0.000 description 26
- 150000002632 lipids Chemical class 0.000 description 24
- 210000004369 blood Anatomy 0.000 description 21
- 239000008280 blood Substances 0.000 description 21
- 238000000746 purification Methods 0.000 description 21
- 102000018697 Membrane Proteins Human genes 0.000 description 20
- 102000039446 nucleic acids Human genes 0.000 description 20
- 108020004707 nucleic acids Proteins 0.000 description 20
- 150000007523 nucleic acids Chemical class 0.000 description 20
- 238000004113 cell culture Methods 0.000 description 19
- 238000003559 RNA-seq method Methods 0.000 description 18
- 230000001225 therapeutic effect Effects 0.000 description 18
- 238000012549 training Methods 0.000 description 18
- 238000004458 analytical method Methods 0.000 description 17
- 108090000765 processed proteins & peptides Proteins 0.000 description 17
- 239000003814 drug Substances 0.000 description 16
- 108020004999 messenger RNA Proteins 0.000 description 16
- 239000003795 chemical substances by application Substances 0.000 description 15
- 239000012634 fragment Substances 0.000 description 15
- 102000004196 processed proteins & peptides Human genes 0.000 description 14
- 238000000926 separation method Methods 0.000 description 14
- 229920001184 polypeptide Polymers 0.000 description 13
- 102000005962 receptors Human genes 0.000 description 13
- 108020003175 receptors Proteins 0.000 description 13
- 238000013528 artificial neural network Methods 0.000 description 12
- 230000008569 process Effects 0.000 description 12
- 238000012545 processing Methods 0.000 description 12
- 210000001519 tissue Anatomy 0.000 description 12
- 239000000427 antigen Substances 0.000 description 11
- 102000036639 antigens Human genes 0.000 description 11
- 108091007433 antigens Proteins 0.000 description 11
- 239000013060 biological fluid Substances 0.000 description 11
- 210000002865 immune cell Anatomy 0.000 description 11
- 238000000338 in vitro Methods 0.000 description 11
- 210000000056 organ Anatomy 0.000 description 11
- 239000008177 pharmaceutical agent Substances 0.000 description 11
- 238000013179 statistical model Methods 0.000 description 11
- 238000011282 treatment Methods 0.000 description 11
- 239000000232 Lipid Bilayer Substances 0.000 description 10
- 206010058467 Lung neoplasm malignant Diseases 0.000 description 10
- 241001465754 Metazoa Species 0.000 description 10
- 230000000694 effects Effects 0.000 description 10
- 230000002068 genetic effect Effects 0.000 description 10
- 201000005202 lung cancer Diseases 0.000 description 10
- 208000020816 lung neoplasm Diseases 0.000 description 10
- 238000004949 mass spectrometry Methods 0.000 description 10
- 230000027455 binding Effects 0.000 description 9
- 238000010801 machine learning Methods 0.000 description 9
- 238000007637 random forest analysis Methods 0.000 description 9
- 239000004055 small Interfering RNA Substances 0.000 description 9
- 238000002965 ELISA Methods 0.000 description 8
- 241000282412 Homo Species 0.000 description 8
- 238000003066 decision tree Methods 0.000 description 8
- 150000004676 glycans Chemical class 0.000 description 8
- 230000008685 targeting Effects 0.000 description 8
- 108091032955 Bacterial small RNA Proteins 0.000 description 7
- 210000000170 cell membrane Anatomy 0.000 description 7
- 238000013500 data storage Methods 0.000 description 7
- 210000002919 epithelial cell Anatomy 0.000 description 7
- 210000004602 germ cell Anatomy 0.000 description 7
- 230000011987 methylation Effects 0.000 description 7
- 238000007069 methylation reaction Methods 0.000 description 7
- 239000002245 particle Substances 0.000 description 7
- 238000003752 polymerase chain reaction Methods 0.000 description 7
- 238000002360 preparation method Methods 0.000 description 7
- 229940124597 therapeutic agent Drugs 0.000 description 7
- 238000001262 western blot Methods 0.000 description 7
- 206010069754 Acquired gene mutation Diseases 0.000 description 6
- 206010006187 Breast cancer Diseases 0.000 description 6
- 208000026310 Breast neoplasm Diseases 0.000 description 6
- 241000124008 Mammalia Species 0.000 description 6
- 239000011324 bead Substances 0.000 description 6
- 210000001124 body fluid Anatomy 0.000 description 6
- 238000001514 detection method Methods 0.000 description 6
- 229940079593 drug Drugs 0.000 description 6
- 238000000684 flow cytometry Methods 0.000 description 6
- 238000012606 in vitro cell culture Methods 0.000 description 6
- 230000003993 interaction Effects 0.000 description 6
- 230000015654 memory Effects 0.000 description 6
- 230000035772 mutation Effects 0.000 description 6
- 230000004044 response Effects 0.000 description 6
- 230000037439 somatic mutation Effects 0.000 description 6
- 239000000758 substrate Substances 0.000 description 6
- 102000040650 (ribonucleotides)n+m Human genes 0.000 description 5
- 102100037904 CD9 antigen Human genes 0.000 description 5
- 108060003951 Immunoglobulin Proteins 0.000 description 5
- 108020004459 Small interfering RNA Proteins 0.000 description 5
- 239000008186 active pharmaceutical agent Substances 0.000 description 5
- 230000004075 alteration Effects 0.000 description 5
- 238000013459 approach Methods 0.000 description 5
- 238000013135 deep learning Methods 0.000 description 5
- 238000003745 diagnosis Methods 0.000 description 5
- 238000000605 extraction Methods 0.000 description 5
- 102000018358 immunoglobulin Human genes 0.000 description 5
- 230000006872 improvement Effects 0.000 description 5
- 238000012417 linear regression Methods 0.000 description 5
- 239000002105 nanoparticle Substances 0.000 description 5
- 238000013138 pruning Methods 0.000 description 5
- 238000011002 quantification Methods 0.000 description 5
- 230000001105 regulatory effect Effects 0.000 description 5
- 239000007787 solid Substances 0.000 description 5
- 210000000130 stem cell Anatomy 0.000 description 5
- 238000002560 therapeutic procedure Methods 0.000 description 5
- 108010022579 ATP dependent 26S protease Proteins 0.000 description 4
- 108010050332 IQ motif containing GTPase activating protein 1 Proteins 0.000 description 4
- 102100034419 Ras GTPase-activating-like protein IQGAP1 Human genes 0.000 description 4
- 108091027967 Small hairpin RNA Proteins 0.000 description 4
- 108091046869 Telomeric non-coding RNA Proteins 0.000 description 4
- 238000013136 deep learning model Methods 0.000 description 4
- 235000014113 dietary fatty acids Nutrition 0.000 description 4
- 229930195729 fatty acid Natural products 0.000 description 4
- 239000000194 fatty acid Substances 0.000 description 4
- 150000004665 fatty acids Chemical class 0.000 description 4
- 230000001976 improved effect Effects 0.000 description 4
- 239000000463 material Substances 0.000 description 4
- 230000007246 mechanism Effects 0.000 description 4
- 238000012544 monitoring process Methods 0.000 description 4
- 229920000642 polymer Polymers 0.000 description 4
- 102000040430 polynucleotide Human genes 0.000 description 4
- 108091033319 polynucleotide Proteins 0.000 description 4
- 239000002157 polynucleotide Substances 0.000 description 4
- 229920001282 polysaccharide Polymers 0.000 description 4
- 239000005017 polysaccharide Substances 0.000 description 4
- 230000009467 reduction Effects 0.000 description 4
- 230000003248 secreting effect Effects 0.000 description 4
- 238000001542 size-exclusion chromatography Methods 0.000 description 4
- 238000000528 statistical test Methods 0.000 description 4
- 238000003860 storage Methods 0.000 description 4
- 235000000346 sugar Nutrition 0.000 description 4
- 239000003053 toxin Substances 0.000 description 4
- 231100000765 toxin Toxicity 0.000 description 4
- 108700012359 toxins Proteins 0.000 description 4
- 238000012800 visualization Methods 0.000 description 4
- 208000024827 Alzheimer disease Diseases 0.000 description 3
- 108091006146 Channels Proteins 0.000 description 3
- 108091054442 EV proteins Proteins 0.000 description 3
- 102000013366 Filamin Human genes 0.000 description 3
- 108060002900 Filamin Proteins 0.000 description 3
- 102100031829 Myosin light polypeptide 6 Human genes 0.000 description 3
- 101710101143 Myosin light polypeptide 6 Proteins 0.000 description 3
- 206010033128 Ovarian cancer Diseases 0.000 description 3
- 206010061535 Ovarian neoplasm Diseases 0.000 description 3
- 208000024777 Prion disease Diseases 0.000 description 3
- 229930006000 Sucrose Natural products 0.000 description 3
- CZMRCDWAGMRECN-UGDNZRGBSA-N Sucrose Chemical compound O[C@H]1[C@H](O)[C@@H](CO)O[C@@]1(CO)O[C@@H]1[C@H](O)[C@@H](O)[C@H](O)[C@@H](CO)O1 CZMRCDWAGMRECN-UGDNZRGBSA-N 0.000 description 3
- 208000003721 Triple Negative Breast Neoplasms Diseases 0.000 description 3
- 210000004381 amniotic fluid Anatomy 0.000 description 3
- 206010002026 amyotrophic lateral sclerosis Diseases 0.000 description 3
- 150000001720 carbohydrates Chemical class 0.000 description 3
- 235000014633 carbohydrates Nutrition 0.000 description 3
- 210000004413 cardiac myocyte Anatomy 0.000 description 3
- 230000034303 cell budding Effects 0.000 description 3
- 210000001175 cerebrospinal fluid Anatomy 0.000 description 3
- 239000002299 complementary DNA Substances 0.000 description 3
- 238000005094 computer simulation Methods 0.000 description 3
- 230000000875 corresponding effect Effects 0.000 description 3
- 230000001086 cytosolic effect Effects 0.000 description 3
- 238000001962 electrophoresis Methods 0.000 description 3
- 210000001163 endosome Anatomy 0.000 description 3
- 230000007613 environmental effect Effects 0.000 description 3
- 238000001914 filtration Methods 0.000 description 3
- 238000000799 fluorescence microscopy Methods 0.000 description 3
- 230000004927 fusion Effects 0.000 description 3
- 208000005017 glioblastoma Diseases 0.000 description 3
- 235000020256 human milk Nutrition 0.000 description 3
- 210000004251 human milk Anatomy 0.000 description 3
- 238000003364 immunohistochemistry Methods 0.000 description 3
- 210000003734 kidney Anatomy 0.000 description 3
- 210000003292 kidney cell Anatomy 0.000 description 3
- 230000000670 limiting effect Effects 0.000 description 3
- 238000007477 logistic regression Methods 0.000 description 3
- 210000004072 lung Anatomy 0.000 description 3
- 238000012083 mass cytometry Methods 0.000 description 3
- 230000002503 metabolic effect Effects 0.000 description 3
- 230000002438 mitochondrial effect Effects 0.000 description 3
- 239000011259 mixed solution Substances 0.000 description 3
- 230000004048 modification Effects 0.000 description 3
- 238000012986 modification Methods 0.000 description 3
- 210000003061 neural cell Anatomy 0.000 description 3
- 230000004770 neurodegeneration Effects 0.000 description 3
- 208000015122 neurodegenerative disease Diseases 0.000 description 3
- 210000004498 neuroglial cell Anatomy 0.000 description 3
- 238000005457 optimization Methods 0.000 description 3
- 230000037361 pathway Effects 0.000 description 3
- 230000000144 pharmacologic effect Effects 0.000 description 3
- 150000003904 phospholipids Chemical class 0.000 description 3
- 210000003296 saliva Anatomy 0.000 description 3
- 230000011664 signaling Effects 0.000 description 3
- 235000021309 simple sugar Nutrition 0.000 description 3
- 210000002363 skeletal muscle cell Anatomy 0.000 description 3
- 150000003384 small molecules Chemical class 0.000 description 3
- 239000005720 sucrose Substances 0.000 description 3
- 210000001179 synovial fluid Anatomy 0.000 description 3
- 230000001988 toxicity Effects 0.000 description 3
- 231100000419 toxicity Toxicity 0.000 description 3
- 208000022679 triple-negative breast carcinoma Diseases 0.000 description 3
- 210000002700 urine Anatomy 0.000 description 3
- 238000000733 zeta-potential measurement Methods 0.000 description 3
- ZSZXYWFCIKKZBT-IVYVYLGESA-N 1,2-dihexadecanoyl-sn-glycero-3-phospho-(1D-myo-inositol-3,4,5-trisphosphate) Chemical compound CCCCCCCCCCCCCCCC(=O)OC[C@@H](OC(=O)CCCCCCCCCCCCCCC)COP(O)(=O)O[C@@H]1[C@H](O)[C@H](OP(O)(O)=O)[C@@H](OP(O)(O)=O)[C@H](OP(O)(O)=O)[C@H]1O ZSZXYWFCIKKZBT-IVYVYLGESA-N 0.000 description 2
- 101710183121 14-3-3 protein zeta/delta Proteins 0.000 description 2
- 102100040685 14-3-3 protein zeta/delta Human genes 0.000 description 2
- 102100021308 60S ribosomal protein L23 Human genes 0.000 description 2
- KDCGOANMDULRCW-UHFFFAOYSA-N 7H-purine Chemical compound N1=CNC2=NC=NC2=C1 KDCGOANMDULRCW-UHFFFAOYSA-N 0.000 description 2
- 102100023826 ADP-ribosylation factor 4 Human genes 0.000 description 2
- 101710139741 ADP-ribosylation factor 4 Proteins 0.000 description 2
- 208000031295 Animal disease Diseases 0.000 description 2
- 108020005544 Antisense RNA Proteins 0.000 description 2
- 101001130274 Arabidopsis thaliana Ras-related protein RABF1 Proteins 0.000 description 2
- 208000011594 Autoinflammatory disease Diseases 0.000 description 2
- 208000003174 Brain Neoplasms Diseases 0.000 description 2
- 102100035893 CD151 antigen Human genes 0.000 description 2
- 102100025222 CD63 antigen Human genes 0.000 description 2
- 102100027221 CD81 antigen Human genes 0.000 description 2
- 102100040751 Casein kinase II subunit alpha Human genes 0.000 description 2
- 101710099573 Casein kinase II subunit alpha Proteins 0.000 description 2
- 102000002734 Collagen Type VI Human genes 0.000 description 2
- 108010043741 Collagen Type VI Proteins 0.000 description 2
- 238000000018 DNA microarray Methods 0.000 description 2
- 206010012289 Dementia Diseases 0.000 description 2
- 206010061818 Disease progression Diseases 0.000 description 2
- 102000004190 Enzymes Human genes 0.000 description 2
- 108090000790 Enzymes Proteins 0.000 description 2
- 102100029974 GTPase HRas Human genes 0.000 description 2
- 101710091881 GTPase HRas Proteins 0.000 description 2
- 102100040510 Galectin-3-binding protein Human genes 0.000 description 2
- 101710197901 Galectin-3-binding protein Proteins 0.000 description 2
- 229930186217 Glycolipid Natural products 0.000 description 2
- 102100034264 Guanine nucleotide-binding protein G(i) subunit alpha-3 Human genes 0.000 description 2
- 102100040407 Heat shock 70 kDa protein 1B Human genes 0.000 description 2
- 102100027421 Heat shock cognate 71 kDa protein Human genes 0.000 description 2
- 101710104933 Heat shock cognate 71 kDa protein Proteins 0.000 description 2
- 102100032510 Heat shock protein HSP 90-beta Human genes 0.000 description 2
- 101710163596 Heat shock protein HSP 90-beta Proteins 0.000 description 2
- 101000946874 Homo sapiens CD151 antigen Proteins 0.000 description 2
- 101000934368 Homo sapiens CD63 antigen Proteins 0.000 description 2
- 101000997034 Homo sapiens Guanine nucleotide-binding protein G(i) subunit alpha-3 Proteins 0.000 description 2
- 101001037968 Homo sapiens Heat shock 70 kDa protein 1B Proteins 0.000 description 2
- 101001012157 Homo sapiens Receptor tyrosine-protein kinase erbB-2 Proteins 0.000 description 2
- 208000023105 Huntington disease Diseases 0.000 description 2
- 108010054477 Immunoglobulin Fab Fragments Proteins 0.000 description 2
- 102000001706 Immunoglobulin Fab Fragments Human genes 0.000 description 2
- 208000022559 Inflammatory bowel disease Diseases 0.000 description 2
- 241001529936 Murinae Species 0.000 description 2
- 102100038938 Myosin-9 Human genes 0.000 description 2
- 101710204108 Myosin-9 Proteins 0.000 description 2
- 108010081372 NM23 Nucleoside Diphosphate Kinases Proteins 0.000 description 2
- 102000048850 Neoplasm Genes Human genes 0.000 description 2
- 108700019961 Neoplasm Genes Proteins 0.000 description 2
- 102100023258 Nucleoside diphosphate kinase B Human genes 0.000 description 2
- 208000018737 Parkinson disease Diseases 0.000 description 2
- 102100035362 Phosphomannomutase 2 Human genes 0.000 description 2
- 239000004365 Protease Substances 0.000 description 2
- 102000003901 Ras GTPase-activating proteins Human genes 0.000 description 2
- 108090000231 Ras GTPase-activating proteins Proteins 0.000 description 2
- 102100025138 Ras-related protein Rab-5C Human genes 0.000 description 2
- 102100030019 Ras-related protein Rab-7a Human genes 0.000 description 2
- 102100033480 Ras-related protein Rab-8A Human genes 0.000 description 2
- 101710113718 Ras-related protein Rab7A Proteins 0.000 description 2
- 102100030086 Receptor tyrosine-protein kinase erbB-2 Human genes 0.000 description 2
- 206010038389 Renal cancer Diseases 0.000 description 2
- 208000006265 Renal cell carcinoma Diseases 0.000 description 2
- 108020000772 Ribose-Phosphate Pyrophosphokinase Proteins 0.000 description 2
- 102000000439 Ribose-phosphate pyrophosphokinase Human genes 0.000 description 2
- 238000012896 Statistical algorithm Methods 0.000 description 2
- 208000032859 Synucleinopathies Diseases 0.000 description 2
- 208000000389 T-cell leukemia Diseases 0.000 description 2
- 208000028530 T-cell lymphoblastic leukemia/lymphoma Diseases 0.000 description 2
- 206010042971 T-cell lymphoma Diseases 0.000 description 2
- 208000027585 T-cell non-Hodgkin lymphoma Diseases 0.000 description 2
- 102100036977 Talin-1 Human genes 0.000 description 2
- 101710142287 Talin-1 Proteins 0.000 description 2
- 108010077690 Tetraspanin 28 Proteins 0.000 description 2
- 102100026144 Transferrin receptor protein 1 Human genes 0.000 description 2
- 102100031016 Transgelin-2 Human genes 0.000 description 2
- 108050006805 Transgelin-2 Proteins 0.000 description 2
- 108010017749 Vesicle-Associated Membrane Protein 3 Proteins 0.000 description 2
- 102000004604 Vesicle-Associated Membrane Protein 3 Human genes 0.000 description 2
- 102100028753 Vesicle-trafficking protein SEC22b Human genes 0.000 description 2
- 101710194274 Vesicle-trafficking protein SEC22b Proteins 0.000 description 2
- 210000001789 adipocyte Anatomy 0.000 description 2
- 210000004100 adrenal gland Anatomy 0.000 description 2
- 239000012670 alkaline solution Substances 0.000 description 2
- 229940024606 amino acid Drugs 0.000 description 2
- 235000001014 amino acid Nutrition 0.000 description 2
- 150000001413 amino acids Chemical class 0.000 description 2
- 230000008901 benefit Effects 0.000 description 2
- 230000008236 biological pathway Effects 0.000 description 2
- 239000000090 biomarker Substances 0.000 description 2
- 239000000969 carrier Substances 0.000 description 2
- 230000001413 cellular effect Effects 0.000 description 2
- 210000002939 cerumen Anatomy 0.000 description 2
- 238000004891 communication Methods 0.000 description 2
- 239000003184 complementary RNA Substances 0.000 description 2
- 238000000205 computational method Methods 0.000 description 2
- 238000009295 crossflow filtration Methods 0.000 description 2
- 210000004748 cultured cell Anatomy 0.000 description 2
- 238000011161 development Methods 0.000 description 2
- 230000018109 developmental process Effects 0.000 description 2
- 238000010586 diagram Methods 0.000 description 2
- 230000005750 disease progression Effects 0.000 description 2
- 238000012377 drug delivery Methods 0.000 description 2
- 239000003596 drug target Substances 0.000 description 2
- 210000001671 embryonic stem cell Anatomy 0.000 description 2
- 229940088598 enzyme Drugs 0.000 description 2
- 210000003743 erythrocyte Anatomy 0.000 description 2
- 238000001125 extrusion Methods 0.000 description 2
- 239000000835 fiber Substances 0.000 description 2
- 210000001035 gastrointestinal tract Anatomy 0.000 description 2
- 230000004547 gene signature Effects 0.000 description 2
- 210000005260 human cell Anatomy 0.000 description 2
- 230000028993 immune response Effects 0.000 description 2
- 238000001114 immunoprecipitation Methods 0.000 description 2
- 238000001727 in vivo Methods 0.000 description 2
- 210000004263 induced pluripotent stem cell Anatomy 0.000 description 2
- 230000035992 intercellular communication Effects 0.000 description 2
- 210000001153 interneuron Anatomy 0.000 description 2
- 230000000366 juvenile effect Effects 0.000 description 2
- 208000032839 leukemia Diseases 0.000 description 2
- 210000005265 lung cell Anatomy 0.000 description 2
- 210000004880 lymph fluid Anatomy 0.000 description 2
- 238000002826 magnetic-activated cell sorting Methods 0.000 description 2
- 238000004519 manufacturing process Methods 0.000 description 2
- 239000002609 medium Substances 0.000 description 2
- 201000001441 melanoma Diseases 0.000 description 2
- 210000005060 membrane bound organelle Anatomy 0.000 description 2
- 239000002207 metabolite Substances 0.000 description 2
- 229910052751 metal Inorganic materials 0.000 description 2
- 239000002184 metal Substances 0.000 description 2
- 238000000386 microscopy Methods 0.000 description 2
- 210000000110 microvilli Anatomy 0.000 description 2
- 230000003278 mimic effect Effects 0.000 description 2
- 201000006417 multiple sclerosis Diseases 0.000 description 2
- 210000002569 neuron Anatomy 0.000 description 2
- 239000002547 new drug Substances 0.000 description 2
- 230000003287 optical effect Effects 0.000 description 2
- 210000003463 organelle Anatomy 0.000 description 2
- 230000001817 pituitary effect Effects 0.000 description 2
- 238000001556 precipitation Methods 0.000 description 2
- 239000000047 product Substances 0.000 description 2
- 230000002829 reductive effect Effects 0.000 description 2
- 238000003757 reverse transcription PCR Methods 0.000 description 2
- 206010039073 rheumatoid arthritis Diseases 0.000 description 2
- 238000002603 single-photon emission computed tomography Methods 0.000 description 2
- 230000018381 sister chromatid cohesion Effects 0.000 description 2
- 239000000243 solution Substances 0.000 description 2
- 238000000527 sonication Methods 0.000 description 2
- 230000003595 spectral effect Effects 0.000 description 2
- 230000008093 supporting effect Effects 0.000 description 2
- 201000000596 systemic lupus erythematosus Diseases 0.000 description 2
- 238000005199 ultracentrifugation Methods 0.000 description 2
- 230000002485 urinary effect Effects 0.000 description 2
- DQJCDTNMLBYVAY-ZXXIYAEKSA-N (2S,5R,10R,13R)-16-{[(2R,3S,4R,5R)-3-{[(2S,3R,4R,5S,6R)-3-acetamido-4,5-dihydroxy-6-(hydroxymethyl)oxan-2-yl]oxy}-5-(ethylamino)-6-hydroxy-2-(hydroxymethyl)oxan-4-yl]oxy}-5-(4-aminobutyl)-10-carbamoyl-2,13-dimethyl-4,7,12,15-tetraoxo-3,6,11,14-tetraazaheptadecan-1-oic acid Chemical compound NCCCC[C@H](C(=O)N[C@@H](C)C(O)=O)NC(=O)CC[C@H](C(N)=O)NC(=O)[C@@H](C)NC(=O)C(C)O[C@@H]1[C@@H](NCC)C(O)O[C@H](CO)[C@H]1O[C@H]1[C@H](NC(C)=O)[C@@H](O)[C@H](O)[C@@H](CO)O1 DQJCDTNMLBYVAY-ZXXIYAEKSA-N 0.000 description 1
- 102100040605 1,2-dihydroxy-3-keto-5-methylthiopentene dioxygenase Human genes 0.000 description 1
- 101710181757 1,2-dihydroxy-3-keto-5-methylthiopentene dioxygenase Proteins 0.000 description 1
- TZCPCKNHXULUIY-RGULYWFUSA-N 1,2-distearoyl-sn-glycero-3-phosphoserine Chemical compound CCCCCCCCCCCCCCCCCC(=O)OC[C@H](COP(O)(=O)OC[C@H](N)C(O)=O)OC(=O)CCCCCCCCCCCCCCCCC TZCPCKNHXULUIY-RGULYWFUSA-N 0.000 description 1
- 102100030389 1-phosphatidylinositol 4,5-bisphosphate phosphodiesterase beta-2 Human genes 0.000 description 1
- 108050004621 1-phosphatidylinositol 4,5-bisphosphate phosphodiesterase beta-2 Proteins 0.000 description 1
- 102100039583 116 kDa U5 small nuclear ribonucleoprotein component Human genes 0.000 description 1
- 101710151090 116 kDa U5 small nuclear ribonucleoprotein component Proteins 0.000 description 1
- 101710161661 14-3-3 protein beta/alpha Proteins 0.000 description 1
- 102100021408 14-3-3 protein beta/alpha Human genes 0.000 description 1
- 101710191812 14-3-3 protein gamma Proteins 0.000 description 1
- 102100027832 14-3-3 protein gamma Human genes 0.000 description 1
- 102100027831 14-3-3 protein theta Human genes 0.000 description 1
- 101710108995 14-3-3 protein theta Proteins 0.000 description 1
- 108050001315 26S Proteasome non-ATPase regulatory subunit 1 Proteins 0.000 description 1
- 102000011114 26S Proteasome non-ATPase regulatory subunit 1 Human genes 0.000 description 1
- 102100040964 26S proteasome non-ATPase regulatory subunit 11 Human genes 0.000 description 1
- 101710113894 26S proteasome non-ATPase regulatory subunit 11 Proteins 0.000 description 1
- 108010027312 26S proteasome non-ATPase regulatory subunit 13 Proteins 0.000 description 1
- 102100040962 26S proteasome non-ATPase regulatory subunit 13 Human genes 0.000 description 1
- 102100033453 26S proteasome non-ATPase regulatory subunit 5 Human genes 0.000 description 1
- 101710091323 26S proteasome non-ATPase regulatory subunit 5 Proteins 0.000 description 1
- 102100036657 26S proteasome non-ATPase regulatory subunit 7 Human genes 0.000 description 1
- 101710091322 26S proteasome non-ATPase regulatory subunit 7 Proteins 0.000 description 1
- 102100036652 26S proteasome non-ATPase regulatory subunit 8 Human genes 0.000 description 1
- 101710091330 26S proteasome non-ATPase regulatory subunit 8 Proteins 0.000 description 1
- 102100029890 28S ribosomal protein S27, mitochondrial Human genes 0.000 description 1
- 108050008271 28S ribosomal protein S27, mitochondrial Proteins 0.000 description 1
- HVCOBJNICQPDBP-UHFFFAOYSA-N 3-[3-[3,5-dihydroxy-6-methyl-4-(3,4,5-trihydroxy-6-methyloxan-2-yl)oxyoxan-2-yl]oxydecanoyloxy]decanoic acid;hydrate Chemical compound O.OC1C(OC(CC(=O)OC(CCCCCCC)CC(O)=O)CCCCCCC)OC(C)C(O)C1OC1C(O)C(O)C(O)C(C)O1 HVCOBJNICQPDBP-UHFFFAOYSA-N 0.000 description 1
- 102100039358 3-hydroxyacyl-CoA dehydrogenase type-2 Human genes 0.000 description 1
- 101710111025 3-hydroxyacyl-CoA dehydrogenase type-2 Proteins 0.000 description 1
- 102100026163 39S ribosomal protein L12, mitochondrial Human genes 0.000 description 1
- 101710102758 39S ribosomal protein L12, mitochondrial Proteins 0.000 description 1
- 102100027278 4-trimethylaminobutyraldehyde dehydrogenase Human genes 0.000 description 1
- 101710096585 4-trimethylaminobutyraldehyde dehydrogenase Proteins 0.000 description 1
- 102100026357 40S ribosomal protein S13 Human genes 0.000 description 1
- 101710131790 40S ribosomal protein S13 Proteins 0.000 description 1
- 102100033051 40S ribosomal protein S19 Human genes 0.000 description 1
- 101710131772 40S ribosomal protein S19 Proteins 0.000 description 1
- 102100037563 40S ribosomal protein S2 Human genes 0.000 description 1
- 101710107640 40S ribosomal protein S2 Proteins 0.000 description 1
- 102100023415 40S ribosomal protein S20 Human genes 0.000 description 1
- 102100037513 40S ribosomal protein S23 Human genes 0.000 description 1
- 101710131793 40S ribosomal protein S23 Proteins 0.000 description 1
- 102100032500 40S ribosomal protein S27-like Human genes 0.000 description 1
- 101710170466 40S ribosomal protein S27-like Proteins 0.000 description 1
- 102100033409 40S ribosomal protein S3 Human genes 0.000 description 1
- 101710107637 40S ribosomal protein S3 Proteins 0.000 description 1
- 102100034088 40S ribosomal protein S4, X isoform Human genes 0.000 description 1
- 101710198924 40S ribosomal protein S4, X isoform Proteins 0.000 description 1
- 102100033714 40S ribosomal protein S6 Human genes 0.000 description 1
- 101710107638 40S ribosomal protein S6 Proteins 0.000 description 1
- 102100022530 45 kDa calcium-binding protein Human genes 0.000 description 1
- 101710168918 45 kDa calcium-binding protein Proteins 0.000 description 1
- 102100033400 4F2 cell-surface antigen heavy chain Human genes 0.000 description 1
- 102100034406 5'-deoxynucleotidase HDDC2 Human genes 0.000 description 1
- 101710178399 5'-deoxynucleotidase HDDC2 Proteins 0.000 description 1
- 102100038222 60 kDa heat shock protein, mitochondrial Human genes 0.000 description 1
- 101710154868 60 kDa heat shock protein, mitochondrial Proteins 0.000 description 1
- 102100040881 60S acidic ribosomal protein P0 Human genes 0.000 description 1
- 108050002744 60S acidic ribosomal protein P0 Proteins 0.000 description 1
- 102100038954 60S ribosomal export protein NMD3 Human genes 0.000 description 1
- 101710167645 60S ribosomal export protein NMD3 Proteins 0.000 description 1
- 102100021546 60S ribosomal protein L10 Human genes 0.000 description 1
- 101710187296 60S ribosomal protein L10 Proteins 0.000 description 1
- 102100035916 60S ribosomal protein L11 Human genes 0.000 description 1
- 101710187292 60S ribosomal protein L11 Proteins 0.000 description 1
- 102100022289 60S ribosomal protein L13a Human genes 0.000 description 1
- 101710152719 60S ribosomal protein L13a Proteins 0.000 description 1
- 102100031854 60S ribosomal protein L14 Human genes 0.000 description 1
- 101710187794 60S ribosomal protein L14 Proteins 0.000 description 1
- 102100024406 60S ribosomal protein L15 Human genes 0.000 description 1
- 101710187795 60S ribosomal protein L15 Proteins 0.000 description 1
- 101710187806 60S ribosomal protein L17 Proteins 0.000 description 1
- 102100021206 60S ribosomal protein L19 Human genes 0.000 description 1
- 101710187808 60S ribosomal protein L19 Proteins 0.000 description 1
- 102100037965 60S ribosomal protein L21 Human genes 0.000 description 1
- 101710187789 60S ribosomal protein L21 Proteins 0.000 description 1
- 101710187798 60S ribosomal protein L23 Proteins 0.000 description 1
- 102100021660 60S ribosomal protein L28 Human genes 0.000 description 1
- 101710187898 60S ribosomal protein L28 Proteins 0.000 description 1
- 102100040540 60S ribosomal protein L3 Human genes 0.000 description 1
- 101710117444 60S ribosomal protein L3 Proteins 0.000 description 1
- 102100036116 60S ribosomal protein L35 Human genes 0.000 description 1
- 108700037626 60S ribosomal protein L35 Proteins 0.000 description 1
- 102100026926 60S ribosomal protein L4 Human genes 0.000 description 1
- 101710117426 60S ribosomal protein L4 Proteins 0.000 description 1
- 102100026750 60S ribosomal protein L5 Human genes 0.000 description 1
- 101710117446 60S ribosomal protein L5 Proteins 0.000 description 1
- 102100040924 60S ribosomal protein L6 Human genes 0.000 description 1
- 101710117434 60S ribosomal protein L6 Proteins 0.000 description 1
- 102100035841 60S ribosomal protein L7 Human genes 0.000 description 1
- 101710117443 60S ribosomal protein L7 Proteins 0.000 description 1
- 102100036630 60S ribosomal protein L7a Human genes 0.000 description 1
- 101710187823 60S ribosomal protein L7a Proteins 0.000 description 1
- 102100035931 60S ribosomal protein L8 Human genes 0.000 description 1
- 101710117436 60S ribosomal protein L8 Proteins 0.000 description 1
- 102100024049 A-kinase anchor protein 13 Human genes 0.000 description 1
- 101710170217 A-kinase anchor protein 13 Proteins 0.000 description 1
- 108010016281 ADP-Ribosylation Factor 1 Proteins 0.000 description 1
- 108090000067 ADP-Ribosylation Factor 6 Proteins 0.000 description 1
- 102100034341 ADP-ribosylation factor 1 Human genes 0.000 description 1
- 102100023818 ADP-ribosylation factor 3 Human genes 0.000 description 1
- 101710139744 ADP-ribosylation factor 3 Proteins 0.000 description 1
- 102100039900 ADP-ribosylation factor 6 Human genes 0.000 description 1
- 108091010149 ADP-ribosylation factor-like protein 15 Proteins 0.000 description 1
- 102100022910 ADP-ribosylation factor-like protein 15 Human genes 0.000 description 1
- 102100023961 ADP-ribosylation factor-like protein 2-binding protein Human genes 0.000 description 1
- 101710115631 ADP-ribosylation factor-like protein 2-binding protein Proteins 0.000 description 1
- 101150079978 AGRN gene Proteins 0.000 description 1
- 108050008720 AH receptor-interacting proteins Proteins 0.000 description 1
- 102000000282 AH receptor-interacting proteins Human genes 0.000 description 1
- 102100032897 AMP deaminase 2 Human genes 0.000 description 1
- 108050004608 AMP deaminase 2 Proteins 0.000 description 1
- 102100032898 AMP deaminase 3 Human genes 0.000 description 1
- 108050004718 AMP deaminase 3 Proteins 0.000 description 1
- 102100036605 AN1-type zinc finger protein 6 Human genes 0.000 description 1
- 101710184608 AN1-type zinc finger protein 6 Proteins 0.000 description 1
- 102100034482 AP-1 complex subunit beta-1 Human genes 0.000 description 1
- 101710166029 AP-1 complex subunit beta-1 Proteins 0.000 description 1
- 102100034526 AP-1 complex subunit mu-1 Human genes 0.000 description 1
- 101710147742 AP-1 complex subunit mu-1 Proteins 0.000 description 1
- 102100028780 AP-1 complex subunit sigma-2 Human genes 0.000 description 1
- 101710122013 AP-1 complex subunit sigma-2 Proteins 0.000 description 1
- 102100033926 AP-3 complex subunit delta-1 Human genes 0.000 description 1
- 101710139908 AP-3 complex subunit delta-1 Proteins 0.000 description 1
- 102100040005 AP-3 complex subunit mu-1 Human genes 0.000 description 1
- 101710124146 AP-3 complex subunit mu-1 Proteins 0.000 description 1
- 102100023619 ATP synthase F(0) complex subunit B1, mitochondrial Human genes 0.000 description 1
- 101710201407 ATP synthase F(0) complex subunit B1, mitochondrial Proteins 0.000 description 1
- 102100022890 ATP synthase subunit beta, mitochondrial Human genes 0.000 description 1
- 101710134855 ATP synthase subunit beta, mitochondrial Proteins 0.000 description 1
- 102100020969 ATP-binding cassette sub-family E member 1 Human genes 0.000 description 1
- 102100022655 ATP-binding cassette sub-family F member 3 Human genes 0.000 description 1
- 102100032922 ATP-dependent 6-phosphofructokinase, muscle type Human genes 0.000 description 1
- 101710134928 ATP-dependent 6-phosphofructokinase, muscle type Proteins 0.000 description 1
- 102100030088 ATP-dependent RNA helicase A Human genes 0.000 description 1
- 101710164022 ATP-dependent RNA helicase A Proteins 0.000 description 1
- 102100028247 Abl interactor 1 Human genes 0.000 description 1
- 108050004693 Abl interactor 1 Proteins 0.000 description 1
- 102100039382 Abscission/NoCut checkpoint regulator Human genes 0.000 description 1
- 101710105042 Abscission/NoCut checkpoint regulator Proteins 0.000 description 1
- 102100028704 Acetyl-CoA acetyltransferase, cytosolic Human genes 0.000 description 1
- 101710110450 Acetyl-CoA acetyltransferase, cytosolic Proteins 0.000 description 1
- 101710094863 Acireductone dioxygenase Proteins 0.000 description 1
- 101710119043 Actin, cytoplasmic 1 Proteins 0.000 description 1
- 102100022900 Actin, cytoplasmic 1 Human genes 0.000 description 1
- 102100038820 Actin-related protein 2/3 complex subunit 1B Human genes 0.000 description 1
- 108050000119 Actin-related protein 2/3 complex subunit 1B Proteins 0.000 description 1
- 102100021636 Actin-related protein 2/3 complex subunit 2 Human genes 0.000 description 1
- 101710183444 Actin-related protein 2/3 complex subunit 2 Proteins 0.000 description 1
- 102100036464 Activated RNA polymerase II transcriptional coactivator p15 Human genes 0.000 description 1
- 101710111216 Activated RNA polymerase II transcriptional coactivator p15 Proteins 0.000 description 1
- 102100040430 Active breakpoint cluster region-related protein Human genes 0.000 description 1
- 101710090794 Active breakpoint cluster region-related protein Proteins 0.000 description 1
- 208000031261 Acute myeloid leukaemia Diseases 0.000 description 1
- 102100040280 Acyl-protein thioesterase 1 Human genes 0.000 description 1
- 101710132086 Acyl-protein thioesterase 1 Proteins 0.000 description 1
- 102100032488 Acylamino-acid-releasing enzyme Human genes 0.000 description 1
- 108010061216 Acylaminoacyl-peptidase Proteins 0.000 description 1
- 108020002202 Adenosylhomocysteinase Proteins 0.000 description 1
- 102000005234 Adenosylhomocysteinase Human genes 0.000 description 1
- 102100020786 Adenylosuccinate synthetase isozyme 2 Human genes 0.000 description 1
- 101710118741 Adenylosuccinate synthetase isozyme 2 Proteins 0.000 description 1
- 102100027241 Adenylyl cyclase-associated protein 1 Human genes 0.000 description 1
- 101710137115 Adenylyl cyclase-associated protein 1 Proteins 0.000 description 1
- 102100040026 Agrin Human genes 0.000 description 1
- 108700019743 Agrin Proteins 0.000 description 1
- 102100027211 Albumin Human genes 0.000 description 1
- 108010088751 Albumins Proteins 0.000 description 1
- 102100039702 Alcohol dehydrogenase class-3 Human genes 0.000 description 1
- 101710133776 Alcohol dehydrogenase class-3 Proteins 0.000 description 1
- 102100032959 Alpha-actinin-4 Human genes 0.000 description 1
- 101710115256 Alpha-actinin-4 Proteins 0.000 description 1
- 102100038910 Alpha-enolase Human genes 0.000 description 1
- 102100038046 Alpha/beta hydrolase domain-containing protein 17A Human genes 0.000 description 1
- 101710173908 Alpha/beta hydrolase domain-containing protein 17A Proteins 0.000 description 1
- 102100022417 Aminoacyl tRNA synthase complex-interacting multifunctional protein 2 Human genes 0.000 description 1
- 101710102450 Aminoacyl tRNA synthase complex-interacting multifunctional protein 2 Proteins 0.000 description 1
- 102100034566 Ankyrin repeat domain-containing protein 36B Human genes 0.000 description 1
- 101710112014 Ankyrin repeat domain-containing protein 36B Proteins 0.000 description 1
- 102000000412 Annexin Human genes 0.000 description 1
- 108050008874 Annexin Proteins 0.000 description 1
- 108090000668 Annexin A2 Proteins 0.000 description 1
- 102100034613 Annexin A2 Human genes 0.000 description 1
- 108090000672 Annexin A5 Proteins 0.000 description 1
- 102000004121 Annexin A5 Human genes 0.000 description 1
- 102100040202 Apolipoprotein B-100 Human genes 0.000 description 1
- 108010008150 Apolipoprotein B-100 Proteins 0.000 description 1
- 108010056301 Apolipoprotein C-III Proteins 0.000 description 1
- 102000030169 Apolipoprotein C-III Human genes 0.000 description 1
- 101000584926 Arabidopsis thaliana Ras-related protein RABA1d Proteins 0.000 description 1
- 101000584912 Arabidopsis thaliana Ras-related protein RABB1c Proteins 0.000 description 1
- 101001061795 Arabidopsis thaliana Ras-related protein RABD2b Proteins 0.000 description 1
- 101001132529 Arabidopsis thaliana Ras-related protein RABE1c Proteins 0.000 description 1
- 101001099930 Arabidopsis thaliana Ras-related protein RABH1b Proteins 0.000 description 1
- 102100033652 Arf-GAP with Rho-GAP domain, ANK repeat and PH domain-containing protein 1 Human genes 0.000 description 1
- 101710144512 Arf-GAP with Rho-GAP domain, ANK repeat and PH domain-containing protein 1 Proteins 0.000 description 1
- 102100039995 Arginyl-tRNA-protein transferase 1 Human genes 0.000 description 1
- 101710201319 Arginyl-tRNA-protein transferase 1 Proteins 0.000 description 1
- 108090000121 Aromatic-L-amino-acid decarboxylases Proteins 0.000 description 1
- 102000003823 Aromatic-L-amino-acid decarboxylases Human genes 0.000 description 1
- 239000000592 Artificial Cell Substances 0.000 description 1
- 102100023245 Asparagine-tRNA ligase, cytoplasmic Human genes 0.000 description 1
- 101710160288 Asparagine-tRNA ligase, cytoplasmic Proteins 0.000 description 1
- 101710148554 Astrocytic phosphoprotein PEA-15 Proteins 0.000 description 1
- 102100034691 Astrocytic phosphoprotein PEA-15 Human genes 0.000 description 1
- 102100032306 Aurora kinase B Human genes 0.000 description 1
- 108090000749 Aurora kinase B Proteins 0.000 description 1
- 102100024222 B-lymphocyte antigen CD19 Human genes 0.000 description 1
- 102100022005 B-lymphocyte antigen CD20 Human genes 0.000 description 1
- 108700000712 BH3 Interacting Domain Death Agonist Proteins 0.000 description 1
- 102100035740 BH3-interacting domain death agonist Human genes 0.000 description 1
- 241000894006 Bacteria Species 0.000 description 1
- 102100024747 Band 4.1-like protein 1 Human genes 0.000 description 1
- 101710136623 Band 4.1-like protein 1 Proteins 0.000 description 1
- 108010064528 Basigin Proteins 0.000 description 1
- 102100032412 Basigin Human genes 0.000 description 1
- 108090000524 Beclin-1 Proteins 0.000 description 1
- 102100021251 Beclin-1 Human genes 0.000 description 1
- 102100021738 Beta-adrenergic receptor kinase 1 Human genes 0.000 description 1
- 102100034321 Beta-centractin Human genes 0.000 description 1
- 102100027058 Bleomycin hydrolase Human genes 0.000 description 1
- 108010025544 Bleomycin hydrolase Proteins 0.000 description 1
- 208000019838 Blood disease Diseases 0.000 description 1
- 108700038774 BolA-like protein 2 Proteins 0.000 description 1
- 102000044252 BolA-like protein 2 Human genes 0.000 description 1
- 108010051118 Bone Marrow Stromal Antigen 2 Proteins 0.000 description 1
- 102100035337 Bone marrow proteoglycan Human genes 0.000 description 1
- 101710134771 Bone marrow proteoglycan Proteins 0.000 description 1
- 102100037086 Bone marrow stromal antigen 2 Human genes 0.000 description 1
- 108030001720 Bontoxilysin Proteins 0.000 description 1
- 102100024486 Borealin Human genes 0.000 description 1
- 101710168078 Borealin Proteins 0.000 description 1
- 102100026346 Brain-specific angiogenesis inhibitor 1-associated protein 2 Human genes 0.000 description 1
- 101710094962 Brain-specific angiogenesis inhibitor 1-associated protein 2 Proteins 0.000 description 1
- 102100025994 Brefeldin A-inhibited guanine nucleotide-exchange protein 1 Human genes 0.000 description 1
- 101710100912 Brefeldin A-inhibited guanine nucleotide-exchange protein 1 Proteins 0.000 description 1
- 230000005653 Brownian motion process Effects 0.000 description 1
- 102100025905 C-Jun-amino-terminal kinase-interacting protein 4 Human genes 0.000 description 1
- 101710105201 C-Jun-amino-terminal kinase-interacting protein 4 Proteins 0.000 description 1
- 102100031184 C-Maf-inducing protein Human genes 0.000 description 1
- 101710137974 C-Maf-inducing protein Proteins 0.000 description 1
- 102100032528 C-type lectin domain family 11 member A Human genes 0.000 description 1
- 101710167766 C-type lectin domain family 11 member A Proteins 0.000 description 1
- 102100028737 CAP-Gly domain-containing linker protein 1 Human genes 0.000 description 1
- 101710198971 CAP-Gly domain-containing linker protein 1 Proteins 0.000 description 1
- 102100031024 CCR4-NOT transcription complex subunit 1 Human genes 0.000 description 1
- 101710152507 CCR4-NOT transcription complex subunit 1 Proteins 0.000 description 1
- 102100032912 CD44 antigen Human genes 0.000 description 1
- 102100022002 CD59 glycoprotein Human genes 0.000 description 1
- 101710176679 CD59 glycoprotein Proteins 0.000 description 1
- 101710038256 CEP112 Proteins 0.000 description 1
- 102100029395 CLIP-associating protein 2 Human genes 0.000 description 1
- 101710114888 CLIP-associating protein 2 Proteins 0.000 description 1
- 102100031625 CTTNBP2 N-terminal-like protein Human genes 0.000 description 1
- 101710094990 CTTNBP2 N-terminal-like protein Proteins 0.000 description 1
- 101710107880 CYFIP-related Rac1 interactor B Proteins 0.000 description 1
- 101100400999 Caenorhabditis elegans mel-28 gene Proteins 0.000 description 1
- 108010028326 Calbindin 2 Proteins 0.000 description 1
- 102100031077 Calcineurin B homologous protein 3 Human genes 0.000 description 1
- 101710147325 Calcineurin B homologous protein 3 Proteins 0.000 description 1
- 102100036362 Calcium-binding and coiled-coil domain-containing protein 1 Human genes 0.000 description 1
- 101710202009 Calcium-binding and coiled-coil domain-containing protein 1 Proteins 0.000 description 1
- 102100033086 Calcium/calmodulin-dependent protein kinase type 1 Human genes 0.000 description 1
- 101710144002 Calcium/calmodulin-dependent protein kinase type 1 Proteins 0.000 description 1
- 102000000584 Calmodulin Human genes 0.000 description 1
- 108010041952 Calmodulin Proteins 0.000 description 1
- 102100029398 Calpain small subunit 1 Human genes 0.000 description 1
- 101710131373 Calpain small subunit 1 Proteins 0.000 description 1
- 102100029968 Calreticulin Human genes 0.000 description 1
- 108090000549 Calreticulin Proteins 0.000 description 1
- 102100021849 Calretinin Human genes 0.000 description 1
- 102100029226 Cancer-related nucleoside-triphosphatase Human genes 0.000 description 1
- 101710167027 Cancer-related nucleoside-triphosphatase Proteins 0.000 description 1
- 102100027668 Carboxy-terminal domain RNA polymerase II polypeptide A small phosphatase 1 Human genes 0.000 description 1
- 101710134395 Carboxy-terminal domain RNA polymerase II polypeptide A small phosphatase 1 Proteins 0.000 description 1
- 102100027667 Carboxy-terminal domain RNA polymerase II polypeptide A small phosphatase 2 Human genes 0.000 description 1
- 101710134389 Carboxy-terminal domain RNA polymerase II polypeptide A small phosphatase 2 Proteins 0.000 description 1
- 102100025475 Carcinoembryonic antigen-related cell adhesion molecule 5 Human genes 0.000 description 1
- 102100025473 Carcinoembryonic antigen-related cell adhesion molecule 6 Human genes 0.000 description 1
- 102000014914 Carrier Proteins Human genes 0.000 description 1
- 102100027992 Casein kinase II subunit beta Human genes 0.000 description 1
- 101710158100 Casein kinase II subunit beta Proteins 0.000 description 1
- 102100031164 Caskin-2 Human genes 0.000 description 1
- 101710008687 Caskin-2 Proteins 0.000 description 1
- 102100026089 Caspase recruitment domain-containing protein 9 Human genes 0.000 description 1
- 101710142436 Caspase recruitment domain-containing protein 9 Proteins 0.000 description 1
- 108090001132 Caspase-14 Proteins 0.000 description 1
- 102000004958 Caspase-14 Human genes 0.000 description 1
- 102100035882 Catalase Human genes 0.000 description 1
- 108010053835 Catalase Proteins 0.000 description 1
- 102000011937 Cathepsin Z Human genes 0.000 description 1
- 108010061117 Cathepsin Z Proteins 0.000 description 1
- 102100028633 Cdc42-interacting protein 4 Human genes 0.000 description 1
- 101710116956 Cdc42-interacting protein 4 Proteins 0.000 description 1
- 102100025051 Cell division control protein 42 homolog Human genes 0.000 description 1
- 102100024479 Cell division cycle-associated protein 3 Human genes 0.000 description 1
- 101710108818 Cell division cycle-associated protein 3 Proteins 0.000 description 1
- 101710199713 Centromere/kinetochore protein zw10 homolog Proteins 0.000 description 1
- 102100039118 Centromere/kinetochore protein zw10 homolog Human genes 0.000 description 1
- 102100033129 Centrosomal protein of 112 kDa Human genes 0.000 description 1
- 102100035197 Cerebral cavernous malformations 2 protein Human genes 0.000 description 1
- 101710164677 Cerebral cavernous malformations protein 2 homolog Proteins 0.000 description 1
- 206010050337 Cerumen impaction Diseases 0.000 description 1
- 108050001549 Chloride intracellular channel protein 1 Proteins 0.000 description 1
- 102100034667 Chloride intracellular channel protein 1 Human genes 0.000 description 1
- 102100023506 Chloride intracellular channel protein 6 Human genes 0.000 description 1
- 101710185645 Chloride intracellular channel protein 6 Proteins 0.000 description 1
- 102100032902 Chromobox protein homolog 3 Human genes 0.000 description 1
- 101710173111 Chromobox protein homolog 3 Proteins 0.000 description 1
- 102100020736 Chromosome-associated kinesin KIF4A Human genes 0.000 description 1
- 101710116336 Chromosome-associated kinesin KIF4A Proteins 0.000 description 1
- 102100026127 Clathrin heavy chain 1 Human genes 0.000 description 1
- 101710123900 Clathrin heavy chain 1 Proteins 0.000 description 1
- 102100036444 Clathrin interactor 1 Human genes 0.000 description 1
- 101710148711 Clathrin interactor 1 Proteins 0.000 description 1
- 102100034467 Clathrin light chain A Human genes 0.000 description 1
- 101710093541 Clathrin light chain A Proteins 0.000 description 1
- 102100022256 Clustered mitochondria protein homolog Human genes 0.000 description 1
- 101710183231 Clustered mitochondria protein homolog Proteins 0.000 description 1
- 102100032887 Clusterin Human genes 0.000 description 1
- 108090000197 Clusterin Proteins 0.000 description 1
- 102100029057 Coagulation factor XIII A chain Human genes 0.000 description 1
- 108050006954 Coagulation factor XIII A chains Proteins 0.000 description 1
- 102100030972 Coatomer subunit beta Human genes 0.000 description 1
- 101710186199 Coatomer subunit beta Proteins 0.000 description 1
- 102100028289 Coatomer subunit delta Human genes 0.000 description 1
- 101710202359 Coatomer subunit delta Proteins 0.000 description 1
- 102100037288 Coatomer subunit epsilon Human genes 0.000 description 1
- 101710135138 Coatomer subunit epsilon Proteins 0.000 description 1
- 102100037290 Coatomer subunit gamma-1 Human genes 0.000 description 1
- 101710155798 Coatomer subunit gamma-1 Proteins 0.000 description 1
- 102100024252 Coatomer subunit zeta-1 Human genes 0.000 description 1
- 101710083660 Coatomer subunit zeta-1 Proteins 0.000 description 1
- 102100031048 Coiled-coil domain-containing protein 6 Human genes 0.000 description 1
- 101710158902 Coiled-coil domain-containing protein 6 Proteins 0.000 description 1
- 102100034951 Coiled-coil domain-containing protein 69 Human genes 0.000 description 1
- 101710148969 Coiled-coil domain-containing protein 69 Proteins 0.000 description 1
- 102100023692 Coiled-coil-helix-coiled-coil-helix domain-containing protein 2 Human genes 0.000 description 1
- 101710194160 Coiled-coil-helix-coiled-coil-helix domain-containing protein 2 Proteins 0.000 description 1
- 102000014447 Complement C1q Human genes 0.000 description 1
- 108010078043 Complement C1q Proteins 0.000 description 1
- 102100024339 Complement component C6 Human genes 0.000 description 1
- 101710203188 Complement component C6 Proteins 0.000 description 1
- 102100025680 Complement decay-accelerating factor Human genes 0.000 description 1
- 102100032768 Complement receptor type 2 Human genes 0.000 description 1
- 102100032951 Condensin complex subunit 2 Human genes 0.000 description 1
- 101710126409 Condensin complex subunit 2 Proteins 0.000 description 1
- 102100029384 Copine-8 Human genes 0.000 description 1
- 101710125091 Copine-8 Proteins 0.000 description 1
- 102100034528 Core histone macro-H2A.1 Human genes 0.000 description 1
- 101710184999 Core histone macro-H2A.1 Proteins 0.000 description 1
- 102100037313 Core-binding factor subunit beta Human genes 0.000 description 1
- 101710145030 Core-binding factor subunit beta Proteins 0.000 description 1
- 108050003114 Coronin 1A Proteins 0.000 description 1
- 102100028233 Coronin-1A Human genes 0.000 description 1
- 208000020406 Creutzfeldt Jacob disease Diseases 0.000 description 1
- 208000003407 Creutzfeldt-Jakob Syndrome Diseases 0.000 description 1
- 208000010859 Creutzfeldt-Jakob disease Diseases 0.000 description 1
- 101000705592 Cucumis melo Phytoene synthase, chloroplastic Proteins 0.000 description 1
- 102100028907 Cullin-4A Human genes 0.000 description 1
- 101710159242 Cullin-4A Proteins 0.000 description 1
- 102000049244 Cullin-4B Human genes 0.000 description 1
- 102100025525 Cullin-5 Human genes 0.000 description 1
- 101710094483 Cullin-5 Proteins 0.000 description 1
- 108050006400 Cyclin Proteins 0.000 description 1
- 108010024986 Cyclin-Dependent Kinase 2 Proteins 0.000 description 1
- 102100036239 Cyclin-dependent kinase 2 Human genes 0.000 description 1
- 108010061635 Cystatin B Proteins 0.000 description 1
- 102100026891 Cystatin-B Human genes 0.000 description 1
- 102100031621 Cysteine and glycine-rich protein 2 Human genes 0.000 description 1
- 101710185482 Cysteine and glycine-rich protein 2 Proteins 0.000 description 1
- 101710202823 Cysteine-rich protein 2 Proteins 0.000 description 1
- 102100031635 Cytoplasmic dynein 1 heavy chain 1 Human genes 0.000 description 1
- 101710204897 Cytoplasmic dynein 1 heavy chain 1 Proteins 0.000 description 1
- 102100028624 Cytoskeleton-associated protein 5 Human genes 0.000 description 1
- 101710087041 Cytoskeleton-associated protein 5 Proteins 0.000 description 1
- 102100035149 Cytosolic endo-beta-N-acetylglucosaminidase Human genes 0.000 description 1
- 101710089807 Cytosolic endo-beta-N-acetylglucosaminidase Proteins 0.000 description 1
- 102100037579 D-3-phosphoglycerate dehydrogenase Human genes 0.000 description 1
- 102100026981 DCN1-like protein 3 Human genes 0.000 description 1
- 101710091198 DCN1-like protein 3 Proteins 0.000 description 1
- 102100035185 DNA excision repair protein ERCC-6-like Human genes 0.000 description 1
- 101710160999 DNA excision repair protein ERCC-6-like Proteins 0.000 description 1
- 102100029995 DNA ligase 1 Human genes 0.000 description 1
- 101710148291 DNA ligase 1 Proteins 0.000 description 1
- 230000007067 DNA methylation Effects 0.000 description 1
- 230000009946 DNA mutation Effects 0.000 description 1
- 102100039116 DNA repair protein RAD50 Human genes 0.000 description 1
- 101710118395 DNA repair protein RAD50 Proteins 0.000 description 1
- 101710153001 DNA replication complex GINS protein PSF1 Proteins 0.000 description 1
- 102100027564 DNA replication complex GINS protein PSF1 Human genes 0.000 description 1
- 102100030960 DNA replication licensing factor MCM2 Human genes 0.000 description 1
- 102000014427 DNA replication licensing factor Mcm6 Human genes 0.000 description 1
- 238000001712 DNA sequencing Methods 0.000 description 1
- 102100033587 DNA topoisomerase 2-alpha Human genes 0.000 description 1
- 101710204372 DNA topoisomerase 2-alpha Proteins 0.000 description 1
- 102100022204 DNA-dependent protein kinase catalytic subunit Human genes 0.000 description 1
- 101710157074 DNA-dependent protein kinase catalytic subunit Proteins 0.000 description 1
- 102100023349 DNA-directed RNA polymerases I, II, and III subunit RPABC3 Human genes 0.000 description 1
- 101710153583 DNA-directed RNA polymerases I, II, and III subunit RPABC3 Proteins 0.000 description 1
- 102100031598 Dedicator of cytokinesis protein 1 Human genes 0.000 description 1
- 101710113370 Dedicator of cytokinesis protein 1 Proteins 0.000 description 1
- 102100024354 Dedicator of cytokinesis protein 6 Human genes 0.000 description 1
- 101710113361 Dedicator of cytokinesis protein 6 Proteins 0.000 description 1
- 102100024351 Dedicator of cytokinesis protein 7 Human genes 0.000 description 1
- 101710113362 Dedicator of cytokinesis protein 7 Proteins 0.000 description 1
- 102100037840 Dehydrogenase/reductase SDR family member 2, mitochondrial Human genes 0.000 description 1
- 101710119015 Dehydrogenase/reductase SDR family member 2, mitochondrial Proteins 0.000 description 1
- 102100022872 Deoxyribonuclease-1-like 1 Human genes 0.000 description 1
- 101710094552 Deoxyribonuclease-1-like 1 Proteins 0.000 description 1
- 102100037458 Dephospho-CoA kinase Human genes 0.000 description 1
- 102100023319 Dihydrolipoyl dehydrogenase, mitochondrial Human genes 0.000 description 1
- 101710144432 Dihydrolipoyl dehydrogenase, mitochondrial Proteins 0.000 description 1
- 102100034581 Dihydroorotase Human genes 0.000 description 1
- 108091000126 Dihydroorotase Proteins 0.000 description 1
- 102100036969 Dipeptidyl peptidase 9 Human genes 0.000 description 1
- 102100037922 Disco-interacting protein 2 homolog A Human genes 0.000 description 1
- 101710169374 Disco-interacting protein 2 homolog A Proteins 0.000 description 1
- 102100028555 Disheveled-associated activator of morphogenesis 1 Human genes 0.000 description 1
- 101710093402 Disheveled-associated activator of morphogenesis 1 Proteins 0.000 description 1
- 102100029714 DnaJ homolog subfamily B member 2 Human genes 0.000 description 1
- 101710173655 DnaJ homolog subfamily B member 2 Proteins 0.000 description 1
- 102100029708 DnaJ homolog subfamily B member 3 Human genes 0.000 description 1
- 101710173656 DnaJ homolog subfamily B member 3 Proteins 0.000 description 1
- 102100031695 DnaJ homolog subfamily C member 2 Human genes 0.000 description 1
- 101710138831 DnaJ homolog subfamily C member 2 Proteins 0.000 description 1
- 102100022265 DnaJ homolog subfamily C member 21 Human genes 0.000 description 1
- 101710083537 DnaJ homolog subfamily C member 21 Proteins 0.000 description 1
- 102100028952 Drebrin Human genes 0.000 description 1
- 101710139305 Drebrin Proteins 0.000 description 1
- 101000922140 Drosophila melanogaster Peripheral plasma membrane protein CASK Proteins 0.000 description 1
- 102100023266 Dual specificity mitogen-activated protein kinase kinase 2 Human genes 0.000 description 1
- 101710146529 Dual specificity mitogen-activated protein kinase kinase 2 Proteins 0.000 description 1
- 101710096759 Dual specificity protein phosphatase 23 Proteins 0.000 description 1
- 102100034133 Dual specificity protein phosphatase 23 Human genes 0.000 description 1
- 102100027272 Dual specificity protein phosphatase 8 Human genes 0.000 description 1
- 101710132799 Dual specificity protein phosphatase 8 Proteins 0.000 description 1
- 102100036498 Dual specificity testis-specific protein kinase 2 Human genes 0.000 description 1
- 101710108348 Dual specificity testis-specific protein kinase 2 Proteins 0.000 description 1
- 108010012830 Dynactin Complex Proteins 0.000 description 1
- 102000019205 Dynactin Complex Human genes 0.000 description 1
- 102100031648 Dynein axonemal heavy chain 5 Human genes 0.000 description 1
- 102100031637 Dynein axonemal heavy chain 8 Human genes 0.000 description 1
- 102100038509 E3 ubiquitin-protein ligase ARIH1 Human genes 0.000 description 1
- 101710165507 E3 ubiquitin-protein ligase ARIH1 Proteins 0.000 description 1
- 102100037334 E3 ubiquitin-protein ligase CHIP Human genes 0.000 description 1
- 101710187668 E3 ubiquitin-protein ligase CHIP Proteins 0.000 description 1
- 101710091557 E3 ubiquitin-protein ligase HECTD1 Proteins 0.000 description 1
- 102100034677 E3 ubiquitin-protein ligase HECTD1 Human genes 0.000 description 1
- 102100039503 E3 ubiquitin-protein ligase RNF31 Human genes 0.000 description 1
- 101710109262 E3 ubiquitin-protein ligase RNF31 Proteins 0.000 description 1
- 102100023431 E3 ubiquitin-protein ligase TRIM21 Human genes 0.000 description 1
- 101710164941 E3 ubiquitin-protein ligase TRIM21 Proteins 0.000 description 1
- 102100032449 EGF-like repeat and discoidin I-like domain-containing protein 3 Human genes 0.000 description 1
- 101710166164 EGF-like repeat and discoidin I-like domain-containing protein 3 Proteins 0.000 description 1
- 102100029652 EH domain-binding protein 1 Human genes 0.000 description 1
- 101710165824 EH domain-binding protein 1 Proteins 0.000 description 1
- 108050003563 ENA/VASP-like proteins Proteins 0.000 description 1
- 102100027126 Echinoderm microtubule-associated protein-like 2 Human genes 0.000 description 1
- 101710203445 Echinoderm microtubule-associated protein-like 2 Proteins 0.000 description 1
- 108010016831 Elongation Factor 2 Kinase Proteins 0.000 description 1
- 101710120810 Elongation factor 1-alpha 1 Proteins 0.000 description 1
- 102100031334 Elongation factor 2 Human genes 0.000 description 1
- 102100033238 Elongation factor Tu, mitochondrial Human genes 0.000 description 1
- 101710120274 Elongation factor Tu, mitochondrial Proteins 0.000 description 1
- 102100031417 Elongation factor-like GTPase 1 Human genes 0.000 description 1
- 101710133251 Elongation factor-like GTPase 1 Proteins 0.000 description 1
- 102100034241 Elongator complex protein 2 Human genes 0.000 description 1
- 101710167764 Elongator complex protein 2 Proteins 0.000 description 1
- 102100030209 Elongin-B Human genes 0.000 description 1
- 101710191209 Elongin-B Proteins 0.000 description 1
- 102100037114 Elongin-C Human genes 0.000 description 1
- 108050009447 Elongin-C Proteins 0.000 description 1
- 102100027259 Ena/VASP-like protein Human genes 0.000 description 1
- 108700041152 Endoplasmic Reticulum Chaperone BiP Proteins 0.000 description 1
- 102100021451 Endoplasmic reticulum chaperone BiP Human genes 0.000 description 1
- 102100027117 Engulfment and cell motility protein 2 Human genes 0.000 description 1
- 101710116010 Engulfment and cell motility protein 2 Proteins 0.000 description 1
- 102000017950 Enolase-phosphatase E1 Human genes 0.000 description 1
- 108050007037 Enolase-phosphatase E1 Proteins 0.000 description 1
- 108010092408 Eosinophil Peroxidase Proteins 0.000 description 1
- 102100028471 Eosinophil peroxidase Human genes 0.000 description 1
- 108010066687 Epithelial Cell Adhesion Molecule Proteins 0.000 description 1
- 102000018651 Epithelial Cell Adhesion Molecule Human genes 0.000 description 1
- 102100033175 Ethanolamine kinase 1 Human genes 0.000 description 1
- 101710201312 Ethanolamine kinase 1 Proteins 0.000 description 1
- 102100021808 Eukaryotic elongation factor 2 kinase Human genes 0.000 description 1
- 102100039950 Eukaryotic initiation factor 4A-I Human genes 0.000 description 1
- 101710145855 Eukaryotic initiation factor 4A-I Proteins 0.000 description 1
- 102100022462 Eukaryotic initiation factor 4A-II Human genes 0.000 description 1
- 101710149995 Eukaryotic initiation factor 4A-II Proteins 0.000 description 1
- 102100022461 Eukaryotic initiation factor 4A-III Human genes 0.000 description 1
- 101710129990 Eukaryotic initiation factor 4A-III Proteins 0.000 description 1
- 102100036816 Eukaryotic peptide chain release factor GTP-binding subunit ERF3A Human genes 0.000 description 1
- 101710151739 Eukaryotic peptide chain release factor GTP-binding subunit ERF3A Proteins 0.000 description 1
- 102100027327 Eukaryotic translation initiation factor 2 subunit 2 Human genes 0.000 description 1
- 101710151740 Eukaryotic translation initiation factor 2 subunit 2 Proteins 0.000 description 1
- 101710151744 Eukaryotic translation initiation factor 2 subunit 3 Proteins 0.000 description 1
- 102100040015 Eukaryotic translation initiation factor 2 subunit 3 Human genes 0.000 description 1
- 102100038045 Eukaryotic translation initiation factor 2A Human genes 0.000 description 1
- 101710092068 Eukaryotic translation initiation factor 2A Proteins 0.000 description 1
- 102100034295 Eukaryotic translation initiation factor 3 subunit A Human genes 0.000 description 1
- 101710109043 Eukaryotic translation initiation factor 3 subunit A Proteins 0.000 description 1
- 102100021699 Eukaryotic translation initiation factor 3 subunit B Human genes 0.000 description 1
- 101710109047 Eukaryotic translation initiation factor 3 subunit B Proteins 0.000 description 1
- 102100035045 Eukaryotic translation initiation factor 3 subunit C Human genes 0.000 description 1
- 101710109030 Eukaryotic translation initiation factor 3 subunit C Proteins 0.000 description 1
- 102100029776 Eukaryotic translation initiation factor 3 subunit D Human genes 0.000 description 1
- 101710109042 Eukaryotic translation initiation factor 3 subunit D Proteins 0.000 description 1
- 102100023236 Eukaryotic translation initiation factor 3 subunit G Human genes 0.000 description 1
- 101710109055 Eukaryotic translation initiation factor 3 subunit G Proteins 0.000 description 1
- 102100029782 Eukaryotic translation initiation factor 3 subunit I Human genes 0.000 description 1
- 101710109054 Eukaryotic translation initiation factor 3 subunit I Proteins 0.000 description 1
- 102100034226 Eukaryotic translation initiation factor 3 subunit J Human genes 0.000 description 1
- 101710109057 Eukaryotic translation initiation factor 3 subunit J Proteins 0.000 description 1
- 108700036185 Eukaryotic translation initiation factor 4 gamma 1 Proteins 0.000 description 1
- 102000056062 Eukaryotic translation initiation factor 4 gamma 1 Human genes 0.000 description 1
- 102100039737 Eukaryotic translation initiation factor 4 gamma 2 Human genes 0.000 description 1
- 101710190709 Eukaryotic translation initiation factor 4 gamma 2 Proteins 0.000 description 1
- 102100027304 Eukaryotic translation initiation factor 4E Human genes 0.000 description 1
- 101710091918 Eukaryotic translation initiation factor 4E Proteins 0.000 description 1
- 102100026765 Eukaryotic translation initiation factor 4H Human genes 0.000 description 1
- 101710091914 Eukaryotic translation initiation factor 4H Proteins 0.000 description 1
- 102100026761 Eukaryotic translation initiation factor 5A-1 Human genes 0.000 description 1
- 101710126270 Eukaryotic translation initiation factor 5A-1 Proteins 0.000 description 1
- 102100039952 Eukaryotic translation initiation factor 5A-1-like Human genes 0.000 description 1
- 101710113937 Eukaryotic translation initiation factor 5A-1-like Proteins 0.000 description 1
- 102100030860 Exocyst complex component 3 Human genes 0.000 description 1
- 101710170855 Exocyst complex component 3 Proteins 0.000 description 1
- 102100039559 Exocyst complex component 8 Human genes 0.000 description 1
- 101710170825 Exocyst complex component 8 Proteins 0.000 description 1
- 102100029095 Exportin-1 Human genes 0.000 description 1
- 102100039207 Exportin-T Human genes 0.000 description 1
- 101710146423 Exportin-T Proteins 0.000 description 1
- 102100025971 F-actin-capping protein subunit alpha-2 Human genes 0.000 description 1
- 101710087975 F-actin-capping protein subunit alpha-2 Proteins 0.000 description 1
- 102100026353 F-box-like/WD repeat-containing protein TBL1XR1 Human genes 0.000 description 1
- 101710129739 F-box-like/WD repeat-containing protein TBL1XR1 Proteins 0.000 description 1
- 102100036068 FERM domain-containing protein 8 Human genes 0.000 description 1
- 101710195878 FERM domain-containing protein 8 Proteins 0.000 description 1
- 102100037577 FERM, ARHGEF and pleckstrin domain-containing protein 2 Human genes 0.000 description 1
- 101710120623 FERM, ARHGEF and pleckstrin domain-containing protein 2 Proteins 0.000 description 1
- 102100040130 FH1/FH2 domain-containing protein 1 Human genes 0.000 description 1
- 101710120374 FH1/FH2 domain-containing protein 1 Proteins 0.000 description 1
- 102100040351 FK506-binding protein 15 Human genes 0.000 description 1
- 101710132915 FK506-binding protein 15 Proteins 0.000 description 1
- 102100035261 FYN-binding protein 1 Human genes 0.000 description 1
- 102100038638 FYVE, RhoGEF and PH domain-containing protein 3 Human genes 0.000 description 1
- 101710177183 FYVE, RhoGEF and PH domain-containing protein 3 Proteins 0.000 description 1
- 241000272186 Falco columbarius Species 0.000 description 1
- 102100036123 Far upstream element-binding protein 2 Human genes 0.000 description 1
- 101710133942 Far upstream element-binding protein 2 Proteins 0.000 description 1
- 108010008177 Fd immunoglobulins Proteins 0.000 description 1
- 102100040683 Fermitin family homolog 1 Human genes 0.000 description 1
- 101710108802 Fermitin family homolog 1 Proteins 0.000 description 1
- 102100027944 Flavin reductase (NADPH) Human genes 0.000 description 1
- 101710115821 Flavin reductase (NADPH) Proteins 0.000 description 1
- 101710179254 Fructose-1,6-bisphosphatase 1 Proteins 0.000 description 1
- 102100037181 Fructose-1,6-bisphosphatase 1 Human genes 0.000 description 1
- 102100022633 Fructose-2,6-bisphosphatase Human genes 0.000 description 1
- 101710086299 Fructose-2,6-bisphosphatase Proteins 0.000 description 1
- 241000233866 Fungi Species 0.000 description 1
- 108010056715 G-Protein-Coupled Receptor Kinase 2 Proteins 0.000 description 1
- 102100035237 GA-binding protein alpha chain Human genes 0.000 description 1
- 101710163950 GA-binding protein alpha chain Proteins 0.000 description 1
- 102100034265 GEM-interacting protein Human genes 0.000 description 1
- 101710102635 GEM-interacting protein Proteins 0.000 description 1
- 102100037755 GRB2-associated-binding protein 3 Human genes 0.000 description 1
- 101710098717 GRB2-associated-binding protein 3 Proteins 0.000 description 1
- 102000013446 GTP Phosphohydrolases Human genes 0.000 description 1
- 102100022887 GTP-binding nuclear protein Ran Human genes 0.000 description 1
- 101710084647 GTP-binding nuclear protein Ran Proteins 0.000 description 1
- 102100039788 GTPase NRas Human genes 0.000 description 1
- 101710204378 GTPase NRas Proteins 0.000 description 1
- 102000018898 GTPase-Activating Proteins Human genes 0.000 description 1
- 108091006094 GTPase-accelerating proteins Proteins 0.000 description 1
- 108091006109 GTPases Proteins 0.000 description 1
- 108010001498 Galectin 1 Proteins 0.000 description 1
- 102100021736 Galectin-1 Human genes 0.000 description 1
- 102100025614 Galectin-related protein Human genes 0.000 description 1
- 101710147029 Galectin-related protein Proteins 0.000 description 1
- 102000004878 Gelsolin Human genes 0.000 description 1
- 108090001064 Gelsolin Proteins 0.000 description 1
- 102100033236 Geranylgeranyl transferase type-2 subunit alpha Human genes 0.000 description 1
- 101710134582 Geranylgeranyl transferase type-2 subunit alpha Proteins 0.000 description 1
- 102100039719 Germinal center-associated signaling and motility-like protein Human genes 0.000 description 1
- 101710097239 Germinal center-associated signaling and motility-like protein Proteins 0.000 description 1
- 102100041007 Glia maturation factor gamma Human genes 0.000 description 1
- 102100039696 Glutamate-cysteine ligase catalytic subunit Human genes 0.000 description 1
- 101710109147 Glutamate-cysteine ligase catalytic subunit Proteins 0.000 description 1
- 102100033429 Glutamine-fructose-6-phosphate aminotransferase [isomerizing] 1 Human genes 0.000 description 1
- 101710165608 Glutamine-fructose-6-phosphate aminotransferase [isomerizing] 1 Proteins 0.000 description 1
- 102100024977 Glutamine-tRNA ligase Human genes 0.000 description 1
- 108030004364 Glutamine-tRNA ligases Proteins 0.000 description 1
- 102100022556 Glycerol-3-phosphate dehydrogenase 1-like protein Human genes 0.000 description 1
- 101710188408 Glycerol-3-phosphate dehydrogenase 1-like protein Proteins 0.000 description 1
- ZWZWYGMENQVNFU-UHFFFAOYSA-N Glycerophosphorylserin Natural products OC(=O)C(N)COP(O)(=O)OCC(O)CO ZWZWYGMENQVNFU-UHFFFAOYSA-N 0.000 description 1
- 108010051975 Glycogen Synthase Kinase 3 beta Proteins 0.000 description 1
- 102100022975 Glycogen synthase kinase-3 alpha Human genes 0.000 description 1
- 102100038104 Glycogen synthase kinase-3 beta Human genes 0.000 description 1
- 108010015899 Glycopeptides Proteins 0.000 description 1
- 102000002068 Glycopeptides Human genes 0.000 description 1
- 102000003886 Glycoproteins Human genes 0.000 description 1
- 108090000288 Glycoproteins Proteins 0.000 description 1
- 102100021182 Golgi integral membrane protein 4 Human genes 0.000 description 1
- 101710140584 Golgi integral membrane protein 4 Proteins 0.000 description 1
- 102100033325 Golgi-specific brefeldin A-resistance guanine nucleotide exchange factor 1 Human genes 0.000 description 1
- 101710113227 Golgi-specific brefeldin A-resistance guanine nucleotide exchange factor 1 Proteins 0.000 description 1
- 102100031493 Growth arrest-specific protein 7 Human genes 0.000 description 1
- 101710135443 Growth arrest-specific protein 7 Proteins 0.000 description 1
- 102100034154 Guanine nucleotide-binding protein G(i) subunit alpha-2 Human genes 0.000 description 1
- 101710184082 Guanine nucleotide-binding protein G(i) subunit alpha-2 Proteins 0.000 description 1
- 108020004202 Guanylate Kinase Proteins 0.000 description 1
- 102100027377 HBS1-like protein Human genes 0.000 description 1
- 101710197631 HBS1-like protein Proteins 0.000 description 1
- 102100033563 HCLS1-binding protein 3 Human genes 0.000 description 1
- 101710085034 HCLS1-binding protein 3 Proteins 0.000 description 1
- 102100028484 HEAT repeat-containing protein 5B Human genes 0.000 description 1
- 101710086424 HEAT repeat-containing protein 5B Proteins 0.000 description 1
- 208000017891 HER2 positive breast carcinoma Diseases 0.000 description 1
- 102100028972 HLA class I histocompatibility antigen, A alpha chain Human genes 0.000 description 1
- 108010075704 HLA-A Antigens Proteins 0.000 description 1
- 108010013476 HLA-A24 Antigen Proteins 0.000 description 1
- 108010045100 HSP27 Heat-Shock Proteins Proteins 0.000 description 1
- 102100040352 Heat shock 70 kDa protein 1A Human genes 0.000 description 1
- 102100028829 Heat shock 70 kDa protein 4L Human genes 0.000 description 1
- 101710093355 Heat shock 70 kDa protein 4L Proteins 0.000 description 1
- 102100034051 Heat shock protein HSP 90-alpha Human genes 0.000 description 1
- 101710147599 Heat shock protein HSP 90-alpha Proteins 0.000 description 1
- 102100039165 Heat shock protein beta-1 Human genes 0.000 description 1
- 102100027519 Hematopoietic SH2 domain-containing protein Human genes 0.000 description 1
- 101710092336 Hematopoietic SH2 domain-containing protein Proteins 0.000 description 1
- 108091005902 Hemoglobin subunit alpha Proteins 0.000 description 1
- 102100027685 Hemoglobin subunit alpha Human genes 0.000 description 1
- 108091005903 Hemoglobin subunit delta Proteins 0.000 description 1
- 102100039894 Hemoglobin subunit delta Human genes 0.000 description 1
- 108091021225 Heterogeneous Nuclear Ribonucleoprotein D0 Proteins 0.000 description 1
- 102100035669 Heterogeneous nuclear ribonucleoprotein A3 Human genes 0.000 description 1
- 101710203740 Heterogeneous nuclear ribonucleoprotein A3 Proteins 0.000 description 1
- 102100027743 Heterogeneous nuclear ribonucleoprotein C-like 1 Human genes 0.000 description 1
- 101710130089 Heterogeneous nuclear ribonucleoprotein C-like 1 Proteins 0.000 description 1
- 102100033985 Heterogeneous nuclear ribonucleoprotein D0 Human genes 0.000 description 1
- 102100028895 Heterogeneous nuclear ribonucleoprotein M Human genes 0.000 description 1
- 101710141313 Heterogeneous nuclear ribonucleoprotein Q Proteins 0.000 description 1
- 102100028896 Heterogeneous nuclear ribonucleoprotein Q Human genes 0.000 description 1
- 102100023999 Heterogeneous nuclear ribonucleoprotein R Human genes 0.000 description 1
- 101710141315 Heterogeneous nuclear ribonucleoprotein R Proteins 0.000 description 1
- 108010042923 Heterogeneous-Nuclear Ribonucleoprotein Group M Proteins 0.000 description 1
- 102100022128 High mobility group protein B2 Human genes 0.000 description 1
- 101710168540 High mobility group protein B2 Proteins 0.000 description 1
- 102100037095 Histidine decarboxylase Human genes 0.000 description 1
- 108010014095 Histidine decarboxylase Proteins 0.000 description 1
- 102100031004 Histidine-tRNA ligase, cytoplasmic Human genes 0.000 description 1
- 101710177011 Histidine-tRNA ligase, cytoplasmic Proteins 0.000 description 1
- 102100027369 Histone H1.4 Human genes 0.000 description 1
- 101710192078 Histone H1.4 Proteins 0.000 description 1
- 102100022653 Histone H1.5 Human genes 0.000 description 1
- 101710192088 Histone H1.5 Proteins 0.000 description 1
- 102100021639 Histone H2B type 1-K Human genes 0.000 description 1
- 101710160689 Histone H2B type 1-K Proteins 0.000 description 1
- 102100025210 Histone-arginine methyltransferase CARM1 Human genes 0.000 description 1
- 101710182222 Histone-arginine methyltransferase CARM1 Proteins 0.000 description 1
- 101000800023 Homo sapiens 4F2 cell-surface antigen heavy chain Proteins 0.000 description 1
- 101000783786 Homo sapiens ATP-binding cassette sub-family E member 1 Proteins 0.000 description 1
- 101000823284 Homo sapiens ATP-binding cassette sub-family F member 3 Proteins 0.000 description 1
- 101000980825 Homo sapiens B-lymphocyte antigen CD19 Proteins 0.000 description 1
- 101000897405 Homo sapiens B-lymphocyte antigen CD20 Proteins 0.000 description 1
- 101000868273 Homo sapiens CD44 antigen Proteins 0.000 description 1
- 101000738354 Homo sapiens CD9 antigen Proteins 0.000 description 1
- 101000914324 Homo sapiens Carcinoembryonic antigen-related cell adhesion molecule 5 Proteins 0.000 description 1
- 101000914326 Homo sapiens Carcinoembryonic antigen-related cell adhesion molecule 6 Proteins 0.000 description 1
- 101000856022 Homo sapiens Complement decay-accelerating factor Proteins 0.000 description 1
- 101000941929 Homo sapiens Complement receptor type 2 Proteins 0.000 description 1
- 101000916231 Homo sapiens Cullin-4B Proteins 0.000 description 1
- 101000804945 Homo sapiens Dipeptidyl peptidase 9 Proteins 0.000 description 1
- 101000866368 Homo sapiens Dynein axonemal heavy chain 5 Proteins 0.000 description 1
- 101000866323 Homo sapiens Dynein axonemal heavy chain 8 Proteins 0.000 description 1
- 101001022163 Homo sapiens FYN-binding protein 1 Proteins 0.000 description 1
- 101001037759 Homo sapiens Heat shock 70 kDa protein 1A Proteins 0.000 description 1
- 101000994378 Homo sapiens Integrin alpha-3 Proteins 0.000 description 1
- 101000994365 Homo sapiens Integrin alpha-6 Proteins 0.000 description 1
- 101000935043 Homo sapiens Integrin beta-1 Proteins 0.000 description 1
- 101001015006 Homo sapiens Integrin beta-4 Proteins 0.000 description 1
- 101001018097 Homo sapiens L-selectin Proteins 0.000 description 1
- 101000605020 Homo sapiens Large neutral amino acids transporter small subunit 1 Proteins 0.000 description 1
- 101000689480 Homo sapiens Nonsense-mediated mRNA decay factor SMG8 Proteins 0.000 description 1
- 101000599457 Homo sapiens Protein phosphatase inhibitor 2 family member B Proteins 0.000 description 1
- 101000884271 Homo sapiens Signal transducer CD24 Proteins 0.000 description 1
- 101000946843 Homo sapiens T-cell surface glycoprotein CD8 alpha chain Proteins 0.000 description 1
- 101000835093 Homo sapiens Transferrin receptor protein 1 Proteins 0.000 description 1
- 101000772913 Homo sapiens Ubiquitin-conjugating enzyme E2 D3 Proteins 0.000 description 1
- 101000991054 Homo sapiens [F-actin]-monooxygenase MICAL3 Proteins 0.000 description 1
- 102100030355 Host cell factor 1 Human genes 0.000 description 1
- 108091010871 Host cell factor 1 Proteins 0.000 description 1
- 102100031568 Hsp90 co-chaperone Cdc37 Human genes 0.000 description 1
- 101710202322 Hsp90 co-chaperone Cdc37 Proteins 0.000 description 1
- 108010091358 Hypoxanthine Phosphoribosyltransferase Proteins 0.000 description 1
- 102100029098 Hypoxanthine-guanine phosphoribosyltransferase Human genes 0.000 description 1
- 108090000223 Hypoxia-inducible factor-proline dioxygenases Proteins 0.000 description 1
- 102000003856 Hypoxia-inducible factor-proline dioxygenases Human genes 0.000 description 1
- 108010021625 Immunoglobulin Fragments Proteins 0.000 description 1
- 102000008394 Immunoglobulin Fragments Human genes 0.000 description 1
- 108700005091 Immunoglobulin Genes Proteins 0.000 description 1
- 102000017727 Immunoglobulin Variable Region Human genes 0.000 description 1
- 108010067060 Immunoglobulin Variable Region Proteins 0.000 description 1
- 102100021042 Immunoglobulin-binding protein 1 Human genes 0.000 description 1
- 101710178999 Immunoglobulin-binding protein 1 Proteins 0.000 description 1
- 102100036188 Importin subunit alpha-3 Human genes 0.000 description 1
- 101710118224 Importin subunit alpha-3 Proteins 0.000 description 1
- 102100033258 Importin subunit beta-1 Human genes 0.000 description 1
- 101710145060 Importin subunit beta-1 Proteins 0.000 description 1
- 102100037963 Importin-7 Human genes 0.000 description 1
- 101710125784 Importin-7 Proteins 0.000 description 1
- 102100037966 Importin-8 Human genes 0.000 description 1
- 101710125767 Importin-8 Proteins 0.000 description 1
- 102100037961 Importin-9 Human genes 0.000 description 1
- 101710125765 Importin-9 Proteins 0.000 description 1
- 102100026208 Inactive phospholipase C-like protein 2 Human genes 0.000 description 1
- 108050004190 Inactive phospholipase C-like protein 2 Proteins 0.000 description 1
- 206010062717 Increased upper airway secretion Diseases 0.000 description 1
- 102100021892 Inhibitor of nuclear factor kappa-B kinase subunit alpha Human genes 0.000 description 1
- 101710110357 Inhibitor of nuclear factor kappa-B kinase subunit alpha Proteins 0.000 description 1
- 102100021854 Inhibitor of nuclear factor kappa-B kinase subunit beta Human genes 0.000 description 1
- 101710205525 Inhibitor of nuclear factor kappa-B kinase subunit beta Proteins 0.000 description 1
- 102100025458 Inosine triphosphate pyrophosphatase Human genes 0.000 description 1
- 108050007369 Inosine triphosphate pyrophosphatases Proteins 0.000 description 1
- 102100021496 Insulin-degrading enzyme Human genes 0.000 description 1
- 102100037924 Insulin-like growth factor 2 mRNA-binding protein 1 Human genes 0.000 description 1
- 101710126181 Insulin-like growth factor 2 mRNA-binding protein 1 Proteins 0.000 description 1
- 108090000828 Insulysin Proteins 0.000 description 1
- 102100030147 Integrator complex subunit 7 Human genes 0.000 description 1
- 101710092890 Integrator complex subunit 7 Proteins 0.000 description 1
- 102100032819 Integrin alpha-3 Human genes 0.000 description 1
- 102100032816 Integrin alpha-6 Human genes 0.000 description 1
- 102100025304 Integrin beta-1 Human genes 0.000 description 1
- 102100033000 Integrin beta-4 Human genes 0.000 description 1
- 102000012355 Integrin beta1 Human genes 0.000 description 1
- 108010022222 Integrin beta1 Proteins 0.000 description 1
- 102100039349 Intraflagellar transport protein 25 homolog Human genes 0.000 description 1
- 101710134808 Intraflagellar transport protein 25 homolog Proteins 0.000 description 1
- 108010044467 Isoenzymes Proteins 0.000 description 1
- 102100036015 Isoleucine-tRNA ligase, cytoplasmic Human genes 0.000 description 1
- 101710176147 Isoleucine-tRNA ligase, cytoplasmic Proteins 0.000 description 1
- 102100027665 Isopentenyl-diphosphate Delta-isomerase 1 Human genes 0.000 description 1
- 102100023133 Jupiter microtubule associated homolog 1 Human genes 0.000 description 1
- 101710085971 Jupiter microtubule associated homolog 1 Proteins 0.000 description 1
- 108010003046 KSR-1 protein kinase Proteins 0.000 description 1
- 102100025655 Keratin, type II cytoskeletal 6B Human genes 0.000 description 1
- 101710083640 Keratin, type II cytoskeletal 6B Proteins 0.000 description 1
- 102100035791 Keratinocyte proline-rich protein Human genes 0.000 description 1
- 101710100048 Keratinocyte proline-rich protein Proteins 0.000 description 1
- 208000008839 Kidney Neoplasms Diseases 0.000 description 1
- 102100021001 Kinase suppressor of Ras 1 Human genes 0.000 description 1
- 102100020685 Kinesin heavy chain isoform 5A Human genes 0.000 description 1
- 101710203856 Kinesin heavy chain isoform 5A Proteins 0.000 description 1
- 102100038306 Kinesin light chain 1 Human genes 0.000 description 1
- 101710163106 Kinesin light chain 1 Proteins 0.000 description 1
- 102100034863 Kinesin-like protein KIF13B Human genes 0.000 description 1
- 101710127132 Kinesin-like protein KIF13B Proteins 0.000 description 1
- 102100027631 Kinesin-like protein KIF14 Human genes 0.000 description 1
- 101710134403 Kinesin-like protein KIF14 Proteins 0.000 description 1
- 102100037691 Kinesin-like protein KIF20B Human genes 0.000 description 1
- 108050007394 Kinesin-like protein KIF20B Proteins 0.000 description 1
- 102100038406 Kinesin-like protein KIF23 Human genes 0.000 description 1
- 101710134354 Kinesin-like protein KIF23 Proteins 0.000 description 1
- 102100023426 Kinesin-like protein KIF2A Human genes 0.000 description 1
- 101710134365 Kinesin-like protein KIF2A Proteins 0.000 description 1
- 102100020733 Kinesin-like protein KIF3C Human genes 0.000 description 1
- 101710134387 Kinesin-like protein KIF3C Proteins 0.000 description 1
- 102100033467 L-selectin Human genes 0.000 description 1
- 102100033339 LIM domain and actin-binding protein 1 Human genes 0.000 description 1
- 108700037844 LIM domain and actin-binding protein 1 Proteins 0.000 description 1
- 102100020870 La-related protein 6 Human genes 0.000 description 1
- 108050008265 La-related protein 6 Proteins 0.000 description 1
- 102100039648 Lactadherin Human genes 0.000 description 1
- 101710191666 Lactadherin Proteins 0.000 description 1
- 102100034710 Laminin subunit gamma-1 Human genes 0.000 description 1
- 101710095658 Laminin subunit gamma-1 Proteins 0.000 description 1
- 102100034723 LanC-like protein 2 Human genes 0.000 description 1
- 101710195374 LanC-like protein 2 Proteins 0.000 description 1
- 102100028047 Large proline-rich protein BAG6 Human genes 0.000 description 1
- 101710196180 Large proline-rich protein BAG6 Proteins 0.000 description 1
- 102000004856 Lectins Human genes 0.000 description 1
- 108090001090 Lectins Proteins 0.000 description 1
- 102100021803 Leucine zipper transcription factor-like protein 1 Human genes 0.000 description 1
- 101710118566 Leucine zipper transcription factor-like protein 1 Proteins 0.000 description 1
- 102100040589 Leucine-rich PPR motif-containing protein, mitochondrial Human genes 0.000 description 1
- 101710099853 Leucine-rich PPR motif-containing protein, mitochondrial Proteins 0.000 description 1
- 102100032696 Leucine-rich repeat and calponin homology domain-containing protein 1 Human genes 0.000 description 1
- 101710153132 Leucine-rich repeat and calponin homology domain-containing protein 1 Proteins 0.000 description 1
- 102100033303 Leucine-rich repeat flightless-interacting protein 1 Human genes 0.000 description 1
- 101710167397 Leucine-rich repeat flightless-interacting protein 1 Proteins 0.000 description 1
- 102100022237 Leucine-rich repeat-containing protein 1 Human genes 0.000 description 1
- 101710148971 Leucine-rich repeat-containing protein 1 Proteins 0.000 description 1
- 102100032755 Leupaxin Human genes 0.000 description 1
- 101710156018 Leupaxin Proteins 0.000 description 1
- 102000003960 Ligases Human genes 0.000 description 1
- 108090000364 Ligases Proteins 0.000 description 1
- 102100026358 Lipoma-preferred partner Human genes 0.000 description 1
- 101710137919 Lipoma-preferred partner Proteins 0.000 description 1
- 102000004895 Lipoproteins Human genes 0.000 description 1
- 108090001030 Lipoproteins Proteins 0.000 description 1
- 102100029107 Long chain 3-hydroxyacyl-CoA dehydrogenase Human genes 0.000 description 1
- 108010051910 Long-chain-3-hydroxyacyl-CoA dehydrogenase Proteins 0.000 description 1
- 102100037611 Lysophospholipase Human genes 0.000 description 1
- 108020002496 Lysophospholipase Proteins 0.000 description 1
- 102100038490 Lysophospholipase-like protein 1 Human genes 0.000 description 1
- 101710202925 Lysophospholipase-like protein 1 Proteins 0.000 description 1
- 208000015439 Lysosomal storage disease Diseases 0.000 description 1
- 102100028241 MAP7 domain-containing protein 1 Human genes 0.000 description 1
- 101710173105 MAP7 domain-containing protein 1 Proteins 0.000 description 1
- 108700012928 MAPK14 Proteins 0.000 description 1
- 102100032514 MARCKS-related protein Human genes 0.000 description 1
- 101710136868 MARCKS-related protein Proteins 0.000 description 1
- 102000043129 MHC class I family Human genes 0.000 description 1
- 108091054437 MHC class I family Proteins 0.000 description 1
- 102000044235 MICAL3 Human genes 0.000 description 1
- 108010048043 Macrophage Migration-Inhibitory Factors Proteins 0.000 description 1
- 102100037791 Macrophage migration inhibitory factor Human genes 0.000 description 1
- 102100024573 Macrophage-capping protein Human genes 0.000 description 1
- 108050006096 Macrophage-capping proteins Proteins 0.000 description 1
- 102100038884 Major vault protein Human genes 0.000 description 1
- 101710094960 Major vault protein Proteins 0.000 description 1
- 108091022912 Mannose-6-Phosphate Isomerase Proteins 0.000 description 1
- 238000007476 Maximum Likelihood Methods 0.000 description 1
- 102100039364 Metalloproteinase inhibitor 1 Human genes 0.000 description 1
- 108050006599 Metalloproteinase inhibitor 1 Proteins 0.000 description 1
- 206010027476 Metastases Diseases 0.000 description 1
- 102100023174 Methionine aminopeptidase 2 Human genes 0.000 description 1
- 102100037206 Methionine-tRNA ligase, cytoplasmic Human genes 0.000 description 1
- 101710116586 Methionine-tRNA ligase, cytoplasmic Proteins 0.000 description 1
- 108090000192 Methionyl aminopeptidases Proteins 0.000 description 1
- 108700040132 Mevalonate kinases Proteins 0.000 description 1
- 102100029624 Migration and invasion enhancer 1 Human genes 0.000 description 1
- 101710204335 Migration and invasion enhancer 1 Proteins 0.000 description 1
- 108010079782 Minichromosome Maintenance Complex Component 2 Proteins 0.000 description 1
- 108010079754 Minichromosome Maintenance Complex Component 6 Proteins 0.000 description 1
- 101710159531 Mitochondrial import inner membrane translocase subunit tim14 Proteins 0.000 description 1
- 102100023482 Mitogen-activated protein kinase 14 Human genes 0.000 description 1
- 102100028193 Mitogen-activated protein kinase kinase kinase kinase 3 Human genes 0.000 description 1
- 101710144521 Mitogen-activated protein kinase kinase kinase kinase 3 Proteins 0.000 description 1
- 102100028194 Mitogen-activated protein kinase kinase kinase kinase 4 Human genes 0.000 description 1
- 101710144518 Mitogen-activated protein kinase kinase kinase kinase 4 Proteins 0.000 description 1
- 208000001089 Multiple system atrophy Diseases 0.000 description 1
- 208000033776 Myeloid Acute Leukemia Diseases 0.000 description 1
- 101710193416 Myosin light chain 3 Proteins 0.000 description 1
- 108050003275 Myotubularin-related protein 13 Proteins 0.000 description 1
- 102100024960 Myotubularin-related protein 13 Human genes 0.000 description 1
- 102100040604 Myotubularin-related protein 5 Human genes 0.000 description 1
- 108050003253 Myotubularin-related protein 5 Proteins 0.000 description 1
- 102100033341 N-acetylmannosamine kinase Human genes 0.000 description 1
- 101710179749 N-acetylmannosamine kinase Proteins 0.000 description 1
- MVAWJSIDNICKHF-UHFFFAOYSA-N N-acetylserotonin Chemical compound C1=C(O)C=C2C(CCNC(=O)C)=CNC2=C1 MVAWJSIDNICKHF-UHFFFAOYSA-N 0.000 description 1
- 102100026796 NAC-alpha domain-containing protein 1 Human genes 0.000 description 1
- 101710098432 NAC-alpha domain-containing protein 1 Proteins 0.000 description 1
- 102100020694 NEDD8-conjugating enzyme UBE2F Human genes 0.000 description 1
- 101710107612 NEDD8-conjugating enzyme UBE2F Proteins 0.000 description 1
- 102000002673 NFATC Transcription Factors Human genes 0.000 description 1
- 108010018525 NFATC Transcription Factors Proteins 0.000 description 1
- 102100029447 Na(+)/H(+) exchange regulatory cofactor NHE-RF1 Human genes 0.000 description 1
- 101710143582 Na(+)/H(+) exchange regulatory cofactor NHE-RF1 Proteins 0.000 description 1
- 102100039235 Neurobeachin-like protein 2 Human genes 0.000 description 1
- 101710199254 Neurobeachin-like protein 2 Proteins 0.000 description 1
- 102100031837 Neuroblast differentiation-associated protein AHNAK Human genes 0.000 description 1
- 101710154564 Neuroblast differentiation-associated protein AHNAK Proteins 0.000 description 1
- 102100026379 Neurofibromin Human genes 0.000 description 1
- 108010085793 Neurofibromin 1 Proteins 0.000 description 1
- 102100028669 Neuron-specific calcium-binding protein hippocalcin Human genes 0.000 description 1
- 101710123887 Neuron-specific calcium-binding protein hippocalcin Proteins 0.000 description 1
- 102100023617 Neutrophil cytosol factor 4 Human genes 0.000 description 1
- 101710120087 Neutrophil cytosol factor 4 Proteins 0.000 description 1
- 101001130573 Nicotiana tabacum Ras-related protein Rab11B Proteins 0.000 description 1
- 108010064862 Nicotinamide phosphoribosyltransferase Proteins 0.000 description 1
- 102000015532 Nicotinamide phosphoribosyltransferase Human genes 0.000 description 1
- 102100032028 Non-receptor tyrosine-protein kinase TYK2 Human genes 0.000 description 1
- 102100024540 Nonsense-mediated mRNA decay factor SMG8 Human genes 0.000 description 1
- 102100023050 Nuclear factor NF-kappa-B p105 subunit Human genes 0.000 description 1
- 101710082694 Nuclear factor NF-kappa-B p105 subunit Proteins 0.000 description 1
- 101710202583 Nuclear pore complex protein NUP85 Proteins 0.000 description 1
- 102100027582 Nuclear pore complex protein Nup85 Human genes 0.000 description 1
- 102100027586 Nuclear pore complex protein Nup88 Human genes 0.000 description 1
- 101710202584 Nuclear pore complex protein Nup88 Proteins 0.000 description 1
- 101710127265 Nuclear receptor-binding protein Proteins 0.000 description 1
- 102100021858 Nuclear receptor-binding protein Human genes 0.000 description 1
- 102100021007 Nuclear ubiquitous casein and cyclin-dependent kinase substrate 1 Human genes 0.000 description 1
- 101710165860 Nuclear ubiquitous casein and cyclin-dependent kinase substrate 1 Proteins 0.000 description 1
- 102100021010 Nucleolin Human genes 0.000 description 1
- 108010025568 Nucleophosmin Proteins 0.000 description 1
- 102100022678 Nucleophosmin Human genes 0.000 description 1
- 102100037823 Nucleoporin Nup43 Human genes 0.000 description 1
- 101710160540 Nucleoporin Nup43 Proteins 0.000 description 1
- 102100033615 Nucleoprotein TPR Human genes 0.000 description 1
- 101710145115 Nucleoprotein TPR Proteins 0.000 description 1
- 102100022389 Nucleosome assembly protein 1-like 1 Human genes 0.000 description 1
- 101710192961 Nucleosome assembly protein 1-like 1 Proteins 0.000 description 1
- 101710147982 Nucleosome assembly protein 1;1 Proteins 0.000 description 1
- 102100040562 OTU domain-containing protein 7B Human genes 0.000 description 1
- 101710090645 OTU domain-containing protein 7B Proteins 0.000 description 1
- 102100027177 Ornithine aminotransferase, mitochondrial Human genes 0.000 description 1
- 101710171020 Ornithine aminotransferase, mitochondrial Proteins 0.000 description 1
- 102100032163 Oxysterol-binding protein 1 Human genes 0.000 description 1
- 101710204654 Oxysterol-binding protein 1 Proteins 0.000 description 1
- 229910019142 PO4 Inorganic materials 0.000 description 1
- 206010061902 Pancreatic neoplasm Diseases 0.000 description 1
- 108090000526 Papain Proteins 0.000 description 1
- 108050008041 Paraneoplastic antigen-like protein 5 Proteins 0.000 description 1
- 102000000601 Paraneoplastic antigen-like protein 5 Human genes 0.000 description 1
- 102000043299 Parathyroid hormone-related Human genes 0.000 description 1
- 101710123753 Parathyroid hormone-related protein Proteins 0.000 description 1
- 102000057297 Pepsin A Human genes 0.000 description 1
- 108090000284 Pepsin A Proteins 0.000 description 1
- 102000035195 Peptidases Human genes 0.000 description 1
- 108091005804 Peptidases Proteins 0.000 description 1
- 102000010292 Peptide Elongation Factor 1 Human genes 0.000 description 1
- 108010077524 Peptide Elongation Factor 1 Proteins 0.000 description 1
- 108010077519 Peptide Elongation Factor 2 Proteins 0.000 description 1
- 101710111682 Peptidyl-prolyl cis-trans isomerase FKBP1A Proteins 0.000 description 1
- 102100027913 Peptidyl-prolyl cis-trans isomerase FKBP1A Human genes 0.000 description 1
- 108010056995 Perforin Proteins 0.000 description 1
- 102000004503 Perforin Human genes 0.000 description 1
- 208000005228 Pericardial Effusion Diseases 0.000 description 1
- 102100037765 Periostin Human genes 0.000 description 1
- 101710199268 Periostin Proteins 0.000 description 1
- 208000006735 Periostitis Diseases 0.000 description 1
- 108010071595 Peroxisomal Multifunctional Protein-2 Proteins 0.000 description 1
- 102100038883 Peroxisomal biogenesis factor 19 Human genes 0.000 description 1
- 101710142874 Peroxisomal biogenesis factor 19 Proteins 0.000 description 1
- 102100022587 Peroxisomal multifunctional enzyme type 2 Human genes 0.000 description 1
- 102100035215 Phenylalanine-tRNA ligase alpha subunit Human genes 0.000 description 1
- 101710147128 Phenylalanine-tRNA ligase alpha subunit Proteins 0.000 description 1
- 102100034809 Phosducin-like protein 3 Human genes 0.000 description 1
- 101710088244 Phosducin-like protein 3 Proteins 0.000 description 1
- 102100032543 Phosphatidylinositol 3,4,5-trisphosphate 3-phosphatase and dual-specificity protein phosphatase PTEN Human genes 0.000 description 1
- 101710132081 Phosphatidylinositol 3,4,5-trisphosphate 3-phosphatase and dual-specificity protein phosphatase PTEN Proteins 0.000 description 1
- 102100024242 Phosphatidylinositol 3,4,5-trisphosphate 5-phosphatase 2 Human genes 0.000 description 1
- 101710174325 Phosphatidylinositol 3,4,5-trisphosphate 5-phosphatase 2 Proteins 0.000 description 1
- 102100034077 Phosphofurin acidic cluster sorting protein 2 Human genes 0.000 description 1
- 101710135658 Phosphofurin acidic cluster sorting protein 2 Proteins 0.000 description 1
- 108010038555 Phosphoglycerate dehydrogenase Proteins 0.000 description 1
- 102100037389 Phosphoglycerate mutase 1 Human genes 0.000 description 1
- 108050006040 Phosphoglycerate mutase 1 Proteins 0.000 description 1
- 102100032572 Phospholipase A-2-activating protein Human genes 0.000 description 1
- 101710133554 Phosphomannomutase 2 Proteins 0.000 description 1
- 108010022181 Phosphopyruvate Hydratase Proteins 0.000 description 1
- 101710089027 Phosphoribosyl pyrophosphate synthase-associated protein 1 Proteins 0.000 description 1
- 102100022063 Phosphoribosyl pyrophosphate synthase-associated protein 1 Human genes 0.000 description 1
- 102100022060 Phosphoribosyl pyrophosphate synthase-associated protein 2 Human genes 0.000 description 1
- 101710088934 Phosphoribosyl pyrophosphate synthase-associated protein 2 Proteins 0.000 description 1
- 102100036473 Phosphoribosylformylglycinamidine synthase Human genes 0.000 description 1
- 108030004873 Phosphoribosylformylglycinamidine synthases Proteins 0.000 description 1
- 102100026123 Pirin Human genes 0.000 description 1
- 101710176373 Pirin Proteins 0.000 description 1
- 108050003861 Plasminogen activator inhibitor 1 RNA-binding proteins Proteins 0.000 description 1
- 102000014002 Plasminogen activator inhibitor 1 RNA-binding proteins Human genes 0.000 description 1
- 102100035220 Plastin-3 Human genes 0.000 description 1
- 101710081133 Plastin-3 Proteins 0.000 description 1
- 102100032588 Pleckstrin homology domain-containing family G member 3 Human genes 0.000 description 1
- 101710103300 Pleckstrin homology domain-containing family G member 3 Proteins 0.000 description 1
- 102100033008 Poly(U)-binding-splicing factor PUF60 Human genes 0.000 description 1
- 101710109019 Poly(U)-binding-splicing factor PUF60 Proteins 0.000 description 1
- 102100039425 Polyadenylate-binding protein 3 Human genes 0.000 description 1
- 101710139638 Polyadenylate-binding protein 3 Proteins 0.000 description 1
- 102100034080 Polyadenylate-binding protein-interacting protein 1 Human genes 0.000 description 1
- 101710101680 Polyadenylate-binding protein-interacting protein 1 Proteins 0.000 description 1
- 108010066816 Polypeptide N-acetylgalactosaminyltransferase Proteins 0.000 description 1
- 102100020950 Polypeptide N-acetylgalactosaminyltransferase 2 Human genes 0.000 description 1
- 102100021231 Pre-mRNA-processing-splicing factor 8 Human genes 0.000 description 1
- 101710107104 Pre-mRNA-processing-splicing factor 8 Proteins 0.000 description 1
- 102100026531 Prelamin-A/C Human genes 0.000 description 1
- 101710205254 Prelamin-A/C Proteins 0.000 description 1
- 108091000054 Prion Proteins 0.000 description 1
- 102000029797 Prion Human genes 0.000 description 1
- 101710101148 Probable 6-oxopurine nucleoside phosphorylase Proteins 0.000 description 1
- 102100029480 Probable ATP-dependent RNA helicase DDX6 Human genes 0.000 description 1
- 101710136302 Probable ATP-dependent RNA helicase DDX6 Proteins 0.000 description 1
- 102100039913 Probable E3 ubiquitin-protein ligase HERC4 Human genes 0.000 description 1
- 101710179942 Probable E3 ubiquitin-protein ligase HERC4 Proteins 0.000 description 1
- 108050001107 Probable phospholipid-transporting ATPase IIB Proteins 0.000 description 1
- 102000010930 Probable phospholipid-transporting ATPase IIB Human genes 0.000 description 1
- 206010036790 Productive cough Diseases 0.000 description 1
- 102000011195 Profilin Human genes 0.000 description 1
- 108050001408 Profilin Proteins 0.000 description 1
- 102100025803 Progesterone receptor Human genes 0.000 description 1
- 102100033344 Programmed cell death 6-interacting protein Human genes 0.000 description 1
- 101710198445 Programmed cell death 6-interacting protein Proteins 0.000 description 1
- 102100034807 Programmed cell death protein 5 Human genes 0.000 description 1
- 101710089364 Programmed cell death protein 5 Proteins 0.000 description 1
- 102100036691 Proliferating cell nuclear antigen Human genes 0.000 description 1
- 102100026126 Proline-tRNA ligase Human genes 0.000 description 1
- 101710115782 Proline-tRNA ligase Proteins 0.000 description 1
- 102100040477 Prolyl 4-hydroxylase subunit alpha-1 Human genes 0.000 description 1
- 101710084323 Prolyl 4-hydroxylase subunit alpha-1 Proteins 0.000 description 1
- 102000056251 Prolyl Oligopeptidases Human genes 0.000 description 1
- 101710178372 Prolyl endopeptidase Proteins 0.000 description 1
- 102100036197 Prosaposin Human genes 0.000 description 1
- 101710152403 Prosaposin Proteins 0.000 description 1
- 102100023080 Proteasome adapter and scaffold protein ECM29 Human genes 0.000 description 1
- 101710201657 Proteasome adapter and scaffold protein ECM29 Proteins 0.000 description 1
- 101710094498 Proteasome subunit beta type-2 Proteins 0.000 description 1
- 102100040400 Proteasome subunit beta type-2 Human genes 0.000 description 1
- 101710094500 Proteasome subunit beta type-3 Proteins 0.000 description 1
- 102100033755 Proteasome subunit beta type-3 Human genes 0.000 description 1
- 101710094466 Proteasome subunit beta type-9 Proteins 0.000 description 1
- 102100035764 Proteasome subunit beta type-9 Human genes 0.000 description 1
- 101710096675 Proteasome-associated protein ECM29 homolog Proteins 0.000 description 1
- 102100024647 Protein ABHD14B Human genes 0.000 description 1
- 101710173275 Protein ABHD14B Proteins 0.000 description 1
- 101710164293 Protein C10 Proteins 0.000 description 1
- 102100038957 Protein C10 Human genes 0.000 description 1
- 101710081313 Protein FAM91A1 Proteins 0.000 description 1
- 102100026955 Protein FAM91A1 Human genes 0.000 description 1
- 108010029485 Protein Isoforms Proteins 0.000 description 1
- 102000001708 Protein Isoforms Human genes 0.000 description 1
- 102000001253 Protein Kinase Human genes 0.000 description 1
- 102100024314 Protein Mdm4 Human genes 0.000 description 1
- 101710121574 Protein Mdm4 Proteins 0.000 description 1
- 102100039972 Protein RCC2 Human genes 0.000 description 1
- 101710191281 Protein RCC2 Proteins 0.000 description 1
- 102100025670 Protein S100-A13 Human genes 0.000 description 1
- 101710110946 Protein S100-A13 Proteins 0.000 description 1
- 102100032420 Protein S100-A9 Human genes 0.000 description 1
- 101710156990 Protein S100-A9 Proteins 0.000 description 1
- 102100021725 Protein SEC13 homolog Human genes 0.000 description 1
- 101710094795 Protein SEC13 homolog Proteins 0.000 description 1
- 102100038090 Protein WFDC11 Human genes 0.000 description 1
- 101710170778 Protein WFDC11 Proteins 0.000 description 1
- 101710151720 Protein YIPF4 Proteins 0.000 description 1
- 102100030945 Protein YIPF4 Human genes 0.000 description 1
- 101710193175 Protein clueless Proteins 0.000 description 1
- 102100036468 Protein diaphanous homolog 3 Human genes 0.000 description 1
- 101710158946 Protein diaphanous homolog 3 Proteins 0.000 description 1
- 101710171310 Protein enabled homolog Proteins 0.000 description 1
- 102100035093 Protein enabled homolog Human genes 0.000 description 1
- 102100034315 Protein kinase C and casein kinase substrate in neurons protein 3 Human genes 0.000 description 1
- 101710098965 Protein kinase C and casein kinase substrate in neurons protein 3 Proteins 0.000 description 1
- 102100024923 Protein kinase C beta type Human genes 0.000 description 1
- 101710094033 Protein kinase C beta type Proteins 0.000 description 1
- 102100037339 Protein kinase C epsilon type Human genes 0.000 description 1
- 101710144382 Protein kinase C epsilon type Proteins 0.000 description 1
- 102100037314 Protein kinase C gamma type Human genes 0.000 description 1
- 101710144823 Protein kinase C gamma type Proteins 0.000 description 1
- 102100028485 Protein pelota homolog Human genes 0.000 description 1
- 101710115976 Protein pelota homolog Proteins 0.000 description 1
- 102100036547 Protein phosphatase 1 regulatory subunit 12A Human genes 0.000 description 1
- 101710081954 Protein phosphatase 1 regulatory subunit 12A Proteins 0.000 description 1
- 102100038702 Protein phosphatase 1B Human genes 0.000 description 1
- 101710105643 Protein phosphatase 1B Proteins 0.000 description 1
- 102100038677 Protein phosphatase 1F Human genes 0.000 description 1
- 101710105656 Protein phosphatase 1F Proteins 0.000 description 1
- 102100031805 Protein phosphatase Slingshot homolog 3 Human genes 0.000 description 1
- 101710162112 Protein phosphatase Slingshot homolog 3 Proteins 0.000 description 1
- 102100037962 Protein phosphatase inhibitor 2 family member B Human genes 0.000 description 1
- 102100033947 Protein regulator of cytokinesis 1 Human genes 0.000 description 1
- 108050001955 Protein regulator of cytokinesis 1 Proteins 0.000 description 1
- 102000003894 Protein-L-isoaspartate(D-aspartate) O-methyltransferases Human genes 0.000 description 1
- 108090000249 Protein-L-isoaspartate(D-aspartate) O-methyltransferases Proteins 0.000 description 1
- 102000030764 Purine-nucleoside phosphorylase Human genes 0.000 description 1
- 102100037266 Putative 3-phosphoinositide-dependent protein kinase 2 Human genes 0.000 description 1
- 101710158414 Putative 3-phosphoinositide-dependent protein kinase 2 Proteins 0.000 description 1
- 101710137360 Putative PIP5K1A and PSMD4-like protein Proteins 0.000 description 1
- 102100036064 Putative PIP5K1A and PSMD4-like protein Human genes 0.000 description 1
- 102100023468 Putative RNA-binding protein Luc7-like 1 Human genes 0.000 description 1
- 101710153879 Putative RNA-binding protein Luc7-like 1 Proteins 0.000 description 1
- 101710118614 Putative deoxyribose-phosphate aldolase Proteins 0.000 description 1
- 101710096925 Putative helicase MOV-10 Proteins 0.000 description 1
- 102100023614 Putative neutrophil cytosol factor 1C Human genes 0.000 description 1
- 101710191730 Putative neutrophil cytosol factor 1C Proteins 0.000 description 1
- 108010028039 Pyridoxaminephosphate Oxidase Proteins 0.000 description 1
- 101710132082 Pyrimidine/purine nucleoside phosphorylase Proteins 0.000 description 1
- 102100039407 Pyrroline-5-carboxylate reductase 1, mitochondrial Human genes 0.000 description 1
- 101710090650 Pyrroline-5-carboxylate reductase 1, mitochondrial Proteins 0.000 description 1
- 102000013009 Pyruvate Kinase Human genes 0.000 description 1
- 108020005115 Pyruvate Kinase Proteins 0.000 description 1
- 102100023488 RAS guanyl-releasing protein 2 Human genes 0.000 description 1
- 101710144556 RAS guanyl-releasing protein 2 Proteins 0.000 description 1
- 102100027429 RNA binding motif protein, X-linked-like-1 Human genes 0.000 description 1
- 101710088701 RNA binding motif protein, X-linked-like-1 Proteins 0.000 description 1
- 102100034620 RNA polymerase II-associated protein 1 Human genes 0.000 description 1
- 101710135941 RNA polymerase II-associated protein 1 Proteins 0.000 description 1
- 239000013614 RNA sample Substances 0.000 description 1
- 238000011529 RT qPCR Methods 0.000 description 1
- 102100034328 Rab GDP dissociation inhibitor beta Human genes 0.000 description 1
- 101710193720 Rab GDP dissociation inhibitor beta Proteins 0.000 description 1
- 102100033185 Rab3 GTPase-activating protein non-catalytic subunit Human genes 0.000 description 1
- 101710090485 Rab3 GTPase-activating protein non-catalytic subunit Proteins 0.000 description 1
- 101710086049 Rabankyrin-5 Proteins 0.000 description 1
- 102100040160 Rabankyrin-5 Human genes 0.000 description 1
- 102100037414 Rac GTPase-activating protein 1 Human genes 0.000 description 1
- 101710196218 Rac GTPase-activating protein 1 Proteins 0.000 description 1
- 101710186313 Ral GTPase-activating protein subunit beta Proteins 0.000 description 1
- 102100035887 Ral GTPase-activating protein subunit beta Human genes 0.000 description 1
- 102100038473 Ran GTPase-activating protein 1 Human genes 0.000 description 1
- 101710160162 Ran GTPase-activating protein 1 Proteins 0.000 description 1
- 102100034587 Rap guanine nucleotide exchange factor 6 Human genes 0.000 description 1
- 101710204338 Rap guanine nucleotide exchange factor 6 Proteins 0.000 description 1
- 208000035977 Rare disease Diseases 0.000 description 1
- 102100034418 Ras GTPase-activating-like protein IQGAP2 Human genes 0.000 description 1
- 101710145389 Ras GTPase-activating-like protein IQGAP2 Proteins 0.000 description 1
- 102100037967 Ras and Rab interactor-like protein Human genes 0.000 description 1
- 101710125315 Ras and Rab interactor-like protein Proteins 0.000 description 1
- 102100022122 Ras-related C3 botulinum toxin substrate 1 Human genes 0.000 description 1
- 102100039103 Ras-related protein Rab-10 Human genes 0.000 description 1
- 101710113969 Ras-related protein Rab-10 Proteins 0.000 description 1
- 102100031379 Ras-related protein Rab-11B Human genes 0.000 description 1
- 102100028191 Ras-related protein Rab-1A Human genes 0.000 description 1
- 102100034485 Ras-related protein Rab-2A Human genes 0.000 description 1
- 102100027838 Ras-related protein Rab-31 Human genes 0.000 description 1
- 101710113710 Ras-related protein Rab-31 Proteins 0.000 description 1
- 102100025219 Ras-related protein Rab-6A Human genes 0.000 description 1
- 102000016179 Ras-related protein Rab14 Human genes 0.000 description 1
- 108050004679 Ras-related protein Rab14 Proteins 0.000 description 1
- 102100031425 Ras-related protein Ral-B Human genes 0.000 description 1
- 101710118478 Ras-related protein Ral-B Proteins 0.000 description 1
- 102100030705 Ras-related protein Rap-1b Human genes 0.000 description 1
- 101710116844 Ras-related protein Rap-1b Proteins 0.000 description 1
- 102100022501 Receptor-interacting serine/threonine-protein kinase 1 Human genes 0.000 description 1
- 101710138589 Receptor-interacting serine/threonine-protein kinase 1 Proteins 0.000 description 1
- 108050007056 Regucalcin Proteins 0.000 description 1
- 102100030262 Regucalcin Human genes 0.000 description 1
- 102100035736 Regulator of G-protein signaling 14 Human genes 0.000 description 1
- 101710148334 Regulator of G-protein signaling 14 Proteins 0.000 description 1
- 102100028287 Regulator of nonsense transcripts 1 Human genes 0.000 description 1
- 101710172454 Regulator of nonsense transcripts 1 Proteins 0.000 description 1
- 102100037851 Replication factor C subunit 2 Human genes 0.000 description 1
- 101710147940 Replication factor C subunit 2 Proteins 0.000 description 1
- 238000012952 Resampling Methods 0.000 description 1
- 241000219061 Rheum Species 0.000 description 1
- 102100021431 Rho GTPase-activating protein 4 Human genes 0.000 description 1
- 101710116901 Rho GTPase-activating protein 4 Proteins 0.000 description 1
- 101710110428 Rho GTPase-activating protein 45 Proteins 0.000 description 1
- 102100039314 Rho-associated protein kinase 2 Human genes 0.000 description 1
- 101710088493 Rho-associated protein kinase 2 Proteins 0.000 description 1
- 102000000123 Ribonucleoside-diphosphate reductase large subunit Human genes 0.000 description 1
- 108050008465 Ribonucleoside-diphosphate reductase large subunit Proteins 0.000 description 1
- 108091028664 Ribonucleotide Proteins 0.000 description 1
- 102100029642 Ribosomal RNA processing protein 1 homolog B Human genes 0.000 description 1
- 101710166150 Ribosomal RNA processing protein 1 homolog B Proteins 0.000 description 1
- 101710119197 Ribosomal protein S6 kinase alpha-1 Proteins 0.000 description 1
- 102100033536 Ribosomal protein S6 kinase alpha-1 Human genes 0.000 description 1
- 239000006146 Roswell Park Memorial Institute medium Substances 0.000 description 1
- 102100034742 Rotatin Human genes 0.000 description 1
- 101710200213 Rotatin Proteins 0.000 description 1
- 101710164442 S-(hydroxymethyl)glutathione dehydrogenase Proteins 0.000 description 1
- 102100022479 S-adenosylhomocysteine hydrolase-like protein 1 Human genes 0.000 description 1
- 101710087348 S-adenosylhomocysteine hydrolase-like protein 1 Proteins 0.000 description 1
- 102100035947 S-adenosylmethionine synthase isoform type-2 Human genes 0.000 description 1
- 101710167557 S-adenosylmethionine synthase isoform type-2 Proteins 0.000 description 1
- 102100031698 SCY1-like protein 2 Human genes 0.000 description 1
- 101710091213 SCY1-like protein 2 Proteins 0.000 description 1
- 102100021798 SH2 domain-containing protein 3C Human genes 0.000 description 1
- 101710097751 SH2 domain-containing protein 3C Proteins 0.000 description 1
- 102100031770 SH2B adapter protein 1 Human genes 0.000 description 1
- 108050003189 SH2B adapter protein 1 Proteins 0.000 description 1
- 102100024231 SH3KBP1-binding protein 1 Human genes 0.000 description 1
- 101710151322 SH3KBP1-binding protein 1 Proteins 0.000 description 1
- 102100029989 SHC SH2 domain-binding protein 1 Human genes 0.000 description 1
- 101710140556 SHC SH2 domain-binding protein 1 Proteins 0.000 description 1
- 102100024472 STAM-binding protein Human genes 0.000 description 1
- 101710181165 STAM-binding protein Proteins 0.000 description 1
- 102100024171 STE20-related kinase adapter protein alpha Human genes 0.000 description 1
- 101710122731 STE20-related kinase adapter protein alpha Proteins 0.000 description 1
- 102100025809 SUMO-activating enzyme subunit 1 Human genes 0.000 description 1
- 101710180714 SUMO-activating enzyme subunit 1 Proteins 0.000 description 1
- 102100036546 Salivary acidic proline-rich phosphoprotein 1/2 Human genes 0.000 description 1
- 101710107730 Salivary acidic proline-rich phosphoprotein 1/2 Proteins 0.000 description 1
- 101710185556 Sarcoplasmic reticulum histidine-rich calcium-binding protein Proteins 0.000 description 1
- 102100031875 Sarcoplasmic reticulum histidine-rich calcium-binding protein Human genes 0.000 description 1
- 102100032357 Scaffold attachment factor B1 Human genes 0.000 description 1
- 101710118102 Scaffold attachment factor B1 Proteins 0.000 description 1
- 102100028657 Secretoglobin family 1C member 2 Human genes 0.000 description 1
- 101710084604 Secretoglobin family 1C member 2 Proteins 0.000 description 1
- 101710153936 Secretory carrier-associated membrane protein 1 Proteins 0.000 description 1
- 102100037230 Secretory carrier-associated membrane protein 1 Human genes 0.000 description 1
- 101710153943 Secretory carrier-associated membrane protein 2 Proteins 0.000 description 1
- 102100037233 Secretory carrier-associated membrane protein 2 Human genes 0.000 description 1
- 102000004222 Sepiapterin reductase Human genes 0.000 description 1
- 108020001302 Sepiapterin reductase Proteins 0.000 description 1
- 108050005730 Septin 7 Proteins 0.000 description 1
- 102000017496 Septin 7 Human genes 0.000 description 1
- 108700036698 Septin 8 Proteins 0.000 description 1
- 102000044463 Septin 8 Human genes 0.000 description 1
- 108050002584 Septin 9 Proteins 0.000 description 1
- 102000012060 Septin 9 Human genes 0.000 description 1
- 102100034606 Serine hydroxymethyltransferase, mitochondrial Human genes 0.000 description 1
- 101710087362 Serine hydroxymethyltransferase, mitochondrial Proteins 0.000 description 1
- 102100040516 Serine-tRNA ligase, cytoplasmic Human genes 0.000 description 1
- 101710119435 Serine-tRNA ligase, cytoplasmic Proteins 0.000 description 1
- 102100030514 Serine/threonine-protein kinase 38 Human genes 0.000 description 1
- 101710184752 Serine/threonine-protein kinase 38 Proteins 0.000 description 1
- 101710178063 Serine/threonine-protein kinase A-Raf Proteins 0.000 description 1
- 102100029437 Serine/threonine-protein kinase A-Raf Human genes 0.000 description 1
- 101710183263 Serine/threonine-protein kinase B-raf Proteins 0.000 description 1
- 102100027103 Serine/threonine-protein kinase B-raf Human genes 0.000 description 1
- 102100037312 Serine/threonine-protein kinase D2 Human genes 0.000 description 1
- 101710125007 Serine/threonine-protein kinase D2 Proteins 0.000 description 1
- 102100025352 Serine/threonine-protein kinase MRCK alpha Human genes 0.000 description 1
- 101710112530 Serine/threonine-protein kinase MRCK alpha Proteins 0.000 description 1
- 102100031398 Serine/threonine-protein kinase Nek9 Human genes 0.000 description 1
- 101710092557 Serine/threonine-protein kinase Nek9 Proteins 0.000 description 1
- 102100031463 Serine/threonine-protein kinase PLK1 Human genes 0.000 description 1
- 101710183160 Serine/threonine-protein kinase PLK1 Proteins 0.000 description 1
- 102100038192 Serine/threonine-protein kinase TBK1 Human genes 0.000 description 1
- 101710106944 Serine/threonine-protein kinase TBK1 Proteins 0.000 description 1
- 102100026281 Serine/threonine-protein phosphatase 2A 56 kDa regulatory subunit delta isoform Human genes 0.000 description 1
- 101710168150 Serine/threonine-protein phosphatase 2A 56 kDa regulatory subunit delta isoform Proteins 0.000 description 1
- 102100034464 Serine/threonine-protein phosphatase 2A catalytic subunit alpha isoform Human genes 0.000 description 1
- 101710102424 Serine/threonine-protein phosphatase 2A catalytic subunit alpha isoform Proteins 0.000 description 1
- 102100022345 Serine/threonine-protein phosphatase 6 catalytic subunit Human genes 0.000 description 1
- 101710100266 Serine/threonine-protein phosphatase 6 catalytic subunit Proteins 0.000 description 1
- 101710161407 Serine/threonine-protein phosphatase 6 regulatory subunit 3 Proteins 0.000 description 1
- 102100037760 Serine/threonine-protein phosphatase 6 regulatory subunit 3 Human genes 0.000 description 1
- 102100036209 Serine/threonine-protein phosphatase CPPED1 Human genes 0.000 description 1
- 101710116967 Serine/threonine-protein phosphatase CPPED1 Proteins 0.000 description 1
- 101710096205 Serine/threonine-protein phosphatase PP1-beta catalytic subunit Proteins 0.000 description 1
- 102100037764 Serine/threonine-protein phosphatase PP1-beta catalytic subunit Human genes 0.000 description 1
- 102100025512 Serpin B6 Human genes 0.000 description 1
- 102100035712 Serrate RNA effector molecule homolog Human genes 0.000 description 1
- 101710160083 Serrate RNA effector molecule homolog Proteins 0.000 description 1
- 102100037082 Signal recognition particle 14 kDa protein Human genes 0.000 description 1
- 101710089523 Signal recognition particle 14 kDa protein Proteins 0.000 description 1
- 102100022055 Signal recognition particle 9 kDa protein Human genes 0.000 description 1
- 101710131307 Signal recognition particle 9 kDa protein Proteins 0.000 description 1
- 102100027318 Signal recognition particle subunit SRP68 Human genes 0.000 description 1
- 102100027315 Signal recognition particle subunit SRP72 Human genes 0.000 description 1
- 101710132545 Signal recognition particle subunit SRP72 Proteins 0.000 description 1
- 101710132566 Signal recognition particle subunit srp68 Proteins 0.000 description 1
- 102100038081 Signal transducer CD24 Human genes 0.000 description 1
- 102100025245 Signal transducing adapter molecule 1 Human genes 0.000 description 1
- 101710191634 Signal transducing adapter molecule 1 Proteins 0.000 description 1
- 102100021255 Small acidic protein Human genes 0.000 description 1
- 101710174775 Small acidic protein Proteins 0.000 description 1
- 206010041067 Small cell lung cancer Diseases 0.000 description 1
- 102100038707 Small nuclear ribonucleoprotein Sm D1 Human genes 0.000 description 1
- 241000723811 Soybean mosaic virus Species 0.000 description 1
- 102100031874 Spectrin alpha chain, non-erythrocytic 1 Human genes 0.000 description 1
- 101710157175 Spectrin alpha chain, non-erythrocytic 1 Proteins 0.000 description 1
- 101710109667 Spectrin beta chain Proteins 0.000 description 1
- 102100037615 Spermatogenesis-associated protein 13 Human genes 0.000 description 1
- 101710202308 Spermatogenesis-associated protein 13 Proteins 0.000 description 1
- 108010051753 Spermidine Synthase Proteins 0.000 description 1
- 102100030413 Spermidine synthase Human genes 0.000 description 1
- 102100031711 Splicing factor 3B subunit 1 Human genes 0.000 description 1
- 101710190353 Splicing factor 3B subunit 1 Proteins 0.000 description 1
- 102100038501 Splicing factor U2AF 35 kDa subunit Human genes 0.000 description 1
- 101710094463 Splicing factor U2AF 35 kDa subunit Proteins 0.000 description 1
- 102100035040 Splicing factor U2AF 65 kDa subunit Human genes 0.000 description 1
- 101710186483 Splicing factor U2AF 65 kDa subunit Proteins 0.000 description 1
- 102100027780 Splicing factor, proline- and glutamine-rich Human genes 0.000 description 1
- 101710201479 Splicing factor, proline- and glutamine-rich Proteins 0.000 description 1
- 102000005465 Stathmin Human genes 0.000 description 1
- 108050003387 Stathmin Proteins 0.000 description 1
- 102100034291 Sterile alpha motif domain-containing protein 9 Human genes 0.000 description 1
- 101710174369 Sterile alpha motif domain-containing protein 9 Proteins 0.000 description 1
- 229930182558 Sterol Natural products 0.000 description 1
- 102100021588 Sterol carrier protein 2 Human genes 0.000 description 1
- 102100022760 Stress-70 protein, mitochondrial Human genes 0.000 description 1
- 101710111177 Stress-70 protein, mitochondrial Proteins 0.000 description 1
- 102100021250 Stromal membrane-associated protein 2 Human genes 0.000 description 1
- 101710094691 Stromal membrane-associated protein 2 Proteins 0.000 description 1
- 102100021701 Switch-associated protein 70 Human genes 0.000 description 1
- 101710149524 Switch-associated protein 70 Proteins 0.000 description 1
- 102100037432 Synapse-associated protein 1 Human genes 0.000 description 1
- 101710179402 Synapse-associated protein 1 Proteins 0.000 description 1
- 102100023512 Synaptobrevin homolog YKT6 Human genes 0.000 description 1
- 101710159051 Synaptobrevin homolog ykt6 Proteins 0.000 description 1
- 102100037485 Synaptonemal complex central element protein 1-like Human genes 0.000 description 1
- 101710155224 Synaptonemal complex central element protein 1-like Proteins 0.000 description 1
- 102100021681 Syntaxin-binding protein 6 Human genes 0.000 description 1
- 101710096101 Syntaxin-binding protein 6 Proteins 0.000 description 1
- 102100034922 T-cell surface glycoprotein CD8 alpha chain Human genes 0.000 description 1
- 101710097837 T-complex protein 1 subunit alpha Proteins 0.000 description 1
- 102100038410 T-complex protein 1 subunit alpha Human genes 0.000 description 1
- 102100028679 T-complex protein 1 subunit beta Human genes 0.000 description 1
- 101710085986 T-complex protein 1 subunit beta Proteins 0.000 description 1
- 102100036476 T-complex protein 1 subunit eta Human genes 0.000 description 1
- 101710139556 T-complex protein 1 subunit eta Proteins 0.000 description 1
- 101710136137 T-complex protein 1 subunit gamma Proteins 0.000 description 1
- 102100036049 T-complex protein 1 subunit gamma Human genes 0.000 description 1
- 101710114584 T-complex protein 1 subunit theta Proteins 0.000 description 1
- 102100026311 T-complex protein 1 subunit theta Human genes 0.000 description 1
- 102100029451 TRAF-type zinc finger domain-containing protein 1 Human genes 0.000 description 1
- 101710162594 TRAF-type zinc finger domain-containing protein 1 Proteins 0.000 description 1
- 108010010057 TYK2 Kinase Proteins 0.000 description 1
- 101710115678 Target of rapamycin complex subunit LST8 Proteins 0.000 description 1
- 102100027802 Target of rapamycin complex subunit LST8 Human genes 0.000 description 1
- 102100038193 Tax1-binding protein 1 Human genes 0.000 description 1
- 101710193787 Tax1-binding protein 1 Proteins 0.000 description 1
- 101710200535 Testis-specific Y-encoded-like protein 5 Proteins 0.000 description 1
- 102100034914 Testis-specific Y-encoded-like protein 5 Human genes 0.000 description 1
- 108700031126 Tetraspanins Proteins 0.000 description 1
- 102000043977 Tetraspanins Human genes 0.000 description 1
- 102100029207 Tetratricopeptide repeat protein 38 Human genes 0.000 description 1
- 101710129245 Tetratricopeptide repeat protein 38 Proteins 0.000 description 1
- 102100032035 Thioredoxin domain-containing protein 17 Human genes 0.000 description 1
- 101710088816 Thioredoxin domain-containing protein 17 Proteins 0.000 description 1
- 102100031208 Thioredoxin reductase 1, cytoplasmic Human genes 0.000 description 1
- 101710143208 Thioredoxin reductase 1, cytoplasmic Proteins 0.000 description 1
- 102100031344 Thioredoxin-interacting protein Human genes 0.000 description 1
- 101710114149 Thioredoxin-interacting protein Proteins 0.000 description 1
- 102100031373 Thioredoxin-like protein 1 Human genes 0.000 description 1
- 101710137845 Thioredoxin-like protein 1 Proteins 0.000 description 1
- 108010022394 Threonine synthase Proteins 0.000 description 1
- 108010046722 Thrombospondin 1 Proteins 0.000 description 1
- 102100036034 Thrombospondin-1 Human genes 0.000 description 1
- 102100031372 Thymidine phosphorylase Human genes 0.000 description 1
- 102000005497 Thymidylate Synthase Human genes 0.000 description 1
- 108050005351 Tissue alpha-L-fucosidases Proteins 0.000 description 1
- 102000017340 Tissue alpha-L-fucosidases Human genes 0.000 description 1
- 102100037497 Trafficking protein particle complex subunit 5 Human genes 0.000 description 1
- 101710136513 Trafficking protein particle complex subunit 5 Proteins 0.000 description 1
- 102100022012 Transcription intermediary factor 1-beta Human genes 0.000 description 1
- 101710177718 Transcription intermediary factor 1-beta Proteins 0.000 description 1
- 108050003222 Transferrin receptor protein 1 Proteins 0.000 description 1
- 102100022387 Transforming protein RhoA Human genes 0.000 description 1
- 101710124052 Transforming protein RhoA Proteins 0.000 description 1
- 102100026145 Transitional endoplasmic reticulum ATPase Human genes 0.000 description 1
- 101710132062 Transitional endoplasmic reticulum ATPase Proteins 0.000 description 1
- 102100034266 Translation initiation factor eIF-2B subunit delta Human genes 0.000 description 1
- 101710184558 Translation initiation factor eIF-2B subunit delta Proteins 0.000 description 1
- 102100029887 Translationally-controlled tumor protein Human genes 0.000 description 1
- 101710157927 Translationally-controlled tumor protein Proteins 0.000 description 1
- 102100032834 Translin-associated protein X Human genes 0.000 description 1
- 101710198109 Translin-associated protein X Proteins 0.000 description 1
- 102100028746 Transportin-3 Human genes 0.000 description 1
- 101710120730 Transportin-3 Proteins 0.000 description 1
- 102100028101 Triple functional domain protein Human genes 0.000 description 1
- 101710161296 Triple functional domain protein Proteins 0.000 description 1
- 102100033080 Tropomyosin alpha-3 chain Human genes 0.000 description 1
- 101710091952 Tropomyosin alpha-3 chain Proteins 0.000 description 1
- 102100024944 Tropomyosin alpha-4 chain Human genes 0.000 description 1
- 101710193115 Tropomyosin alpha-4 chain Proteins 0.000 description 1
- 108060005989 Tryptase Proteins 0.000 description 1
- 102100029639 Tryptase alpha/beta-1 Human genes 0.000 description 1
- 102100031638 Tuberin Human genes 0.000 description 1
- 108050009309 Tuberin Proteins 0.000 description 1
- 102100036795 Tubulin alpha chain-like 3 Human genes 0.000 description 1
- 101710130745 Tubulin alpha chain-like 3 Proteins 0.000 description 1
- 102100024717 Tubulin beta chain Human genes 0.000 description 1
- 101710201428 Tubulin beta chain Proteins 0.000 description 1
- 102100024769 Tubulin-specific chaperone E Human genes 0.000 description 1
- 101710194696 Tubulin-specific chaperone E Proteins 0.000 description 1
- 102100036111 Tubulin-tyrosine ligase-like protein 12 Human genes 0.000 description 1
- 108050008454 Tubulin-tyrosine ligase-like protein 12 Proteins 0.000 description 1
- 102100033649 Tumor necrosis factor alpha-induced protein 8 Human genes 0.000 description 1
- 101710098767 Tumor necrosis factor alpha-induced protein 8 Proteins 0.000 description 1
- 102100039257 Type II inositol 1,4,5-trisphosphate 5-phosphatase Human genes 0.000 description 1
- 101710156238 Type II inositol 1,4,5-trisphosphate 5-phosphatase Proteins 0.000 description 1
- 102100024537 Tyrosine-protein kinase Fer Human genes 0.000 description 1
- 108050003862 Tyrosine-protein kinase Fer Proteins 0.000 description 1
- 102100033137 Tyrosine-protein phosphatase non-receptor type 23 Human genes 0.000 description 1
- 101710116210 Tyrosine-protein phosphatase non-receptor type 23 Proteins 0.000 description 1
- 102100033309 U6 snRNA-associated Sm-like protein LSm2 Human genes 0.000 description 1
- 101710173157 U6 snRNA-associated Sm-like protein LSm2 Proteins 0.000 description 1
- 102100021436 UDP-glucose 4-epimerase Human genes 0.000 description 1
- 108010075202 UDP-glucose 4-epimerase Proteins 0.000 description 1
- 102100029640 UDP-glucose 6-dehydrogenase Human genes 0.000 description 1
- 108030001662 UDP-glucose 6-dehydrogenases Proteins 0.000 description 1
- 101710091090 Ubiquitin carboxyl-terminal hydrolase 12 Proteins 0.000 description 1
- 102100024662 Ubiquitin carboxyl-terminal hydrolase 12 Human genes 0.000 description 1
- 102100029164 Ubiquitin carboxyl-terminal hydrolase 15 Human genes 0.000 description 1
- 101710091085 Ubiquitin carboxyl-terminal hydrolase 15 Proteins 0.000 description 1
- 102100025029 Ubiquitin carboxyl-terminal hydrolase 47 Human genes 0.000 description 1
- 101710093240 Ubiquitin carboxyl-terminal hydrolase 47 Proteins 0.000 description 1
- 102100040337 Ubiquitin-associated and SH3 domain-containing protein A Human genes 0.000 description 1
- 101710143701 Ubiquitin-associated and SH3 domain-containing protein A Proteins 0.000 description 1
- 102100029817 Ubiquitin-associated protein 2-like Human genes 0.000 description 1
- 101710092739 Ubiquitin-associated protein 2-like Proteins 0.000 description 1
- 102100030425 Ubiquitin-conjugating enzyme E2 D3 Human genes 0.000 description 1
- 102100020698 Ubiquitin-conjugating enzyme E2 H Human genes 0.000 description 1
- 101710192902 Ubiquitin-conjugating enzyme E2 H Proteins 0.000 description 1
- 102100037160 Ubiquitin-like modifier-activating enzyme 1 Human genes 0.000 description 1
- 101710191412 Ubiquitin-like modifier-activating enzyme 1 Proteins 0.000 description 1
- 102100036175 Uncharacterized protein CXorf38 Human genes 0.000 description 1
- 101710108516 Uncharacterized protein CXorf38 Proteins 0.000 description 1
- 102100038325 Unconventional myosin-IXb Human genes 0.000 description 1
- 101710195359 Unconventional myosin-IXb Proteins 0.000 description 1
- 102100031834 Unconventional myosin-VI Human genes 0.000 description 1
- 101710135144 Unconventional myosin-VI Proteins 0.000 description 1
- 102100037717 Uracil phosphoribosyltransferase homolog Human genes 0.000 description 1
- 101710122489 Uracil phosphoribosyltransferase homolog Proteins 0.000 description 1
- 101710147974 V-type proton ATPase catalytic subunit A Proteins 0.000 description 1
- 102100037466 V-type proton ATPase catalytic subunit A Human genes 0.000 description 1
- 102100032189 V-type proton ATPase subunit C 1 Human genes 0.000 description 1
- 102100039006 V-type proton ATPase subunit H Human genes 0.000 description 1
- 101710117874 V-type proton ATPase subunit H Proteins 0.000 description 1
- 101710192354 V-type proton ATPase subunit c1 Proteins 0.000 description 1
- 102100038398 Vacuolar protein sorting-associated protein 26A Human genes 0.000 description 1
- 101710187769 Vacuolar protein sorting-associated protein 26A Proteins 0.000 description 1
- 102100028290 Vacuolar protein sorting-associated protein 29 Human genes 0.000 description 1
- 108050006319 Vacuolar protein sorting-associated protein 29 Proteins 0.000 description 1
- 101710156726 Vacuolar protein sorting-associated protein 51 homolog Proteins 0.000 description 1
- 102100038936 Vacuolar protein sorting-associated protein 51 homolog Human genes 0.000 description 1
- 101710131386 Vesicle transport through interaction with t-SNAREs homolog 1A Proteins 0.000 description 1
- 102100023019 Vesicle transport through interaction with t-SNAREs homolog 1A Human genes 0.000 description 1
- 108090000384 Vinculin Proteins 0.000 description 1
- 102000003970 Vinculin Human genes 0.000 description 1
- 102100039414 WD repeat-containing protein 48 Human genes 0.000 description 1
- 101710093277 WD repeat-containing protein 48 Proteins 0.000 description 1
- 102100038365 Xaa-Pro aminopeptidase 1 Human genes 0.000 description 1
- 101710081951 Xaa-Pro aminopeptidase 1 Proteins 0.000 description 1
- 102100039644 YTH domain-containing family protein 2 Human genes 0.000 description 1
- 101710184749 YTH domain-containing family protein 2 Proteins 0.000 description 1
- 102100023887 Zinc finger protein 705A Human genes 0.000 description 1
- 101710089078 Zinc finger protein 705A Proteins 0.000 description 1
- 102100040804 Zymogen granule protein 16 homolog B Human genes 0.000 description 1
- 101710130275 Zymogen granule protein 16 homolog B Proteins 0.000 description 1
- SIIZPVYVXNXXQG-KGXOGWRBSA-N [(2r,3r,4r,5r)-5-(6-aminopurin-9-yl)-4-[[(3s,4r)-5-(6-aminopurin-9-yl)-3,4-dihydroxyoxolan-2-yl]methoxy-hydroxyphosphoryl]oxy-3-hydroxyoxolan-2-yl]methyl [(2r,4r,5r)-2-(6-aminopurin-9-yl)-4-hydroxy-5-(phosphonooxymethyl)oxolan-3-yl] hydrogen phosphate Polymers C1=NC2=C(N)N=CN=C2N1[C@@H]1O[C@H](COP(O)(=O)OC2[C@@H](O[C@H](COP(O)(O)=O)[C@H]2O)N2C3=NC=NC(N)=C3N=C2)[C@@H](O)[C@H]1OP(O)(=O)OCC([C@@H](O)[C@H]1O)OC1N1C(N=CN=C2N)=C2N=C1 SIIZPVYVXNXXQG-KGXOGWRBSA-N 0.000 description 1
- KYIKRXIYLAGAKQ-UHFFFAOYSA-N abcn Chemical compound C1CCCCC1(C#N)N=NC1(C#N)CCCCC1 KYIKRXIYLAGAKQ-UHFFFAOYSA-N 0.000 description 1
- 230000009471 action Effects 0.000 description 1
- 239000013543 active substance Substances 0.000 description 1
- 102000011759 adducin Human genes 0.000 description 1
- 108010076723 adducin Proteins 0.000 description 1
- 230000001800 adrenalinergic effect Effects 0.000 description 1
- 238000001261 affinity purification Methods 0.000 description 1
- 230000003321 amplification Effects 0.000 description 1
- 238000010171 animal model Methods 0.000 description 1
- 238000005349 anion exchange Methods 0.000 description 1
- 230000003302 anti-idiotype Effects 0.000 description 1
- 230000001640 apoptogenic effect Effects 0.000 description 1
- 210000003567 ascitic fluid Anatomy 0.000 description 1
- 238000003556 assay Methods 0.000 description 1
- 210000001130 astrocyte Anatomy 0.000 description 1
- 230000005784 autoimmunity Effects 0.000 description 1
- 210000002453 autonomic neuron Anatomy 0.000 description 1
- 238000003705 background correction Methods 0.000 description 1
- 210000001084 basket cell Anatomy 0.000 description 1
- 210000003651 basophil Anatomy 0.000 description 1
- 238000013476 bayesian approach Methods 0.000 description 1
- 230000003542 behavioural effect Effects 0.000 description 1
- 108010081355 beta 2-Microglobulin Proteins 0.000 description 1
- 102000015736 beta 2-Microglobulin Human genes 0.000 description 1
- 210000000941 bile Anatomy 0.000 description 1
- 108091008324 binding proteins Proteins 0.000 description 1
- 230000004071 biological effect Effects 0.000 description 1
- 230000008827 biological function Effects 0.000 description 1
- 230000009141 biological interaction Effects 0.000 description 1
- 230000031018 biological processes and functions Effects 0.000 description 1
- 208000002352 blister Diseases 0.000 description 1
- 230000000903 blocking effect Effects 0.000 description 1
- 210000000601 blood cell Anatomy 0.000 description 1
- 238000009640 blood culture Methods 0.000 description 1
- 210000001772 blood platelet Anatomy 0.000 description 1
- 239000010839 body fluid Substances 0.000 description 1
- 210000004271 bone marrow stromal cell Anatomy 0.000 description 1
- 229940053031 botulinum toxin Drugs 0.000 description 1
- 210000004556 brain Anatomy 0.000 description 1
- 210000000481 breast Anatomy 0.000 description 1
- 238000005537 brownian motion Methods 0.000 description 1
- 102100032791 cAMP-dependent protein kinase catalytic subunit alpha Human genes 0.000 description 1
- 101710110809 cAMP-dependent protein kinase catalytic subunit alpha Proteins 0.000 description 1
- 108010051348 cdc42 GTP-Binding Protein Proteins 0.000 description 1
- 230000008568 cell cell communication Effects 0.000 description 1
- 210000002583 cell-derived microparticle Anatomy 0.000 description 1
- 230000005754 cellular signaling Effects 0.000 description 1
- 108010022011 centractin Proteins 0.000 description 1
- 210000003756 cervix mucus Anatomy 0.000 description 1
- 230000002925 chemical effect Effects 0.000 description 1
- 239000003153 chemical reaction reagent Substances 0.000 description 1
- 235000012000 cholesterol Nutrition 0.000 description 1
- 150000001841 cholesterols Chemical class 0.000 description 1
- 230000001713 cholinergic effect Effects 0.000 description 1
- 210000001612 chondrocyte Anatomy 0.000 description 1
- 239000013611 chromosomal DNA Substances 0.000 description 1
- 210000001268 chyle Anatomy 0.000 description 1
- 210000004913 chyme Anatomy 0.000 description 1
- 230000000052 comparative effect Effects 0.000 description 1
- 230000000295 complement effect Effects 0.000 description 1
- 210000002808 connective tissue Anatomy 0.000 description 1
- 238000002790 cross-validation Methods 0.000 description 1
- 238000012258 culturing Methods 0.000 description 1
- 210000001151 cytotoxic T lymphocyte Anatomy 0.000 description 1
- 230000006378 damage Effects 0.000 description 1
- 238000013480 data collection Methods 0.000 description 1
- 238000000354 decomposition reaction Methods 0.000 description 1
- 230000007423 decrease Effects 0.000 description 1
- 238000000432 density-gradient centrifugation Methods 0.000 description 1
- 239000005547 deoxyribonucleotide Substances 0.000 description 1
- 125000002637 deoxyribonucleotide group Chemical group 0.000 description 1
- 230000001419 dependent effect Effects 0.000 description 1
- 108010049285 dephospho-CoA kinase Proteins 0.000 description 1
- 238000013461 design Methods 0.000 description 1
- 239000003599 detergent Substances 0.000 description 1
- 206010012601 diabetes mellitus Diseases 0.000 description 1
- 235000005911 diet Nutrition 0.000 description 1
- 230000037213 diet Effects 0.000 description 1
- 238000001085 differential centrifugation Methods 0.000 description 1
- 230000004069 differentiation Effects 0.000 description 1
- 238000009792 diffusion process Methods 0.000 description 1
- 238000007847 digital PCR Methods 0.000 description 1
- 239000000539 dimer Substances 0.000 description 1
- 208000035475 disorder Diseases 0.000 description 1
- 230000002121 endocytic effect Effects 0.000 description 1
- 210000003060 endolymph Anatomy 0.000 description 1
- 102000008110 endosulfine Human genes 0.000 description 1
- 108010074629 endosulfine Proteins 0.000 description 1
- 210000002889 endothelial cell Anatomy 0.000 description 1
- 230000003511 endothelial effect Effects 0.000 description 1
- 210000003979 eosinophil Anatomy 0.000 description 1
- 210000000981 epithelium Anatomy 0.000 description 1
- 108010032643 epsin Proteins 0.000 description 1
- 102000007336 epsin Human genes 0.000 description 1
- 210000003002 eukaryotic large ribosome subunit Anatomy 0.000 description 1
- 210000003499 exocrine gland Anatomy 0.000 description 1
- 108700002148 exportin 1 Proteins 0.000 description 1
- 239000013604 expression vector Substances 0.000 description 1
- 210000002744 extracellular matrix Anatomy 0.000 description 1
- 210000000416 exudates and transudate Anatomy 0.000 description 1
- 239000004744 fabric Substances 0.000 description 1
- 210000003608 fece Anatomy 0.000 description 1
- 230000001605 fetal effect Effects 0.000 description 1
- 210000002950 fibroblast Anatomy 0.000 description 1
- 238000001825 field-flow fractionation Methods 0.000 description 1
- 239000012530 fluid Substances 0.000 description 1
- 239000007850 fluorescent dye Substances 0.000 description 1
- 210000000232 gallbladder Anatomy 0.000 description 1
- 210000004211 gastric acid Anatomy 0.000 description 1
- 210000004051 gastric juice Anatomy 0.000 description 1
- 238000001502 gel electrophoresis Methods 0.000 description 1
- 238000005227 gel permeation chromatography Methods 0.000 description 1
- 238000007429 general method Methods 0.000 description 1
- 210000004907 gland Anatomy 0.000 description 1
- 108090001013 glia maturation factor gamma Proteins 0.000 description 1
- 102000005396 glutamine synthetase Human genes 0.000 description 1
- 108020002326 glutamine synthetase Proteins 0.000 description 1
- 102000006602 glyceraldehyde-3-phosphate dehydrogenase Human genes 0.000 description 1
- 108020004445 glyceraldehyde-3-phosphate dehydrogenase Proteins 0.000 description 1
- 150000002327 glycerophospholipids Chemical class 0.000 description 1
- 108010049611 glycogen synthase kinase 3 alpha Proteins 0.000 description 1
- 210000003652 golgi cell Anatomy 0.000 description 1
- 210000004565 granule cell Anatomy 0.000 description 1
- 239000001963 growth medium Substances 0.000 description 1
- 102000006638 guanylate kinase Human genes 0.000 description 1
- 210000002064 heart cell Anatomy 0.000 description 1
- 210000002443 helper t lymphocyte Anatomy 0.000 description 1
- 201000005787 hematologic cancer Diseases 0.000 description 1
- 208000014951 hematologic disease Diseases 0.000 description 1
- 208000024200 hematopoietic and lymphoid system neoplasm Diseases 0.000 description 1
- 208000018706 hematopoietic system disease Diseases 0.000 description 1
- 210000004024 hepatic stellate cell Anatomy 0.000 description 1
- 210000003630 histaminocyte Anatomy 0.000 description 1
- 239000005556 hormone Substances 0.000 description 1
- 229940088597 hormone Drugs 0.000 description 1
- 208000010544 human prion disease Diseases 0.000 description 1
- 210000004408 hybridoma Anatomy 0.000 description 1
- 230000009474 immediate action Effects 0.000 description 1
- 210000000987 immune system Anatomy 0.000 description 1
- 238000010348 incorporation Methods 0.000 description 1
- 238000011534 incubation Methods 0.000 description 1
- 238000007689 inspection Methods 0.000 description 1
- 102000006495 integrins Human genes 0.000 description 1
- 108010044426 integrins Proteins 0.000 description 1
- 230000000968 intestinal effect Effects 0.000 description 1
- 210000004153 islets of langerhan Anatomy 0.000 description 1
- 238000003064 k means clustering Methods 0.000 description 1
- 201000010982 kidney cancer Diseases 0.000 description 1
- 210000002384 kidney collecting duct cell Anatomy 0.000 description 1
- 239000002523 lectin Substances 0.000 description 1
- 210000001542 lens epithelial cell Anatomy 0.000 description 1
- 210000000265 leukocyte Anatomy 0.000 description 1
- 210000002332 leydig cell Anatomy 0.000 description 1
- 239000007788 liquid Substances 0.000 description 1
- 210000004185 liver Anatomy 0.000 description 1
- 210000000210 loop of henle Anatomy 0.000 description 1
- 201000005249 lung adenocarcinoma Diseases 0.000 description 1
- 210000002751 lymph Anatomy 0.000 description 1
- 210000004324 lymphatic system Anatomy 0.000 description 1
- 102100033718 m7GpppX diphosphatase Human genes 0.000 description 1
- 101710129383 m7GpppX diphosphatase Proteins 0.000 description 1
- 210000002540 macrophage Anatomy 0.000 description 1
- 210000005165 macula densa Anatomy 0.000 description 1
- 208000015486 malignant pancreatic neoplasm Diseases 0.000 description 1
- 238000007726 management method Methods 0.000 description 1
- 239000003550 marker Substances 0.000 description 1
- 238000013178 mathematical model Methods 0.000 description 1
- 238000000691 measurement method Methods 0.000 description 1
- 210000003593 megakaryocyte Anatomy 0.000 description 1
- 210000003584 mesangial cell Anatomy 0.000 description 1
- 210000002901 mesenchymal stem cell Anatomy 0.000 description 1
- 230000009401 metastasis Effects 0.000 description 1
- 102000002678 mevalonate kinase Human genes 0.000 description 1
- 230000002025 microglial effect Effects 0.000 description 1
- 210000001616 monocyte Anatomy 0.000 description 1
- 210000002161 motor neuron Anatomy 0.000 description 1
- 210000003097 mucus Anatomy 0.000 description 1
- 210000003205 muscle Anatomy 0.000 description 1
- 210000000066 myeloid cell Anatomy 0.000 description 1
- 210000004165 myocardium Anatomy 0.000 description 1
- 210000000581 natural killer T-cell Anatomy 0.000 description 1
- 238000003058 natural language processing Methods 0.000 description 1
- 210000005155 neural progenitor cell Anatomy 0.000 description 1
- 230000000626 neurodegenerative effect Effects 0.000 description 1
- 210000001719 neurosecretory cell Anatomy 0.000 description 1
- 210000000440 neutrophil Anatomy 0.000 description 1
- 208000002154 non-small cell lung carcinoma Diseases 0.000 description 1
- 238000003199 nucleic acid amplification method Methods 0.000 description 1
- 108010044762 nucleolin Proteins 0.000 description 1
- 239000002773 nucleotide Substances 0.000 description 1
- 125000003729 nucleotide group Chemical group 0.000 description 1
- 210000001517 olfactory receptor neuron Anatomy 0.000 description 1
- 210000004248 oligodendroglia Anatomy 0.000 description 1
- 238000011369 optimal treatment Methods 0.000 description 1
- 239000011368 organic material Substances 0.000 description 1
- 210000000963 osteoblast Anatomy 0.000 description 1
- 210000004409 osteocyte Anatomy 0.000 description 1
- 230000002611 ovarian Effects 0.000 description 1
- 210000002394 ovarian follicle Anatomy 0.000 description 1
- 230000002018 overexpression Effects 0.000 description 1
- 210000001711 oxyntic cell Anatomy 0.000 description 1
- 201000002528 pancreatic cancer Diseases 0.000 description 1
- 208000008443 pancreatic carcinoma Diseases 0.000 description 1
- 210000000277 pancreatic duct Anatomy 0.000 description 1
- 229940055729 papain Drugs 0.000 description 1
- 235000019834 papain Nutrition 0.000 description 1
- 210000002990 parathyroid gland Anatomy 0.000 description 1
- 244000052769 pathogen Species 0.000 description 1
- 230000001717 pathogenic effect Effects 0.000 description 1
- 230000004963 pathophysiological condition Effects 0.000 description 1
- 239000013610 patient sample Substances 0.000 description 1
- 239000008188 pellet Substances 0.000 description 1
- 229940111202 pepsin Drugs 0.000 description 1
- 230000002263 peptidergic effect Effects 0.000 description 1
- 210000004912 pericardial fluid Anatomy 0.000 description 1
- 210000003668 pericyte Anatomy 0.000 description 1
- 210000004049 perilymph Anatomy 0.000 description 1
- 210000003460 periosteum Anatomy 0.000 description 1
- 208000026435 phlegm Diseases 0.000 description 1
- 239000010452 phosphate Substances 0.000 description 1
- 150000003905 phosphatidylinositols Chemical class 0.000 description 1
- 108010044533 phospholipase A2-activating protein Proteins 0.000 description 1
- 102000030592 phosphoserine aminotransferase Human genes 0.000 description 1
- 108010088694 phosphoserine aminotransferase Proteins 0.000 description 1
- 210000000608 photoreceptor cell Anatomy 0.000 description 1
- 230000037081 physical activity Effects 0.000 description 1
- 239000013612 plasmid Substances 0.000 description 1
- 210000004910 pleural fluid Anatomy 0.000 description 1
- 210000000557 podocyte Anatomy 0.000 description 1
- 238000012805 post-processing Methods 0.000 description 1
- 239000002244 precipitate Substances 0.000 description 1
- 210000002248 primary sensory neuron Anatomy 0.000 description 1
- 238000003672 processing method Methods 0.000 description 1
- 108090000468 progesterone receptors Proteins 0.000 description 1
- 235000019419 proteases Nutrition 0.000 description 1
- 238000003498 protein array Methods 0.000 description 1
- 238000012514 protein characterization Methods 0.000 description 1
- 108060006633 protein kinase Proteins 0.000 description 1
- 210000000512 proximal kidney tubule Anatomy 0.000 description 1
- 210000004915 pus Anatomy 0.000 description 1
- 210000002763 pyramidal cell Anatomy 0.000 description 1
- 108010062302 rac1 GTP Binding Protein Proteins 0.000 description 1
- 210000003124 radial glial cell Anatomy 0.000 description 1
- 108010014186 ras Proteins Proteins 0.000 description 1
- 102000016914 ras Proteins Human genes 0.000 description 1
- 238000003753 real-time PCR Methods 0.000 description 1
- 238000010188 recombinant method Methods 0.000 description 1
- 210000003289 regulatory T cell Anatomy 0.000 description 1
- 230000009711 regulatory function Effects 0.000 description 1
- 201000010174 renal carcinoma Diseases 0.000 description 1
- 238000009877 rendering Methods 0.000 description 1
- 238000011160 research Methods 0.000 description 1
- 210000002345 respiratory system Anatomy 0.000 description 1
- 230000000717 retained effect Effects 0.000 description 1
- 210000001995 reticulocyte Anatomy 0.000 description 1
- 238000012552 review Methods 0.000 description 1
- 239000002336 ribonucleotide Substances 0.000 description 1
- 125000002652 ribonucleotide group Chemical group 0.000 description 1
- 108010092942 ribosomal protein S20 Proteins 0.000 description 1
- 108010093322 s-formylglutathione hydrolase Proteins 0.000 description 1
- 102000028528 s-formylglutathione hydrolase Human genes 0.000 description 1
- 238000005070 sampling Methods 0.000 description 1
- 210000004116 schwann cell Anatomy 0.000 description 1
- 238000012216 screening Methods 0.000 description 1
- 210000002374 sebum Anatomy 0.000 description 1
- 210000000582 semen Anatomy 0.000 description 1
- 108010017282 serpin B6 Proteins 0.000 description 1
- 210000002966 serum Anatomy 0.000 description 1
- 210000002027 skeletal muscle Anatomy 0.000 description 1
- 210000003491 skin Anatomy 0.000 description 1
- 208000000587 small cell lung carcinoma Diseases 0.000 description 1
- 229940126586 small molecule drug Drugs 0.000 description 1
- 210000002460 smooth muscle Anatomy 0.000 description 1
- 210000001057 smooth muscle myoblast Anatomy 0.000 description 1
- 210000000329 smooth muscle myocyte Anatomy 0.000 description 1
- 108010039827 snRNP Core Proteins Proteins 0.000 description 1
- 241000894007 species Species 0.000 description 1
- 150000003408 sphingolipids Chemical class 0.000 description 1
- 208000002320 spinal muscular atrophy Diseases 0.000 description 1
- 210000003802 sputum Anatomy 0.000 description 1
- 208000024794 sputum Diseases 0.000 description 1
- 238000007619 statistical method Methods 0.000 description 1
- 210000004500 stellate cell Anatomy 0.000 description 1
- 108010058363 sterol carrier proteins Proteins 0.000 description 1
- 150000003432 sterols Chemical class 0.000 description 1
- 235000003702 sterols Nutrition 0.000 description 1
- 230000004936 stimulating effect Effects 0.000 description 1
- 108010074903 sulfone oxidase Proteins 0.000 description 1
- 238000013106 supervised machine learning method Methods 0.000 description 1
- 210000004243 sweat Anatomy 0.000 description 1
- 208000024891 symptom Diseases 0.000 description 1
- 210000001138 tear Anatomy 0.000 description 1
- 210000001550 testis Anatomy 0.000 description 1
- 210000003684 theca cell Anatomy 0.000 description 1
- 229940126585 therapeutic drug Drugs 0.000 description 1
- 230000004797 therapeutic response Effects 0.000 description 1
- 210000001541 thymus gland Anatomy 0.000 description 1
- 210000001685 thyroid gland Anatomy 0.000 description 1
- 238000013518 transcription Methods 0.000 description 1
- 230000035897 transcription Effects 0.000 description 1
- 238000013519 translation Methods 0.000 description 1
- 102000035160 transmembrane proteins Human genes 0.000 description 1
- 108091005703 transmembrane proteins Proteins 0.000 description 1
- 239000013638 trimer Substances 0.000 description 1
- SZCZSKMCTGEJKI-UHFFFAOYSA-N tuberin Natural products COC1=CC=C(C=CNC=O)C=C1 SZCZSKMCTGEJKI-UHFFFAOYSA-N 0.000 description 1
- 210000005233 tubule cell Anatomy 0.000 description 1
- 210000004881 tumor cell Anatomy 0.000 description 1
- 208000029729 tumor suppressor gene on chromosome 11 Diseases 0.000 description 1
- 238000000108 ultra-filtration Methods 0.000 description 1
- 238000002604 ultrasonography Methods 0.000 description 1
- 210000003932 urinary bladder Anatomy 0.000 description 1
- 210000003462 vein Anatomy 0.000 description 1
- 238000012795 verification Methods 0.000 description 1
- 230000003612 virological effect Effects 0.000 description 1
- 210000004916 vomit Anatomy 0.000 description 1
- 230000008673 vomiting Effects 0.000 description 1
Images


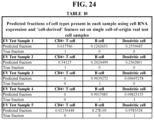


Classifications
-
- G—PHYSICS
- G16—INFORMATION AND COMMUNICATION TECHNOLOGY [ICT] SPECIALLY ADAPTED FOR SPECIFIC APPLICATION FIELDS
- G16B—BIOINFORMATICS, i.e. INFORMATION AND COMMUNICATION TECHNOLOGY [ICT] SPECIALLY ADAPTED FOR GENETIC OR PROTEIN-RELATED DATA PROCESSING IN COMPUTATIONAL MOLECULAR BIOLOGY
- G16B40/00—ICT specially adapted for biostatistics; ICT specially adapted for bioinformatics-related machine learning or data mining, e.g. knowledge discovery or pattern finding
- G16B40/10—Signal processing, e.g. from mass spectrometry [MS] or from PCR
-
- G—PHYSICS
- G06—COMPUTING; CALCULATING OR COUNTING
- G06N—COMPUTING ARRANGEMENTS BASED ON SPECIFIC COMPUTATIONAL MODELS
- G06N5/00—Computing arrangements using knowledge-based models
- G06N5/04—Inference or reasoning models
-
- G—PHYSICS
- G16—INFORMATION AND COMMUNICATION TECHNOLOGY [ICT] SPECIALLY ADAPTED FOR SPECIFIC APPLICATION FIELDS
- G16B—BIOINFORMATICS, i.e. INFORMATION AND COMMUNICATION TECHNOLOGY [ICT] SPECIALLY ADAPTED FOR GENETIC OR PROTEIN-RELATED DATA PROCESSING IN COMPUTATIONAL MOLECULAR BIOLOGY
- G16B40/00—ICT specially adapted for biostatistics; ICT specially adapted for bioinformatics-related machine learning or data mining, e.g. knowledge discovery or pattern finding
- G16B40/20—Supervised data analysis
-
- G—PHYSICS
- G16—INFORMATION AND COMMUNICATION TECHNOLOGY [ICT] SPECIALLY ADAPTED FOR SPECIFIC APPLICATION FIELDS
- G16H—HEALTHCARE INFORMATICS, i.e. INFORMATION AND COMMUNICATION TECHNOLOGY [ICT] SPECIALLY ADAPTED FOR THE HANDLING OR PROCESSING OF MEDICAL OR HEALTHCARE DATA
- G16H20/00—ICT specially adapted for therapies or health-improving plans, e.g. for handling prescriptions, for steering therapy or for monitoring patient compliance
- G16H20/10—ICT specially adapted for therapies or health-improving plans, e.g. for handling prescriptions, for steering therapy or for monitoring patient compliance relating to drugs or medications, e.g. for ensuring correct administration to patients
-
- G—PHYSICS
- G16—INFORMATION AND COMMUNICATION TECHNOLOGY [ICT] SPECIALLY ADAPTED FOR SPECIFIC APPLICATION FIELDS
- G16H—HEALTHCARE INFORMATICS, i.e. INFORMATION AND COMMUNICATION TECHNOLOGY [ICT] SPECIALLY ADAPTED FOR THE HANDLING OR PROCESSING OF MEDICAL OR HEALTHCARE DATA
- G16H50/00—ICT specially adapted for medical diagnosis, medical simulation or medical data mining; ICT specially adapted for detecting, monitoring or modelling epidemics or pandemics
- G16H50/20—ICT specially adapted for medical diagnosis, medical simulation or medical data mining; ICT specially adapted for detecting, monitoring or modelling epidemics or pandemics for computer-aided diagnosis, e.g. based on medical expert systems
-
- G—PHYSICS
- G16—INFORMATION AND COMMUNICATION TECHNOLOGY [ICT] SPECIALLY ADAPTED FOR SPECIFIC APPLICATION FIELDS
- G16H—HEALTHCARE INFORMATICS, i.e. INFORMATION AND COMMUNICATION TECHNOLOGY [ICT] SPECIALLY ADAPTED FOR THE HANDLING OR PROCESSING OF MEDICAL OR HEALTHCARE DATA
- G16H50/00—ICT specially adapted for medical diagnosis, medical simulation or medical data mining; ICT specially adapted for detecting, monitoring or modelling epidemics or pandemics
- G16H50/70—ICT specially adapted for medical diagnosis, medical simulation or medical data mining; ICT specially adapted for detecting, monitoring or modelling epidemics or pandemics for mining of medical data, e.g. analysing previous cases of other patients
-
- G—PHYSICS
- G16—INFORMATION AND COMMUNICATION TECHNOLOGY [ICT] SPECIALLY ADAPTED FOR SPECIFIC APPLICATION FIELDS
- G16B—BIOINFORMATICS, i.e. INFORMATION AND COMMUNICATION TECHNOLOGY [ICT] SPECIALLY ADAPTED FOR GENETIC OR PROTEIN-RELATED DATA PROCESSING IN COMPUTATIONAL MOLECULAR BIOLOGY
- G16B40/00—ICT specially adapted for biostatistics; ICT specially adapted for bioinformatics-related machine learning or data mining, e.g. knowledge discovery or pattern finding
- G16B40/30—Unsupervised data analysis
Definitions
- the disclosed embodiments relate generally to biofluidic systems.
- Extracellular vesicles are a class of membrane bound organelles secreted by various cell types. EVs are abundant in various biological fluids and cell culture, including but not limited to blood, urine, saliva, cerebrospinal fluid, breast milk, synovial, amniotic, and lymph fluids. EVs are also secreted by cells when cultured in vitro. In addition, EVs are stable carriers of enriched genetic material such as deoxyribonucleic acid (DNA) or ribonucleic acid (RNA), proteins and lipids and are significant mediators of intercellular communication.
- DNA deoxyribonucleic acid
- RNA ribonucleic acid
- the characteristics of EVs such as vesicle size, vesicle density, vesicle lipid bilayer composition, extravesicular proteins or genetic material attached to the vesicles, extravesicular proteins or genetic material floating in surrounding biological sample, vesicle membrane proteins, intravesicular proteins, intravesicular genetic material, biochemical alterations of extravesicular or intravesicular genetic material, or any combinations thereof, can differ by the state of each EV or a group of EVs.
- Possible states include, but are not limited to, the type of cell secreting the EVs, the disease state of the host animal or cell culture conditions from which the EVs are secreted, the type of biofluid containing the cells or EVs, or the type of organ from which the cells secreting EVs reside.
- An extracellular vesicle population is defined by EVs that share a set of common characteristics caused by, related to, correlated with or anti-correlated with a specific set of state or states.
- a single EV can be included in multiple EV population groupings.
- EV populations defined by EV characteristics, which may differ by state, can be used not only as biomarkers but as targeted therapeutic compound delivery vehicles.
- the ability to detect EVs in various animal biological fluids has been shown to correlate well with the organ or cell-of-origin of the EV and animal disease status, disease progression, immune response, and toxicity.
- EVs populations known to be correlated with a specific state have been proposed and tested as therapeutic compounds in animal models and human clinical trials to treat diseases such as cancer.
- Embodiments of the methods include inputting measured physical, biological, or chemical aspects of extracted extracellular vesicles. Next, an information architecture that characterizes relationships between biological entities and diseases in humans or other vertebrates is generated. Then, relationships between the measured physical, biological, or chemical aspects of the isolated extracellular vesicles with the information architecture are automatically inferred, thereby characterizing extracellular vesicles.
- the measured aspects of the extracellular vesicles include: vesicle size, vesicle density, vesicle lipid bilayer composition, extravesicular proteins or genetic material attached to the vesicles, extravesicular proteins or genetic material floating in surrounding biological sample, vesicle membrane proteins, intravesicular proteins, intravesicular genetic material, biochemical alterations of extravesicular or intravesicular genetic material, or any combinations thereof.
- the information architecture stores relationships and attributes of biological entities or diseases as a relational database, a non-relational database, a graph database, lists of attributes in flat files, or any combination of such databases.
- the relationships between biological entities, diseases, or attributes of the entities or diseases stored in the information architecture contain different values for different states.
- the measured aspects of the extracellular vesicles are interpreted to have potential relationships amongst themselves.
- relationships between measurement aspects of the extracellular vesicles are represented via a binary decision, thresholding, covariance, variance, distance metrics, or any combination thereof.
- Embodiments of the methods also include comparing the relationships between measurement aspects of the extracellular vesicles, values of the measured aspects between extracellular vesicles, one or more lists of key measured aspects in extracellular vesicles, or any combinations thereof, with the relationships or attributes of biological entities or diseases stored in the information architecture.
- Methods can further include providing recommendations for diagnosis of diseases, treatment of diseases, potential biochemical compounds that may act as pharmaceutical agents, EVs that can act as promising pharmaceutical agent delivery vehicles, or any other clinical conditions for human or vertebrate healthcare.
- Providing such recommendations can include quantifying a similarity measurement and determining whether the similarity measurement exceeds a predetermined threshold.
- Providing such recommendations can also include presenting the user the EV characteristics whose correlation with a specific state is concordant between different EV sources, such as in vitro cell culture models and human patient blood samples. This system in effect provides recommends on the ideal EV population for use in the diagnosis of diseases, treatment of diseases, potential biochemical compounds that may act as pharmaceutical agents, EVs that can act as promising pharmaceutical agent delivery vehicles, or any other clinical conditions for human or vertebrate healthcare.
- additional information is linked to the origin of the biological sample, such as medical history, additional measurements from the biological sample, disease status or therapies administered and is incorporated to improve the accuracy of the recommendations.
- Such systems can include a processor device, such as a computer processor that: receives an input including measured physical, biological, or chemical aspects of extracellular vesicles extracted from a biological sample; generates an information architecture that characterizes relationships between biological entities and diseases in humans or other vertebrates; and/or automatically, such as without further human interaction, infers relationships between the measured physical, biological, or chemical aspects of the extracted extracellular vesicles with the information architecture.
- a processor device such as a computer processor that: receives an input including measured physical, biological, or chemical aspects of extracellular vesicles extracted from a biological sample; generates an information architecture that characterizes relationships between biological entities and diseases in humans or other vertebrates; and/or automatically, such as without further human interaction, infers relationships between the measured physical, biological, or chemical aspects of the extracted extracellular vesicles with the information architecture.
- measured aspects of the extracellular vesicles include: vesicle size, vesicle density, vesicle lipid bilayer composition, extravesicular proteins or genetic material attached to the vesicles, extravesicular proteins or genetic material floating in surrounding biological sample, vesicle membrane proteins, intravesicular proteins, intravesicular genetic material, and biochemical alterations of any extravesicular or intravesicular genetic material, or any combinations thereof.
- the information architecture stores relationships and attributes of biological entities or diseases as a relational database, a non-relational database, a graph database, lists of attributes in flat files, or any combination of such databases. Relationships between biological entities, diseases, or attributes of the entities or diseases which are stored in the information architecture can contain different values for different states.
- the measured aspects of the extracellular vesicles are interpreted to have potential relationships amongst themselves. Relationships between measurement aspects of the extracellular vesicles can be represented via a binary decision, thresholding, covariance, variance, distance metrics, or any combination thereof.
- the embodiments include comparing the relationships between measurement aspects of the extracellular vesicles, values of the measured aspects between extracellular vesicles, one or more lists of key measured aspects in extracellular vesicles, or any combinations thereof, with the relationships or attributes of biological entities or diseases stored in the information architecture.
- the embodiments also include providing recommendations, e.g., automatically providing recommendations, for EVs that can act as targeted pharmaceutical agent delivery vehicles for specific states, for the ideal combination of EV characteristics that would result in an EV that that can act as targeted pharmaceutical agent delivery vehicles for specific states, potential biochemical compounds that may act as pharmaceutical agents, for diagnosis of diseases, treatment of diseases, or any other clinical conditions for human or vertebrate healthcare.
- Providing recommendations can include quantifying a similarity measurement and determining whether the similarity measurement exceeds a predetermined threshold. Such providing can be done entirely by the computer processor without human interaction after the initial input is made.
- Providing such recommendations can also include presenting the user the EV characteristics whose correlation with a specific state is concordant between different EV sources, such as in vitro cell culture models and human patient blood samples.
- additional information linked to the origin of the biological sample such as medical history, additional measurements from the biological sample, disease status or therapies administered, is incorporated to improve the accuracy of the recommendations.
- the methods further include methods for extracellular vesicle characterization including steps of: obtaining extracellular vesicle-characteristic data; generating an information architecture that characterizes relationships between biological entities and diseases in humans or other vertebrates; and/or automatically inferring relationships between the extracellular vesicle-characteristic data of the extracted extracellular vesicles with the information architecture and thereby characterizing the extracellular vesicles.
- Extracellular vesicle-characteristic data can include data of vesicle size, vesicle density, vesicle lipid bilayer composition, extravesicular proteins or genetic material attached to the vesicles or, extravesicular proteins or genetic material floating in the surrounding biological sample, vesicle membrane proteins, intravesicular proteins, intravesicular genetic material, or biochemical alterations of extravesicular or intravesicular genetic material, or any combinations thereof.
- Extracellular vesicles according to the subject aspects can be exosomes and/or nanosomes.
- Diseases according to the subject aspects can cancer and the extracellular vesicles can be characterized as tumor extracellular vesicles.
- the measuring includes performing DNA-seq methylation, DNA array methylation expression, DNA-seq somatic mutation expression, DNA array somatic mutation expression, DNA-seq germline mutation expression, DNA array germline mutation expression, DNA ChIp-Seq expression, RNA-seq expression, RNA microarray expression, single-cell RNA-seq expression, single-EV RNA-seq expression, fluorescence imaging and fluorescent tag quantification, nanoparticle tracking analysis (NTA) measurements, EV count measurements, EV size, flow cytometry, mass spectrometry, mass cytometry, protein western blot, enzyme-linked immunosorbent assay (ELISA), and/or single-photon emission computed tomography (SPECT), immunohistochemistry, resistive pulsing, size exclusion chromatography, zeta potential analysis, protein microarrays, or any combination thereof, to for example, thereby obtain characteristic data of the extracted extracellular vesicles.
- NTA nanoparticle tracking analysis
- EV count measurements
- measurements can be applied to a group of EVs, or done at the single vesicle level, such as single-vesicle proteomics or single-vesicle RNA-seq. They can also be applied to a group of cells or done at the single-cell level, and combined with measurements applied to a group of EVs or individual EVs, to improve recommendations of the system on what EV populations are related to certain cell populations.
- public or private data concerning cell and organ specificity is included in the information architecture to aide in automatic predictions of which EVs will specifically be engulfed or interact with certain cells or organs.
- automatically inferring includes comparing characteristic data of the extracted extracellular vesicles with previously categorized extracellular vesicle characteristic data stored in a database or databases to thereby characterize the new extracellular vesicles being inputted into the automatic prediction system to predict their utility as pharmaceutical agent delivery vehicles, pharmaceutical compounds, or biomarkers for different states.
- previously categorized extracellular vesicle characteristic data includes extracellular vesicle characteristic identifiers.
- aspects of the subject embodiments can include an extracellular vesicle isolating device for extracting extracellular vesicles from a biological sample.
- Embodiments can also include an extracellular vesicle characteristic measuring device for measuring physical, biological, or chemical aspects of extracted extracellular vesicles.
- the processing device produces an output of the automatically inferred relationships.
- FIG. 1 provides one example of a system for extracellular vesicle characterization, according to various embodiments of the present disclosure.
- FIG. 2 provides a box diagram showing an example workflow for building a deconvolution algorithm, according to various embodiments of the present disclosure.
- FIG. 3 provides an example of a method for extracellular vesicle characterization, in accordance with one or more embodiments.
- FIG. 4 provides one example of a system that can be used in conjunction with the techniques and mechanisms of the present disclosure in accordance with one or more embodiments.
- FIG. 5 provides one example of a system that can be used in conjunction with the techniques and mechanisms of the present disclosure in accordance with one or more embodiments.
- FIGS. 6 - 7 provide supporting figures for this example.
- FIG. 6 provides an illustration of microRNA deconvolution results on EV microRNA data according to the subject embodiments.
- FIG. 7 provides a schematic illustration of a clustering analysis of RNA from isolated extracellular vesicles according to the subject embodiments.
- FIG. 8 provides one example of a system that can be used in conjunction with the techniques and mechanisms of the present disclosure in accordance with one or more embodiments.
- FIGS. 8 - 12 provide supporting figures for this example according to the subject embodiments.
- FIG. 9 is a schematic of an example output (recommendation) of the implementation of the system from FIG. 8 : an automatically predicted EV therapeutic compound delivery vehicle and possible companion intravesicular therapeutic agent according to the subject embodiments.
- FIG. 10 is a clustering analysis of EV RNA expression from human blood from healthy and from lung cancer patients according to the subject embodiments.
- FIG. 11 a clustering analysis of EV RNA expression from in vitro cell culture from normal epithelial and from lung cancer cell cultures according to the subject embodiments.
- FIG. 12 is a mass spectrometry heatmap of a specific EV protein recommended by the system implementation in FIG. 8 across various cell line cultures from different organs according to the subject embodiments.
- FIG. 13 provides a schematic illustration of clustering analyses of RNA from cells and from isolated extracellular vesicles using a list of cancer cell-related genes according to the subject embodiments.
- FIG. 14 provides a schematic illustration of clustering analyses of RNA from cells and from isolated extracellular vesicles using a de novo, automatically defined list of genes recommended by the system according to the subject embodiments.
- FIG. 15 is a gene signature list consisting of mRNAs (i.e. RNAs that directly transcribe proteins) that differentially distinguish between different cell types, in this case, immune cells.
- mRNAs i.e. RNAs that directly transcribe proteins
- CD4 in this list is related to CD4+ regulatory T cells.
- FIG. 16 Table 2 is a list of microRNAs automatically predicted to regulate the mRNAs in Table 1 according to the subject embodiments. See Example 1 for details on how Tables 2-12 were automatically generated the example system architecture and algorithms presented in FIG. 5 .
- FIG. 17 Table 3 is a list of microRNA symbols found in both Table 1 and an EV microRNA expression matrix of EVs derived from known cell types according to the subject embodiments.
- FIG. 18 Table 4 is a subset of the microRNA symbols in Table 2 after automated post-processing and feature set reduction according to the subject embodiments.
- FIG. 19 Table 5 details results of microRNAs that distinguish EV populations from different cell types in an automated fashion according to the subject embodiments.
- FIG. 20 Table 6 details results from the system implementation outlined in FIG. 5 predicting EV cell-of-origin from EV characteristics using all genes originally present in the data matrix referenced in Table 3 as a feature set according to the subject embodiments.
- FIG. 21 Table 7 details the accuracy rates of automated predictions from the system implementation outlined in FIG. 5 predicting EV cell-of-origin from EV characteristics using as a gene feature set derived from cell-level characteristics according to the subject embodiments.
- FIG. 22 Table 8 details the accuracy rates of automated predictions from the system implementation outlined in FIG. 5 predicting EV cell-of-origin from EV characteristics using as a gene feature set derived from EV-level characteristics according to the subject embodiments.
- FIG. 23 Table 9 details the accuracy rates of automated predictions from the system implementation outlined in FIG. 5 predicting cell-type of cells from cell characteristics using all genes originally present in the data matrix referenced in Table 2 as a feature set according to the subject embodiments.
- FIG. 24 Table 10 details the accuracy rates of automated predictions from the system implementation outlined in FIG. 5 predicting cell type of cells from cell characteristics using as a gene feature set derived from cell-level characteristics according to the subject embodiments.
- FIG. 25 Table 11 details the accuracy rates of automated predictions from the system implementation outlined in FIG. 5 predicting cell type of cells from cell characteristics using as a gene feature set derived from EV-level characteristics according to the subject embodiments.
- FIG. 26 Table 12 details the accuracy rates of automated predictions from the system implementation outlined in FIG. 5 predicting cell type of EVs, and cells from the corresponding cell type cultures, using EV or cell characteristics and a gene feature set derived from EV-level characteristics according to the subject embodiments.
- the EV and cell characteristic measurements used to create this table are simulated mixtures of measurements from known fractional mixtures of different cell types.
- Embodiments of the methods include isolating and/or extracting extracellular vesicles from biological samples and/or measuring one or more physical, biological, or chemical aspects of the extracted extracellular vesicles.
- An information architecture can be generated that characterizes relationships between biological entities and diseases in humans or other vertebrates. Relationships between the measured physical, biological, or chemical aspects of the isolated extracellular vesicles with the information architecture can then be automatically inferred.
- first first
- second second
- first contact could be termed a second contact
- first contact could be termed a first contact
- second contact could be termed a first contact, without changing the meaning of the description, so long as all occurrences of the “first contact” are renamed consistently and all occurrences of the second contact are renamed consistently.
- the first contact and the second contact are both contacts, but they are not the same contact.
- the term “if” may be construed to mean “when” or “upon” or “in response to determining” or “in accordance with a determination” or “in response to detecting,” that a stated condition precedent is true, depending on the context.
- the phrase “if it is determined [that a stated condition precedent is true]” or “if [a stated condition precedent is true]” or “when [a stated condition precedent is true]” may be construed to mean “upon determining” or “in response to determining” or “in accordance with a determination” or “upon detecting” or “in response to detecting” that the stated condition precedent is true, depending on the context.
- Extracellular vesicles can be flexible, multi-purpose drug delivery vehicles because they are secreted and engulfed by cells.
- EVs known to be correlated with a specific state can be altered to contain therapeutic compounds not native to EVs. These EVs, once administered to an animal, can alter the biological state of the animal in a highly targeted manner because the EVs deliver the compound to cells involved in said state.
- EVs can also be re-engineered to alter their surface proteins or internal contents to mimic another EV of interest or to increase interactions with a specific cell or organ type.
- EV populations such as those found in biological fluids, can be characterized to understand which EVs may be appropriate for use as delivery vehicle compounds targeting a certain state or as targeted therapeutic compounds themselves. EV populations can also be used to diagnose a disease, prediction an optimal treatment regimen for a patient, or monitor the treatment response of a patient. Such characterization can be based on specific properties and attributes of particular EV populations.
- EV populations such as those found in biological fluids, can be characterized to understand which characteristics of EVs may be appropriate for use as delivery vehicle compounds targeting a certain biological state or as targeted therapeutic compounds themselves. These characteristics may or may not be present on a single naturally occurring EV, but these characteristics can be used to engineer an EV with these specific characteristics. Such characterization can be based on specific properties and attributes of particular EV populations.
- Extracellular vesicles are a class of membrane bound organelles secreted by various cell types.
- extracellular vesicle as provided herein is meant a cell-derived vesicle having a membrane that surrounds and encloses a central internal space.
- Membranes of EVs can be composed of a lipid bi-layer having an external surface and an internal surface bounding an enclosed volume. As described further below, such membranes can have one or more types of cargo, such as proteins, embedded therein.
- EVs include all membrane-bound vesicles that have a cross-sectional diameter smaller than the cell from which they are secreted.
- EVs can have a longest dimension, such as a longest cross-sectional dimension, such as a cross-sectional diameter ranging from 10 nm to 1000 nm, such as 20 nm to 1000 nm, such as 30 nm to 1000 nm, such as 10 to 100 nm, such as 20 to 100 nm, such as 30 to 100 nm, such as 40 to 100 nm, such as 10 to 200 nm, such as 20 to 200 nm, such as 30 to 200 nm, such as 40 to 200 nm, such as 10 to 120 nm, such as 20 to 120 nm, such as 30 to 120 nm, such as 40 to 120 nm, such as 10 to 300 nm, such as 20 to 300 nm, such as 30 to 300 nm, such as 40 to 300 nm, such as 50 to 1000 nm, such as 500 to 2000 nm, such as 100 to 500 nm, such as 500 to 1000 nm and such as 40 nm to
- membrane refers to a boundary layer separating an interior vesicle space from an exterior space, wherein the layer includes one or more biological molecules such as lipids, and in some instances, carbohydrates and/or polypeptides.
- Membranes can include lipids and/or fatty acids. Such lipids can include phospholipids, phosphatidylserine, sphingolipids, sterols, glycolipids, fatty acids, cholesterols, and/or phosphoglycerides.
- Membranes can also include one or more polypeptide and/or polysaccharide, e.g., glycan.
- EVs include (i) extravesicles: 30-150 nanometer diameter membraneous vesicles of endocytic origin (ii) ectosomes (also referred to as shedding microvesicles, SMVs): large membranous vesicles (ranging, for example, from 50 nm to 5000 nm in diameter) that are shed directly from the cellular plasma membrane and (iii) apoptotic blebs (ranging, for example, from 50 nm to 5000 nm in diameter): released by dying cells.
- extravesicles 30-150 nanometer diameter membraneous vesicles of endocytic origin
- ectosomes also referred to as shedding microvesicles, SMVs
- large membranous vesicles ranging, for example, from 50 nm to 5000 nm in diameter
- apoptotic blebs ranging, for example, from 50 nm to 5000 nm in diameter
- EVs are important for intercellular communications within the human body and involved in many pathophysiological conditions such as Cancer or neurodegenerative disease.
- EVs are abundant in various patient biological samples, e.g., biological fluids, including but not limited to blood, urine, saliva, cerebrospinal fluid, breast milk, synovial, amniotic, and lymph fluids.
- EVs include cell fragments.
- EVs are derived from, such as by being produced and released by producer donor cells.
- Producer cells are cells which act as a source for one or more EVs.
- Producer cells can share one or more component, such as a nucleic acid molecule, lipid, protein, lipid, and/or sugar component with derivative EVs.
- Producer cells can also be isolated and/or cultured cells.
- Producer cells can, in some aspects be modified or synthetic cells.
- Producer cells can be immune cells. In various instances a producer cell is a primary cell or a cell line.
- the terms “extracted,” “extracting,” “isolate,” “isolated,” “isolating,” “purify,” “purified,” and “purifying,” refer to a stage of a preparation of desired subject EVs, that have been subjected to one or more purification process, such as an enrichment and/or selection of the desired EV preparation.
- a preparation of EVs can be a plurality of unknown or known amount and/or concentration.
- purifying or isolating is the process of removing, such as partially removing or substantially removing, a portion (e.g. a fraction) of the EVs from a sample containing one or more biological components, such as producer cells.
- an EV composition that has been isolated is enriched as compared to the starting fraction, e.g., producer cell preparations), from which the EV composition is obtained.
- Such enrichment can, for example, be enrichment by 5%, 10%, 20%, 30%, 40%, 50%, 60%, 70%, 80%, 90%, 95%, 96%, 97%, 98%, 98.5%, 99%, 99.5%, 99.9%, 99.99%, 99.999%, 99.9999%, or 99.9999% or greater, as compared to the starting fraction.
- an isolated EV sample has an amount and/or concentration of desired EVs at or above an acceptable concentration and/or amount.
- isolated EV preparations are free or substantially free of residual biological products.
- isolated EV preparations are 100% free, 99.5% free, 99% free, 98.5% free, 98% free, 97% free, 96% free, or 95% free, or 90% or greater free, of any contaminating biological matter such as producer cells.
- Undesired residual biological aspects can include unwanted nucleic acids, proteins, lipids, and/or or metabolites or abiotic materials such as including chemicals.
- the phrase substantially free of residual biological products can also mean that the EV composition contains no producer cells that are detectable and that only EVs in the composition are detectable.
- An isolated EV composition in various aspects, has no undesired activity that is detectable or, the level or amount of the detected undesired activity is at or below an acceptable level.
- nucleic acid molecule refers to a double or single-stranded polymer of ribonucleotide or deoxyribonucleotide bases.
- a nucleic acid can be recombinant and peptides, e.g., exogenous polypeptides, can be expressed when the nucleic acid is introduced into a cell.
- Nucleic acids can, for example, include vectors, messenger RNA (mRNA), single stranded RNA that is complementary to an mRNA (antisense RNA), microRNA (mi RNA), tRNA, small interfering RNA (siRNA), small or short hairpin RNA (shRNA), long non-coding RNA (lncRNA), chromosomal DNA, e.g., double stranded DNA (dsDNA), and/or self-replicating plasmids.
- mRNA messenger RNA
- antisense RNA single stranded RNA that is complementary to an mRNA
- miRNA microRNA
- tRNA tRNA
- siRNA small interfering RNA
- shRNA small or short hairpin RNA
- lncRNA long non-coding RNA
- chromosomal DNA e.g., double stranded DNA (dsDNA), and/or self-replicating plasmids.
- EVs can also be derived from cells by manipulation, such as indirect or direct manipulation, e.g., by extrusion or application of alkaline solutions.
- EVs can include organelles separated into vesicles, and vesicles produced by living cells such as by fusion of a late endosome with the plasma membrane or direct plasma membrane budding.
- EVs can be derived from a dead or living organism, cultured cells, explanted tissues or organs, or any combination thereof.
- EVs include a cargo including, for example, a receiver, or a targeting moiety for binding a target.
- a “receiver,” as used herein, refers to a molecule that promotes the interaction, e.g., binding, of an EV with a target, and/or directs an EV to a target.
- a receiver can be a polypeptide and/or an antibody.
- a “target” is a cell, a pathogen, a metabolite, a polypeptide complex, or any molecule or structure that resides in a tissue or circulates in the circulatory system or lymphatic system of the subject, such as an immune cell or a cancer cell.
- a target can be any of such aspects which readily interacts with, e.g., binds, a receiver.
- EVs can also include a payload, e.g. a therapeutic agent, a sugar, e.g. a glycan, simple sugar, polysaccharide, a polynucleotide, e.g. a nucleic acid, DNA and/or RNA, other molecules, or any combination thereof.
- payload refers to an agent, e.g., a therapeutic agent, that acts on a target, such as a cell, that is contacted with and/or bound to an EV.
- payloads include amino acids such as amino acids having a detectable moiety or a toxin or that disrupt translation, polypeptides such as enzymes, nucleotides having a detectable moiety or a toxin or that disrupt transcription, nucleic acids that encode a polypeptide such as an enzyme, or RNA molecules that have regulatory function such as dsDNA, miRNA, siRNA, and lncRNA, small molecules such as small molecule toxins and drugs, lipids, and/or carbohydrates.
- amino acids such as amino acids having a detectable moiety or a toxin or that disrupt translation
- polypeptides such as enzymes, nucleotides having a detectable moiety or a toxin or that disrupt transcription
- nucleic acids that encode a polypeptide such as an enzyme
- RNA molecules that have regulatory function such as dsDNA, miRNA, siRNA, and lncRNA
- small molecules such as small molecule toxins and drugs, lipids, and/or carbohydrates.
- therapeutic molecules or “therapeutic agents,” which are also referred to as “therapeutics,” are molecules or compounds that when present in an effective amount, produce a desired therapeutic effect on a subject in need thereof. Such an effect can be physiologic and/or pharmacologic.
- Therapeutics include one or more compounds, for example, a small molecule drug, or a biologic, such as a polypeptide drug or a nucleic acid drug, that when administered to a subject has a conveyable and/or measurable effect on the subject. Such an effect can be that it treats, such as decreases or alleviates, one or more symptom of a condition, disease, or disorder.
- exosomes include exosomes.
- exosome is meant a cell-derived vesicle composed of a membrane enclosing an internal space, wherein the vesicle is generated from a cell by fusion of the late endosome with the plasma membrane or by direct plasma membrane budding, and wherein the vesicle has a longest dimension, such as a longest cross-sectional dimension, such as a cross-sectional diameter, ranging for example, from 10 nm to 150 nm, such as 20 nm to 150 nm, such as 20 nm to 130 nm, such as 20 nm to 120 nm, such as 20 to 100 nm, such as 40 to 130 nm, such as 30 to 150 nm, such as 40 to 150 nm, or from 30 nm to 200 nm, such as 30 to 100 nm, such as 30 nm to 150 nm, such as 40 nm to 120 nm, such as 40 to 150
- Exosomes can be derived from a producer cell, and/or isolated from the producer cell based on one or more exosome isolating characteristics, such as density, size, biochemical parameters, or any combination thereof. In various embodiments, exosome generation does not destroy the exosome-producing cell. Exosomes can include lipids or fatty acids and polypeptides. In various aspects, exosomes include a cargo including, for example, a receiver, e.g. a targeting moiety, a payload, e.g. a therapeutic agent, a sugar, e.g. a glycan, simple sugar, polysaccharide, a polynucleotide, e.g. a nucleic acid, DNA and/or RNA, and/or other molecules, or any combination thereof. In some embodiments, EVs such as exosomes are free of and do not include genetic material such as nucleic acids therein.
- a receiver e.g. a targeting moiety
- EVs as provided herein include nanovesicles.
- anovesicle is meant a cell-derived vesicle composed of a membrane enclosing an internal space, wherein the vesicle is generated from a cell by manipulation, e.g., indirect or direct manipulation, such that the vesicle would not be produced by the cell without the manipulation, and wherein the vesicle has a longest dimension, such as a longest cross-sectional dimension, such as a cross-sectional diameter, ranging for example, from 10 nm to 300 nm, such as such 20 nm to 300 nm, such as 20 nm to 275 nm, such as 20 nm to 250 nm, such as 20 nm to 200 nm, such as 30 nm to 175 nm, such as 30 nm to 150 nm, such as 30 nm to 120 nm, such as 30 nm to 110 nm, each range inclusive.
- Nanovesicles can be derived from a producer cell, and/or isolated from the producer cell based on one or more nanovesicle isolating characteristics, such as density, size, biochemical parameters, or any combination thereof.
- concentrations of nanovesicles are free or substantially free of EVs that are derived from producer cells by fusion of a late endosome with the plasma membrane or by budding directly from the plasma membrane.
- Nanovesicles can include lipids or fatty acids and polypeptides.
- nanovesicles include a cargo including, for example, receiver, e.g. a targeting moiety, a payload, e.g. a therapeutic agent, a sugar, e.g. a glycan, simple sugar, polysaccharide, a polynucleotide, e.g. a nucleic acid, DNA and/or RNA, and/or other molecules, or any combination thereof.
- a cargo including, for example, receiver, e.g. a targeting moiety, a payload, e.g. a therapeutic agent, a sugar, e.g. a glycan, simple sugar, polysaccharide, a polynucleotide, e.g. a nucleic acid, DNA and/or RNA, and/or other molecules, or any combination thereof.
- EVs can include one or more macromolecular aspects as cargo.
- macromolecular aspects can be incorporated in an EV for example, on the external surface of the EV, within, e.g., encapsulated by, the internal space, and/or embedded across the membrane.
- Such aspects can be transported by the EV and can include for example, one or more proteins, e.g., antibodies, carbohydrates, nucleic acids, small molecules, lipids, or any combinations thereof.
- extracellular vesicles can be stable carriers of enriched genetic material such as nucleic acids including deoxyribonucleic acid (DNA) or ribonucleic acid (RNA), proteins and lipids.
- DNA deoxyribonucleic acid
- RNA ribonucleic acid
- nucleic acids are polynucleotides that can include for example, miRNA, siRNA, mRNA, antisense RNA, lncRNA, shRNA and/or a dsDNS.
- EVs also have membrane proteins that can be markers to identify EV cell-of-origin and thus, EV subtypes. These include but are not limited to tetraspanins (e.g. CD63, CD9), adhesion molecules, integrins, T-cell stimulating molecules (such as MHC Class I and Class II), Annexins, and others.
- membrane proteins include CD24, EpCAM, CD-125, CD55, CD63, CD66c, CD66e, CD71, CD98, CD104, CD151, HLA-A,B,C, CD9, CD29, CD44, CD49c, CD49f, CD19, CD21, CD20, CD8, CD151, CD62L, Guanine nucleotide-binding protein G(k) subunit alpha, 60S ribosomal protein L7a, 60S ribosomal protein L15, Calreticulin, Thioredoxin-like protein 1, Asparagine—tRNA ligase, cytoplasmic, Activated RNA polymerase II transcriptional coactivator p15, Gamma-adducin, Coatomer subunit beta, Importin-7, Chromosome-associated kinesin KIF4A, Stress-70 protein, mitochondrial, Heat shock 70 kDa protein 4L, Thrombospondin-1, Host cell factor 1, Nucleoprotein T
- Such proteins may specifically be found in EVs derived from blood cells, epithelial cells, ovarian cancer cells, noncancer ovarian cells, renal carcinoma cells, noncancer renal cells, pancreatic cancer cells, noncancer pancreatic cells, non-small cell lung cancer cells, small cell lung cancer cells, non-cancer lung cells, triple-negative breast cancer cells, HER2-positive breast cancer cells, ER-positive breast cancer cells, non-cancer breast cells, glioblastoma cells, glial cells, astrocyte cells, neuronal cells, myeloid cells, cardiomyocyte cells, T cells, B cells, mast cells, dendritic cells, renal cells, peripolar renal cell, mesangial renal cell, macula densa renal cell, kidney parietal cell, kidney glomerulus podocyte, kidney proximal tubule brush border cell, loop of henle thin segment cell, kidney distale tubule cell, interstitial kidney cells, kidney collecting duct cell, juxtaglomerular cell, adrenal gland cells
- proteins carried within EV as cargo are: Annexin A2, ADP-ribosylation factor 4, Basigin, CD59 glycoprotein, CD81 antigen, HLA class I histocompatibility antigen, A-24 alpha chain, GTPase HRas, Heat shock 70 kDa protein 1B, Heat shock protein beta-1, Integrin beta-1, Galectin-3-binding protein, Myosin light chain 3, Myosin light polypeptide 6, Nucleoside diphosphate kinase B, GTPase NRasm Ras-related protein Rab-5C, Ras-related protein Rab-7a, Ras-related C3 botulinum toxin substrate I, Ras-related protein Ral-B, Ras-related protein Rap-1b, Transforming protein RhoA, Vesicle-trafficking protein SEC22b, Transgelin-2, Ubiquitin-conjugating enzyme E2 D3, and/or Vesicle-associated membrane protein 3.
- Annexin A2 ADP-ribosylation factor 4
- Proteins associated with EV membranes can also include antibodies and/or antigen-binding fragments, such as fragments wherein the antigen is a tumor antigen, such as a glycoprotein, peptide or glycolipid.
- EVs derived from specific cell types such as EVs from CD4+ cell lines contain specific cell-of-origin proteins, e.g., CD4+ T cell proteins, such as CD4+ and CD3+.
- antibody as provided herein includes an immunoglobulin which is partly or wholly synthetically produced or natural, and fragments thereof.
- Antibodies include proteins including a binding domain that is homologous to an immunoglobulin binding domain.
- Antibodies also include polypeptides having a framework region from an immunoglobulin gene or gene fragments thereof that specifically recognizes and binds an antigen.
- Antibodies include multi-specific antibodies and bispecific antibodies provided they exhibit the desired biological activity.
- antibody includes whole antibodies, monoclonal, polyclonal, and recombinant antibodies, and fragments thereof, as well as humanized antibodies, murine antibodies, single-chain antibodies, chimeric, mouse-human, mouse-primate, primate-human monoclonal antibodies, anti-idiotype antibodies, and antibody fragments, such as, Fab, Fab′, scFv, (scFv)2, and Fv, dAb, F(ab′)2, F(ab1)2, and Fd fragments, diabodies, and antibody-related polypeptides.
- an antigen-binding fragment refers to fragments of an immunoglobulin, e.g., an intact immunoglobulin, as well as any part of a polypeptide including antigen binding regions having the capability to specifically bind a target antigen.
- An antigen-binding fragment can be, for example, a Fab′ fragment, a Fab fragment, a scFv fragment, a F(ab′)2 fragment, or a Fv fragment.
- An antigen-binding fragment can be made using a protease, e.g., a whole antibody is digested with pepsin to obtain F(ab′)2 fragments, and with papain to obtain Fab fragments, and can be prepared using a genetic recombinant technique.
- Single-chain antibody molecules can include a polymer with a number of molecules which are individual molecules, for example, polymers such as dimers, or trimers.
- Membrane proteins can reflect the cellular environment the EV came from, for example a healthy or a tumor cell, or from a particular cell type, for example a specific breast cancer cell type. This genetic material can also hold clues to where the EV came from in the body, and how the EV may be interacting as a signaling messenger in the body.
- Extracellular vesicles are implicated in cancer progression, cancer metastasis, melanoma, breast cancer, lung cancer, ovarian cancer, kidney cancer, glioblastoma, brain cancer, development of autoinflammatory disease such as Systemic lupus erythematosus, rheumatoid arthritis, multiple sclerosis, inflammatory bowel disease, neurodegenerative diseases such as Alzheimer's disease or Parkinson's disease, prion disease, transmissible spongiform encephalopathy, Creutzfeldt-Jakob disease, synucleinopathy, Dementia, multiple system atrophy, huntington's disease, amyotrophic lateral sclerosis, leukemia, and more.
- An EV ‘population’ is herein defined as any unique combination of variables measured outside and inside EVs and values of said measurements that identifies a certain group of EVs.
- the subject embodiments include system for extracellular vesicle characterization.
- the system can include a processor device, such as a computer processor for: receiving an input including measured physical, biological, or chemical aspects of extracellular vesicles extracted from a biological sample; generating an information architecture that characterizes relationships between biological entities and diseases in humans or other vertebrates; and/or automatically, such as without further input, such as without further human interaction with the device, inferring relationships between the measured physical, biological, or chemical aspects of the extracted extracellular vesicles with the information architecture.
- a processor device such as a computer processor for: receiving an input including measured physical, biological, or chemical aspects of extracellular vesicles extracted from a biological sample; generating an information architecture that characterizes relationships between biological entities and diseases in humans or other vertebrates; and/or automatically, such as without further input, such as without further human interaction with the device, inferring relationships between the measured physical, biological, or chemical aspects of the extracted extracellular vesicles with the information architecture.
- An input including measured physical, biological, or chemical aspects of EVs can include any one or combination of measurable and/or identifying EV characteristics described herein, e.g., EV size, internal protein content, intra-membrane protein content, or any combinations thereof, etc.
- the system includes a processing device that produces an output of the automatically inferred relationships.
- the output can be a readable medium, such as an electronic digital rendering produced on a digital screen and/or a printed record, e.g., a paper readout. The readout is recognizable and interpretable by a human operator.
- Systems according to the subject embodiments can also include one or more extracellular vesicle isolation devices for extracting extracellular vesicles from a biological sample.
- Extracellular vesicle isolating devices are devices which can isolate and/or extract EVs, as described herein. Such devices include centrifuges, ultracentrifuges, microfluidics chips, immunomagnetic bead-based methods, immunoprecipitation columns, and sucrose density gradient columns.
- Various systems according to the subject embodiments include one or more extracellular vesicle characteristic measuring device for measuring physical, biological, or chemical aspects of extracted EVs. Such aspects can be any of the EV aspects described herein.
- Such devices can include a next-generation sequencer, a mass spectrometer, mass cytometer, western blot, PCR, RNA microarrays, DNA microarrays, protein arrays, a nanoparticle tracker, a flow cytometer, a fluorescent microscope, or any of the other devices described herein.
- FIG. 1 illustrates one example of a system ( 100 ) for extracellular vesicle characterization, according to various embodiments of the present disclosure.
- a sample ( 106 ) from a human ( 102 ) or an animal ( 104 ) is either directly inputted into an Extracellular Vesicle (EV) isolation device ( 110 ) or first cultured in vitro ( 108 ) and then placed into the isolation device.
- EV Extracellular Vesicle
- cell lines may be used that were originally sourced from a human or animal but have been passaged and cultured as cell lines.
- the EV isolation device produces a sample that contains population(s) of EVs with possible a mixture of surface receptors and internal genetic material ( 112 ).
- measurements are then done on the internal contents, membrane, and external contents EVs or any combination thereof.
- examples of possible measurements include EV internal, external, and transmembrane proteins, using devices and methods such as ELISA, microscopy, fluorescent microscopy, flow cytometry, mass spectrometry, mass cytometry, protein western blot, protein microarrays, immunohistochemistry, or any combination thereof ( 114 ).
- possible measurements includes genetic material inside of the EVs, using devices and methods such as DNA-seq methylation, DNA array methylation expression, DNA-seq somatic mutation expression, DNA array somatic mutation expression, DNA-seq germline mutation expression, DNA array germline mutation expression, DNA ChIp-Seq expression, RNA-seq expression, RNA microarray expression, single-cell RNA-seq expression, PCR, or any combination thereof ( 116 ).
- examples of possible measurements includes other EV characteristics like lipid bilayer composition, zeta potential, and measurements derived from methods such as size exclusion chromatography, nanoparticle tracking, and resistance pulsing, or any combination thereof.
- any combination of measurements pertaining to parts 114 , 116 and 118 in FIG. 1 are used. In some embodiments, these measurements are then fed into a computing system and architecture ( 120 ) that incorporate further data on the sample collected ( 122 ). In some embodiments, this further data includes the medical history ( 124 ) of the patient from whom the sample was collected and public reference databases such as curated experimental results and data on EV, cell, or patient measurements, tissue of-origin genetic markers, tissue-of-origin protein markers, cell-of-origin genetic markers, cell-of-origin surface, transmembrane and internal markers, chemical compound, therapeutic compound, and therapeutic compound target data ( 126 ).
- this further data includes biological characteristics of the in vitro cell culture ( 108 ) from which the EVs were derived, such as cell surface proteins, transmembrane cell proteins, internal cell proteins, internal genetic material, and how the in vitro cell culture was prepared, such as the type of culture media used and possible therapeutic compounds dosed or external stimuli applied to the cells in culture.
- biological characteristics of the in vitro cell culture ( 108 ) from which the EVs were derived such as cell surface proteins, transmembrane cell proteins, internal cell proteins, internal genetic material, and how the in vitro cell culture was prepared, such as the type of culture media used and possible therapeutic compounds dosed or external stimuli applied to the cells in culture.
- this data in parts 122 , 124 , and 126 are stored in relational (such as SQL), non-relational (such as noSQL), or graph databases with standardized schemas across all data types to enable automatic inference of EV measurements across common experimental conditions, human or animal disease conditions, biological or clinical states and conditions, or any combination thereof, using programmatic database languages such as SQL to query and compare across databases.
- this sample-specific EV and non-EV data and data is used as feature inputs to a deconvolution algorithm ( 128 ) that computationally predicts which EV populations are in the sample or samples ( 132 ), and correlates these populations with relevant clinical variables of interest present in the medical history linked to the sample ( 130 ).
- the user can decide ( 134 ) to run further EV experiments to interrogate these specific populations ( 136 ), the system may automate further EV experiments or not immediate action may be taken.
- isolation and extraction of the EVs and measurements of EV characteristics, or any combination thereof is completed in a physically different site from where the system architecture is located. Examples 1 and 3 provide details of such embodiments.
- a “biological sample” is a sample containing a quantity of organic material, e.g., one or more cells or extracellular vesicles or organic molecules, such as one or more nucleic acids e.g., DNA and/or RNA or portions thereof, that can be taken from a subject.
- a biological sample can contain whole cells and/or live cells and/or cell debris.
- the biological sample may contain (or be derived from) a “bodily fluid”.
- the bodily fluid is selected from amniotic fluid, aqueous humour, vitreous humour, bile, blood serum, breast milk, cerebrospinal fluid, cerumen (earwax), chyle, chyme, endolymph, perilymph, exudates, feces, female ejaculate, gastric acid, gastric juice, lymph, mucus (including nasal drainage and phlegm), pericardial fluid, peritoneal fluid, pleural fluid, pus, rheum, saliva, sebum (skin oil), semen, sputum, synovial fluid, sweat, tears, urine, vaginal secretion, vomit and mixtures of one or more thereof.
- Biological samples include cell cultures, bodily fluids, cell cultures from bodily fluids. Bodily fluids may be obtained from a mammal organism, for example by puncture, or other collecting or sampling procedures.
- biological samples can be collected from a subject and can include one or more cells, such as tissue cells, or extracellular vesicles, of the subject.
- tissue refers to one or more aggregates of cells in a subject (e.g., a living organism, such as a mammal, such as a human) that have a similar function and structure or to a plurality of different types of such aggregates.
- Tissue can include, for example, muscle tissue (e.g., cardiac muscle; smooth muscle; and/or skeletal muscle), organ tissue, connective tissue, nervous tissue and/or epithelial tissue.
- a biological sample can also not include one or more cells.
- a biological sample can include free DNA, free RNA, viral particles, bacteria cells or cell portions, fungi, spores, prions, or any combination thereof. Samples can also be fluid, e.g., liquid, samples.
- a subject is a “mammal” or a “mammalian” subject, where these terms are used broadly to describe organisms which are within the class mammalia.
- Mammals include, but are not limited to, murines, simians, humans, farm animals, sport animals, and pets. Tissues, cells and their progeny of a biological entity obtained in vivo or cultured in vitro are also encompassed.
- humans may include human subjects of both genders and at any stage of development (e.g., fetal, neonates, infant, juvenile, adolescent, and adult), where in various embodiments the human subject is a juvenile, adolescent or adult.
- any type of biological sample, taken directly from a subject ( 102 , 104 ) is prepared and processed through an extracellular vesicle (EV) isolation device ( 110 ).
- This device produces a concentrated solution of EVs, which contains one more different types of EV), where type may be defined by, but is not limited to, lipid bilayer membrane composition, size, composition of membrane surface proteins, deoxyribonucleic acid (DNA) measurements inside the EVs, ribonucleic acid (RNA) measurements inside the EVs, protein measurements inside the EVs, lipid measurements inside the EVs, and/or other internal or external biological features of the EVs.
- DNA deoxyribonucleic acid
- RNA ribonucleic acid
- the method provides a capturing agent that binds to an extracellular vesicle component, such as a membrane protein of the extracellular vesicle, to capture the extracellular vesicle.
- the capture agent can be a capture antibody, such as a monoclonal antibody, that binds to or has an affinity to an antigen on the extracellular vesicle.
- the capture agent includes a protein, a peptide, a divalent metal-based complex, or an antibody.
- the capture agent can be immobilized on a solid substrate.
- the solid substrate is selected from a purification column, a microfluidic channel or beads, such as magnetic beads.
- the method used for purification of the extracellular vesicles can be a microfluidic affinity based purification, a magnetic based purification, a pull-down purification or a fluorescence activated sorting-based purification.
- multiple data types are measured from the EV populations.
- One such example is measurement of the protein receptors found on the surface and inside of the EVs, using methods such as fluorescence microscopy tagging specific proteins, ELISA methods or flow cytometry or mass spectrometry to measure a larger number of proteins simultaneously.
- another data type measured may be the lipid bilayer membrane compositions of the EVs.
- Another possible measurement is the genetic material inside EVs, including RNA expression using microarrays, rna-seq or PCR, gene-protein interactions using ChIp-Seq, DNA mutations using microarrays or DNA-seq and/or DNA methylation using microarrays.
- PCR polymerase chain reaction
- RT-PCR reverse transcription polymerase chain reaction
- qPCR real-time polymerase chain reaction
- dPCR digital polymerase chain reaction
- ELISA enzyme-linked immunosorbent assay
- the computing system consists of data storage devices for the EV measurements ( 122 ), clinical sample medical history data ( 124 , 126 ) and other reference data ( 126 ).
- the information carrier into the deconvolution algorithm is a computer or-machine readable medium, such as a memory, storage device or memory processor.
- This computing system on a server, a group of servers, or a personal machine such as a laptop computer, stores these different data types and feeds these data types into the deconvolution algorithm.
- the processor or processors then run the deconvolution method to characterize the EV populations in the sample.
- the deconvolution method is a model or group of models that take as input the various data types previously mentioned and predicting which EV populations are most likely present in the original sample used to isolate EVs.
- Each EV population may be predicted using its own specific model, or unified model may jointly predict several populations.
- Example 1 is an example of the deconvolution algorithm using one possible class of machine learning methods, support vector machines, where the algorithm automatically predicted the types of cells EVs were derived from using measurements of EVs isolated and extracted from a mixture of cell types.
- Example 3 is an example of the deconvolution algorithm using statistical tests, where the algorithm automatically predicted a particular EV population, defined by its surface proteins and internal genetic material, that may target or interact with cells from a certain disease.
- the deconvolution algorithm is implemented as an automatic computational program on a computing server or servers using support vector machines, decision trees, graphical models, random forests, graphical lasso, statistical tests, deep learning models, neural networks, linear regression, logistic regression, regularized regression such as L1 or L2 regularization, linear discriminant analysis, quadratic discriminant analysis, clustering such as k-means, hierarchical clustering, matrix factorization methods such as PCA, non-negative matrix factorization, self-organizing maps, regularized PCA, regularized non-negative matrix factorization, nearest shrunken centroids, or any combination thereof.
- the deconvolution algorithm is automatically trained, meaning the weights for each model or models used in the algorithm are automatically fitted using a computational programming script on a server or servers, using reference databases ( 126 ) and previous sample experiments already analyzed by the system.
- Example 3 provides an embodiment of automatically training an algorithm using data measured from EVs from several experiments, including RNA expression of EVs isolated and extracted from human blood, RNA expression of EVs isolated and extracted from cell culture, and protein expression of EVs isolated and extracted from cell culture.
- the deconvolution algorithm is built using reference databases ( 126 ) and previous sample experiments already analyzed by the system, so that the system can be improved upon when new samples are measured or new external data is added.
- An improvement is defined as more accurately finding relationship matches or more accurately identifying certain variables of interest such as a disease state that is indeed present in a sample or a biochemical compound that if used on the sample, induces desired chemical effects.
- “built” is defined as training a statistical model with an input dataset and output or ‘truth’ variables of interest.
- different models may need to be trained on different subsets of the reference data.
- An example is a subset of the reference data pertaining to cancer that is used to create a cancer prediction model, and a subset of the reference data pertaining to a biochemical compounds effects that is used to predict whether the compound has utility as a pharmaceutical agent.
- the aforementioned reference databases contain previously defined relationships between biological entities, diseases and biochemical compounds that may be used as pharmaceutical agents.
- the deconvolution algorithm quantifies any of these relationships that may also exist in the input EV sample measurement, and compares the EV sample relationships to these reference relationships to identify potential sets of relationship matches.
- Sets of relationships can be compared using several types of models; for example, in graphical models, neural networks/deep learning methods and decision trees, each relationship may be an input variable; the values of these variables found in the EV dataset are used by the model to predict whether the EV dataset is associated with the same variables of interest as the reference data used to build the model.
- the EV set of relationships and the reference sets of relationships can be viewed as two matrices, and the distance, similarity or covariance is computed between the two matrices.
- the identified EV populations can also be correlated back to clinical variables such as tumor stage, age, predisposition to a certain cancer and diseases like diabetes or Alzheimer's disease.
- a reference database is defined as any pre-existing dataset, embodied in any form (examples include a relationship database, a spreadsheet, a text file, a visualization or a web site.) These databases may or may not be publicly available.
- protein-gene relationship databases such as the Biogrid can be used. Such databases can help identify potentially related genes and proteins from a specific gene or protein found in a specific input sample.
- Pathway databases such as pathway commons, can also identify key biological pathways a certain molecular feature may be a part of.
- Reference databases may also include pharmacological databases such as the Druggable Genome or the Cancer Cell Line Encyclopedia to identify particular genes that are linked to proteins that can easily be made into drugs, or genes that are known to interact with certain existing drugs. In some embodiments, these types of relationships can provide recommendations for treatment decision, monitoring and new drugs. There are also EV-specific databases, such as Vesiclepedia that provide relationships between certain proteins, RNAs and lipids and diseases. Reference databases may also include identification of molecular features that are correlated with environmental factors, such as toxins or physical activity.
- EVs have also been implicated in immune system function.
- incorporating databases such as ImmPort can provide information on relationships between types of immune cells, diseases and drugs.
- the EV populations being predicted by the deconvolution algorithm may be closely correlated with or represent certain immune cell lineage populations.
- sample-specific data is defined as data that are direct measurements of a specific sample or group of samples.
- a sample-specific dataset may contain the exact gene expression levels or proteins found in that sample. It may also contain any of the aforementioned clinical history variables that were not measured at the time of the biological experiment, but are known about the subject the sample was taken from.
- clinical variables from subjects, whether specifically linked back to a certain sample or not may be continuously updated after the experiment is run to incorporate data across greater than one time point into the deconvolution algorithm.
- sample data includes experimental data from public repositories such as the Gene Expression Omnibus or Array Express.
- sample data includes data collected on samples that are housed in sample repositories that was or will not be recorded in conjunction with the EV isolation and analysis process, where EV RNA expression data was automatically downloaded from a web server to a private cloud server from Gene Expression Omnibus.
- different deconvolution algorithms will be built for different groups of samples pertaining to a specific clinical or pharmacological or environmental condition or a specific subject.
- Examples 1, 2 and 3 provide examples of different algorithms pertaining to such different states: the system architecture in Example 1 used a support vector machine to predict the cell type from which EVs originated from, the system architecture in Example 3 used statistical tests to predict an EV population that can be used to deliver targeted therapeutic compounds to alter a disease of interest in a patient, and Example 2 used an unsupervised learning method, hierarchical clustering, to identify de novo populations of EVs across different cell types.
- the quantified relationships between these values will be added to the data storage system(s). This is so that this new data is interpreted as a relationship, making it more amenable to be automatically incorporated into machine learning models such as network-based community detection methods, graphical models and neural networks. This is because these types of methods either take as input pre-defined quantifications between certain measurement values, or further quantify the relationships. In this respect, the measurement values become variables in these models.
- the relevant databases will be updated and the model will be updated and improved with this new information.
- “updated” is defined by two main actions of the system: automatically adding this new sample data and any inferences made upon it into the data storage system(s), and updating the deconvolution model(s). Automatically updating any statistical or computational model(s) used by the system involves the computing system appending this new data to the existing data in the data storage devices and then re-computing the coefficient values of the variables in the model(s) using this larger combined dataset. The details of coefficient value computation are model-dependent, but this computation in general involves optimizing the coefficient fits so that the input training data highly accurately predicts the output or “truth” training labels.
- the system may encounter certain types of data measured in this new sample-specific data that was not previously incorporated into the model.
- Many models require that either this non-intersecting data type is removed before re-computing the coefficient values, or that all of the previous datasets in the data storage(s) are now also given this additional variable, but with a value code that is known to represent a missing value.
- Separate sets of model coefficients can also be computed if there is frequently a certain variable(s) that is missing but is desirable to include in the model(s) when it is non-missing in a dataset.
- all or some of these EV-related measurements are then used as variables in a (statistical/computational) deconvolution method.
- a set of criteria that are not related to the EV measurement process may also be used as variables in a computational deconvolution method. These non-EV related variables may or may not be included within the deconvolution method.
- non-EV related variables include, but are not limited to, the age of the subject (human or animal) that the biofluid sample was collected from, the hospital where the biofluid sample was collected, the time or date at which the biofluid sample was collected, the therapeutic treatment history of the subject that the biofluid was collected from, non-EV related genetic information, such as tissue DNA or RNA and/or circulating DNA or RNA in blood, of the subject that the biofluid was collected from, hereditary information of the subject that the biofluid sample was collected from, the gender of the subject that the biofluid sample was collected from, environmental information, such as air quality or weather, related to the subject that the biofluid sample was collected from, and behavioral information, such as diet or exercise, related to the subject that the biofluid sample was collected from.
- non-EV related genetic information such as tissue DNA or RNA and/or circulating DNA or RNA in blood
- the non-EV related variables that may or may not be included within the deconvolution method include, but are not limited to, cell culture parameters, such as cell type, reagents used, other chemicals administered, in vitro engineering protocol, and date and time the experiment was run.
- FIG. 2 is a box diagram showing an example workflow for building a deconvolution algorithm.
- FIG. 2 details the steps and examples of how to implement the deconvolution algorithm after all of the desired data inputs are measured and stored in a data storage device such as a relational, non relational or graph database or excel or text files on a server or personal laptop. These implementation details are intended to expand upon box 17 in FIG. 1 that represents the deconvolution algorithm.
- FIG. 2 contains predominantly dotted, as opposed to solid lines, to imply that these steps can often be used in various orders and combinations to achieve a suitable deconvolution algorithm.
- Input data may need to be post-processed or further prepared before inputting it into the deconvolution algorithm.
- missing variables may be imputed ( 204 ).
- the EV and other data-derived algorithm input variables may be used to create secondary aggregate or summary variables ( 206 ).
- these resulting variables may be pruned ( 208 ) to create a smaller, more manageable variable feature set for a statistical or computational algorithm.
- initial larger set of variables may be pruned before the main predictive statistical model ( 210 ) or EV population clustering ( 214 ) is run.
- Statistical model is defined here as not the full deconvolution algorithm with all steps in FIG. 2 , but in some embodiments of a model like linear regression, support vector machines, deep learning or graphical models, that takes as input a specific set of features and produces an output prediction or insight. The insight may also be not the prediction of a certain outcome, but relationships between different variables or entities, such as network (elaborated on in Details section).
- different users or computers may input only a subset of the total available variables. Depending on the computational models used, this may result in different model fits for each unique permutation of available variables, allowing for future improvement of the model when another biofluid is inputted that contains the same set of matching variables.
- fit pertains to the final coefficient values assigned to each variable in a model. In some embodiment, in a similar manner, when entirely new variables are discovered or measured, a new model fit will be produced.
- integrating these various reference data types lends itself to a quantification of the relationships between variables ( 212 ).
- a final statistical model ( 210 ) that predicts an outcome may or may not be employed after quantifying these relationships, as the relationships alone, such as in a biological network, may provide useful insights for what biological features and EV populations a scientist wants to explore further.
- Such relationships can be quantified using models such as clustering methods, graphical models, network community detection methods, neural networks or deep learning and random forests.
- Example 2 provides an example of clustering to identify relationships between different EV populations from different cell types.
- data will be used to train (fit or build) a predictive model, such as linear or logistic regression or random forests.
- a predictive model such as linear or logistic regression or random forests.
- Binary relationships can be interpreted as binary variables and continuous relationships can be interpreted as continuous variables in these models.
- no reference databases will be used and only new sample experiments will be used to build the algorithm. In some embodiments, only reference databases may be used to build the algorithm, or a mix of reference databases and new sample experiments will be used.
- different modeling methods to integrate this reference and/or sample data may be used for different end purposes, such as predicting a certain cancer versus predicting a potential new drug.
- given the deconvolution step may be composed of several individual models that predict different labels, the user may interpret each label individually, the system may return only selected labels for further inspection based upon defined threshold(s) or metrics, or ensemble model(s) may be used.
- a machine learning ensemble method such as a Bayes optimal classifier, which provides a final “vote” on which of the closely related labels is indeed the most probable label.
- Example 1 provides an example of an embodiment where the optimal EV population is automatically predicted using a machine learning algorithm; in this case, the EV population is the cell type the EVs were derived from.
- EV populations are defined by directly clustering the data measurements as described in the previous section.
- Example 2 is such an example.
- Data in the reference databases can then also be clustered, and the similarity of clusters between the reference and EV sample measurements can be quantified.
- One such method is Coincide, a method that computes the similarity between clusters from different datasets and then uses these similarities as edges in a network.
- the network is then divided in subgroups called communities using community detection algorithms such as the Girvan-Newman algorithm to determine whether clusters from the different datasets fall into the same community.
- relationships between measurement values in the EV sample data and relationships between values in the reference database are more directly treated as edges in networks, and thus the networks are compared to quantify their similarity.
- the reference database may contain relationships and attributes or values of these relationships that are specific to a certain variable of interest, such as disease state or drug, and then multiple networks may be created from the reference database and compared to the EV sample data relationships.
- these networks of relationships can be represented as adjacency matrices, where the rows and columns are node IDs, and values inside the matrix are the edge weights or status.
- the matrix does not need to be symmetric to allow for the optional directionality of the edges (i.e. a certain process only goes from node A to node B, and not vice versa).
- the similarity or dissimilarity of the adjacency matrix for the EV sample data relationships and the adjacency matrix for all or a subset of the reference database matrices can be computing using matrix similarity methods such as covariance, Spearman's or Kendall's rank correlation or matrix distance methods such as Euclidean or Manhattan distances.
- the reference relationships are used to fit a graphical model, neural network, deep learning model, decision tree or random forest, and then the reference data is compared to the EV sample data by inputting the EV sample data into the model as a test dataset that is used to predict whether the test dataset has or is related to the outcome or truth variable(s) of interest used to fit the model.
- Graphical models, neural networks, deep learning models, decision trees or random forests can all be interpreted as quantifying relationships between variables, but in the case of neural networks and deep learning models, the actual nodes and edges that exist in the final model are determined in part during the model fitting process and may be a combination or a subset of the original input data types (variables) used.
- Graphical models, decision trees and random forests would contain a subset of the variables only if techniques such as regularization or thresholding were specifically added to reduce the number of final coefficient variables used in the model.
- identified populations and/or data types will also be correlated with variables of interest, such as disease state or therapeutic response.
- variables of interest will be directly prediction through supervised models that are trained on datasets that include known values of these variables of interest.
- Example predictive algorithms include linear and logistic regression and singular value decomposition.
- fitting techniques include gradient descent and maximum likelihood estimation. These techniques estimate the most likely or probably magnitude the coefficients for each variable in the model based upon the training data, or input dataset.
- incorporating at least one sample dataset that contains the final variable of interest measured i.e. a truth label
- the truth label is a set of specific surface receptor proteins used to only isolate EVs with these specific receptors. The same set of samples are measured in two different ways: once selecting only EVs with some combination of these receptors, and once without this selection. Running the second, non-receptor-specific sample data through the deconvolution algorithm will produce a prediction of the EV receptors that exist in this set of broader sample measurements. A useful and accurate deconvolution algorithm will at a minimum identify that the broader sample measurements contained the specific receptors found in the first set of sample measurements.
- truth labels can be derived not through more selective EV population isolation approaches but through proxies.
- these proxies may include known protein or genetic features that are highly correlated with a disease or a certain organ, thus suggesting where the EV originated from in the body.
- Example 1 provides an example of where the truth labels are the types of cells the EVs were derived from.
- Tables 6-12 report prediction accuracies on these truth labels using various model fits of the computational system, generated by fitting models using different input feature sets. The predicted fraction of each possible cell type and the true fraction of each cell type are reported side by side.
- a used to identify EV populations through proxies may not need to be mathematically optimized to obtain variable fits, but rather be embodied instead as a binary decision tree. When certain proteins or levels of genetic measurements are present, the decision tree then identifies the relevant prediction variables of interest as highly probable.
- experimental data such as the type of isolation method, time of day and laboratory equipment used is incorporated into the deconvolution algorithm as model variables to provide feedback on what specific experimental conditions result in more accurate EV population and outcome variable of interest prediction.
- a recommendation is defined broadly as an automatically predicted outcome or insight that is useful to the end user of the system, usually a scientist, clinician, patient, or automated lab system.
- the recommendation may be made via a computer display text message, a visualization, an audio recording, a text file output or data output written to a data storage system, or an automated message relayed to a second computing system.
- a recommendation that certain EV subpopulations exist in the sample(s) of interest may cause a user to decide to run further specific experiments that bias the EV isolation techniques to attempt to capture only these subpopulations for more precise, focused analyses to understand better how these subpopulations function and are implicated in scientific or clinical variables of interest.
- the method of the present disclosure may further include a step of separating one or more populations or subpopulations of extracellular vesicles from a purified pool of extracellular vesicles.
- a sub-population of extracellular vesicles from a mixed extracellular vesicle population found for example in a biological sample obtained from a body fluid or cell culture, can be further purified or isolated, for example according to one or more specific cell types or cell subtypes.
- extracellular vesicles may be concentrated or isolated from a biological sample using size exclusion chromatography, density gradient centrifugation, differential centrifugation, nano-membrane ultrafiltration, tangential flow filtration, cross-flow filtration, immunoaffinity capture, affinity purification, microfluidic separation, gel permeation columns, anion exchange, gel permeation chromatography, sucrose density gradients, organelle electrophoresis, colloidal separation by acoustic waveforms, magnetic activated cell sorting (MACS), or any combination thereof.
- size exclusion chromatography density gradient centrifugation, differential centrifugation, nano-membrane ultrafiltration, tangential flow filtration, cross-flow filtration, immunoaffinity capture, affinity purification, microfluidic separation, gel permeation columns, anion exchange, gel permeation chromatography, sucrose density gradients, organelle electrophoresis, colloidal separation by acoustic waveforms, magnetic activated cell sorting (MACS), or any combination thereof.
- the method provides a capturing agent that binds to an extracellular vesicle component, such as a membrane protein of the extracellular vesicle, to capture the extracellular vesicle.
- the capture agent can be a capture antibody, such as a monoclonal antibody, that binds to or has an affinity to an antigen on the extracellular vesicle.
- the capture agent includes a protein, a peptide, a divalent metal-based complex, or an antibody.
- the capture agent can be immobilized on a solid substrate.
- the solid substrate is selected from a purification column, a microfluidic channel or beads, such as magnetic beads.
- the method used for purification of the extracellular vesicles can be a microfluidic affinity based purification, a magnetic based purification, a pull-down purification or a fluorescence activated sorting-based purification.
- purification or concentration of extracellular vesicles may be achieved by removing other abundant proteins in the biological sample that may hinder isolation of the EV.
- a system that utilizes antibodies specific to abundant proteins found in blood such as albumin, immunoglobulin, glycopeptide, cytoplasmic epitopes, or anti-cytoplasmic epitopes, or lipoproteins, can be used to remove several proteins at once, thus revealing lower abundance species such as extracellular vesicles.
- purification or concentration of extracellular vesicles from a biological sample may be achieved by utilizing lipid-specific proteins, such as Annexin A5 or Lactadherin, to act as capture agents targeting the lipid membranes of extracellular vesicles.
- lipid-specific proteins such as Annexin A5 or Lactadherin
- the method could utilize one or more lipid-specific proteins simultaneously and in conjunction with any of the aforementioned methods.
- lipid-specific proteins or lipids with affinity to the lipid membrane of extracellular vesicles could be linked to a solid substrate.
- purification or concentration of extracellular vesicles from a biological sample may be achieved by utilizing capture agents such as antibodies with affinity to phosphatidylinositol lipids or phospholipids on the membrane of the extracellular vesicles.
- capture agents such as antibodies with affinity to phosphatidylinositol lipids or phospholipids on the membrane of the extracellular vesicles.
- antibodies for phosphatidylinositol (4,5)-bisphosphate (PIP2) or phosphatidylinositol (3,4,5)-trisphosphate (PIP3) may be utilized to capture the extracellular vesicles.
- the method could utilize one or more capture agents with affinity to phosphatidylinositol lipids or phospholipids and in conjunction with any of the aforementioned methods.
- purification or concentration of extracellular vesicles from a biological sample may be achieved by utilizing capture agents with affinity to glycans such as antiglycan antibodies and lectins.
- capture agents with affinity to glycans such as antiglycan antibodies and lectins.
- the method could utilize one or more capture agents with affinity to glycans and in conjunction with any of the aforementioned methods.
- purification or concentration of extracellular vesicles from a biological sample may be achieved by electrophoretic or electrokinetic separation techniques.
- he extracellular vesicles can be isolated using an electrophoretic separation method for separating charged substances or separation based on electrokinetic potential such as zeta potential of the extracellular vesicles.
- the system may use a known free-flow electrophoretic separation method and apparatus for separating charged substances such as protein, cells, or extracellular vesicles by electrophoresis.
- this method includes supplying a mixed solution containing the charged substances such as EVs to be separated, which are dissolved in a separation buffer, into a separation chamber, circulating the mixed solution inside the separation chamber, applying a direct current voltage to the mixed solution to cause the electrophoresis of the charged substances and to separate them, and withdrawing the charged substances thus separated from outlets disposed at one and the other end of the separation chamber.
- purification or concentration of extracellular vesicles from a biological sample is achieved by iso-dielectric separation techniques.
- purification or concentration of extracellular vesicles from a biological sample is achieved by a field-flow fractionation (FFF) technique.
- FFF field-flow fractionation
- the technique where extracellular vesicles can be separated by their position in a laminar velocity gradient.
- a cross-flow perpendicular to the down-channel flow drives particles toward a particular membrane. Diffusion causes particles to migrate away from the membrane, opposing the cross-flow. Because smaller particles have greater Brownian motion, they migrate farther on average into the bulk flow, which velocity increases parabolically with distance from the membrane. Therefore, smaller particles travel down-channel faster on average than large particles, eluting from the channel at times which correspond to size, with peaks that can be detected and collected as fractions.
- the separation of extracellular vesicles using this technique can be performed without any biological capture agents, such as antibodies. While this technique is capable of independent size-based separations, it may also be coupled to affinity methods for increased specificity.
- Isolation or enrichment of extravesicles from biological samples can also be enhanced by use of sonication (for example, by applying ultrasound), or the use of detergents, other membrane-active agents, or any combination thereof.
- one or more purification steps may involve precipitation-based methods whereby a polymer-containing solution is added to the sample and following a short incubation step, EVs precipitate and form a concentrated pellet.
- examples of imputation methods include K-Nearest-Neighbor computation or matrix completion methods such as spectral regularization or the graphical lasso (L1 regularization).
- the aforementioned imputation methods take as input a data matrix that contains some non-missing and some missing indices, and estimates values for the missing indices by summarizing trends observed in the non-missing indices.
- Various embodiments may use statistical or computational methods that allow for missing variables, such as random forests, and then separate model fits are not needed. “Fit” here pertains to the final coefficient values assigned to each variable in a model.
- initial input data features from 202 or 204 may be summarized using dimensionality reduction techniques such as principal components analysis, which summarizes the variance of N input variables into a reduced set of K variables, where the user selects K.
- another secondary feature set may be clusters, or subgroups, within the broader set of objects measured. Clustering methods, as opposed to predictive methods, identify structural differences between different objects in a dataset, and group objects by these differences.
- objects being clustered may be samples, a mixture of measurements from the various data types inputted, or secondary forms of the data types such as nodes in a network or aggregate summary variables.
- feature sets are often pruned ( 208 ) both for interpretability, to focus on the most important variables, and also to avoid issues that arise when variables are highly correlated. Highly correlated input variables into models such as linear regression can result in incorrect and unstable models.
- Much of the work in defining and accurate and useful algorithm is in preparing the final feature set to be used in the actual statistical or computational model that leads to insights and predictions.
- Example 1 provides an example with several automated feature pruning steps; first, only microRNAs related to an mRNA immune cell signature are retained by the computing system; then, microRNAs from this list are automatically filtered down to only microRNAs that are present in the EV dataset of interest and that also pass a variance threshold to improve the automatic differentiation of EVs between different cell types. Table 5 details the list of microRNAs that passed the automatic statistical filter.
- variable pruning methods include filtering out variables using thresholds, such as removing variables that have low variance across all data points, as they are less likely to provide distinguishing, predictive characteristics.
- Other approaches include re-running the statistical model several times, changing the number of variables and/or mixture of variables used, and evaluating the fit of the model using a criterion.
- a criterion may be Bayesian-based criterion such as the Bayes Information Criterion or Akaike Information Criterion, which evaluate the tradeoffs of complexity and predictive power of a closed-form statistical model.
- Traditional approaches specific to regression include forward and backward selection, where variables are sequentially added or removed using such aforementioned criterions.
- Non-bayesian approaches that can be used to prune down a variable input set include cross-validation, where a small set of the samples are not used to train each of these different variable-model fits. These samples, called the “hold-out” test set, are then used to quantify how well each of the model fits predicted an outcome. The group of variables that best predicted the outcome(s) of interest are kept as the best feature set.
- Variable pruning can also be implemented during the model fitting process itself for many models via regularization. In regularization, an L1 or L2 penalty (an additional variable constant) is added to the original mathematical model equation. These penalties tend to either “drop” (set the coefficient to zero) or “dampen” (set the coefficient close to zero) variables during the fitting process.
- the relationships in 212 can be quantified using network-based methods.
- a network is broadly defined as nodes and edges, where potentially related nodes have edges connecting them.
- An edge can be represented as simply a continuous weight or a binary status.
- a node can be any feature or group of features, such as a protein or a gene-protein complex or a particular patient sample.
- new nodes and edges can be added and existing nodes and edges can be updated to reflect the new findings from the sample.
- edges and nodes are defined via an adjacency matrix.
- integrating these various data types lends itself to a deep learning or graphical model method, where nodes and their relationships may be defined and learned by optimization of the statistical model, as opposed to being defined solely by existing reference databases.
- a decision tree or random forest can also be fit, where each branch of the tree is a relationship.
- these various data types will be clustered to identify relevant subgroups.
- exemplary clustering methods are k-means clustering, hierarchical clustering and spectral clustering. Examples 2 and 4 provide examples of how hierarchical clustering can be used to infer relationships between EVs by computing which EVs have the most similar RNA expression levels, defined by the shortest Euclidean distance averaged across all genes used to cluster the EVs.
- one or several clustering algorithms are run greater than one time on a resampled data matrix, with or without replacement. The summary of all of these clustering results are aggregated for more robust final clusters; an example of one such method is consensus clustering.
- clustering methods require the user to select the number of clusters ahead of time using a separate preliminary method; methods to select the number of clusters include the Proportion of Ambiguous Clusters (PAC) score, the Gap statistic and the Silhouette statistic.
- PAC Proportion of Ambiguous Clusters
- networks can also be clustered using any clustering method that clusters a matrix. Exemplary clustering methods are described in the previous section; 216 in FIG. 2 shows an embodiment of a hierarchical clustering algorithm that produces a dendrogram visualization to show the groupings of the EV populations.
- the adjacency method will be pruned to identify only node-node relationships with consistent, existing or highly weighted edges.
- an example pruning method is regularization; one such specification regularization implementation is the graphical lasso, which uses L1 regularization to prune edges in a large sparse matrix.
- a sparse matrix is a large matrix that contains mostly zero values; sparse matrices can occur in biological data due to a lack of comprehensive data measurements or simply highly specific biological interactions that do not involve most of the other molecular features like proteins, genes or lipids included in the dataset or network.
- edges and relationships between EV measurements and additional variables can also be defined by the final predictive statistical model itself. This is the case for graphical models, neural networks, deep learning methods and random forests.
- the system just uses one data type. In some embodiments, the system adds on a new data type not previously mentioned. In some embodiments, the system stores the data sets in a specific storage system or data schema/format. In some embodiments, the system combines the datasets to understand how the internal genetic material, which can sequence “deeper” than proteins and lipids on a first pass, helps to inform what might be happening on the surface of EVs and what they are interacting with. In some embodiments, the system focuses on one specific EV isolation method or using two specific EV isolation methods to get a better understanding of the EV populations in a sample. In some embodiments, the system emphasizes clustering EV data first, then running a supervised prediction algorithm.
- the system uses a single statistical model in the deconvolution model versus a system of models. In some embodiments, the system uses models “vote” (boosting) or resampling and re-running models for robustness (bagging). In some embodiments, the system targets very specific receptors. In some embodiments, the system focuses on different types of diseases.
- the system conducts an unbiased deconvolution of the mixture of these numerous data types, along with provide relevant recommendations to scientists about which EV populations exist in a sample and what clinical and experimental variables of interest they are correlated with.
- the system accelerates discoveries for highly accurate, targeted screening diagnostic assays, treatment monitoring and drug target discovery within the context of extravesicles.
- a small sample of biofluid around 250 microliters
- extravesicles have also been implicated in numerous cancers and neurodegenerative diseases.
- this system will enable researchers to quickly identify new approaches for the treatment of diseases using EVs.
- This system provides an unbiased discovery mechanism for both identifying key EV populations and linking them to diseases for potential therapeutic delivery, therapeutic compound discovery, and diagnostic purposes.
- FIG. 3 illustrates a flow chart of an example method 300 for extracellular vesicle characterization, in accordance with one or more embodiments.
- Method 300 begins with isolating and extracting 302 extracellular vesicles from biological fluids.
- the method includes measuring physical, biological, or chemical aspects of the extracted extracellular vesicles.
- the method includes generating an information architecture that characterizes relationships between biological entities and diseases in humans or other vertebrates.
- the method includes automatically inferring relationships between the measured physical, biological, or chemical aspects of the extracted extracellular vesicles with the information architecture. Such automatic inferring can be conducted by a computer processor.
- Such inferring can also be performed to characterize or identify the subject, e.g., isolated, EVs as being of a particular size, content, metabolic stage etc., as compared with other EVs or biological content, and/or as being EVs associated with a particular disease condition such as cancer.
- automatically inferring relationships such as inferring relationships automatically with a processor, can include inferring relationships between extracellular vesicle-characteristic data, e.g., measured physical, biological, or chemical aspects, of the extracted extracellular vesicles.
- Examples 2 and 4 provide examples of automatic inference of relationships between EVs based on measured characteristics.
- the similarity between EVs is automatically inferred using unsupervised learning, specifically hierarchical clustering.
- automatic inference can also include inferring or identifying relationships between the extracellular vesicle-characteristic data, e.g., measured physical, biological, or chemical aspects, and a known value or values associated with a particular EV-identifying characteristic, such as size, membrane content, intra-vesicular concentration or content, etc., which is indicative of a property of the EV, such as a type, metabolic stage, or a disease condition, e.g., cancer.
- Example 1 provides an example where automatic processing of gene feature lists using statistics metrics and supervised machine learning methods, specifically support vector machines, are combined in a single system to automatically infer the cell-type from which EV samples were derived.
- Example 3 provides an example where statistical metrics such as automated differential expression tests between EVs from different patient disease states, and automated computational on intersecting feature lists between in vitro cell culture and human blood models, enable automatic inference of a specific EV population that may be produced by or target cancer cells.
- the EV characteristics automatically inferred to define the population in this example were EV surface proteins and internal EV genetic material.
- Such known values can be stored in a database as part of or accessible by the information architecture.
- the cell type labels were stored in a SQL relational database and the RNA expression matrix of the EV samples were stored in a NoSQL database hosted on cloud servers.
- the cell type labels, along with the dataset ID and specific sample ID, were stored in a relational database so that the sample ID could be used as a unique key.
- RNA expression related to specific cells or disease types.
- patient clinical characteristics linked to the blood samples such as cancer status, age and gender, were stored in a SQL relational database, and the RNA expression and protein mass spectrometry data were stored in a NoSQL database.
- the datasets in Examples 1 and 3 were first automatically downloaded and processed on a cloud server, data schemas were designed to hold the relational and non-relational data, and then the data was automatically uploaded to the appropriate database. After automatic inference, model fits and predicted results from both Examples 1 and 3 were stored in NoSQL databases to improve future automatic inferences predicting similar cell types or disease states.
- the subject architecture can compare measured values with known and/or previously measured values which have already been specifically associated with a particular EV characteristic, such as a characteristic of a disease condition, to determine whether the measured values are the same or different with the known and/or previously measured values. If the values are the same, then the particular EV characteristic, e.g., characteristic of a disease condition, associated with the known and/or previously measured values is then automatically identified as also being associated with the EVs upon which the subject measurements were conducted.
- a particular EV characteristic e.g., characteristic of a disease condition
- automatically inferring includes comparing characteristic data of extracted EVs with previously categorized EV characteristic data stored in a database to thereby characterize the extracted EVs.
- the previously categorized EV characteristic data is “known,” as described above, and includes EV characteristic identifiers.
- identifiers can be a particular EV-identifying characteristic, such as size, membrane content, intra-vesicular concentration or content, etc., which is indicative of a property of the EV, such as a type, metabolic stage, or a disease condition, e.g., cancer.
- the methods include obtaining EV-characteristic data, which is data of physical, physical, biological, or chemical aspects of EVs.
- data can include any type of EV information referenced herein and can be accessed from a database, such as a public database of the same.
- data can include information on EV size and/or cargo, e.g., membrane and/or intra-vesicular content or molecules otherwise bound to EVs.
- Obtaining such data can include conducting measurements of one or more physical, biological, or chemical aspects of EV's. Such aspects can be EV-identifying aspects which can be compared with one another and/or known values and thereby used to identity a specific EV type or class, such as cancer cell EVs. EV-identifying aspects can be any aspects which separate one EV type or class from another. For example, an EV-identifying aspect can be an aspect which separates cancer EVs, such as a specific type of cancer cell EVs from other EVs or biological entities in a sample. Obtaining such data can include detecting the presence or absence of a particular EV cargo type or a molecule bound to an EV.
- measuring physical, biological, or chemical aspects of EVs can include measuring EV size and/or characteristics of EV cargo, e.g., membrane and/or intra-vesicular content or molecules otherwise bound to EVs.
- the measured aspects of the extracellular vesicles include: vesicle size, vesicle density, vesicle lipid bilayer composition, extravesicular proteins and extravesicular genetic material attached to the vesicles or floating in the surrounding biological fluid, vesicle membrane proteins, intravesicular proteins, intravesicular genetic material, and/or biochemical alterations of any extravesicular or intravesicular genetic material, or any combination thereof.
- Conducting such measurements can include detecting the presence or absence of a particular EV cargo type or a molecule bound to an EV.
- Characteristics measured can include concentration, presence, absence, or identity.
- measured aspects can be concentration, presence, absence, or identity of intra-vesicular content, such as proteins, nucleic acids, e.g., DNA, RNA, or other molecules.
- Measured aspects can also be concentration, presence, absence, or identity of a particular type of molecule, e.g., a protein, in the EV membrane.
- Measurements can be conducted using the following detection methods DNA-seq methylation, DNA array methylation expression, DNA-seq somatic mutation expression, DNA array somatic mutation expression, DNA-seq germline mutation expression, DNA array germline mutation expression, DNA ChIp-Seq expression, RNA-seq expression, RNA microarray expression, single-cell RNA-seq expression, single-EV RNA-seq expression, fluorescence imaging and fluorescent label quantification, nanoparticle tracking analysis (NTA) measurements, EV count measurements, EV size, flow cytometry, mass spectrometry, mass cytometry, protein western blot, enzyme-linked immunosorbent assay (ELISA), and/or single-photon emission computed tomography (SPECT), immunohistochemistry, any resistive pulsing, size exclusion chromatography, zeta potential analysis, protein microarrays, or any combination thereof
- Such measurements can be conducted with an EV-characteristic measuring device.
- a device can include one or more of: a nucleic acid sequencer, a PCR or digital PCR machine, a western blot system, a western blot gel imager, a flow cytometer, a mass spectrometer, a mass cytometer, a nanoparticle tracking analyzer, a zeta potential measurement tool, a fluorescent microscope, a next-generation sequencer, a DNA microarray, or RNA microarray.
- the information architecture stores relationships and attributes of biological entities or diseases as a relational database, a non-relational database, a graph database, lists of attributes in flat files, or any combination of such databases.
- the relationships between biological entities, diseases, and/or their attributes stored in the information architecture may contain different values for different states.
- the measured aspects of the extracellular vesicles are interpreted to have potential relationships amongst themselves.
- relationships between measurement aspects of the extracellular vesicles are represented via a binary decision, thresholding, covariance, variance, distance metrics, or any combination thereof.
- the method further includes comparing the relationships between measurement aspects of the extracellular vesicles, values of the measured aspects between extracellular vesicles, and/or list(s) of key measured aspects in extracellular vesicles, with the relationships and/or attributes of biological entities or diseases stored in the information architecture.
- the method further includes providing recommendations for diagnosis of diseases, treatment of diseases, potential biochemical compounds that may act as pharmaceutical agents, or any other clinical conditions for human or vertebrate healthcare.
- providing recommendations includes quantifying a similarity measurement and determining whether the similarity measurement exceeds a predetermined threshold.
- additional information linked to the origin of the biological fluids such as medical history, additional measurements from biological fluids or tissue samples, disease status or therapies administered, is incorporated to improve the accuracy of the recommendations.
- FIG. 4 illustrates one example of a system 400 , in accordance with one or more embodiments.
- a system 400 suitable for implementing particular embodiments of the present disclosure, includes a processor 401 , a memory 403 , an interface 411 , and a bus 415 (e.g., a PCI bus or other interconnection fabric) and can operate as a network server.
- the processor 401 when acting under the control of appropriate software or firmware, the processor 401 is responsible for various processes, including processing inputs through algorithms described in the present disclosure.
- Various specially configured devices can also be used in place of a processor 401 or in addition to processor 401 .
- the interface 411 is typically configured to send and receive data packets or data segments over a network.
- system 400 further includes inference module 407 configured for extracting and determining a correlation between measured aspects of extracellular vesicles and an information architecture, as described in more detail above.
- inference module 407 may be used in conjunction with accelerator 405 .
- accelerator 405 is an additional processing accelerator chip.
- the core of accelerator 405 architecture may be a hybrid design employing fixed-function units where the operations are very well defined and programmable units where flexibility is needed.
- inference module 407 may also include a trained neural network, or other machine learning algorithmic model, to further identify correlations.
- interfaces supports include Ethernet interfaces, frame relay interfaces, cable interfaces, DSL interfaces, token ring interfaces, and the like.
- various very high-speed interfaces may be provided such as fast Ethernet interfaces, Gigabit Ethernet interfaces, ATM interfaces, HSSI interfaces, POS interfaces, FDDI interfaces and the like.
- these interfaces may include ports appropriate for communication with the appropriate media.
- they may also include an independent processor and, in some instances, volatile RAM.
- the independent processors may control such communications intensive tasks as packet switching, media control and management.
- the system 400 uses memory 403 to store data and program instructions for operations including training a neural network, object detection by a neural network, and distance and velocity estimation.
- the program instructions may control the operation of an operating system and/or one or more applications, for example.
- the memory or memories may also be configured to store received metadata and batch requested metadata.
- machine-readable media include hard disks, floppy disks, magnetic tape, optical media such as CD-ROM disks and DVDs; magneto-optical media such as optical disks, and hardware devices that are specially configured to store and perform program instructions, such as read-only memory devices (ROM) and programmable read-only memory devices (PROMs).
- program instructions include both machine code, such as produced by a compiler, and files containing higher level code that may be executed by the computer using an interpreter.
- advantages provided by the system and methods described above include the ability to automatically infer a correlation of a disease or condition based on extracted extracellular vesicles.
- existing computer functions are improved because processes are trained to more accurately infer correlations than standard or generic computers.
- the system includes an additional inference module that may include a neural network trained to further increase accuracy of correlation and processing speed.
- the accelerator provides a specialized processing chip that works in conjunction with the inference module to compartmentalize the processing pipeline and reduce processing time and delay. Such accelerators are specialized for the system and are not found on generic computers.
- FIG. 5 illustrates a specific exemplary implementation of the general system described in FIG. 1 and a specific exemplary implementation of the general method described in FIG. 3 .
- Method 500 was implemented via automatic querying and downloading of a dataset from a reference database, Gene Expression Ombnibus (GEO). This data was then automatically processed and normalized on a computing server using methods 504 .
- GEO Gene Expression Ombnibus
- a key set of features, in this case, genes is programmatically deduced based on the statistical filtering method 506 ; the exact list of such features in this embodiment can be found in Table 5.
- further processing as described in 502 and feature set reduction in 506 may not be necessary where this work has been completed by an external party that then uploads the dataset to a web server reference database where other parties can query and download the dataset.
- a supervised machine learning algorithm 508 is then trained using the data after filtering using the 506 feature set.
- the trained machine learning algorithm is used in 510 to predict EV subpopulation characteristics, in this case the cell of origin, and then in 512 , the processed training data, trained model, and predictive results are stored in a noSQL database to improve future predictions on new EV input characteristic data and improved future model training.
- This overall method illustrates how EV isolation, extraction and/or EV characteristic measurements can be completed by an external group or party.
- the goal of this method is to predict which cells may have produced the EVs whose characteristics have been measured. Because the cells used to train the model contain distinct surface proteins, this method thus also indirectly predicts cell surface proteins certain EV subpopulations may be interacting with. Predicting the specific cell type, and its surface proteins, that the EV may have been generated from is critical to understanding how the EV may be used to interact with and target certain cells. Because EVs are used in cell-to-cell communication, these predictions also allow for correlation of certain EV measurements, such as RNA expression, with cell activity. These correlations can be used to deduce potentially novel therapeutic compounds related to the activity of a specific cell type.
- a function was called using the R computing language that took as inputs controlled keywords, specifically MeSH terms, a controlled medical and biomedicine terminology consisting of approximately 26,000 words.
- the raw dataset had been stored with MeSH terms relevant to the origin of the data, in this case, immune cells and extracellular vesicles.
- the R function used “immune”, “extracellular vesicle”, and “microRNA” as inputs, and returned the dataset ID for the dataset used in this example, specifically GSE27997.
- a second R function used this dataset ID as an input to produce a REST API call to the remote web server containing the dataset.
- This REST API call instructed the web server to begin downloading the raw dataset to the cloud server from which this second R function was implemented.
- the cloud computing server architecture that ran both of the above R functions was implemented using the Linux operating system, specifically Debian.
- the script that called these R functions was run inside a virtualized container system, Docker, with R version 3.0.4.
- the downloaded datasets, GSE27997 was created by isolating and extracting EVs using ultracentrifugation. EVs were then lysed, and the RNA inside the EVs, specifically small RNAs in this example, was measured measured using a microarray designed to detect small RNAs.
- This dataset was automatically recommended by the first R function described above not due to the specific EV isolation and extraction methods, nor the RNA measurement methods, or the type of RNA feature (small RNAs) measured.
- the dataset was isolated because the EVs were isolated from specific cells cultured in vitro, and thus the MeSH terms linked to the raw dataset on the webserver included cell-specific terms like “B cell” and “T cell”, and also RNA-specific terms such as “microRNA”.
- RNA expression from cells was also measured to allow for comparison of EV versus cell RNA expression from the same cell type.
- Three types of immune cells were used: CD4+ T cells, B cells and dendritic cells.
- predicting cell type from this dataset also inherently predicts known cell surface proteins, such as CD4 from the CD4+ T cell line.
- the EV and cell small RNA expression data downloaded via the REST web service API call produced by the second R function described above contained separate files for each EV sample, and each cell sample, from the three distinct cell type cultures, with 2-3 replicates for each state (EV versus cell, and the cell type).
- an automated script was run that concatenated the raw RNA expression files together and conducted statistical background correction and quantile normalization on the raw RNA expression values.
- This R script consisted of a function that first read in each individual raw RNA file and read in the mean signal value column. These raw files were in Agilent format, and thus the R function to read in each file scanned for the correct column name, in this case “gMeanSignal”.
- RMA Robust Multi-Array Average
- Feature set reduction was implement because not all genes were highly correlated related to the cell type of origin labels labels, which is what the model was designed to predict.
- This feature set will be denoted as the “EV-derived” feature set; details on how this feature set was derived are provided in the subsequent paragraph.
- the “cell-derived” feature set was first used because although for both model fits, EV RNA expression was used, the goal of the model was to predict cell types.
- Table 1 is mRNAs, and the EV RNA expression contained predominantly small RNAs, specifically microRNAs, the immune-cell-derived mRNA gene signature list in Table 1 was automatically translated into microRNAs predicted to regulate these mRNAs.
- a list of 2,562 microRNAs, shown in Table 2, hypothesized to regulate the mRNAs from Table was created by producing an API call to a web server that contained a database of mRNA-microRNA relationships. These relationships were quantified via natural language processing algorithms. These algorithms used as inputs scientific and medical text from publications, and parsed sentences contained both an mRNA and a microRNA.
- Table 2 contains more RNAs than Table 1.
- Table 3 lists the 273 of these 2,562 microRNAs that were also present in the GSE27997 706 starting gene feature matrix; this final intersecting gene feature set is the “cell-derived” gene feature set used in the first modeling training attempt described in part 508 of FIG. 5 .
- the “EV-derived” feature set was derived directly from the original 706 genes in the starting processed RNA expression matrix, listed in Table 4.
- the “EV-derived” feature set was derived by identifying the genes from the original list of 706 microRNA genes in the matrix that differentiated between the three cell types, using solely EV (not cell) RNA expression, with a multiple hypothesis adjusted p-value of 0.05 or lower. This resulted in 105 final microRNA genes, listed out in Table 5; “q-value” in the second column in Table 5 is the multiple hypothesis-adjusted p-value in terms of percentage. This feature set will be termed the “EV-derived” gene feature set henceforth.
- an R function took as input the entire processed EV RNA logged expression matrix with 706 genes in the rows and EV samples in the columns, along with a vector that denoted the cell type each EV sample originated from. Then this R function implemented a multiclass nonparametric Wilcoxon rank test, and tested against the null hypothesis that the different cell types did not affect the ranking of each gene by its expression level. To reduce the chance of reporting false positives, the R function then adjusted for multiple hypotheses (testing multiple genes at once) using permutation-based tests to approximate a null distribution. Null datasets to compute the statistical test were created by permuting the cell-of-origin-labels and the microRNA expression data. See FIG. 6 for an illustration of how this “EV-derived” feature set automatically infers distinct RNA expression patterns by cell type of origin.
- a dataset of EV measured characteristics with labels linked to states or outcomes of interest is then used to train a predictive machine learning model.
- the states are the different cell types of origin: T cell, B cell or dendritic cell.
- the model trained in this specific example is a Support Vector Machine with a linear kernel, of type nu-regression.
- An R computing script automatically run on a server was used to fit the model.
- An R function took as input the full EV RNA expression training matrix, the vector of EV RNA expression for the “new” EV sample being predicted, the cell of origin labels, and the nu parameter level to be used in the support vector nu-regression fitting.
- the R function then computed a support vector machine regression, where the “new” EV RNA expression vector is regressed against the EV RNA expression training matrix.
- the prediction of the cell type or cell types present in the “new” RNA sample were computed by the R function as such: the coefficient vector from the output support vector machine was multiplied by the support vectors, using linear algebra multiplication notation in R, to create a modified coefficient vector. To scale the cell fraction predictions to sum to 1, or 100%, the resulting modified coefficient vector was divided by the sum of the modified coefficients.
- the function returned the predictional fractional amount of each cell type that contributed to the EVs present in the input sample, thus inferring the cell-of-origin of EVs. Tables 6-12 provide examples of such predictions.
- the entire support vector machine regression process was re-run with the same full input EV training matrix, but with a new EV sample to be predicted.
- the nu parameter was optimized by running this R support vector machine fitting function over a range of nu input parameters, from 0.1 to 1.0.
- the nu parameter that produced the highest prediction accuracies in prediction the true cell-of-origin label for each test EV sample was selected; the optimal nu parameter value for this model and training dataset was 0.25.
- this entire fitting process was done six times.
- Prediction rates for the model fits are reported in Tables 6-12.
- Two methods for evaluating predicate rates were used: In one case, the model was fit using just one replicate from each cell-of-origin, and then the model was used to predict the cell-of-origin of the other replicates. These rates were estimated using four different fits as a result of using two different feature sets on first EV and then cell RNA expression data. The two feature sets used for each model instance were the “cell-derived” and then the “EV-derive’” feature set. A 0% training error (the highest possible success rate) in each instance would be a predicted fraction of 1 assigned to the true cell-of-origin type of that input replicate. These training predictions are presented in Tables 6-12.
- Tables 6-12 demonstrate that the ‘EV-derived’ feature set (Table 8) outperforms the entire original 706 feature list (Table 6) and the ‘cell-derived’ feature list (Table 7) in that the model predicts the EV cell of origin with higher accuracy from EV RNA expression.
- the ‘EV-derived’ feature list also performs well using cell RNA expression (Table 8); suggesting that EV-level characteristics such as RNA expression can be used to both glean insights on EV subpopulations and their respective cells of origin and potential the cells the EVs are interacting with.
- FIG. 6 is a simplified schematic of the results of a single sample prediction detailed in Table 12. It is a visualization representation of the prediction fractions.
- the processed data, model fits, and predictions are then stored for future programmatic optimization of the EV characterization system.
- the data was stored in a NoSQL database to allow for flexible storage of the processed data matrix as a single table.
- the predictions were also stored in a NoSQL database, but a graphical database is also amenable to the storage of such predictions for easy query and retrieval when comparing predictions across different conditions or diseases, to discern how the prediction states may be related.
- RNA expression further helps refine subgroups within these broader groups, linking the extracellular vesicles back to tissue or cell-of-origin, their cell or organ destination, and their functional role.
- RNA expression between different isolated populations of extracellular vesicles as defined by their surface proteins or simply being isolated from patients, animals or cell lines of a different disease type, also creates the opportunity infer shared functional relationships between exosome subgroups/populations beyond just a crude cell surface protein match.
- These type of functional relationships between extracellular vesicles, cells, organs and diseases are stored in a relational or graphical database to help continue to make inferences on new disease datasets where extracellular vesicle populations are not defined yet.
- FIG. 7 details an unsupervised learning approach to the EV RNA expression data used in Example 1 using the ‘EV-derived’ feature set.
- the cell type each exosome sample was derived from is on the y-axis, and microRNA genes (listed in Table 1) are on the x-axis.
- the EV samples are clearly clustered in an automatic an unbiased fashion using hierarchical clustering with a Euclidean distance metric by cell-of-origin type. This result suggests that clustering EVs using measurements of their characteristics can provide biological relevant EV subtypes related to biological functions such as cell signaling.
- the legend is logged RNA expression values.
- FIG. 1 involves incorporating EV characteristics from human samples and EV characteristics from cell culture samples from the same disease state into statistical algorithms to identify a novel and robust EV subpopulation defined by its internal genetic content and external surface proteins.
- FIG. 8 outlines this implementation.
- EVs were isolated and extracted using precipitation-based columns for EV concentration.
- the isolation could have been completed using other EV isolation and extraction methods such as sucrose density gradient columns, microfluidics-based isolation, or ultracentrifugation.
- the embodied system included EV isolation and extraction, RNA-seq on intravesicular RNA 806 , identification of statistically significant genes in EVs from human blood samples 808 , and programmatic searching for concordant gene signaling patterns in cell culture models mimicking the patient states in 810 .
- the implementation then incorporated EV mass spectrometry by automatically downloading it from a reference database via a web server.
- the mass spectrometry data was from EVs from cell culture of the same or biologically similar cell line types in 810 to identify proteins in the mass spectrometry data linked to the statistically significant genes.
- the EV protein data can be used to predict surface proteins on EVs that may provide targeted drug delivery vehicles and the intravesicular genetic proteins provide hypotheses about what genetic material should be blocked or amplified, in the case here of RNA, possibly a related siRNA for blocking or possibly a related miRNA knockdown for amplification.
- the schematic of this final EV subpopulation prediction is shown in FIG. 9 .
- the three y-shape objects in the membrane represent different EV membrane proteins, and an example nucleic acid as a therapeutic agent is depicted inside the EV membrane.
- the results were stored in a database for programmatic querying and improvement of future EV subpopulation prediction, verification, and correlation to specific disease, toxicity or therapeutic states.
- Human blood samples were purchased through a private vendor following standard IRB protocols. Blood samples from four non-small cell lung adenocarcinoma cancer patients (labeled as ‘Cancer’ in FIG. 10 ) and three patients presenting with benign tumors (labeled as ‘Healthy’ in FIG. 10 ) were used for this analysis.
- Another implementation could use samples from another cancer such as renal cell carcinoma, ovarian cancer, blood cancer such as leukemia, melanoma, glioblastoma, brain cancer, or a neurodegenerative non-cancer disease state such as Alzheimer's disease, Parkinson's disease, amyotrophic lateral sclerosis (ALS), prion disease, synucleinopathy, Dementia, or Huntington's disease, or an autoimmunity or autoinflammatory disease such as Systemic lupus erythematosus, rheumatoid arthritis, multiple sclerosis, or inflammatory bowel disease, or a rare disease such as lysosomal storage disease, or Usher's disease, spinal muscular atrophy, or acute myeloid leukemia.
- a neurodegenerative non-cancer disease state such as Alzheimer's disease, Parkinson's disease, amyotrophic lateral sclerosis (ALS), prion disease, synucleinopathy, Dementia, or Huntington's disease
- the EV isolation from human blood samples was conducted by an external vendor for private use, while the EV isolation from cell culture samples was conducted in a private internal lab, showing that the actual EV isolation before measurement of EV characteristics can be conducted in conjunction or in isolation from the system and methods described in the patent.
- RNA-seq was then conducted on the intravesicular RNA from EVs.
- the RNA-seq from the human blood EV data was prepared using an immunoprecipitation method to isolate and extract the EVs.
- the EVs were then lysed and their RNA was measured using an RNA-seq library kit targeting small RNAs.
- the RNA-seq from cell culture EV data was prepared by isolating EVs using a microfluidics-based method that captures EVs via immunomagnetic beads attached to antibodies.
- CD9 antibodies were used to capture EVs with CD9 on their surface; CD9 is a surface protein involved in many EV biological processes and thus present on the surface of most EVs.
- RNA-seq library kit that provided targeted sections of coding RNA. Both of the library kits mentioned above transcribed RNA into cDNA, which was then fed into a next-gen sequencer that fragmented the cDNA and measured the cDNA sequences of each fragment. The sequencer outputted raw RNA-seq files containing these sequences.
- Raw RNA-seq files were aligned to the human genome and RNA transcript counts quantified at the gene level using the STAR alignment algorithm using standard settings suggested by the ENCODE consortium Overexpression genes. Another implementation of this example could do RNA transcript count quantification and the isoform level, and a different alignment algorithm could be used.
- the count data from human blood EVs was then grouped in the cancer versus healthy patients, and genes found to be statistically significantly overexpressed in the cancer patients were programmatically stored in a database. The method to discover the statistically significant genes was comparable to the methods used in Method 1 to obtain the ‘EV-specific’ gene list.
- the heatmap of RNA counts using this statistically significant gene list in human EV blood samples is shown in FIG. 10 .
- HUGO gene symbols that strongly differentiate between healthy and lung cancer patients are on the x-axis; an NA denotes that there is no current gene symbol for the transcript location identified through the ensemble database.
- FIG. 11 visualizes the heatmap of RNA counts using this statistically significant gene list in lung cancer and normal cell culture EV blood samples from FIG. 10 .
- the same gene symbols as in FIG. 10 are listed on the x-axis.
- the order of genes on the x-axis is different in FIGS. 10 versus 11 because FIGS. 10 and 11 are outputs from different clustering analyses.
- the specific cell lines used were A549 and HEK293, but other implementations could use different cell lines and cell types to illustrate the effect.
- the goal here in this step is to identify genes that are overexpressed in the same direction in both human blood and cell culture models, to aid in identifying in vitro therapeutic models that mimic real human biological states.
- One gene, IQGAP1 was statistically significantly overexpressed in both the human blood and the lung cell culture EV samples.
- FIG. 12 displays the heatmap of the protein levels for this protein across a National Cancer Institute (NCI) cancer cell line panel containing 60 cell lines, termed the ‘NCI 60’ panel.
- NCI 60 National Cancer Institute
- the full list of cell line names are: NCI H226, NCI ADR, RES, Colo205, M14, MDA, MB468, KM12, SW620, HOP92, NCI H522, CAKI, NCI H322M, UO 31, HS 578T, ACHN, X 786O, SK MEL28, EKVX, SF539, HOP 62, MALME 3M, SR, OVCAR 3, HCC 2998, MDA MB435, SK MEL 2, SNB 75, OX IMVI, K562, RPMI 8226, NCI H23, IGROV1, SF295, HT29, UACC 257, SNB 19, HL 60, OVAR 4, HCT 116, UACC 62, OVCAR 5, BT549, SK MEL5, A549, U251, MOLT4, MCF7, OVCAR8, MDA MB23, T 47D, SN12C, R
- the final prediction was a specific EV subpopulation, or type of EV, with a minimum one specific EV characteristic. It may be multiple EV characteristics; in this specific example, the EV subpopulation contains at minimum the intravesicular or EV surface protein Ras GTPase-activating protein and the IQGAP1 RNA.
- This targeted delivery vehicle could be used to target lung cancer by engineering an EV in cell culture to contain the GTPase-activating protein, without or without the intravesicular IQGAP1 RNA. Any internal ‘payload’ or compound(s) of choice could be paired with this EV protein characterization.
- multiple proteins and/or multiple RNAs may be used to predict an EV subpopulation by the system.
- This predicted EV subpopulation was then stored in a database; as multiple samples from different in vitro and in vivo models and human blood disease states are measured, the system can then compare across previous results to determine trends of EV subpopulations across biological states with similar shared pathways or biological characteristics.
- FIGS. 13 and 14 Provided in FIGS. 13 and 14 are clustering analyses of RNA from cells, and from isolated extracellular vesicles.
- the embodiment of Figure uses a pre-established gene list of approximately 1300 known cancer genes curated from tissue data.
- exo denotes the RNA was from an exosome
- cell denotes it was from cells.
- A459 denotes a lung cancer cell line
- SKBR3 denotes a HER2+ breast cancer cell line
- Hu78 denotes a T cell lymphoma line
- mixed cancer cells denotes a mixture of NCI60 cancer cell lines
- MDAMB468 denotes a triple-negative breast cancer cell line
- Jurkat denotes a T cell leukemia cell line
- HEK293 denotes a non-cancerous embryonic kidney cell line. All cell lines are derived from human cells. Note how the clustering, when using the cancer gene list, is complex—the two lung exosome samples are split apart, and the two normal exosome samples are in a main cluster on the right with one of the lung exosome samples.
- the embodiment as illustrated in FIG. 14 uses an unbiased gene list that is purely based on the genes that have the highest variance amongst the samples.
- the lung exosomes are closer together, and the normal exosomes are clustered together.
- the breast cancer cell line on the left, mdamb is a triple-negative cell line.
- A459 denotes a lung cancer cell line
- SKBR3 denotes a HER2+ breast cancer cell line
- Hu78 denotes a T cell lymphoma line
- ‘mixed cancer cells’ denotes a mixture of NCI60 cancer cell lines
- MDAMB468 denotes a triple-negative breast cancer cell line
- Jurkat denotes a T cell leukemia cell line
- HEK293 denotes a non-cancerous embryonic kidney cell line. All cell lines are derived from human cells.
Abstract
Description
Claims (3)
Priority Applications (2)
| Application Number | Priority Date | Filing Date | Title |
|---|---|---|---|
| US15/865,166 US11830583B2 (en) | 2017-01-06 | 2018-01-08 | Systems and methods for characterizing extracellular vesicle (EV) population by predicting whether the EV originates from B, T, or dendritic cells |
| US17/320,018 US20210280273A1 (en) | 2017-01-06 | 2021-05-13 | System and method for algorithmic extracellular vesicle population discovery and characterization |
Applications Claiming Priority (2)
| Application Number | Priority Date | Filing Date | Title |
|---|---|---|---|
| US201762443540P | 2017-01-06 | 2017-01-06 | |
| US15/865,166 US11830583B2 (en) | 2017-01-06 | 2018-01-08 | Systems and methods for characterizing extracellular vesicle (EV) population by predicting whether the EV originates from B, T, or dendritic cells |
Related Child Applications (1)
| Application Number | Title | Priority Date | Filing Date |
|---|---|---|---|
| US17/320,018 Continuation US20210280273A1 (en) | 2017-01-06 | 2021-05-13 | System and method for algorithmic extracellular vesicle population discovery and characterization |
Publications (2)
| Publication Number | Publication Date |
|---|---|
| US20180276339A1 US20180276339A1 (en) | 2018-09-27 |
| US11830583B2 true US11830583B2 (en) | 2023-11-28 |
Family
ID=62790913
Family Applications (2)
| Application Number | Title | Priority Date | Filing Date |
|---|---|---|---|
| US15/865,166 Active 2041-08-16 US11830583B2 (en) | 2017-01-06 | 2018-01-08 | Systems and methods for characterizing extracellular vesicle (EV) population by predicting whether the EV originates from B, T, or dendritic cells |
| US17/320,018 Abandoned US20210280273A1 (en) | 2017-01-06 | 2021-05-13 | System and method for algorithmic extracellular vesicle population discovery and characterization |
Family Applications After (1)
| Application Number | Title | Priority Date | Filing Date |
|---|---|---|---|
| US17/320,018 Abandoned US20210280273A1 (en) | 2017-01-06 | 2021-05-13 | System and method for algorithmic extracellular vesicle population discovery and characterization |
Country Status (4)
| Country | Link |
|---|---|
| US (2) | US11830583B2 (en) |
| EP (1) | EP3566051A4 (en) |
| CA (1) | CA3048212A1 (en) |
| WO (1) | WO2018129481A2 (en) |
Families Citing this family (14)
| Publication number | Priority date | Publication date | Assignee | Title |
|---|---|---|---|---|
| US10664784B2 (en) * | 2017-11-27 | 2020-05-26 | International Business Machines Corporation | Analyzing product impact on a system |
| US11348239B2 (en) | 2018-05-14 | 2022-05-31 | Tempus Labs, Inc. | Predicting total nucleic acid yield and dissection boundaries for histology slides |
| US11348240B2 (en) | 2018-05-14 | 2022-05-31 | Tempus Labs, Inc. | Predicting total nucleic acid yield and dissection boundaries for histology slides |
| US11741365B2 (en) | 2018-05-14 | 2023-08-29 | Tempus Labs, Inc. | Generalizable and interpretable deep learning framework for predicting MSI from histopathology slide images |
| US10957041B2 (en) | 2018-05-14 | 2021-03-23 | Tempus Labs, Inc. | Determining biomarkers from histopathology slide images |
| US11348661B2 (en) | 2018-05-14 | 2022-05-31 | Tempus Labs, Inc. | Predicting total nucleic acid yield and dissection boundaries for histology slides |
| EP3605553A1 (en) * | 2018-07-30 | 2020-02-05 | Tata Consultancy Services Limited | Systems and methods for unobtrusive digital health assessment |
| EP3906557A4 (en) * | 2018-12-31 | 2022-09-28 | Tempus Labs, Inc. | Transcriptome deconvolution of metastatic tissue samples |
| WO2020219842A1 (en) * | 2019-04-24 | 2020-10-29 | University Of Cincinnati | Method of label-free characterizing of nanovesicles based on their dielectric properties |
| WO2020252022A1 (en) * | 2019-06-10 | 2020-12-17 | Civis Analytics, Inc. | Method for hierarchical clustering over large data sets using multi-output modeling |
| JP7181849B2 (en) * | 2019-10-31 | 2022-12-01 | 横河電機株式会社 | Apparatus, method and program |
| WO2021137999A1 (en) * | 2020-01-02 | 2021-07-08 | Ohio State Innovation Foundation | Immunomagnetic sequential ultrafiltration platform for enrichment and purification of extracellular vesicles from biofluids |
| TWI783699B (en) * | 2021-02-09 | 2022-11-11 | 國立臺灣大學 | A method for identifying individual gene and its deep learning model |
| CN114973245B (en) * | 2022-06-20 | 2024-03-15 | 重庆医科大学 | Extracellular vesicle classification method, device, equipment and medium based on machine learning |
Family Cites Families (8)
| Publication number | Priority date | Publication date | Assignee | Title |
|---|---|---|---|---|
| US7849090B2 (en) * | 2005-03-30 | 2010-12-07 | Primal Fusion Inc. | System, method and computer program for faceted classification synthesis |
| WO2011027956A2 (en) * | 2009-09-04 | 2011-03-10 | 주식회사이언메딕스 | Extracellular vesicles derived from gram-positive bacteria, and disease model using same |
| EP2556172A4 (en) * | 2010-04-06 | 2013-10-30 | Caris Life Sciences Luxembourg Holdings | Circulating biomarkers for disease |
| US20130095575A1 (en) * | 2011-10-03 | 2013-04-18 | The Board Of Trustees Of The Leland Stanford Junior University | Methods for Fractionation, Analysis and Collection of Microvesicles From Patient Samples |
| WO2014193999A2 (en) * | 2013-05-28 | 2014-12-04 | Caris Science, Inc. | Biomarker methods and compositions |
| US10465183B2 (en) * | 2014-07-09 | 2019-11-05 | Exosome Diagnostics, Inc. | Methods for isolating microvesicles and extracting nucleic acids from biological samples |
| WO2016049258A2 (en) * | 2014-09-25 | 2016-03-31 | The Broad Institute Inc. | Functional screening with optimized functional crispr-cas systems |
| US10881611B2 (en) * | 2015-06-16 | 2021-01-05 | Fondazione Città Della Speranza—Onlus | Extracellular vesicles derived from osteoblastic lineage cells for therapeutic and diagnostic use |
-
2018
- 2018-01-08 CA CA3048212A patent/CA3048212A1/en active Pending
- 2018-01-08 EP EP18736690.1A patent/EP3566051A4/en active Pending
- 2018-01-08 US US15/865,166 patent/US11830583B2/en active Active
- 2018-01-08 WO PCT/US2018/012841 patent/WO2018129481A2/en unknown
-
2021
- 2021-05-13 US US17/320,018 patent/US20210280273A1/en not_active Abandoned
Non-Patent Citations (4)
| Title |
|---|
| "Int'l Application Serial No. PCT/US18/012841, Notification of Transmittal of Int'l Search Report and Written Opinion dated Jul. 12, 2018", 7 pgs. |
| Andreu-Perez, Javier, et al. "Big data for health." IEEE journal of biomedical and health informatics 19.4 (2015): 1193-1208. * |
| Keerthikumar, Shivakumar. "ExoCarta: a web-based compendium of exosomal cargo." Journal of molecular biology 428.4 (2016): 688-692. * |
| Klinke, David J. "Inferring alterations in cell-to-cellcommunication in HER2+ breast cancer using secretome profiling of three cell models." Biotechnology and bioengineering 111.9 (2014): 1853-1863. * |
Also Published As
| Publication number | Publication date |
|---|---|
| US20210280273A1 (en) | 2021-09-09 |
| WO2018129481A3 (en) | 2018-08-16 |
| EP3566051A4 (en) | 2020-11-04 |
| WO2018129481A2 (en) | 2018-07-12 |
| CA3048212A1 (en) | 2018-07-12 |
| US20180276339A1 (en) | 2018-09-27 |
| EP3566051A2 (en) | 2019-11-13 |
Similar Documents
| Publication | Publication Date | Title |
|---|---|---|
| US11830583B2 (en) | Systems and methods for characterizing extracellular vesicle (EV) population by predicting whether the EV originates from B, T, or dendritic cells | |
| US9822416B2 (en) | miRNA in the diagnosis of ovarian cancer | |
| US20110144914A1 (en) | Biomarker assay for diagnosis and classification of cardiovascular disease | |
| US10047400B2 (en) | Microrna and use thereof in identification of B cell malignancies | |
| Sherafatian | Tree-based machine learning algorithms identified minimal set of miRNA biomarkers for breast cancer diagnosis and molecular subtyping | |
| Gámez-Pozo et al. | Combined label-free quantitative proteomics and microRNA expression analysis of breast cancer unravel molecular differences with clinical implications | |
| US20150031777A1 (en) | miRNA FINGERPRINT IN THE DIAGNOSIS OF WILMS' TUMOUR | |
| JP2011516033A (en) | MicroRNA signatures associated with cytogenetics and prognosis in acute myeloid leukemia (AML) and uses thereof | |
| US20170218454A1 (en) | Products and Methods Relating to Micro RNAS and Cancer | |
| Vishnubalaji et al. | Neoplastic transformation of human mesenchymal stromal cells mediated via LIN28B | |
| Peng et al. | Narrmda: Negative-aware and rating-based recommendation algorithm for mirna–disease association prediction | |
| CN105243293B (en) | The collection of prostate Related oncogene information and analysis system and method | |
| Umu et al. | Serum RNAs can predict lung cancer up to 10 years prior to diagnosis | |
| Vegliante et al. | NR1H3 (LXRα) is associated with pro‐inflammatory macrophages, predicts survival and suggests potential therapeutic rationales in diffuse large b‐cell lymphoma | |
| EP3409794A1 (en) | Circulating mirnas as early detection marker and prognostic marker | |
| CN102286625B (en) | Seminal plasma micro RNA combination relevant to male reproductive function disorder and application thereof | |
| Xu et al. | Identification of LINC00173 in myasthenia gravis by integration analysis of aberrantly methylated-differentially expressed genes and ceRNA networks | |
| Zhang et al. | LSGSP: a novel miRNA–disease association prediction model using a Laplacian score of the graphs and space projection federated method | |
| Tan et al. | Integrated bioinformatic analysis of competing endogenous RNA network of choriocarcinoma | |
| Alejandro et al. | Ensemble feature selection and meta-analysis of cancer mirna biomarkers | |
| Zhou et al. | Context-specific miRNA regulation network predicts cancer prognosis | |
| Morland | Exploring qpcr data with weighted gene coexpression network analysis (WGCNA) | |
| Gomez-Martinez et al. | Novel diagnosis and progression microRNA signatures in melanoma | |
| Guan et al. | The effects of age, cigarette smoking, sex, and race on the qualitative characteristics of lung transcriptome | |
| Salcedo Lobera et al. | miRNA as biomarker in lung cancer |
Legal Events
| Date | Code | Title | Description |
|---|---|---|---|
| FEPP | Fee payment procedure |
Free format text: ENTITY STATUS SET TO UNDISCOUNTED (ORIGINAL EVENT CODE: BIG.); ENTITY STATUS OF PATENT OWNER: MICROENTITY |
|
| AS | Assignment |
Owner name: MANTRA BIO, INC., CALIFORNIA Free format text: ASSIGNMENT OF ASSIGNORS INTEREST;ASSIGNORS:PLANEY, CATHERINE ROSEMARY;MOK, ALEXANDER;REEL/FRAME:044571/0715 Effective date: 20180102 |
|
| FEPP | Fee payment procedure |
Free format text: ENTITY STATUS SET TO SMALL (ORIGINAL EVENT CODE: SMAL); ENTITY STATUS OF PATENT OWNER: MICROENTITY Free format text: ENTITY STATUS SET TO MICRO (ORIGINAL EVENT CODE: MICR); ENTITY STATUS OF PATENT OWNER: MICROENTITY |
|
| STPP | Information on status: patent application and granting procedure in general |
Free format text: DOCKETED NEW CASE - READY FOR EXAMINATION |
|
| STPP | Information on status: patent application and granting procedure in general |
Free format text: NON FINAL ACTION MAILED |
|
| STPP | Information on status: patent application and granting procedure in general |
Free format text: RESPONSE TO NON-FINAL OFFICE ACTION ENTERED AND FORWARDED TO EXAMINER |
|
| STPP | Information on status: patent application and granting procedure in general |
Free format text: EX PARTE QUAYLE ACTION MAILED |
|
| STPP | Information on status: patent application and granting procedure in general |
Free format text: PUBLICATIONS -- ISSUE FEE PAYMENT RECEIVED |
|
| STPP | Information on status: patent application and granting procedure in general |
Free format text: PUBLICATIONS -- ISSUE FEE PAYMENT VERIFIED |
|
| STCF | Information on status: patent grant |
Free format text: PATENTED CASE |