US11796710B2 - Determination of formation water salinity using downhole low frequency electromagnetic measurements and permittivity dispersions based thereon - Google Patents
Determination of formation water salinity using downhole low frequency electromagnetic measurements and permittivity dispersions based thereon Download PDFInfo
- Publication number
- US11796710B2 US11796710B2 US16/940,479 US202016940479A US11796710B2 US 11796710 B2 US11796710 B2 US 11796710B2 US 202016940479 A US202016940479 A US 202016940479A US 11796710 B2 US11796710 B2 US 11796710B2
- Authority
- US
- United States
- Prior art keywords
- formation
- calibration
- salinity
- subsurface formation
- permittivity
- Prior art date
- Legal status (The legal status is an assumption and is not a legal conclusion. Google has not performed a legal analysis and makes no representation as to the accuracy of the status listed.)
- Active, expires
Links
Images


Classifications
-
- G—PHYSICS
- G01—MEASURING; TESTING
- G01V—GEOPHYSICS; GRAVITATIONAL MEASUREMENTS; DETECTING MASSES OR OBJECTS; TAGS
- G01V3/00—Electric or magnetic prospecting or detecting; Measuring magnetic field characteristics of the earth, e.g. declination, deviation
- G01V3/38—Processing data, e.g. for analysis, for interpretation, for correction
-
- E—FIXED CONSTRUCTIONS
- E21—EARTH DRILLING; MINING
- E21B—EARTH DRILLING, e.g. DEEP DRILLING; OBTAINING OIL, GAS, WATER, SOLUBLE OR MELTABLE MATERIALS OR A SLURRY OF MINERALS FROM WELLS
- E21B49/00—Testing the nature of borehole walls; Formation testing; Methods or apparatus for obtaining samples of soil or well fluids, specially adapted to earth drilling or wells
- E21B49/08—Obtaining fluid samples or testing fluids, in boreholes or wells
- E21B49/087—Well testing, e.g. testing for reservoir productivity or formation parameters
- E21B49/0875—Well testing, e.g. testing for reservoir productivity or formation parameters determining specific fluid parameters
-
- G—PHYSICS
- G01—MEASURING; TESTING
- G01N—INVESTIGATING OR ANALYSING MATERIALS BY DETERMINING THEIR CHEMICAL OR PHYSICAL PROPERTIES
- G01N27/00—Investigating or analysing materials by the use of electric, electrochemical, or magnetic means
- G01N27/02—Investigating or analysing materials by the use of electric, electrochemical, or magnetic means by investigating impedance
- G01N27/026—Dielectric impedance spectroscopy
-
- G—PHYSICS
- G01—MEASURING; TESTING
- G01N—INVESTIGATING OR ANALYSING MATERIALS BY DETERMINING THEIR CHEMICAL OR PHYSICAL PROPERTIES
- G01N27/00—Investigating or analysing materials by the use of electric, electrochemical, or magnetic means
- G01N27/02—Investigating or analysing materials by the use of electric, electrochemical, or magnetic means by investigating impedance
- G01N27/22—Investigating or analysing materials by the use of electric, electrochemical, or magnetic means by investigating impedance by investigating capacitance
- G01N27/221—Investigating or analysing materials by the use of electric, electrochemical, or magnetic means by investigating impedance by investigating capacitance by investigating the dielectric properties
-
- G—PHYSICS
- G01—MEASURING; TESTING
- G01N—INVESTIGATING OR ANALYSING MATERIALS BY DETERMINING THEIR CHEMICAL OR PHYSICAL PROPERTIES
- G01N33/00—Investigating or analysing materials by specific methods not covered by groups G01N1/00 - G01N31/00
- G01N33/18—Water
-
- G—PHYSICS
- G01—MEASURING; TESTING
- G01N—INVESTIGATING OR ANALYSING MATERIALS BY DETERMINING THEIR CHEMICAL OR PHYSICAL PROPERTIES
- G01N33/00—Investigating or analysing materials by specific methods not covered by groups G01N1/00 - G01N31/00
- G01N33/24—Earth materials
-
- G—PHYSICS
- G01—MEASURING; TESTING
- G01V—GEOPHYSICS; GRAVITATIONAL MEASUREMENTS; DETECTING MASSES OR OBJECTS; TAGS
- G01V3/00—Electric or magnetic prospecting or detecting; Measuring magnetic field characteristics of the earth, e.g. declination, deviation
- G01V3/18—Electric or magnetic prospecting or detecting; Measuring magnetic field characteristics of the earth, e.g. declination, deviation specially adapted for well-logging
- G01V3/26—Electric or magnetic prospecting or detecting; Measuring magnetic field characteristics of the earth, e.g. declination, deviation specially adapted for well-logging operating with magnetic or electric fields produced or modified either by the surrounding earth formation or by the detecting device
- G01V3/28—Electric or magnetic prospecting or detecting; Measuring magnetic field characteristics of the earth, e.g. declination, deviation specially adapted for well-logging operating with magnetic or electric fields produced or modified either by the surrounding earth formation or by the detecting device using induction coils
-
- G—PHYSICS
- G01—MEASURING; TESTING
- G01V—GEOPHYSICS; GRAVITATIONAL MEASUREMENTS; DETECTING MASSES OR OBJECTS; TAGS
- G01V3/00—Electric or magnetic prospecting or detecting; Measuring magnetic field characteristics of the earth, e.g. declination, deviation
- G01V3/18—Electric or magnetic prospecting or detecting; Measuring magnetic field characteristics of the earth, e.g. declination, deviation specially adapted for well-logging
- G01V3/30—Electric or magnetic prospecting or detecting; Measuring magnetic field characteristics of the earth, e.g. declination, deviation specially adapted for well-logging operating with electromagnetic waves
-
- Y—GENERAL TAGGING OF NEW TECHNOLOGICAL DEVELOPMENTS; GENERAL TAGGING OF CROSS-SECTIONAL TECHNOLOGIES SPANNING OVER SEVERAL SECTIONS OF THE IPC; TECHNICAL SUBJECTS COVERED BY FORMER USPC CROSS-REFERENCE ART COLLECTIONS [XRACs] AND DIGESTS
- Y02—TECHNOLOGIES OR APPLICATIONS FOR MITIGATION OR ADAPTATION AGAINST CLIMATE CHANGE
- Y02A—TECHNOLOGIES FOR ADAPTATION TO CLIMATE CHANGE
- Y02A90/00—Technologies having an indirect contribution to adaptation to climate change
- Y02A90/30—Assessment of water resources
Definitions
- the present disclosure relates to methods and systems that can determine formation water salinity and other useful formation properties (such as formation water saturation) based on the formation water salinity.
- downhole fluid sampling methods can be used to obtain a sample of formation water.
- the sample can be analyzed by laboratory methods to measure the salinity of the formation water sample.
- the downhole fluid sampling requires that the formation water be mobile, i.e., in the transition zone or water leg.
- pulsed neutron gamma spectral methods can be used to measure the salinity of formation water. See, for example, i) Ma., S. M.; Pfutzner, H.; AL-Hajiri, A. A.; et al., “Resolving the mixed salinity challenges with a methodology developed from pulsed neutron capture gamma ray spectral measurements”, SPE 170608, Annual Technical Conference and Exhibition Society of Petroleum Engineers, 2014; ii) Ma, S. M., et al., “Formation water salinity from borehole measurements,” U.S. Pat. No. 10,208,582, 19 Feb.
- higher frequency (20 MHz to 1 GHz) dielectric data can be obtained and processed to measure the salinity of formation water. See, for example, Seleznev, N., Hou, C., Freed, D., Habashy, T., Feng, L. Fellah, K. and Xu, G., “Coherent interpretation of wideband electromagnetic measurements in the millihertz to gigahertz frequency range,” SPWLA 58th Annual Logging Symposium, 2017. This method is not accurate if formation water salinity is low and high. Furthermore, if the measurement of the higher frequency (20 MHz to 1 GHz) dielectric data is shallow, it may not be representative of formation water salinity.
- methods and systems for measuring multifrequency permittivity data of a subsurface formation from downhole electromagnetic measurements at multiple frequencies below 1 MHz.
- the multifrequency permittivity data is processed to estimate salinity of the formation water of the subsurface formation.
- Other useful formation properties such as formation water saturation
- the downhole low frequency electromagnetic measurements are nondestructive, and the results indicate that the methods and systems are highly sensitive to the existence of clays.
- the methods and systems can process the multifrequency permittivity data by calculating derivatives of the multifrequency permittivity data and using such derivatives to determine a slope representing change in permittivity relative to change in frequency.
- the slope can be used as an input to a first calibration equation that relates the slope to a calibration parameter.
- a value for the calibration parameter can be determined by solving the first calibration equation given the slope as input.
- the value of the calibration parameter can be used as input to a second calibration equation that relates the calibration parameter to salinity of the formation water of the subsurface formation.
- a value for the salinity of the formation water can be determined by solving the second calibration equation given the calibration parameter as input.
- the multifrequency permittivity data and the underlying downhole electromagnetic measurements can involve a set of frequencies less than 1 MHz.
- the set of frequencies less than 1 MHz can possibly include frequencies between 1 MHz and 1 KHz and/or frequencies between 1 KHz and 100 Hz and/or frequencies between 100 Hz and 10 Hz.
- the first calibration equation relates the slope and at least one additional parameter to the calibration parameter.
- the at least one additional parameter can represent clay volume and possibly frequency.
- the first calibration equation can have the form
- V clay a ⁇ d ⁇ ⁇ df ⁇ f b , where V clay is clay volume
- d ⁇ ⁇ df is the slope representing change in permittivity relative to change in frequency
- f is frequency
- a and b are calibration parameters, where a is the calibration parameter determined by solving the first calibration equation.
- the second calibration equation can be selected from a set of calibration equations corresponding to different formation temperatures, where the selection is based on measured formation temperature of the subsurface formation.
- either one or both of the first and second calibration equations can be selected from calibration equations corresponding to different clay volume and type, where the selection is based on a determination of clay volume and type of the subsurface formation.
- the clay volume can include single clay types such as kaolinite, smectite, illite, chlorite, and possibly combinations thereof.
- the measurement of the multifrequency permittivity data and the processing of such data can be performed by a processor.
- the operations of the method or system or parts thereof can also be controlled by a processor.
- FIGS. 1 A, 1 B and 1 C depict plots of relative permittivity computed as a function of frequency (in Hz) for a shaly sand formation rock containing 10% illite under different water volumes (including 4%, 20% and 36%) and different formation water salinities of 30 ppk ( FIG. 1 A ), 60 ppk ( FIG. 1 B ) and 150 ppk ( FIG. 1 C );
- FIGS. 2 A, 2 B and 2 C depict plots of relative permittivity computed as a function of frequency (in Hz) for a shaly sand formation rock containing different clay volumes (including 1%, 5%, 10%, 20% and 30%) with a water volume of 24% and different formation water salinities of 30 ppk ( FIG. 2 A ), 60 ppk ( FIG. 2 B ) and 150 ppk ( FIG. 2 C ).
- FIGS. 2 A, 2 B and 2 C also include horizontal dashed lines depicting relative permittivity computed as a function of frequency (in Hz) for a clay-free shaly sand formation rock (0% clay) with a water volume of 24% and different formation water salinities of 30 ppk ( FIG. 2 A ), 60 ppk ( FIG. 2 B ) and 150 ppk ( FIG. 2 C );
- FIGS. 3 A, 3 B and 3 C depict plots of the derivatives of the relative permittivity as a function of frequency (in Hz) of FIGS. 2 A, 2 B and 2 C for the shaly sand formation rock containing different clay volumes (including 1%, 5%, 10%, 20% and 30%) with a water volume of 24% and different formation water salinities of 30 ppk ( FIG. 3 A ), 60 ppk ( FIG. 3 B ) and 150 ppk ( FIG. 3 C );
- FIG. 4 depicts correlation curves between the calibration parameter a of the calibration equation (1) as described herein to formation water salinity (in ppk) for four different formation temperatures of 100° F., 200° F., 300° F., and 400° F.;
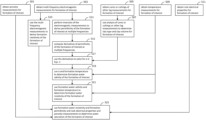
- FIG. 5 is a flowchart illustrating a methodology for measuring multifrequency permittivity data of a subsurface formation from downhole electromagnetic measurements.
- the multifrequency permittivity data is processed to estimate salinity of the formation water of the subsurface formation.
- Other useful formation properties such as formation water saturation
- FIG. 6 is a block diagram of a computer processing system, which can be used to embody parts of the methodology for quantification of formation water salinity and other useful formation properties based thereon.
- Hydrocarbon-bearing subsurface formation rock such as shaly sands can contain different types of clays and different amounts of such clay types. Each clay type has its own different characteristics, which can be translated to what is called cation exchange capacity (CEC) in common petrophysical applications.
- Clays are hydrous aluminum silicate minerals that are platy in structure and can form by the alteration of silicate minerals like feldspar and amphibole. Clays are commonly lumped or grouped into a number of clay types, including but not limited to smectite, kaolinite, chlorite, illite.
- Clays have a tendency to swell when exposed to water, creating a potential drilling hazard when clay-bearing formation rock is exposed to water-based fluids during drilling, possibly reducing the permeability of the reservoir rock. Clays can also reduce the permeability of reservoir rock when clay-bearing formation rock is exposed to water-based stimulation fluids.
- the structural differences amongst the clay types can determine the surface area exposed to reservoir fluids or drilling fluids or stimulating fluids.
- Clays can be found in pore spaces, as part of the matrix or as grain-cementing material.
- Authigenic clays which grow in the pores from minerals in the connate water, can be pore-filling or pore-lining.
- clays have considerable surface area exposed in the pore and can be reactive, while detrital clays that are part of the matrix are usually less reactive. Additionally, clays can be cementing, or grain-binding, materials that react with water or acid to disaggregate the formation if they are not protected by quartz overgrowths. The most common clays that create clay problems in hydrocarbon reservoirs are kaolinite, smectite, illite and chlorite.
- Interfacial polarization can be observed in formation rock containing clays (such as shaly sands) and in other porous media containing clays.
- a nonconductive mineral such as clay minerals and silica grains
- EM electromagnetic
- these surface charges form electric dipoles and cause interfacial polarization (IP) effects.
- the strength of the IP effects is regulated by permittivity of the formation rock or other porous media.
- the present disclosure provides a methodology or framework that uses low frequency (below 1 MHz) downhole electromagnetic measurements of a subsurface formation to determine multifrequency permittivity (referred to herein as a “permittivity dispersion”) of the subsurface formation over a range of low frequencies (below 1 MHz).
- the permittivity dispersion of the subsurface formation is processed to determine or quantify salinity of formation water contained in the subsurface formation.
- Other useful formation properties (such as formation water saturation) can be determined based on the formation water salinity.
- formation permittivity depends mainly on the following parameters: formation water volume (which is dependent on formation porosity and water saturation); formation water salinity; clay types and clay volumes for the formation rock; and grain size and shapes for the formation rock.
- a mathematic model can be used to calculate formation permittivity based on the above listed parameters.
- the model calculates formation complex conductivity by analyzing the EM response of a representative volume comprising a single, isolated electrically conductive inclusion (such as clay grains) surrounded by the host material (such as water).
- the effective medium theory was applied to formulate the model.
- ⁇ R is the in-phase component of the complex formation conductivity
- ⁇ 0 ⁇ r is the quadrature component of the complex formation conductivity with w representing frequency, ⁇ 0 representing permittivity of vacuum (8.854 ⁇ 10 ⁇ 12 ) and ⁇ r representing relative permittivity.
- ⁇ r depends on water volume, water salinity, clay volumes and grain size and shape. Both ⁇ R and ⁇ r can be calculated from the mathematical model.
- FIGS. 1 A, 1 B and 1 C show calculations of relative permittivity ⁇ r as a function of frequency ⁇ (in Hz) for a shaly sand matrix under different water volumes of 4%, 20% and 36%.
- the shaly sand matrix of the three examples includes 90% sandstone and 10% illite assuming spherical grains.
- Three different water salinities are used in the calculations. Specifically, the calculations of FIG. 1 A employ a water salinity of 30 parts per thousand (ppk), the calculations of FIG. 1 B employ a water salinity of 60 parts per thousand (ppk), and the calculations of FIG. 1 C employ a water salinity of 150 parts per thousand (ppk).
- the characteristics of the relative permittivity ⁇ r as a function of frequency ⁇ (in Hz) can be summarized as follows: strong dispersions in relative permittivity below 10 kHz; the dispersions in relative permittivity do not depend on water volume; the relative permittivity decreases with the increased water salinity; and above 100 kHz, there is no dispersion and the relative permittivity depends on water volume.
- the permittivity dispersions at the low frequency range do not depend on water volume.
- the same permittivity dispersion curves strongly depend on clay volume, as depicted in FIGS. 2 A, 2 B and 2 C .
- the curves of FIGS. 2 A, 2 B and 2 C show relative permittivity ⁇ r as a function of frequency ⁇ (in Hz) for different clay volumes of 1%, 5%, 10%, 20%, and 30% respectively.
- the relative permittivity ⁇ r as a function of frequency ⁇ (in Hz) for clean sandstone (0% clay volume) is also plotted as a horizontal dashed line in FIGS. 2 A, 2 B and 2 C .
- the permittivity dispersion curves of FIGS. 2 A, 2 B and 2 C are derived from variations in water salinity of 30 parts per thousand (ppk), 60 parts per thousand (ppk) and 150 parts per thousand (ppk), respectively, which is similar to the curves of FIGS. 1 A, 1 B and 1 C . Furthermore, all of the permittivity dispersion curves of FIGS. 2 A, 2 B and 2 C are derived from a water volume (product of water saturation and porosity) of 24%. It can be observed that while the clean sandstone has no dispersion, the shaly sands show strong dispersion effects.
- the dispersion curve shows a large difference from the clean sands, indicating that it is very sensitive to clay volume.
- the amplitude of the dispersion depends on water salinity. The higher the water salinity, the lower the amplitude of dispersion.
- FIGS. 3 A, 3 B and 3 C show the derivatives of relative permittivity ⁇ r as a function of frequency for the corresponding curves in FIGS. 2 A, 2 B and 2 C .
- each clay volume has a unique, but different derivative.
- an empirical formula can be defined as:
- V clay a ⁇ d ⁇ ⁇ df ⁇ f b , Eqn . ⁇ ( 2 ) where V clay is clay volume
- d ⁇ ⁇ df is the slope of the curve representing change in relative permittivity ⁇ r as a function of change in frequency
- f is frequency
- a and b are calibration parameters.
- Formation pressure and formation temperature are two additional factors that can be considered when calculating relative permittivity and its derivative. Through simulations it was determined that formation pressure has little effect on relative permittivity and can be eliminated from further considerations. Formation temperature, however, can impact water conductivity, charge density at the surface of clay grains and, therefore, affect relative permittivity and its derivatives. The temperature effects can be simulated and corrected as will be demonstrated below.
- the calibration parameter b of Eqn. (2) can be defined as a constant value (preferably 2.45).
- the calibration parameter a of Eqn. (2) can be defined by a correlation with formation water salinity for a known temperature as depicted in FIG. 4 .
- the formation water salinity (Sal) can be expressed in a dimensionless unit such as parts per kilo or thousand (ppk), parts per million (ppm), fractional percentage, or another suitable unit.
- the formation water salinity (Sal) represents the relative amount of salt dissolved in the formation water.
- the calibration parameter a of Eqn. (2) can be dependent on both clay type and clay volume.
- knowledge of clay type and clay volume from other logs or other historical data can be used in Eqn. (2) to determine the calibration parameter a, which is then used as part of Eqn. (3) to determine salinity of the formation water.
- multifrequency permittivity data of a subsurface formation can be measured from downhole electromagnetic measurements at frequencies below 1 MHz of the formation of the interest. Derivatives can be calculated from the measured multifrequency permittivity data.
- Clay type and clay volume V clay can be determined from analysis of rock cores, drill cuttings and/or logs (such as element spectroscope surveys).
- the calibration parameter b can be assumed to be a constant for the clay volume and type. Derivatives can be calculated from the measured multifrequency permittivity data and used to determine the slope
- Eqn. (2) can be used to solve for the calibration parameter a. Then, with temperature of subsurface formation determined by logging or other measurements, the appropriate calibration of Eqn. (3) corresponding to the formation temperature and clay volume and type can be used to calculate a value of salinity (Sal) of formation water for the subsurface formation.
- Sal salinity
- FIGS. 1 A- 1 C, 2 A- 2 C, 3 A- 3 C and 4 The following observations can be based on FIGS. 1 A- 1 C, 2 A- 2 C, 3 A- 3 C and 4 :
- the permittivity dispersion data of the subsurface formation can be measured from downhole electromagnetic measurements at multiple frequencies below 1 MHz.
- the derivatives of the permittivity dispersion data can be used to estimate salinity of the formation water.
- Other useful formation properties (such as formation water saturation) can be determined based on the estimate of salinity of the formation water.
- FIG. 5 depicts a workflow that uses downhole electromagnetic measurements at frequencies below 1 MHz of a subsurface formation of interest to determine multifrequency permittivity data (or permittivity dispersion data) for the formation of interest over a range of low frequencies (below 1 MHz).
- the multifrequency permittivity data of the subsurface formation of interest is processed to determine or quantify salinity of formation water contained in the subsurface formation of interest.
- Other useful formation properties can be determined based on the formation water salinity.
- porosity measurements of the formation of interest are obtained.
- the porosity measurements can be performed by one or more downhole tools (such as a gamma-ray density tool, neutron density tool, or NMR tool) that are located in a desired depth location in a borehole that traverses the formation of interest and/or possibly by laboratory analysis of one or more core samples collected from the formation of interest.
- downhole tools such as a gamma-ray density tool, neutron density tool, or NMR tool
- multifrequency electromagnetic measurements of the formation of interest are obtained.
- the electromagnetic measurements can be performed by a downhole EM logging tool (which can part of a wireline logging tool, a logging-while-drilling logging tool, a measurement-while-drilling logging tool, or a tripping-while-drilling logging tool).
- the electromagnetic measurements can be dispersed at low frequencies (below 1 MHz).
- the downhole EM logging tool can be located in a desired depth location in a borehole that traverses the formation of interest and operated to measure complex conductivity data representing conductivity of the formation of interest at the multiple low frequencies less than 1 MHz.
- the multiple low frequencies less than 1 MHz can possibly include frequencies between 1 MHz and 1 KHz and/or frequencies between 1 KHz and 100 Hz and/or frequencies between 100 Hz and 10 Hz.
- the frequency of the applied time varying external electromagnetic field produced by the transmitter antenna of the downhole EM logging tool can be controlled to correspond to the particular low frequency, and the electromagnetic response of the formation of interest can be measured by the downhole EM logging tool for that particular low frequency.
- rock core sample(s) or cuttings of other log measurements are obtained for the formation of interest.
- the rock core(s) or cuttings or other log measurements of 505 are analyzed to determine clay type and clay volume for the formation of interest.
- temperature measurements are obtained to determine formation temperature for the formation of interest.
- the temperature measurements can involve measuring borehole temperature or the temperature of core samples or fluid samples collected from the formation of interest.
- rock electrical properties are obtained for the formation of interest.
- formation resistivity is obtained using electromagnetic tool such as array induction tool (AIT) of Schlumberger.
- operations perform an inversion of the electromagnetic measurements of block 503 for each frequency within a set of frequencies below 1 MHz to derive relative permittivity of the formation of interest at the multiple frequencies.
- an induction logging tool as set forth in U.S. Pat. No. 7,501,829 can be used to obtain the multifrequency electromagnetic measurements of block 503 .
- measurements of complex conductivity of the formation of interest can be obtained for three different radial depths (shallow/medium, deep) into the formation for each one of the multiple frequencies.
- the relative permittivity of the formation of interest at the respective depth locations (shallow, medium, deeper) and corresponding frequency can be extracted from the quadrature component of the complex conductivity measurements obtained by the induction logging tool.
- operations compute derivatives of the relative permittivity of the formation of interest as a function of frequency at the multiple frequencies as derived in block 513 .
- operations use the derivatives of the relative permittivity of the formation of interest as a function of frequency as computed in block 515 to solve for the calibration parameter a of Eqn. (2).
- the clay volume as determined in block 505 and the calibration parameter b (which is assumed to be a constant) are used as inputs to Eqn. (2).
- the derivatives calculated from the measured multifrequency permittivity data can also be used to determine a slope
- operations use the parameter a solved for in block 517 and the formation temperature of block 509 to determine formation water salinity (Sal) of the formation of interest.
- the appropriate calibration equation of the form of Eqn. (3) corresponding to the formation temperature can be used to calculate a value of salinity (Sal) of formation water for the formation of interest.
- the parameter a solved for in block 517 can be used as input to the appropriate calibration equation of the form of Eqn. (3) that corresponds to the formation temperature.
- Data representing the formation water salinity (Sal) of the formation of interest can be stored in electronic memory or output therefrom as needed (such as block 521 ).
- operations use the formation water salinity of block 519 and the formation temperature of block 509 to determine formation water resistivity of the formation of interest. This can be accomplished using published charts such as The Schlumberger log interpretation chartbook. Data representing the formation water resistivity of the formation of interest can be stored in electronic memory or output therefrom as needed (such as block 525 ).
- operations use the multifrequency electromagnetic measurements of block 503 to derive formation resistivity of the formation of interest.
- This can be accomplished using a multifrequency dielectric scanner, such as the array dielectric tool (ADT), of Schlumberger.
- Data representing the formation resistivity of the formation of interest can be stored in electronic memory or output therefrom as needed (such as block 525 ).
- operations use the formation water resistivity of block 521 and the formation resistivity of block 523 and the rock electrical properties of block 511 and the formation porosity measurements of block 501 to determine water saturation of the formation of interest.
- Such operations can use the well-known Archie equation or the modified Archie equation such as Dual-water or Waxman-Smith models, which calculates oil saturation and water saturation based on the total formation porosity.
- Data representing the formation water saturation of the formation of interest can be stored in electronic memory or output therefrom as needed.
- the operations of the workflow of FIG. 5 can be performed over different depth intervals within a borehole that traverses the subsurface formation of interest in order to determine or quantify salinity of formation water over the depth intervals of the formation of interest.
- Other useful formation properties such as formation water saturation
- water over the depth intervals of the formation of interest can be determined based on the formation water salinity over the depth intervals of the formation of interest.
- FIG. 6 illustrates an example device 2500 , with a processor 2502 and memory 2504 that can be configured to implement various embodiments of the methods and workflows as discussed in this disclosure.
- Memory 2504 can also host one or more databases and can include one or more forms of volatile data storage media such as random-access memory (RAM), and/or one or more forms of nonvolatile storage media (such as read-only memory (ROM), flash memory, and so forth).
- RAM random-access memory
- ROM read-only memory
- flash memory and so forth.
- Device 2500 is one example of a computing device or programmable device and is not intended to suggest any limitation as to scope of use or functionality of device 2500 and/or its possible architectures.
- device 2500 can comprise one or more computing devices, programmable logic controllers (PLCs), etc.
- PLCs programmable logic controllers
- device 2500 should not be interpreted as having any dependency relating to one or a combination of components illustrated in device 2500 .
- device 2500 may include one or more of computers, such as a laptop computer, a desktop computer, a mainframe computer, etc., or any combination or accumulation thereof.
- Device 2500 can also include a bus 2508 configured to allow various components and devices, such as processors 2502 , memory 2504 , and local data storage 2510 , among other components, to communicate with each other.
- bus 2508 configured to allow various components and devices, such as processors 2502 , memory 2504 , and local data storage 2510 , among other components, to communicate with each other.
- Bus 2508 can include one or more of any of several types of bus structures, including a memory bus or memory controller, a peripheral bus, an accelerated graphics port, and a processor or local bus using any of a variety of bus architectures. Bus 2508 can also include wired and/or wireless buses.
- Local data storage 2510 can include fixed media (e.g., RAM, ROM, a fixed hard drive, etc.) as well as removable media (e.g., a flash memory drive, a removable hard drive, optical disks, magnetic disks, and so forth).
- fixed media e.g., RAM, ROM, a fixed hard drive, etc.
- removable media e.g., a flash memory drive, a removable hard drive, optical disks, magnetic disks, and so forth.
- One or more input/output (I/O) device(s) 2512 may also communicate via a user interface (UI) controller 2514 , which may connect with I/O device(s) 2512 either directly or through bus 2508 .
- UI user interface
- a network interface 2516 may communicate outside of device 2500 via a connected network.
- a media drive/interface 2518 can accept removable tangible media 2520 , such as flash drives, optical disks, removable hard drives, software products, etc.
- removable tangible media 2520 such as flash drives, optical disks, removable hard drives, software products, etc.
- logic, computing instructions, and/or software programs comprising elements of module 2506 may reside on removable media 2520 readable by media drive/interface 2518 .
- input/output device(s) 2512 can allow a user (such as a human annotator) to enter commands and information to device 2500 and allow information to be presented to the user and/or other components or devices.
- a user such as a human annotator
- Examples of input device(s) 2512 include, for example, sensors, a keyboard, a cursor control device (e.g., a mouse), a microphone, a scanner, and any other input devices known in the art.
- Examples of output devices include a display device (e.g., a monitor or projector), speakers, a printer, a network card, and so on.
- Computer-readable media can be any available data storage medium or media that is tangible and can be accessed by a computing device. Computer readable media may thus comprise computer storage media. “Computer storage media” designates tangible media, and includes volatile and non-volatile, removable and non-removable tangible media implemented for storage of information such as computer readable instructions, data structures, program modules, or other data.
- Computer storage media include, but are not limited to, RAM, ROM, EEPROM, flash memory or other memory technology, CD-ROM, digital versatile disks (DVD) or other optical storage, magnetic cassettes, magnetic tape, magnetic disk storage or other magnetic storage devices, or any other tangible medium which can be used to store the desired information, and which can be accessed by a computer.
- Some of the methods and processes described above, can be performed by a processor.
- the term “processor” should not be construed to limit the embodiments disclosed herein to any particular device type or system.
- the processor may include a computer system.
- the computer system may also include a computer processor (e.g., a microprocessor, microcontroller, digital signal processor, or general-purpose computer) for executing any of the methods and processes described above.
- the computer program logic may be embodied in various forms, including a source code form or a computer executable form.
- Source code may include a series of computer program instructions in a variety of programming languages (e.g., an object code, an assembly language, or a high-level language such as C, C++, or JAVA).
- Such computer instructions can be stored in a non-transitory computer readable medium (e.g., memory) and executed by the computer processor.
- the computer instructions may be distributed in any form as a removable storage medium with accompanying printed or electronic documentation (e.g., shrink wrapped software), preloaded with a computer system (e.g., on system ROM or fixed disk), or distributed from a server or electronic bulletin board over a communication system (e.g., the Internet or World Wide Web).
- a removable storage medium with accompanying printed or electronic documentation (e.g., shrink wrapped software), preloaded with a computer system (e.g., on system ROM or fixed disk), or distributed from a server or electronic bulletin board over a communication system (e.g., the Internet or World Wide Web).
- a communication system e.g., the Internet or World Wide Web
- the processor may include discrete electronic components coupled to a printed circuit board, integrated circuitry (e.g., Application Specific Integrated Circuits (ASIC)), and/or programmable logic devices (e.g., a Field Programmable Gate Arrays (FPGA)). Any of the methods and processes described above can be implemented using such logic devices.
- ASIC Application Specific Integrated Circuits
- FPGA Field Programmable Gate Arrays
- Processes described herein can be performed in any suitable order unless otherwise indicated herein or otherwise clearly contradicted by context.
- Processes described herein may be performed under the control of one or more computer systems configured with executable instructions and may be implemented as code (e.g., executable instructions, one or more computer programs or one or more applications) executing collectively on one or more processors, by hardware or combinations thereof.
- the code may be stored on a computer-readable storage medium, for example, in the form of a computer program comprising a plurality of instructions executable by one or more processors.
- the computer-readable storage medium may be non-transitory.
Abstract
Description
where Vclay is clay volume,
is the slope representing change in permittivity relative to change in frequency, f is frequency, and a and b are calibration parameters, where a is the calibration parameter determined by solving the first calibration equation.
σ=σR +iωε 0εr Eqn. (1)
where σR is the in-phase component of the complex formation conductivity; and ωε0εr is the quadrature component of the complex formation conductivity with w representing frequency, ε0 representing permittivity of vacuum (8.854×10⁻¹²) and εr representing relative permittivity.
where Vclay is clay volume,
is the slope of the curve representing change in relative permittivity εr as a function of change in frequency, f is frequency, and a and b are calibration parameters.
Sal=C 1 ×a 2 +C 2 ×a+C 3 Eqn. (3)
where C1, C2 and C3 are calibration constants.
Eqn. (2) can be used to solve for the calibration parameter a. Then, with temperature of subsurface formation determined by logging or other measurements, the appropriate calibration of Eqn. (3) corresponding to the formation temperature and clay volume and type can be used to calculate a value of salinity (Sal) of formation water for the subsurface formation.
-
- (a) the permittivity dispersion curves for shaly sands at low frequencies below 1 MHz do not depend on water volume. This makes the permittivity dispersion curve an ideal clay detector for all saturation conditions, pay zones or otherwise;
- (b) the permittivity dispersion curves for shaly sands strongly depend on clay type and volume. Even with 1% clay volume, the permittivity dispersion curves show a huge difference from the one with clean sand;
- (c) the derivatives of the dispersion curves have a well-defined correlation with clay type and clay volume. The correlation can be modeled by an empirical formula shown in Eqn. (2);
- (d) there are two calibration parameters a and b. In embodiments, the calibration parameter b can be a constant value (e.g. 2.45) while the calibration parameter a has a well-defined correlation with water salinity; and
- (e) formation water salinity can be estimated based on calculation of the calibration parameter a and formation temperature using Eqn. (3).
for input to Eqn. (2).
Claims (20)
Priority Applications (1)
| Application Number | Priority Date | Filing Date | Title |
|---|---|---|---|
| US16/940,479 US11796710B2 (en) | 2020-07-28 | 2020-07-28 | Determination of formation water salinity using downhole low frequency electromagnetic measurements and permittivity dispersions based thereon |
Applications Claiming Priority (1)
| Application Number | Priority Date | Filing Date | Title |
|---|---|---|---|
| US16/940,479 US11796710B2 (en) | 2020-07-28 | 2020-07-28 | Determination of formation water salinity using downhole low frequency electromagnetic measurements and permittivity dispersions based thereon |
Publications (2)
| Publication Number | Publication Date |
|---|---|
| US20220035066A1 US20220035066A1 (en) | 2022-02-03 |
| US11796710B2 true US11796710B2 (en) | 2023-10-24 |
Family
ID=80002874
Family Applications (1)
| Application Number | Title | Priority Date | Filing Date |
|---|---|---|---|
| US16/940,479 Active 2041-03-15 US11796710B2 (en) | 2020-07-28 | 2020-07-28 | Determination of formation water salinity using downhole low frequency electromagnetic measurements and permittivity dispersions based thereon |
Country Status (1)
| Country | Link |
|---|---|
| US (1) | US11796710B2 (en) |
Citations (5)
| Publication number | Priority date | Publication date | Assignee | Title |
|---|---|---|---|---|
| US7501829B2 (en) | 2005-02-28 | 2009-03-10 | Schlumberger Technology Corporation | Extra bucking coils as an alternative way to balance induction arrays |
| US20180120468A1 (en) * | 2016-10-27 | 2018-05-03 | Schlumberger Technology Corporation | Evaluation of formation utilizing wideband electromagnetic measurements |
| US10208582B2 (en) | 2016-08-24 | 2019-02-19 | Saudi Arabian Oil Company | Formation water salinity from borehole measurements |
| US10247849B2 (en) | 2011-09-16 | 2019-04-02 | Schlumberger Technology Corporation | Method for measuring formation water salinity from within a borehole |
| US20200245044A1 (en) * | 2019-01-24 | 2020-07-30 | Baker Hughes Oilfield Operations Llc | Two-way dual-tone methods and systems for synchronizing remote modules |
-
2020
- 2020-07-28 US US16/940,479 patent/US11796710B2/en active Active
Patent Citations (5)
| Publication number | Priority date | Publication date | Assignee | Title |
|---|---|---|---|---|
| US7501829B2 (en) | 2005-02-28 | 2009-03-10 | Schlumberger Technology Corporation | Extra bucking coils as an alternative way to balance induction arrays |
| US10247849B2 (en) | 2011-09-16 | 2019-04-02 | Schlumberger Technology Corporation | Method for measuring formation water salinity from within a borehole |
| US10208582B2 (en) | 2016-08-24 | 2019-02-19 | Saudi Arabian Oil Company | Formation water salinity from borehole measurements |
| US20180120468A1 (en) * | 2016-10-27 | 2018-05-03 | Schlumberger Technology Corporation | Evaluation of formation utilizing wideband electromagnetic measurements |
| US20200245044A1 (en) * | 2019-01-24 | 2020-07-30 | Baker Hughes Oilfield Operations Llc | Two-way dual-tone methods and systems for synchronizing remote modules |
Non-Patent Citations (5)
| Title |
|---|
| Clinch, S. et al., "Determining Formation Water Salinity in the Hydrocarbon Leg using Cores and Logs", Petrophysics, 2011, 52(2), pp. 108-123. |
| Ma, S. M. et al., "Resolving the Mixed Salinity Challenges with a Methodology Developed from Pulsed Neutron Capture Gamma Ray Spectral Measurements", SPE 170608, 2014 SPE Annual Technical Conference and Exhibition, Amsterdam, The Netherlands, 12 pages. |
| Seleznev, N. et al., "Coherent Interpretation of Wideband Electromagnetic measurements in th emillihertz to Gigahertz Frequency Range", Petrophysics, 2018, 59(3), pp. 334-353. |
| Seleznev, N., et al., Coherent interpretation of wideband electromagnetic measurements in the millihertz to gigahertz frequency range, SPWLA 58th Annual Logging Symposium, Jun. 17-21, 2017, 23 pages. |
| Tian, L. et al., "A neutron-Induced Gamma-Ray Spectroscopy Logging Method for Determining Formation Water Salinity", SPWLA 60th Annual Logging Symposium, The Woodlands, TX, USA, 2019, 11 pages. |
Also Published As
| Publication number | Publication date |
|---|---|
| US20220035066A1 (en) | 2022-02-03 |
Similar Documents
| Publication | Publication Date | Title |
|---|---|---|
| US11048012B2 (en) | Formation characterization system | |
| US10451763B2 (en) | Evaluation of formation utilizing wideband electromagnetic measurements | |
| US11940588B2 (en) | Clay detection and quantification using downhole low frequency electromagnetic measurements | |
| US10215876B2 (en) | Cation exchange capacity and water saturation from array induction data | |
| US10866335B2 (en) | Formation clay typing from electromagnetic measurements | |
| US20220082014A1 (en) | Estimation of fluid saturation of a formation from integration of multiple well logs | |
| US11499935B2 (en) | Clay detection and quantification using low frequency electromagnetic measurements | |
| US10184906B2 (en) | Identification, quantification and prediction of free silicon in geological formation and its contribution to rock properties | |
| De Gennaro et al. | Integrated unconventional gas evaluation workflow: from anisotropic geomechanical modelling to completion design | |
| US20160231461A1 (en) | Nuclear magnetic resonance (nmr) porosity integration in a probabilistic multi-log interpretation methodology | |
| US20180372906A1 (en) | Determining Downhole Wettability | |
| US11061163B2 (en) | Permeability determinations from wideband EM models using borehole logging tools | |
| US11788402B2 (en) | Methods for determining a volume fraction of water and water salinity in organic shale reservoirs using multi-frequency dielectric well logging measurements | |
| US11796710B2 (en) | Determination of formation water salinity using downhole low frequency electromagnetic measurements and permittivity dispersions based thereon | |
| Pirie et al. | Advanced methods for the evaluation of a hybrid-type unconventional play: The Bakken petroleum system | |
| Michelena et al. | Seismic, geologic, geomechanics, and dynamic constraints in flow models of unconventional fractured reservoirs: Example from a south Texas field | |
| US11754518B2 (en) | Methods and systems to determine tortuosity of rock and fluids in porous media | |
| Wang et al. | Dielectric dispersion interpretation as an integrated petrophysical workflow for saturation and beyond | |
| Johansen et al. | Downhole neutron-induced spectroscopy element and mineral estimates compared to a ring-tested core reference | |
| Wang et al. | Improving Dielectric Interpretation by Calibrating Matrix Permittivity and Solving Dielectric Mixing Laws with a New Graphical Method | |
| US20230109189A1 (en) | Quantification of formation water saturation and salinity using relative permittivity and conductivity measurements | |
| Shetty et al. | Imaging radial distribution of water saturation and porosity near the wellbore by joint inversion of sonic and resistivity logging data | |
| US20230375741A1 (en) | Methods and systems to identify formations with minimum clay related natural gamma rays | |
| US20240069239A1 (en) | Methods using dual arrival compressional and shear arrival events in layered formations for formation evaluation, geomechanics, well placement, and completion design | |
| Sirju et al. | Joint inversion of array induction and sonic data for radial variations of porosity and saturation in complex mineralogy |
Legal Events
| Date | Code | Title | Description |
|---|---|---|---|
| FEPP | Fee payment procedure |
Free format text: ENTITY STATUS SET TO UNDISCOUNTED (ORIGINAL EVENT CODE: BIG.); ENTITY STATUS OF PATENT OWNER: LARGE ENTITY |
|
| STPP | Information on status: patent application and granting procedure in general |
Free format text: NON FINAL ACTION MAILED |
|
| AS | Assignment |
Owner name: SAUDI ARABIAN OIL COMPANY, SAUDI ARABIA Free format text: ASSIGNMENT OF ASSIGNORS INTEREST;ASSIGNORS:MA, SHOUXIANG;LIU, CHENGBING;SIGNING DATES FROM 20210128 TO 20220817;REEL/FRAME:060885/0697 Owner name: SCHLUMBERGER TECHNOLOGY CORPORATION, TEXAS Free format text: ASSIGNMENT OF ASSIGNORS INTEREST;ASSIGNORS:ZHANG, PING;ABDALLAH, WAEL;REEL/FRAME:060885/0941 Effective date: 20210131 |
|
| STPP | Information on status: patent application and granting procedure in general |
Free format text: RESPONSE TO NON-FINAL OFFICE ACTION ENTERED AND FORWARDED TO EXAMINER |
|
| STPP | Information on status: patent application and granting procedure in general |
Free format text: FINAL REJECTION MAILED |
|
| STPP | Information on status: patent application and granting procedure in general |
Free format text: RESPONSE TO NON-FINAL OFFICE ACTION ENTERED AND FORWARDED TO EXAMINER |
|
| STPP | Information on status: patent application and granting procedure in general |
Free format text: NOTICE OF ALLOWANCE MAILED -- APPLICATION RECEIVED IN OFFICE OF PUBLICATIONS |
|
| STPP | Information on status: patent application and granting procedure in general |
Free format text: PUBLICATIONS -- ISSUE FEE PAYMENT RECEIVED |
|
| STPP | Information on status: patent application and granting procedure in general |
Free format text: PUBLICATIONS -- ISSUE FEE PAYMENT VERIFIED |
|
| STCF | Information on status: patent grant |
Free format text: PATENTED CASE |