US11719643B2 - System and method for detection of dust mite antigens - Google Patents
System and method for detection of dust mite antigens Download PDFInfo
- Publication number
- US11719643B2 US11719643B2 US16/422,178 US201916422178A US11719643B2 US 11719643 B2 US11719643 B2 US 11719643B2 US 201916422178 A US201916422178 A US 201916422178A US 11719643 B2 US11719643 B2 US 11719643B2
- Authority
- US
- United States
- Prior art keywords
- dust mite
- dust
- standard
- raman
- mite antigen
- Prior art date
- Legal status (The legal status is an assumption and is not a legal conclusion. Google has not performed a legal analysis and makes no representation as to the accuracy of the status listed.)
- Active, expires
Links
Images


Classifications
-
- G—PHYSICS
- G01—MEASURING; TESTING
- G01N—INVESTIGATING OR ANALYSING MATERIALS BY DETERMINING THEIR CHEMICAL OR PHYSICAL PROPERTIES
- G01N21/00—Investigating or analysing materials by the use of optical means, i.e. using sub-millimetre waves, infrared, visible or ultraviolet light
- G01N21/62—Systems in which the material investigated is excited whereby it emits light or causes a change in wavelength of the incident light
- G01N21/63—Systems in which the material investigated is excited whereby it emits light or causes a change in wavelength of the incident light optically excited
- G01N21/65—Raman scattering
- G01N21/658—Raman scattering enhancement Raman, e.g. surface plasmons
-
- C—CHEMISTRY; METALLURGY
- C12—BIOCHEMISTRY; BEER; SPIRITS; WINE; VINEGAR; MICROBIOLOGY; ENZYMOLOGY; MUTATION OR GENETIC ENGINEERING
- C12Q—MEASURING OR TESTING PROCESSES INVOLVING ENZYMES, NUCLEIC ACIDS OR MICROORGANISMS; COMPOSITIONS OR TEST PAPERS THEREFOR; PROCESSES OF PREPARING SUCH COMPOSITIONS; CONDITION-RESPONSIVE CONTROL IN MICROBIOLOGICAL OR ENZYMOLOGICAL PROCESSES
- C12Q1/00—Measuring or testing processes involving enzymes, nucleic acids or microorganisms; Compositions therefor; Processes of preparing such compositions
- C12Q1/34—Measuring or testing processes involving enzymes, nucleic acids or microorganisms; Compositions therefor; Processes of preparing such compositions involving hydrolase
- C12Q1/37—Measuring or testing processes involving enzymes, nucleic acids or microorganisms; Compositions therefor; Processes of preparing such compositions involving hydrolase involving peptidase or proteinase
-
- G—PHYSICS
- G01—MEASURING; TESTING
- G01N—INVESTIGATING OR ANALYSING MATERIALS BY DETERMINING THEIR CHEMICAL OR PHYSICAL PROPERTIES
- G01N33/00—Investigating or analysing materials by specific methods not covered by groups G01N1/00 - G01N31/00
- G01N33/48—Biological material, e.g. blood, urine; Haemocytometers
- G01N33/50—Chemical analysis of biological material, e.g. blood, urine; Testing involving biospecific ligand binding methods; Immunological testing
- G01N33/53—Immunoassay; Biospecific binding assay; Materials therefor
- G01N33/5308—Immunoassay; Biospecific binding assay; Materials therefor for analytes not provided for elsewhere, e.g. nucleic acids, uric acid, worms, mites
-
- G—PHYSICS
- G01—MEASURING; TESTING
- G01N—INVESTIGATING OR ANALYSING MATERIALS BY DETERMINING THEIR CHEMICAL OR PHYSICAL PROPERTIES
- G01N33/00—Investigating or analysing materials by specific methods not covered by groups G01N1/00 - G01N31/00
- G01N33/48—Biological material, e.g. blood, urine; Haemocytometers
- G01N33/50—Chemical analysis of biological material, e.g. blood, urine; Testing involving biospecific ligand binding methods; Immunological testing
- G01N33/53—Immunoassay; Biospecific binding assay; Materials therefor
- G01N33/543—Immunoassay; Biospecific binding assay; Materials therefor with an insoluble carrier for immobilising immunochemicals
- G01N33/54366—Apparatus specially adapted for solid-phase testing
- G01N33/54373—Apparatus specially adapted for solid-phase testing involving physiochemical end-point determination, e.g. wave-guides, FETS, gratings
-
- G—PHYSICS
- G01—MEASURING; TESTING
- G01N—INVESTIGATING OR ANALYSING MATERIALS BY DETERMINING THEIR CHEMICAL OR PHYSICAL PROPERTIES
- G01N2333/00—Assays involving biological materials from specific organisms or of a specific nature
- G01N2333/435—Assays involving biological materials from specific organisms or of a specific nature from animals; from humans
- G01N2333/43504—Assays involving biological materials from specific organisms or of a specific nature from animals; from humans from invertebrates
- G01N2333/43552—Assays involving biological materials from specific organisms or of a specific nature from animals; from humans from invertebrates from insects
- G01N2333/43582—Assays involving biological materials from specific organisms or of a specific nature from animals; from humans from invertebrates from insects from mites
-
- G—PHYSICS
- G01—MEASURING; TESTING
- G01N—INVESTIGATING OR ANALYSING MATERIALS BY DETERMINING THEIR CHEMICAL OR PHYSICAL PROPERTIES
- G01N2333/00—Assays involving biological materials from specific organisms or of a specific nature
- G01N2333/90—Enzymes; Proenzymes
- G01N2333/914—Hydrolases (3)
- G01N2333/948—Hydrolases (3) acting on peptide bonds (3.4)
- G01N2333/95—Proteinases, i.e. endopeptidases (3.4.21-3.4.99)
- G01N2333/964—Proteinases, i.e. endopeptidases (3.4.21-3.4.99) derived from animal tissue
- G01N2333/96402—Proteinases, i.e. endopeptidases (3.4.21-3.4.99) derived from animal tissue from non-mammals
- G01N2333/96405—Proteinases, i.e. endopeptidases (3.4.21-3.4.99) derived from animal tissue from non-mammals in general
- G01N2333/96408—Proteinases, i.e. endopeptidases (3.4.21-3.4.99) derived from animal tissue from non-mammals in general with EC number
- G01N2333/96413—Cysteine endopeptidases (3.4.22)
-
- G—PHYSICS
- G01—MEASURING; TESTING
- G01N—INVESTIGATING OR ANALYSING MATERIALS BY DETERMINING THEIR CHEMICAL OR PHYSICAL PROPERTIES
- G01N2800/00—Detection or diagnosis of diseases
- G01N2800/24—Immunology or allergic disorders
Definitions
- the present invention relates to a system and method for detecting dust mite antigens and, more particularly, to a non-immune system and method for detecting dust mite antigens.
- Dust mite is one of the common biological allergens in indoor dust.
- Both of the European Dermatophagoides pteronyssinus (Der p) and the American Dermatophagoides farina (Der f) are the most common species of dust mites to affect human health.
- Previous studies have revealed that Dermatophagoides pteronyssinus group 1 allergen (Der p 1) carrying cysteine proteases can initiate a specifically allergic immune response in children to attack asthma when they are exposed to dust mites.
- Der p 1 in indoor dust has been used to be an index for assessing the probability and the risk of asthma occurrence. In general, inhalation of Der p1 at 2 ppm could induce asthma.
- Dermatophagoides farinae group 1 allergen Dermatophagoides farinae group 1 allergen (Der f 1) also carrying cysteine proteases. If the subjects are allergic to dust mites via inhaling dust corpses or excrement, the allergen also called antigen contained in the dust mites are detectable in their blood.
- human T helper cells detect foreign substances, they deliver messages to B cells to produce immunoglobulin E (IgE) that bonds with mast cells, antigens and eosinophiles to release chemical substances such as histamine, and cause an inflammatory response. The entire process is called immediate hypersensitivity. Nonetheless, there has not been any effective and rapid methods for detecting mite antigens in the dust till now.
- IgE immunoglobulin E
- a conventional method for detecting dust mite antigens is enzyme-linked immunosorbent assay (ELISA).
- ELISA assay uses the specificity of the binding of an antigen with an enzyme-linked antibody, and the subsequent reaction with an added enzyme substrate produces a detectable color or fluorescent signal.
- Antigens that are bonded with a solid carrier such as a plastic aperture plate still possess immune activity.
- a solid carrier such as a plastic aperture plate
- the shade of the color can be used for a quantitative analysis.
- there are problems with the search for highly specific and active antibodies because there are many variables in the production of the antibodies.
- using immune response to detect dust mite antigens in the environment is complicated and time-consuming, not suitable for rapid screening. In fact, due to procedural differences between collecting household dust to testing at an inspection center, the current method is unable to meet the needs of household inspection.
- Taiwanese Patent No. M523295 discloses an apparatus for catching dust mites.
- This apparatus traps actively dust mites in the environment, and thereby reduces the production of allergens.
- This conventional apparatus further provides a test kit for detecting the result of trapping so that the efficiency of trapping mites can be observed by the naked eyes directly.
- the color reagent is uniformly coated on a capture layer of the trapping apparatus, and then sandwiched it into a transparent substrate.
- the color reagent is heated at 50° C. to 70° C. for 10 minutes or laid at room temperature for 3 to 10 days.
- the trapped dust mites, if any, will be dyed, and the trapping efficiency can be observed with bare eyes.
- this method is merely used to evaluate roughly the amount of the dust mites in the environment, not calculate precisely.
- the present invention is therefore intended to obviate or at least alleviate the problems encountered in prior art.
- the method includes the steps of (a) collecting a dust sample, (b) extracting dust mite antigens from the dust sample and cleaning up the dust mite antigens, thereby providing a to-be-examined sample, and (c) placing the testing sample on a SERS chip without immunological modification, and using a Raman spectrometer to impose surface-enhanced Raman examination on the to-be-examined sample placed on the SERS chip, thereby determining whether certain dust mite antigens exist in the dust sample.
- the Raman spectrometer builds the spectrum database at least for one standard dust mite antigen.
- the information of the database includes Raman spectrums and corresponding standard curves for the relationship between the characteristic peak signals and the concentrations.
- the Raman spectrum of the to-be-examined sample is referred with the Raman spectrum of the standard dust mite antigen to determine whether any dust mite antigen identical to the standard dust mite antigen exists in the to-be-examined sample, and the standard curve is used to calculate the concentration of the dust mite antigens in the to-be-examined sample if there is dust mite antigens determined identically to the standard dust mite antigen in the to-be-examined sample.
- the step of (b) extracting dust mite antigens includes the step of using TBE extract buffer to extract dust mite antigens from the dust sample, and the TBE extract buffer includes tris borate buffer, bicarbonate, phosphate and NaCl.
- the at least one standard dust mite antigen includes a standard dust mite allergen Der p1 or a standard dust mite allergen Der f1.
- the system includes a SERS chip and Raman spectrometer.
- the SERS chip is not subjected to immunological modification and used to carry one to-be-examined sample.
- the Raman spectrometer is used to impose a surface-enhanced Raman determination on the dust sample on the SERS chip, wherein the Raman spectrometer builds the spectrum database at least for one standard dust mite antigen.
- the information of the database includes Raman spectrums and corresponding standard curves for the relationship between the characteristic peak signals and the concentrations.
- the Raman spectrum of the to-be-examined sample is referred with the Raman spectrum of the standard dust mite antigen to determine whether any dust mite antigen identical to the standard dust mite antigen exists in the to-be-examined sample, and the standard curve is used to calculate the concentration of the dust mite antigens in the to-be-examined sample if there is dust mite antigens determined identically to the standard dust mite antigen in the to-be-examined sample.
- the nanogold coated on an array structure of silver columns extending from a surface In another aspect, the nanogold coated on an array structure of silver columns extending from a surface.
- FIG. 1 is a flow chart of a process for producing the standard solution of dust mite antigens according to the preferred embodiment of the present invention
- FIGS. 2 A to 2 H are Raman spectrums of the standard solution of dust mite antigen Der f1 with different concentrations
- FIGS. 3 A to 3 H are Raman spectrums of the standard solution of dust mite antigen Der p1 with different concentrations
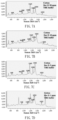
- FIG. 4 shows the correlation between the concentrations of the standard solutions of dust mite antigen Der f1 and the intensity of Raman signals
- FIG. 5 shows the correlation between the concentrations of the standard solutions of dust mite antigen Der p1 and the intensity of Raman signals
- FIG. 6 is a flow chart of a procedure for producing the blank matrix sample solution
- FIGS. 7 A to 7 D are spectrums of dust mite antigen Der f1 extracted from a dust-simulating matrix (cotton wool) in dust mite antigen Der f1 standard solutions at different concentrations in TBE extract buffer;
- FIGS. 8 A to 8 D s are spectrums of dust mite antigen Der p1 extracted from a dust-simulating matrix (cotton wool) in dust mite antigen Der p1 standard solutions at different concentrations in TBE extract buffer;
- FIG. 9 A is a Raman spectrum of TBE extract buffer only
- FIG. 9 B is a Raman spectrum of the dust-simulating matrix processed by the TBE extract buffer
- FIG. 9 C is a Raman spectrum of the dust-simulating matrix added with the standard solution of dust mite antigen Der f1, and processed by the TBE extract buffer;
- FIG. 9 D is a Raman spectrum of the dust-simulating matrix added with the standard solution of dust mite antigen Der p1, and processed by the TBE extract buffer;
- FIG. 10 is a flow chart of a process for producing actual dust sample solution according to the preferred embodiment of the present invention.
- FIG. 11 A is a Raman spectrum of the actual dust sample processed by the TBE extract buffer
- FIG. 11 B is a Raman spectrum of the actual dust sample added with a dust mite antigen Der f1 internal label, and processed by the TBE extract buffer;
- FIG. 11 C is a Raman spectrum of the actual dust sample added with a dust mite antigen Der p1 internal label, and processed by the TBE extract buffer.
- a dust sample is collected, then, (b) dust mite antigens are extracted from the dust sample and cleaned up, and thereby (c) providing a to-be-examined sample.
- the to-be-examined sample is laid on a SERS chip without immunological modification, and a Raman spectrometer is used to impose SERS examination on the to-be-examined sample on the SERS chip to determine whether any certain dust mite antigens exist in the to-be-examined sample.
- the dust sample can be added with TBE extract buffer during the extraction of the to-be-examined sample from the dust sample to facilitate the determination of the to-be-examined sample.
- the Raman spectrometer builds the spectrum database at least for one standard dust mite antigen.
- the information of the database includes Raman spectrums and corresponding standard curves for the relationship between the characteristic peak signals and the concentrations.
- the Raman spectrum of the to-be-examined sample is referred with the Raman spectrum of the standard dust mite antigen to determine whether any dust mite antigen identical to the standard dust mite antigen exists in the to-be-examined sample, and the standard curve is used to calculate the concentration of the dust mite antigens in the to-be-examined sample if there is dust mite antigens determined identically to the standard dust mite antigen in the to-be-examined sample.
- nanogold is coated on an array structure of silver columns extending from a surface of the SERS chip.
- the system includes a SERS chip and a Raman spectrometer.
- the SERS chip is not subjected to immunological modification.
- the SERS chip is used to carry a to-be-examined sample.
- the Raman spectrometer is used to execute surface-enhanced Raman examination of the to-be-examined sample on the SERS chip.
- the Raman spectrometer builds the spectrum database at least for one standard dust mite antigen.
- the information of the database includes Raman spectrums and corresponding standard curves for the relationship between the characteristic peak signals and the concentrations.
- the Raman spectrum of the to-be-examined sample is referred with the Raman spectrum of the standard dust mite antigen to determine whether any dust mite antigen identical to the standard dust mite antigen exists in the to-be-examined sample, and the standard curve is used to calculate the concentration of the dust mite antigens in the to-be-examined sample if there is dust mite antigens determined identically to the standard dust mite antigen in the to-be-examined sample.
- standards of two common dust mite antigens Der p1 and Der f1 are used for the SERS determination and analysis to build the surface-enhanced Raman spectrum dataset and the standard curves for the relationship between the characteristic peak signals and the concentrations.
- concentrations of samples of the standard dust mite antigen are 1, 5, 10, 50, 100, 500 and 1000 ppm.
- cotton wool is used to simulate dust matrix and added with the standard dust mite antigen as an internal label. After preprocessing, i.e., using buffer solution and cleanup columns to soak and extract, the samples are dropped on the SERS chip without immunological modification, and the detection of the dust mite antigens can be executed and completed in 10 seconds.
- the Raman spectrometer is preferably Wasatch Photonics 785 L, with laser wavelength of 785 nm and a wave number of 350 to 2000 cm ⁇ 1 .
- the SERS chip used in the Raman spectrum determination includes nanogold coated on an array structure of silver columns extending from a surface of a glass film substrate made by glancing deposition. The thickness of the SERS chip is about 289 ⁇ 5 nm.
- the SERS examination is executed in the Raman system with a power of 100 mW, magnification of lens 4 ⁇ , integration time of 500 ms, spectrums overlapped for 16 times. Time for observation and recording is 15 seconds to 2 minutes.
- dust mite antigen standard solutions are produced.
- the amount of Der f1 recombinant protein (or Der p1 recombinant protein) is dissolved in dust mite antigen buffer solution, thereby providing a dust mite antigen standard.
- the dust mite antigen standard is diluted by deionized water, thereby the standard solutions of dust mite antigen at different concentrations are prepared.
- the Der f1 recombinant protein is ALR-004 provided by ProSpec, New Brunswick, N.J.
- the Der p1 recombinant protein is ALR-003 provided by the same company.
- the dust mite antigen buffer solution is mixture of 60 mM NaCl, 50 mM Tris-HCl, pH 8.0 and 1.2 M Urea with one another.
- the Der f1 recombinant protein (or Der p1 recombinant protein) is dissolved in the dust mite antigen buffer solution and diluted by deionized water to provide dust mite antigen standard solutions at 1 ppm, 5 ppm, 10 ppm, 50 ppm, 100 ppm, 500 ppm and 1000 ppm for example.
- FIGS. 2 A to 2 H and 3 A to 3 H Raman spectrums are made and used as benchmarks.
- FIGS. 2 A to 2 H show Raman shift of the standard solutions of dust mite antigen Der f1.
- FIGS. 3 A to 3 H show Raman shift of the standard solution of dust mite antigen Der p1.
- FIG. 4 or 5
- the strength of the Raman signal of the dust mite antigen reflects its concentration.
- blank-matrix sample solutions are produced.
- cotton wool is used as blank matrix to simulate an indoor dust sample referred to actual dust samples.
- FIG. 6 to produce the blank matrix samples, 0.01 gram of cotton wool is inserted in a glass bottle with a lining of 4 ml of brown polytetrafluoroethylene, and added with 1 ⁇ l of each of the standard solutions of dust mite antigen at different concentrations as internal labels, i.e., the blank matrix samples.
- the blank matrix samples are further subjected to preprocessing, and turned into blank matrix sample solutions to be used in the SERS determination.
- the processing of the blank matrix samples includes extraction, filtering, cleanup, blow-drying and condensation.
- each of the blank matrix samples is added with 500 ⁇ l of extract, and subjected to ultrasonic vibration for thorough extraction.
- the extract is TBE extract buffer that includes deionized water, tris borate buffer (pH 8.5), bicarbonate (pH 8.0), phosphate (pH 7.4) and NaCl.
- a syringe with an aperture of 0.22 ⁇ m in diameter is used to filter out impurities.
- cleanup columns are used to clean up the filtrate.
- the cleanup columns are filled with absorbents such as 1° or 2° amine (PSA), graphitized carbon black (GCB) and carbon-18 (C18) to effectively remove irrelevant substances and thoroughly clean up the solutions after the extraction.
- PSA 1° or 2° amine
- GCB graphitized carbon black
- C18 carbon-18
- FIGS. 7 A to 7 D are Raman spectrums of dust mite antigen Der f1 extracted from dust-simulating matrix (cotton wool) added with 1 ⁇ l of the standard solutions of dust mite antigen Der f1 at different concentrations (50 ppm, 10 ppm, 5 ppm and 1 ppm) and TBE extract buffer.
- FIGS. 8 A to 8 D are Raman spectrums of dust mite antigen Der p1 extracted from dust-simulating matrix (cotton wool) added with 1 ⁇ l of dust mite antigen Der p1 at different concentrations (50 ppm, 10 ppm, 5 ppm and 1 ppm) and TBE extract buffer.
- dust mite antigens can be detected even if the concentration of the standard solution of dust mite antigen is as low as 1 ppm, and this facilitates the monitoring of dust mites for asthma prevention.
- FIG. 9 A is a Raman spectrum of only TBE extract buffer, and this Raman spectrum is used as a background value.
- FIG. 9 B is a Raman spectrum of cotton wool added with TBE extract buffer without any internal label of dust mite antigen, and this Raman spectrum is used as a reference value.
- FIG. 9 C is a Raman spectrum of blank matrix sample solution added with 1 ⁇ l of the standard solution of dust mite antigen Der f1 (internal label) and TBE.
- FIG. 9 D is a Raman spectrum of blank matrix sample solution added with 1 ⁇ l of the standard solution of dust mite antigen Der f1 and TBE extract buffer.
- the TBE buffered extract does not affect the detection of the dust mite antigens in the dust-simulating matrix detection, and TBE extract buffer allows clear measurement of Raman signals of dust mite antigen Der f1 or dust mite antigen Der p1.
- actual dust is sampled, and the actual dust is used as matrix.
- 0.01 gram of dust is sampled, and filled in a glass bottle with a lining of 4 ml of brown polytetrafluoroethylene.
- the actual dust is further subjected to preprocessing to provide dust sample solution to be subjected to SERS detection.
- the preprocessing of the dust samples is substantially identical to the preprocessing of the blank matrix samples, and includes extraction, filtering, cleanup, blow-drying, and condensation. The preprocessing of the dust samples will be described as follows.
- the dust samples are added with 500 ⁇ l of TBE extract buffer, and subjected to ultrasonic vibration for thorough extraction.
- the TBE extract buffer includes deionized water, Tris borate buffer (pH 8.5), bicarbonate (pH 8.0), phosphate (pH 7.4) and NaCl.
- a syringe with an aperture of 0.22 ⁇ m in diameter is used for filtering out impurities.
- cleanup columns are used to clean up the filtered solution.
- the cleanup columns are filled with absorbents such as 1° or 2° amine (PSA), graphitized carbon black (GCB) and carbon-18 (C18) to effectively remove irrelevant substances and completely clean up the solutions after the extraction.
- PSA 1° or 2° amine
- GCB graphitized carbon black
- C18 carbon-18
- FIG. 11 A is a Raman spectrum of the dust sample solution added with the TBE.
- FIG. 11 B is a Raman spectrum of the dust sample solution added with an internal label of 1 ⁇ l of dust mite antigen Der f1 standard solution (1 ppm), and extracted with the TBE extract buffer.
- FIG. 11 C is a Raman spectrum of the dust sample solution added with an internal label of 1 ⁇ l of the standard solution of dust mite antigen Der p1 (1 ppm), and extracted with the TBE extract buffer.
- the Raman signals of dust mite antigen Der f1 or dust mite antigen Der p1 can clearly be detected, and the Raman signals of the dust mite in the dust are in compliance with the Raman signals of the internal label of dust mite antigen Der f1 or the Raman signals of the internal label of dust mite antigen Der p1.
Abstract
Description
Claims (3)
Applications Claiming Priority (2)
| Application Number | Priority Date | Filing Date | Title |
|---|---|---|---|
| TW107117819 | 2018-05-24 | ||
| TW107117819A TWI686599B (en) | 2018-05-24 | 2018-05-24 | System and method for detection of dust mite antigens |
Publications (2)
| Publication Number | Publication Date |
|---|---|
| US20190360938A1 US20190360938A1 (en) | 2019-11-28 |
| US11719643B2 true US11719643B2 (en) | 2023-08-08 |
Family
ID=68614428
Family Applications (1)
| Application Number | Title | Priority Date | Filing Date |
|---|---|---|---|
| US16/422,178 Active 2042-06-08 US11719643B2 (en) | 2018-05-24 | 2019-05-24 | System and method for detection of dust mite antigens |
Country Status (2)
| Country | Link |
|---|---|
| US (1) | US11719643B2 (en) |
| TW (1) | TWI686599B (en) |
Families Citing this family (2)
| Publication number | Priority date | Publication date | Assignee | Title |
|---|---|---|---|---|
| CN113130008A (en) * | 2019-12-31 | 2021-07-16 | 科美诊断技术股份有限公司 | Test result determination method and device |
| CN113418905B (en) * | 2021-07-28 | 2023-04-21 | 中国药科大学 | Detection method for detecting surface enhanced Raman spectrum of ocean toxin GYM based on cross-network silver nanowire AgNW |
Citations (4)
| Publication number | Priority date | Publication date | Assignee | Title |
|---|---|---|---|---|
| US7192703B2 (en) | 2003-02-14 | 2007-03-20 | Intel Corporation, Inc. | Biomolecule analysis by rolling circle amplification and SERS detection |
| US20110116089A1 (en) * | 2009-10-23 | 2011-05-19 | Michael Stenbaek Schmidt | Sers substrate and a method of providing a sers substrate |
| WO2013065016A1 (en) * | 2011-11-02 | 2013-05-10 | University Of Cape Town | A method of detecting and/or quantifying an analyte in a biological sample |
| TWM523295U (en) | 2015-09-04 | 2016-06-11 | Tanto Bio Co Ltd | Mite-trapping device |
Family Cites Families (4)
| Publication number | Priority date | Publication date | Assignee | Title |
|---|---|---|---|---|
| TWI409457B (en) * | 2008-06-16 | 2013-09-21 | Ind Tech Res Inst | Surface enhanced resonance raman scattering spectroscopy (serrs) nanoparticle probes and methods of use |
| EP2516995B1 (en) * | 2009-12-22 | 2016-10-26 | Agency For Science, Technology And Research | Sers-based analyte detection |
| CN104101591A (en) * | 2014-07-24 | 2014-10-15 | 江西农业大学 | Fast detection method for surface enhanced Raman scattering of trace pesticide residues in oranges |
| EP3259286A4 (en) * | 2015-02-19 | 2018-07-11 | Ionica Sciences | Reagents and methods for detecting infectious diseases |
-
2018
- 2018-05-24 TW TW107117819A patent/TWI686599B/en active
-
2019
- 2019-05-24 US US16/422,178 patent/US11719643B2/en active Active
Patent Citations (4)
| Publication number | Priority date | Publication date | Assignee | Title |
|---|---|---|---|---|
| US7192703B2 (en) | 2003-02-14 | 2007-03-20 | Intel Corporation, Inc. | Biomolecule analysis by rolling circle amplification and SERS detection |
| US20110116089A1 (en) * | 2009-10-23 | 2011-05-19 | Michael Stenbaek Schmidt | Sers substrate and a method of providing a sers substrate |
| WO2013065016A1 (en) * | 2011-11-02 | 2013-05-10 | University Of Cape Town | A method of detecting and/or quantifying an analyte in a biological sample |
| TWM523295U (en) | 2015-09-04 | 2016-06-11 | Tanto Bio Co Ltd | Mite-trapping device |
Non-Patent Citations (2)
| Title |
|---|
| Gartia et al ("Rigorous surface enhanced Raman spectral characterization of large-area high-uniformity silver-coted tapered silica nanopillar arrays", Nanotechnology, 21 (2010), 395701, p. 1-9) (Year: 2010). * |
| Shen et al ("Electrochemical aptasensor for detecting Der p2 allergen using polycarbonate-based double-generation gold nanoparticle chip", Sensing and Bio-Sensing Research 13 (2017), 75-80 (Year: 2017). * |
Also Published As
| Publication number | Publication date |
|---|---|
| TW202004167A (en) | 2020-01-16 |
| TWI686599B (en) | 2020-03-01 |
| US20190360938A1 (en) | 2019-11-28 |
Similar Documents
| Publication | Publication Date | Title |
|---|---|---|
| US7186990B2 (en) | Method and apparatus for detecting and imaging the presence of biological materials | |
| US11719643B2 (en) | System and method for detection of dust mite antigens | |
| Obahiagbon et al. | A compact, low-cost, quantitative and multiplexed fluorescence detection platform for point-of-care applications | |
| CA2442359A1 (en) | Optical biological measurement system using scraping means to collect the sample | |
| JPH06201704A (en) | Improved testing tool and method for whole blood assay with regard to hdl cholesterol | |
| EA200801869A1 (en) | METHOD AND DEVICE OF BOTTOM SPECTROMETRY USING REJECTABLE OPTICAL FILTERS | |
| WO2017016281A1 (en) | Method of detecting target molecule concentration | |
| EP2233923A1 (en) | Method and apparatus for the characterisation of the coagulation dynamics or sedimentation of blood or blood serum | |
| CN102749452A (en) | Near-infrared electro-generated chemiluminescence immunodetection method | |
| WO2021179622A1 (en) | Digital plasma immunosorbent kit, manufacturing method therefor and detection method therefor | |
| US9506921B2 (en) | Method for determining exposure to mycobacteria | |
| EP0713089A2 (en) | Two-dimensional solid phase assay | |
| JP4812962B2 (en) | Specific microorganism measuring method and specific microorganism measuring apparatus | |
| JP4268358B2 (en) | Antibody and immunological assay | |
| JP4959330B2 (en) | Method and device for detecting very small amounts of particles | |
| JP2014178151A (en) | Microorganism detection method and device using microsphere resonance sensor | |
| CN112285090A (en) | Portable confocal unicellular Raman scattering detecting system | |
| JP2002340901A (en) | Specific microorganism weighing instrument | |
| Yamada et al. | based surfaced enhanced Raman spectroscopy for drug level testing with tear fluid | |
| CN113281504B (en) | Novel immunochromatography detection device | |
| JPH11183381A (en) | Fluorescence microscope evaluating method and device | |
| US20210405050A1 (en) | Sensor | |
| Ditcham et al. | An immunosensor with potential for the detection of viral antigens in body fluids, based on surface second harmonic generation | |
| Ruberti et al. | Continuous Flow Air Sampling and Rapid Pathogen Detection System | |
| US20210333278A1 (en) | Viral respiratory infection detection device |
Legal Events
| Date | Code | Title | Description |
|---|---|---|---|
| FEPP | Fee payment procedure |
Free format text: ENTITY STATUS SET TO UNDISCOUNTED (ORIGINAL EVENT CODE: BIG.); ENTITY STATUS OF PATENT OWNER: SMALL ENTITY |
|
| FEPP | Fee payment procedure |
Free format text: ENTITY STATUS SET TO SMALL (ORIGINAL EVENT CODE: SMAL); ENTITY STATUS OF PATENT OWNER: SMALL ENTITY |
|
| AS | Assignment |
Owner name: NATIONAL TSING HUA UNIVERSITY, TAIWAN Free format text: ASSIGNMENT OF ASSIGNORS INTEREST;ASSIGNORS:CHUANG, CHUN-YU;YEH, PIN-HSUAN;REEL/FRAME:049421/0266 Effective date: 20190515 |
|
| STPP | Information on status: patent application and granting procedure in general |
Free format text: DOCKETED NEW CASE - READY FOR EXAMINATION |
|
| AS | Assignment |
Owner name: NATIONAL TSING HUA UNIVERSITY, TAIWAN Free format text: CORRECTIVE ASSIGNMENT TO CORRECT THE LISTED ASSIGNOR'S NAMES AND ASSIGNMENT PAGES ATTACHED PREVIOUSLY RECORDED AT REEL: 049421 FRAME: 0266. ASSIGNOR(S) HEREBY CONFIRMS THE ASSIGNMENT;ASSIGNORS:CHUANG, CHUN-YU;YEH, PIN-HSUAN;TSEN, CHAO-MING;AND OTHERS;SIGNING DATES FROM 20190514 TO 20190520;REEL/FRAME:050229/0525 |
|
| AS | Assignment |
Owner name: NATIONAL TSING HUA UNIVERSITY, TAIWAN Free format text: ASSIGNMENT OF ASSIGNORS INTEREST;ASSIGNOR:PHANSCO;REEL/FRAME:050341/0651 Effective date: 20190730 |
|
| STPP | Information on status: patent application and granting procedure in general |
Free format text: NON FINAL ACTION MAILED |
|
| STPP | Information on status: patent application and granting procedure in general |
Free format text: RESPONSE TO NON-FINAL OFFICE ACTION ENTERED AND FORWARDED TO EXAMINER |
|
| STPP | Information on status: patent application and granting procedure in general |
Free format text: NON FINAL ACTION MAILED |
|
| STPP | Information on status: patent application and granting procedure in general |
Free format text: PUBLICATIONS -- ISSUE FEE PAYMENT VERIFIED |
|
| STCF | Information on status: patent grant |
Free format text: PATENTED CASE |