US11547330B2 - Apparatus and methods for probing sensor operation of continuous analyte sensing and auto-calibration - Google Patents
Apparatus and methods for probing sensor operation of continuous analyte sensing and auto-calibration Download PDFInfo
- Publication number
- US11547330B2 US11547330B2 US16/783,080 US202016783080A US11547330B2 US 11547330 B2 US11547330 B2 US 11547330B2 US 202016783080 A US202016783080 A US 202016783080A US 11547330 B2 US11547330 B2 US 11547330B2
- Authority
- US
- United States
- Prior art keywords
- sensor
- cam sensor
- probing
- operating voltage
- voltage
- Prior art date
- Legal status (The legal status is an assumption and is not a legal conclusion. Google has not performed a legal analysis and makes no representation as to the accuracy of the status listed.)
- Active, expires
Links
Images


Classifications
-
- A—HUMAN NECESSITIES
- A61—MEDICAL OR VETERINARY SCIENCE; HYGIENE
- A61B—DIAGNOSIS; SURGERY; IDENTIFICATION
- A61B5/00—Measuring for diagnostic purposes; Identification of persons
- A61B5/145—Measuring characteristics of blood in vivo, e.g. gas concentration or pH-value ; Measuring characteristics of body fluids or tissues, e.g. interstitial fluid or cerebral tissue
- A61B5/14532—Measuring characteristics of blood in vivo, e.g. gas concentration or pH-value ; Measuring characteristics of body fluids or tissues, e.g. interstitial fluid or cerebral tissue for measuring glucose, e.g. by tissue impedance measurement
-
- A—HUMAN NECESSITIES
- A61—MEDICAL OR VETERINARY SCIENCE; HYGIENE
- A61B—DIAGNOSIS; SURGERY; IDENTIFICATION
- A61B5/00—Measuring for diagnostic purposes; Identification of persons
- A61B5/0002—Remote monitoring of patients using telemetry, e.g. transmission of vital signals via a communication network
- A61B5/0015—Remote monitoring of patients using telemetry, e.g. transmission of vital signals via a communication network characterised by features of the telemetry system
- A61B5/002—Monitoring the patient using a local or closed circuit, e.g. in a room or building
-
- A—HUMAN NECESSITIES
- A61—MEDICAL OR VETERINARY SCIENCE; HYGIENE
- A61B—DIAGNOSIS; SURGERY; IDENTIFICATION
- A61B5/00—Measuring for diagnostic purposes; Identification of persons
- A61B5/01—Measuring temperature of body parts ; Diagnostic temperature sensing, e.g. for malignant or inflamed tissue
-
- A—HUMAN NECESSITIES
- A61—MEDICAL OR VETERINARY SCIENCE; HYGIENE
- A61B—DIAGNOSIS; SURGERY; IDENTIFICATION
- A61B5/00—Measuring for diagnostic purposes; Identification of persons
- A61B5/145—Measuring characteristics of blood in vivo, e.g. gas concentration or pH-value ; Measuring characteristics of body fluids or tissues, e.g. interstitial fluid or cerebral tissue
- A61B5/1468—Measuring characteristics of blood in vivo, e.g. gas concentration or pH-value ; Measuring characteristics of body fluids or tissues, e.g. interstitial fluid or cerebral tissue using chemical or electrochemical methods, e.g. by polarographic means
- A61B5/1486—Measuring characteristics of blood in vivo, e.g. gas concentration or pH-value ; Measuring characteristics of body fluids or tissues, e.g. interstitial fluid or cerebral tissue using chemical or electrochemical methods, e.g. by polarographic means using enzyme electrodes, e.g. with immobilised oxidase
-
- A—HUMAN NECESSITIES
- A61—MEDICAL OR VETERINARY SCIENCE; HYGIENE
- A61B—DIAGNOSIS; SURGERY; IDENTIFICATION
- A61B5/00—Measuring for diagnostic purposes; Identification of persons
- A61B5/145—Measuring characteristics of blood in vivo, e.g. gas concentration or pH-value ; Measuring characteristics of body fluids or tissues, e.g. interstitial fluid or cerebral tissue
- A61B5/1495—Calibrating or testing of in-vivo probes
-
- A—HUMAN NECESSITIES
- A61—MEDICAL OR VETERINARY SCIENCE; HYGIENE
- A61B—DIAGNOSIS; SURGERY; IDENTIFICATION
- A61B5/00—Measuring for diagnostic purposes; Identification of persons
- A61B5/68—Arrangements of detecting, measuring or recording means, e.g. sensors, in relation to patient
- A61B5/6801—Arrangements of detecting, measuring or recording means, e.g. sensors, in relation to patient specially adapted to be attached to or worn on the body surface
-
- A—HUMAN NECESSITIES
- A61—MEDICAL OR VETERINARY SCIENCE; HYGIENE
- A61B—DIAGNOSIS; SURGERY; IDENTIFICATION
- A61B5/00—Measuring for diagnostic purposes; Identification of persons
- A61B5/68—Arrangements of detecting, measuring or recording means, e.g. sensors, in relation to patient
- A61B5/6846—Arrangements of detecting, measuring or recording means, e.g. sensors, in relation to patient specially adapted to be brought in contact with an internal body part, i.e. invasive
- A61B5/6847—Arrangements of detecting, measuring or recording means, e.g. sensors, in relation to patient specially adapted to be brought in contact with an internal body part, i.e. invasive mounted on an invasive device
- A61B5/686—Permanently implanted devices, e.g. pacemakers, other stimulators, biochips
-
- A—HUMAN NECESSITIES
- A61—MEDICAL OR VETERINARY SCIENCE; HYGIENE
- A61B—DIAGNOSIS; SURGERY; IDENTIFICATION
- A61B2560/00—Constructional details of operational features of apparatus; Accessories for medical measuring apparatus
- A61B2560/02—Operational features
- A61B2560/0223—Operational features of calibration, e.g. protocols for calibrating sensors
- A61B2560/0238—Means for recording calibration data
-
- A—HUMAN NECESSITIES
- A61—MEDICAL OR VETERINARY SCIENCE; HYGIENE
- A61B—DIAGNOSIS; SURGERY; IDENTIFICATION
- A61B2560/00—Constructional details of operational features of apparatus; Accessories for medical measuring apparatus
- A61B2560/04—Constructional details of apparatus
- A61B2560/0443—Modular apparatus
-
- A—HUMAN NECESSITIES
- A61—MEDICAL OR VETERINARY SCIENCE; HYGIENE
- A61M—DEVICES FOR INTRODUCING MEDIA INTO, OR ONTO, THE BODY; DEVICES FOR TRANSDUCING BODY MEDIA OR FOR TAKING MEDIA FROM THE BODY; DEVICES FOR PRODUCING OR ENDING SLEEP OR STUPOR
- A61M5/00—Devices for bringing media into the body in a subcutaneous, intra-vascular or intramuscular way; Accessories therefor, e.g. filling or cleaning devices, arm-rests
- A61M5/14—Infusion devices, e.g. infusing by gravity; Blood infusion; Accessories therefor
- A61M5/168—Means for controlling media flow to the body or for metering media to the body, e.g. drip meters, counters ; Monitoring media flow to the body
- A61M5/172—Means for controlling media flow to the body or for metering media to the body, e.g. drip meters, counters ; Monitoring media flow to the body electrical or electronic
- A61M5/1723—Means for controlling media flow to the body or for metering media to the body, e.g. drip meters, counters ; Monitoring media flow to the body electrical or electronic using feedback of body parameters, e.g. blood-sugar, pressure
- A61M2005/1726—Means for controlling media flow to the body or for metering media to the body, e.g. drip meters, counters ; Monitoring media flow to the body electrical or electronic using feedback of body parameters, e.g. blood-sugar, pressure the body parameters being measured at, or proximate to, the infusion site
Definitions
- Continuous analyte sensing in an in-vivo or in-vitro sample has become a routine sensing operation in the field of medical devices, and more specifically, in diabetes care.
- CGM continuous glucose monitoring
- the sample's temperature and hematocrit of the blood sample may be major sources of error.
- sensors deployed in a non-whole blood environment with relatively constant temperatures such as sensors used in a continuous in-vivo sensing operation, other sensor error sources may exist.
- a method of compensating for errors during continuous glucose monitoring (CGM) measurements includes providing a CGM device including a sensor, a memory and a processor; applying a constant voltage potential to the sensor, measuring primary current signals resulting from the constant voltage potential and storing measured primary current signals in the memory; between measurements of primary current signals, applying a probing potential modulation sequence to the sensor, measuring probing potential modulation current signals resulting from the probing potential modulation sequence and storing measured probing potential modulation current signals in the memory; and for each primary current signal, employing the primary current signal and a plurality of the measured probing potential modulation current signals associated with the primary current signal to determine a glucose value.
- CGM continuous glucose monitoring
- a method of making a continuous glucose monitoring (CGM) device includes creating a prediction equation based on a plurality of probing potential modulation current signals measured for a reference CGM sensor in response to a probing potential modulation sequence applied to the reference CGM sensor before or after primary current signals are measured for the reference CGM sensor; providing a CGM device including a sensor, a memory and a processor; storing the prediction equation in the memory of the CGM device; storing computer program code in the memory of the CGM device that, when executed by the processor, causes the CGM device to (a) apply a constant voltage potential to the sensor, measure primary current signals resulting from the constant voltage potential and store measured primary current signals in the memory; (b) between measurements of primary current signals, apply a probing potential modulation sequence to the sensor, measure probing potential modulation current signals resulting from the probing potential modulation sequence and store measured probing potential modulation current signals in the memory; (c) for each primary current signal, employ the primary current signal, a plurality of the
- a continuous glucose monitoring (CGM) device includes a wearable portion having a sensor configured to produce current signals from interstitial fluid; a processor; a memory coupled to the processor; and transmitter circuitry coupled to the processor.
- the memory includes a prediction equation based on primary current signals generated by application of a constant voltage potential applied to a reference sensor, and a plurality of probing potential modulation current signals generated by application of a probing potential modulation sequence applied between primary current signal measurements.
- the memory also includes computer program code stored therein that, when executed by the processor, causes the CGM device to (a) measure and store a primary current signal using the sensor and memory of the wearable portion; (b) measure and store a plurality of probing potential modulation current signals associated with the primary current signal; (c) employ the primary current signal, the plurality of probing potential modulation current signals and the stored prediction equation to compute a glucose value; and (d) communicate the glucose value to a user of the CGM device.
- a method of determining analyte concentrations during continuous monitoring measurements includes inserting a biosensor subcutaneously into a subject, the biosensor including a counter electrode, a reference electrode and a working electrode having a chemical composition configured to oxidize a point-of-interest analyte; applying a constant voltage to the working electrode having the chemical composition so as to generate a continuous current flow from the working electrode; sensing and storing primary current signals from the working electrode into a memory; after sensing each primary current signal, applying a probing potential modulation sequence to the working electrode, and sensing and storing probing potential modulation currents generated in response to the probing potential modulation sequence into the memory; gathering a primary current signal and probing potential modulation currents generated after the primary current signal; and employing the gathered primary current signal and probing potential modulation currents to compute an analyte value.
- a method of probing a condition of a continuous analyte monitoring (CAM) sensor and of calibrating the sensor based thereon includes applying an operating voltage to the CAM sensor; probing a condition of the CAM sensor by applying at least one voltage step greater than the operating voltage and at least one voltage step less than the operating voltage; measuring output currents of the CAM sensor in response to the probing; calculating calibration indices via ratios of the output currents; and calibrating the CAM sensor based on the calibration indices.
- CAM continuous analyte monitoring
- a continuous analyte monitoring (CAM) sensor apparatus includes a management unit including a wireless transmitter/receiver in communication with a wireless transmitter coupled to an on-body sensor, the management unit further comprising a processor, a memory, and software, wherein the processor and software are operative to (a) apply an operating voltage to the on-body sensor; (b) probe a condition of the on-body sensor by applying at least one voltage step greater than the operating voltage and at least one voltage step less than the operating voltage; (c) measure output currents of the on-body sensor in response to the probing; (d) calculate calibration indices via ratios of the output currents; and (e) calibrate the on-body sensor based on the calibration indices.
- a management unit including a wireless transmitter/receiver in communication with a wireless transmitter coupled to an on-body sensor, the management unit further comprising a processor, a memory, and software, wherein the processor and software are operative to (a) apply an operating voltage to the on-body sensor; (b)
- a method of applying probing potential modulation during continuous analyte monitoring for determination of analyte concentration includes applying a constant operating voltage to an analyte sensor during a continuous sensor operation; applying at least one probing potential modulation step different than the constant operating voltage in each cycle of the continuous sensor operation; measuring primary current from the constant operating voltage in each cycle and at least one companion probing potential modulation current in each cycle, responsive to analyte concentration; and determining analyte concentration from the primary current and the at least one companion probing potential modulation current from the at least one probing potential modulation step.
- a continuous analyte monitoring (CAM) device includes a wearable portion having a sensor configured to be subcutaneously inserted into a subject and to produce current signals from interstitial fluid; a processor; and a memory coupled to the processor.
- CAM continuous analyte monitoring
- the memory includes computer program code stored therein that, when executed by the processor, causes the CAM device to: (a) apply a constant voltage to the sensor so as to generate a primary current flow from the sensor; (b) sense and store primary current signals generated in response to the constant voltage into the memory; (c) between sensing primary current signals, apply a probing potential modulation sequence to the sensor, and sense and store probing potential modulation currents generated in response to the probing potential modulation sequence into the memory; and (d) employ primary current signals and probing potential modulation currents to compute analyte values over a time period of at least a week.
- the CAM device does not employ an in-situ calibration during the time period.
- FIG. 1 illustrates a graph of applied voltage E 0 for a continuous glucose monitoring (CGM) sensor versus time according to one or more embodiments of the disclosure.
- CGM continuous glucose monitoring
- FIG. 2 illustrates a graph of a CGM sensor's output current versus time according to one or more embodiments of the disclosure.
- FIG. 3 illustrates a graph of varying CGM sensor input potential modulation steps versus time during an initial probing period according to one or more embodiments of the disclosure.
- FIG. 4 illustrates a graph of varying CGM sensor input potential modulation steps versus time during an intermediate probing period according to one or more embodiments of the disclosure.
- FIG. 5 A illustrates a graph of a current-voltage relationship at and near a redox plateau for a redox species (mediator) according to one or more embodiments of the disclosure.
- FIGS. 6 A and 6 B illustrate block diagrams of CGM sensor apparatus according to one or more embodiments.
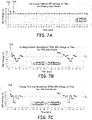
- FIGS. 7 B, 7 C, 7 D, 7 E and 7 F illustrate example sequences of probing potential modulations that may be employed in accordance with embodiments provided herein, wherein FIG. 7 B illustrates step-wise probing potential modulations, FIG. 7 C illustrates one step down/up probing potential modulations in two back-to-back sequences, FIG. 7 D illustrates asymmetrical step probing potential modulations, FIG. 7 E illustrates linear scan/triangle probing potential modulations and FIG. 7 F illustrates a one-step potential modulation followed by a direct step returning to a constant operating potential.
- FIG. 8 B is a graph of WE current versus time which illustrates decay of the probing potential modulations currents of FIG. 8 A in the first 6 hours following probing.
- FIG. 9 A is an example graph of working electrode (WE) current versus time generated by the probing potential modulations of FIG. 7 C in response to three consecutive cycles of probing potential modulations at a constant glucose concentration in accordance with embodiments provided herein.
- WE working electrode
- FIG. 9 B is a graph of WE current in response to the probing potential modulations of FIG. 7 C taken on seven different days (Day 1-Day 7) at a constant glucose concentration.
- FIG. 10 illustrates a graph of working electrode current versus probing potential modulation time in accordance with an example embodiment.
- FIG. 11 B is a graph of predicted glucose concentration versus time for the WE currents of FIG. 11 A based on a simple multi-variate regression.
- FIG. 11 D is a graph of predicted glucose concentration versus glucose solution concentration based on the WE currents of FIG. 11 C (which were determined using probing potential modulations).
- FIG. 11 E is a graph of WE current versus glucose solution concentration illustrating response lines for linearity at four levels of acetaminophen without probing potential modulations (nppm).
- FIG. 11 F is a graph of predicted glucose concentration versus glucose solution concentration based on the WE currents of FIG. 11 E (which were determined without using probing potential modulations).
- FIG. 12 A illustrates a graph of working electrode current versus elapsed time for three sensors subjected to probing potential modulations (sensor ppm-1, ppm-2 and ppm-3) and one sensor subjected to no probing potential modulations (sensor nppm-1) in accordance with embodiments provided herein.
- FIG. 12 B illustrates working electrode current versus glucose concentration for three sensors (ppm-1, ppm-2, ppm-3) at day-7 in accordance with embodiments provided herein.
- FIG. 12 D which illustrates working electrode (primary current) of three sensors with temperature variations during a portion of day-9 of long-term monitoring in accordance with embodiments provided herein.
- FIGS. 13 E and 13 F illustrates reduction of sensitivity effects between different sensors through use of probing potential modulations in accordance with embodiments provided herein.
- FIG. 14 B illustrates a high-level block diagram of another example CGM device in accordance with embodiments provided herein.
- Such methods and apparatus may allow analyte concentration determinations while (1) overcoming the effects of different background interfering signals, (2) levelling or removing the effects of different sensor sensitivities, (3) shortening the warmup time at the beginning of a (long-term) continuous monitoring process, (4) correcting sensor sensitivity changes over the continuous monitoring process, and/or (5) correcting the effects of temperature on sensor output currents.
- FIG. 1 also shows the positions in time for the initial probing and the intermediate probing using the probing potential modulations.
- Example probing potential modulations are further illustrated in FIGS. 3 and 4 .
- the probing potential modulations and their adjacent cluster potential steps may be further defined as follows:
- FIGS. 5 A and 5 B illustrate example relative potential steps (graph 500 A) and the typical current behaviors (graph 500 B) during the back/forth potential steps described above.
- the potential E 2 is designed to set the mediator in a partial reduced state.
- the ratio of the potential step ending currents i 1,t /i 2,t may provide an assessment of the sensor condition and sensitivity. That is, i 1,t (i 0,t , i 3,t as well) provides the diffusion limited current from the oxidizing of the reduced state of the mediator, while i 2,t provides the kinetic current which is related to the sensor sensitivity.
- Additional potential steps may include a forward potential step E 3 higher than or equal to E 0 , but lower than E 1 , and another reverse potential step to return to E 0 from E 3 .
- This probing potential sequence is designed to have a minimal perturbation to the on-going current monitoring at a fixed potential E 0 after the final probing potential step returns to E 0 . After the probing potential modulations, the regular current record frequency may resume
- the timing of one probing sequence including the multiple probing potential modulations may be in an order of 5-100 seconds where each potential step may have a duration of 1-20 seconds with equal or unequal step size for the individual steps.
- This one probing period may be separated by a rest period of 1-30 minutes, for example.
- An example of such a probing scheme may be represented by a probing period of 30 sec for a probing group of 3-5 steps, separated by a rest period of 14.5 minutes, with one probing cycle being in 15 minutes.
- the long-term sensor response currents may be measured at a frequency of every 1-15 minutes
- the current sampling interval of the probing potential modulations may be in the order of 0.1-5 sec, depending on the step duration of the probing potential modulations.
- i 1,t /i 1,0 i 2,t /i 2,0 , i 3,t /i 3,0 , and i 4,t /i 4,0 , where i n,0 is the initial step current and i n,t is the ending step current at time t of each potential step.
- These decay constants may reflect the sensor sensitivity changes, or the sensor's enzyme/membrane condition changes during the break-in time.
- the factory calibration may be based not only on the response curve for the sensor (e.g., calibration constant sets of slope and intercept, the coefficients of a polynomial equation that relates sensor current signals and analyte concentrations, etc.), but also based on the calibration indices obtained from probing potential modulations.
- calibration constants of slope and intercept may only be obtained with in-vitro dosing of reference concentrations of the analyte
- the calibration indices described herein may be generated through in-situ potential modulation (or other types of probing potential modulations) with potential steps higher and lower the operation potential E 0 , which are added as additional calibration elements to the factory calibration.
- calibration constants may include multiple sets of slope and intercept, and calibration indices may be correlated with the different sets of slope and intercept. These constants and indices may be stored in the sensor system's memory for in-situ calibration during the sensor operation.
- Initial probing If a probing scheme is applied every 15 minutes, and while returning to the normal applied voltage E 0 afterwards, the first hour will provide four different sets of indices characteristic of the sensor, where different calibration constants may be applied to predict the glucose concentrations within such a short period. As probing indices generated from the four consecutive probing potential modulations change along the break-in time, a trend for the initial decay currents may be established to predict the following current behavior and thus provide the glucose determination based on the trending of the probing indices and the factory calibration constants, even when the general current behavior is still decaying. This approach may help to shorten the overall sensor break-in/warmup time from about 3 hours to 1 hour in some embodiments. Initial probing may be performed at other time periods (e.g., time periods less than every 15 minutes or greater than every 15 minutes so that fewer or more than four different sets of indices characteristic of the sensor may be obtained).
- time periods e.g., time periods less than every 15 minutes or greater than every 15 minutes so that fewer or more
- the probing potential modulations may be applied periodically on a daily basis to provide an anchor to the long-term monitoring currents. For example, one or more sets of probing potential modulations may be applied when the sensor is at a relatively low variation state. When the probing indices generated from the probing potential modulations show a change in the sensor sensitivity, sensitivity adjustments may be applied to correct for the change. This is a step of in-situ calibration (internal calibration).
- the probing potential modulations scheme may be applied as a routine such as initially, or may be applied periodically.
- the application of probing potential modulations may employ some built-in intelligence (e.g., software operating on a microprocessor of a management unit of a CGM sensor) for initiating the potential modulations and performing the calculations of the indices to be used for in-situ sensor calibration.
- built-in intelligence e.g., software operating on a microprocessor of a management unit of a CGM sensor
- management unit 602 also includes an antenna 612 , a processor 614 (which may be, e.g., a microprocessor), a memory 616 , software 618 , a rechargeable battery 620 , a battery charger 622 , an analog interface 624 , and a cable connector 626 .
- the processor 614 , memory 616 , and software 618 are operative to perform the probing of a CGM sensor (e.g., on-body sensor 607 ) with respect to its sensitivity or operating conditions, the extracting and storing of sensitivity indices for the CGM sensor's operating conditions, and the in-situ calibration adjustment as needed of CGM apparatus 600 as described above.
- a CGM sensor e.g., on-body sensor 607
- Embodiments described herein employ probing potential modulations as periodic perturbations to the otherwise constant voltage potential applied to the working electrode of a subcutaneous biosensor in a continuous sensing operation (e.g., for monitoring biological sample analyte such as glucose). While the previous embodiments describe use of probing potential modulations during an initial time period after insertion of a sensor, and at intermediate time periods, probing potential modulations may be used at other time periods. For example, during a continuous sensing operation, such as continuous glucose monitoring, sensor working electrode current is typically sampled every 3-15 minutes (or at some other frequency) for glucose value determinations. These current measurements represent the primary currents and/or primary data points used for analyte determinations during continuous sensing operation. In some embodiments, periodic cycles of probing potential modulations may be employed after each primary current measurement so that a group of self-sufficient currents accompanies each primary data point with information about the sensor/electrode status and/or condition.
- sensor current signals from application of a constant potential to a sensor provide little information relevant to issues associated with long-term continuous monitoring by the sensor, such as lot-to-lot sensitivity variations, the long warmup time due to initial signal decay, sensor sensitivity changes over a long-term monitoring process, effects from varying background interfering signals, or the like.
- Embodiments described herein include systems and methods for applying probing potential modulations on top of the otherwise constant voltage applied to an analyte sensor. Methods are provided for formulating parameters for a prediction equation that may be employed to accurately determine analyte concentrations continuously from an analyte sensor. Furthermore, methods of and systems for determining analyte concentrations with the use of probing potential modulation (ppm) self-sufficient signals are provided.
- probing potential modulation ppm
- FIGS. 7 B, 7 C, 7 D, 7 E and 7 F illustrate example sequences of probing potential modulations that may be employed in accordance with embodiments provided herein.
- the triangles on top of the potential profiles denote the times at which probing potential modulation currents are measured, as examples in this embodiment.
- FIG. 7 B illustrates step-wise probing potential modulations
- FIG. 7 C illustrates one step down/up probing potential modulations in two back-to-back sequences
- FIG. 7 D illustrates asymmetrical step probing potential modulations
- FIG. 7 E illustrates linear scan/triangle probing potential modulations
- FIG. 7 F illustrates a one-step potential modulation followed by a direct step returning to the constant operating potential, respectively.
- Other probing potential modulations types may be used.
- primary volt denotes the constant applied potential under the normal sensor operation
- primary data denotes the timing of the primary data points (e.g., current signals) recorded periodically as being indicative of the analyte concentration
- primary data denotes the timing of the primary data points (e.g., current signals) recorded periodically as being indicative of the analyte concentration
- probing volt denotes the probing potential modulation potentials applied as perturbation to the primary/constant applied potential
- probing data denotes the timing of the current signals generated by probing potential modulations and recorded at a specified sampling rate. While FIGS. 7 B- 7 E illustrate probing potential modulations of 4 or more steps, it will be understood that few or more probing potential modulation steps may be used (e.g., 1, 2, 3, 4, 5, 6, 7, 8, etc.).
- Probing potential modulations may be applied before or after primary data points are measured.
- probing potential modulations are applied to a sensor immediately after each primary data point is measured (e.g., after a primary data point is measured at 3 minutes, 6 minutes, 9 minutes, etc.).
- probing potential modulations may be applied prior to measuring a primary data point (e.g., assuming the primary data point is not measured until probing potential modulation current has decayed away). In some embodiments, probing potential modulations maybe applied prior to and after measuring a primary data point.
- Steps 1-6 six voltage steps (Steps 1-6) may be employed after each primary data point is measured. In the embodiment shown, each step lasts 6 seconds and the resulting working electrode current signal is measured every 2 seconds (resulting in the measurement of 3 current signals per potential step). Other steps in voltage, step durations and/or sampling rates may be used.
- Step 6 a constant voltage of 0.55V is resumed until the next primary data point is measured and the probing potential modulation sequence is repeated.
- Steps 1-4 four voltage steps (Steps 1-4) may be employed after each primary data point is measured.
- each step lasts 6 seconds and the resulting working electrode current signal is measured every 2 seconds (resulting in the measurement of 3 current signals per potential step).
- Other steps in voltage, step durations and/or sampling rates may be used.
- Step 4 a constant voltage of 0.55V is resumed until the next primary data point is measured and the probing potential modulation sequence is repeated.
- Steps 1-6 six linearly changing voltage steps (Steps 1-6) may be employed after each primary data point is measured. In the embodiment shown, each step lasts 6 seconds and the resulting working electrode current signal is measured every 2 seconds (resulting in the measurement of 3 current signals per potential step). Other steps in voltage, step durations and/or sampling rates may be used.
- Step 6 a constant voltage of 0.55V is resumed until the next primary data point is measured and the probing potential modulation sequence is repeated.
- timing and/or applied voltages may be used.
- other potential step sequences for different biosensor mediators may be devised.
- one potential modulation step is applied to the working electrode, followed by directly returning to the original constant voltage of 0.55V.
- FIG. 8 A is an example graph of working electrode (WE) current versus time generated by the probing potential modulations of FIG. 7 B during the first cycle of the probing potential modulations in accordance with embodiments provided herein.
- WE working electrode
- FIG. 8 B is a graph of WE current versus time which illustrates decay of the probing potential modulation currents of FIG. 8 A in the first 6 hours. A sample rate of 1-second/point was employed throughout.
- FIG. 8 B provides an overall view of all probing potential modulation (PPM) currents where the outer contour of the profile shows a clear decay behavior, indicating that PPM currents have embedded information about the decay nature of sensor currents after sensor insertion and activation.
- PPM probing potential modulation
- PPM currents may be used as self-sufficient information to correct for the transient nature of sensor sensitivity. Warmup time may then be shortened, as shown below, instead of waiting for a sensor to reach a meta-steady state.
- FIG. 9 A is an example graph of working electrode (WE) current versus time generated by the probing potential modulations of FIG. 7 C in response to three consecutive cycles of probing potential modulations in accordance with embodiments provided herein.
- WE working electrode
- FIG. 9 B is a graph of WE current in response to the probing potential modulations of FIG. 7 C taken on seven different days (Day 1-Day 7). A sample rate of 1-second/point was employed throughout. A similar WE current response is observed throughout Day 1 and from Day 1 to Day 7.
- the current signals of the probing region and the non-probing potential modulation region may be measured at a fixed sampling rate such as 1-sec/point.
- different sampling rates may be employed.
- the primary data points may be measured at a slower sample rate of 1, 2, 3, 5, 10 or 15 minutes while the probing potential modulation currents may be measured at a sample rate of 0.5, 1, 2, 3 or 5 seconds within each potential step.
- the primary data points may be further measured as an average of multiple signals at the constant applied voltage within a close time range of the periodic sample time (e.g., every 3 minutes) such as within 60, 30, 20, 10, or 5 seconds, to reduce the random signal noise.
- the same may be done for the probing potential modulation currents within 0.1, 0.2 or 0.5 sec of the periodic sample time (e.g., every 1 second), depending on the A-D conversion speed.
- Other sample rates and/or sampling schemes may be used.
- the magnitudes of the probing potential modulation currents are substantially larger than the otherwise steady-state currents (the non-probing or “nppm” or “NPPM” currents measured without probing potential modulation perturbations).
- the goal of the probing potential modulations is to create perturbated output currents in a short time period to obtain sensor status/condition information while primary data points are measured without the effects of the probing potential modulations. That is, primary data points are measured when the WE current has returned to the otherwise flat current profile generated at the constant voltage E 0 .
- the probing potential modulations may be applied before or after a primary data point is measured.
- probing potential modulation output currents may be generated on at least one side of the otherwise flat current profile measured as a primary data point.
- probing potential modulation output currents may be generated on both sides of the otherwise flat current profile measured as a primary data point.
- negative and positive probing potential modulation output currents may be generated on both sides of the otherwise flat current profile measured as a primary data point.
- FIG. 10 illustrates a graph of working electrode current versus probing potential modulation time in accordance with an example embodiment.
- the probing potential modulation steps used to generate the working electrode currents of FIG. 10 are in the following sequence: a forward step from the fixed/constant voltage (e.g., 0.55 volts), followed by two reversed steps, followed by two forward steps, and finalized with a small reversed step to facilitate the returning to the constant potential (e.g., 0.55 Volt), similar to the probing potential modulation steps of FIG. 7 B .
- the probing potential modulation output currents may follow the primary current recorded at the constant potential of 0.55 Volt in one cycle, or the primary data point (as described with reference to FIG. 7 B , for example).
- i10, i11, i12, i13, 121, i22, i23, etc. may be referred to as i1.0, i1.1, i1.2, i2.1, i2.2, i2.3, etc.
- each primary data point may be accompanied by a group of ppm currents.
- the period of applying the probing potential modulations may vary from 1 minute up to several hours, and in some embodiments, from about 3-15 minutes when periodic analyte concentration is to be reported.
- the period of applying probing potential modulations is 3 minutes (e.g., after each primary data point is measured at 3 minute intervals). The minimum time between primary data points may be set based on how soon the output current from the constant potential stabilizes after each probing potential modulation cycle, for example.
- the acetaminophen concentration of 0.2 mg/dL is considered to be equivalent to a normal level of interfering background signal while 0.6 mg/dL is considered to be a high level.
- the 1.2 mg/dL and 1.8 mg/dL acetaminophen concentrations are considered to be extremely high levels.
- FIG. 11 B is a graph of predicted glucose concentrations versus time for the WE currents of FIG. 11 A based on a simple multi-variate regression.
- FIG. 11 C is a graph of WE current versus glucose solution concentration illustrating response lines for linearity at four levels of acetaminophen with probing potential modulations (ppm) as described herein.
- FIG. 11 D is a graph of predicted glucose concentration versus glucose solution concentration based on the WE currents of FIG. 11 C (which were determined using probing potential modulations).
- FIG. 11 E is a graph of WE current versus glucose solution concentration illustrating response lines for linearity at four levels of acetaminophen without probing potential modulations (nppm).
- FIG. 11 B is a graph of predicted glucose concentrations versus time for the WE currents of FIG. 11 A based on a simple multi-variate regression.
- FIG. 11 C is a graph of WE current versus glucose solution concentration illustrating response lines for linearity at four levels of acetaminophen
- 11 F is a graph of predicted glucose concentration versus glucose solution concentration based on the WE currents of FIG. 11 E (which were determined without using ppm currents). Linear regression equations are shown progressively from lower to upper lines in FIGS. 11 C, 11 D, 11 E and 11 F for the four lines corresponding to the four levels of acetaminophen (AA) with increasing intercepts representing the influence from the increasing acetaminophen level.
- AA acetaminophen
- the primary data point profiles recorded at the 3-minute period are shown in FIG. 11 A with five glucose levels in each of four acetaminophen backgrounds.
- For probing potential modulation (ppm) data from the probing potential modulations only the primary data points are shown (in the same format as the no-probing potential modulation (nppm) data points). That is, only the responses of the constant operating voltage generated currents to the stimuli of the acetaminophen and glucose are shown for the ppm data in FIG. 11 A .
- the two sensors are shown to have different sensitivities, which is related to the individual sensor sensitivity from manufacturing, instead of being related to the PPM and no-PPM methods.
- ppm probing potential modulation
- nppm no-probing potential modulation
- a statistics software such as Minitab software available from Minitab, LLC of State College, Pa., may be employed for regression analysis, for example.
- the effect of increasing the background acetaminophen is most obvious in the intercepts for the response lines of the four linearity runs with a minor effect on the slopes being observed as shown in FIG. 11 C .
- the predicted glucose plot in FIG. 11 D shows the collapse of the four lines virtually into one where the prediction equation incorporates a large number of probing potential modulation (ppm) currents.
- the effect of different background acetaminophen levels was unable to be overcome by the primary data points only (without probing potential modulation data) where the four separate lines in the glucose signal response plot of FIG. 11 E are converted to four separate lines of predicted glucose in FIG. 11 F .
- This comparison shows that the probing potential modulation currents provide rich information to correct for the effect due to background signal variations while the currents from a constant applied voltage are highly susceptible to the background signal variations.
- nppm no-probing potential modulation
- ppm probing potential modulation
- the probing potential modulation (ppm) currents of significance were from voltage steps 1 through 5.
- these probing potential modulation (ppm) currents are self-sufficient information currents which have subtle correlations with different effects for the sensor and/or the working electrode output currents. Subsequently, these probing potential modulation (ppm) currents help formulate a prediction equation for glucose that corrects for different background signals from four levels of acetaminophen.
- Primary current is the current responsive to the constant voltage potential applied to the working electrode.
- the primary current is typically measured prior to application of any probing potential modulations, for example. That is, in some embodiments, probing potential modulations are applied to the working electrode after the primary current has been measured. Any number of probing potential modulation steps may be applied (e.g., 1, 2, 3, 4, 5, 6, etc.).
- Application of a probing potential modulation step causes a non-linear response in working electrode current, which may be measured at multiple times as the response current varies (e.g., 2, 3, 4 or more times) as described previously with reference to FIGS. 7 B- 7 E .
- probing potential modulation currents are labeled as ixy, where x denotes the voltage step and y denotes at what location (e.g., time) within the voltage step the current is measured.
- i11 is the first current of the three currents recorded during the first voltage step
- i13 is the third current of the three currents recorded during the first voltage step
- i63 is the third current of the three currents recorded during the sixth voltage step.
- i10 is the primary current or current measured at time 0 before probing potential modulations are applied.
- ppm probing potential modulation
- the currents that are generated at different potential modulation steps are different than the generally constant output currents from the constant operating voltage used for measuring primary data points.
- ppm currents are correlated with i10 in different ways.
- FIGS. 11 G and 11 H two graphs of the initial and ending potential modulation current correlations are shown in FIGS. 11 G and 11 H for an acetaminophen background level of 0.2 mg/dL, as provided herein.
- G_ref ⁇ _ppm ⁇ ⁇ ( mg / dL ) 39.07108 - 11.663917 * i ⁇ ⁇ 11 _ + 18.212602 * i ⁇ ⁇ 13 _ - 9.318668 * i ⁇ ⁇ 21 _ + 13.896986 * i ⁇ ⁇ 22 _ - 9.519628 * i ⁇ ⁇ 23 _ - 1.947934 * i ⁇ ⁇ 31 _ + 13.389696 * i ⁇ ⁇ 32 _ - 12.395404 * i ⁇ ⁇ 33 _ - 2.851515 * i ⁇ ⁇ 41 _ + 9.183032 * i ⁇ ⁇ 42 _ - 2.944314 * i ⁇ ⁇ 51 _ ( 4 )
- equations (3) and (4) are merely examples. Other prediction equations may be used.
- three CGM sensors were subjected to a long-term (17 day) stability monitoring with probing potential modulations applied every 3-minutes periodically, along with a CGM sensor in the same monitoring employed without the probing potential modulations.
- Three linearity runs were carried out at time 0 (immediately after the start of the 17-day monitoring), day-7 and day-14.
- the CGM sensors were exposed to a constant glucose solution of 450 mg/dL.
- the raw current profiles of the primary data points for the four sensors are shown in FIG.
- FIG. 12 A which illustrates a graph of working electrode current versus elapsed time for three sensors subjected to probing potential modulations (sensor ppm-1, ppm-2 and ppm-3) and one sensor subjected to no probing potential modulations (sensor nppm-1). It can be seen that the three sensors employing probing potential modulations (ppm) and the sensor with no probing potential modulations (nppm) track with each other temporarily as working electrode current moves up and down. The relative sensitivities are maintained through the entire monitoring of 17 days. This plot of ppm currents and nppm currents shows that there is no long-term negative effect of probing potential modulation on the primary currents (the currents resulting from the constant operating voltage used to generate primary data points).
- the initial decay of the sensor currents is a natural tendency of CGM sensors that prevents glucose readings from being reported until a later time, for instance, 1, 2 or 3 or more hours after sensor insertion (see, FIG. 2 , for example).
- This initial quiescent time is referred to the CGM sensor's warmup time. If this warmup time can be reduced, the CGM system may provide glucose readings at a reasonably short time, such as 30 minutes, or even 15, 10, or 5 minutes following insertion.
- Sensitivity changes over monitoring time may be seen in FIG. 12 C , for example, which illustrates working electrode current versus glucose concentration for one of the sensors (sensor ppm-1) at day-1, day-7 and day-14 in accordance with embodiments provided herein. As shown in FIG. 12 C , the sensitivity of the sensor changes (e.g., decreases) over time.
- the input parameters may be the following types (which are defined below): (1) primary data point current i10 and probing potential modulation currents i11 to i63, (2) temperature cross terms of the primary data point current i10T and probing potential modulation (ppm) currents i11T to i63T, (3) probing potential modulation (ppm) current ratios R1, R2, R3, R4, R5 and R6 within each potential step for the six steps in the probing potential modulation sequence, (4) x-type parameters, (5) y-type parameters, (6) z-type parameters, and/or (7) the cross terms of the additional parameters. These terms are defined as followed:
- Probing currents The probing potential modulation currents i11, i12, i13, . . . , i61, i62, i63, wherein the first digit (x) of the ixy format denotes the potential step while the second digit (y) denotes which current measurement made after application of the potential step (e.g., the first, second or third measurement).
- Y-type parameters The general format for this type of parameter is given by the ending ppm current of a later potential step being divided by the first ppm current of an earlier potential step.
- parameter y61 is determined by i63/i11 where i63 is the ending ppm current of step 6 in the three recorded currents per step while i11 is the first ppm current of step 1.
- Equation 5 shows the regression equation for predicting glucose with the ppm data from the three sensors (ppm-1, ppm-2, ppm-3) in the 17-day long-term monitoring with three linearity runs of FIGS. 12 A-D .
- the different ratio parameters defined previously may also be selected and built into the prediction equation.
- the selected parameters in the resulting equation from this multi-variate regression are the probing currents and the related parameters, also referred to as “self-sufficient information” parameters, which are otherwise not available when only a constant voltage potential is used.
- the parameters and/or coefficients in Equation 5 are merely examples. Other number and/or types of parameters and/or coefficients may be used.
- G_ref ⁇ ⁇ ( mg / dL ) - 3428.448 + 27.64708 * i ⁇ ⁇ 10 _ - 19.990456 * i ⁇ ⁇ 11 _ + 5.820128 * i ⁇ ⁇ 13 _ - 1.933492 * i ⁇ ⁇ 21 _ + 5.18382 * i ⁇ ⁇ 31 _ - 5.131074 * i ⁇ ⁇ 32 _ - 3.451613 * i ⁇ ⁇ 33 _ + 5.493953 * i ⁇ ⁇ 41 _ + 23.541526 * i ⁇ ⁇ 43 _ + .41852 * i ⁇ ⁇ 51 _ - 1.125275 * i ⁇ ⁇ 10 ⁇ T _ + .673867 * i ⁇ ⁇ 11 ⁇ T _ + .196962 * i ⁇ ⁇ 21 ⁇ T _ - .202042 * i ⁇ ⁇ 31 ⁇ T
- FIG. 13 A- 13 F The results of the regression after applying Equation 5 to the data of FIGS. 12 A-D may be further demonstrated with improved glucose accuracy in FIG. 13 A- 13 F .
- FIG. 13 A shows the output glucose values over the 17 days where the differences in glucose values are reduced and the overall glucose accuracy increased with probing potential modulation signals feeding the predictive equation for glucose determination (Equation 5). Additionally, the wrinkles in the current profiles due to sensitivity changes and temperature effects over the 17-day monitoring are also smoothed out. Comparing FIGS. 12 B and 13 B , FIG.
- 13 B shows the three glucose response lines for sensors ppm-1, ppm-2 and ppm-3.
- the three sensors with widely different sensitivities produce glucose output lines virtually overlapping with each other, which further shows the leveling of the sensitivity differences among the three sensors. If sensors ppm-1, ppm-2 and ppm-3 represent three different release sensor lots from manufacturing, with sensitivities ranging ⁇ 25% from the center, then the methods provided herein of using the ppm currents for compensation demonstrate that these methods may accommodate the different sensor sensitivities, and produce high accuracy CGM glucose determinations, without having to relying on factory or in-situ calibration.
- FIGS. 12 C and 13 C unlike the initial non-linear behavior due to the slow warmup time in the order of 30-40 minutes of FIG. 12 C , the output glucose values shown in FIG. 13 C at the initial glucose of 50 mg/dL show no non-linear characteristics as these are removed due to the regression, thus making the initial startup time for providing accurate glucose readings as early as 5-10 minutes.
- the temperature effect shown in FIG. 12 D is shown to have been removed in FIG. 13 D and with the virtually overlapped glucose profiles from the three sensors ppm-1, ppm-2 and ppm-3.
- FIG. 13 E raw currents at the beginning of monitoring
- FIG. 13 F the glucose calculated by the prediction equation, Equation 5, with inputs from the ppm currents.
- a steady-state glucose concentration profile is produced with about 1 hour and the glucose profile of the three sensors align immediately.
- ppms probing potential modulations
- FIG. 14 A illustrates a high-level block diagram of an example CGM device 1400 in accordance with embodiments provided herein.
- CGM device 1400 includes a bias circuit 1402 that may be configured to couple to a CGM sensor 1404 .
- Bias circuit 1402 may be configured to apply a bias voltage, such as a continuous DC bias, to an analyte-containing fluid through CGM sensor 1404 .
- the analyte-containing fluid may be human interstitial fluid, and the bias voltage may be applied to one or more electrodes 1405 of CGM sensor 1404 (e.g., a working electrode, a background electrode, etc.).
- Bias circuit 1402 also may be configured to apply a probing potential modulation sequence, as shown in FIGS. 7 B- 7 E or another probing potential modulation sequence, to CGM sensor 1404 .
- probing potential modulation sequences may be applied initially and/or at intermediate time periods as described above with reference to FIGS. 1 - 6 , or applied for each primary data point as described above with reference to FIGS. 7 A- 13 F .
- Probing potential modulation sequences may be applied before, after, or before and after measurement of a primary data point, for example.
- the CGM sensor 1404 may include two electrodes and the bias voltage and probing potential modulations may be applied across the pair of electrodes. In such cases, current may be measured through the CGM sensor 1404 .
- the CGM sensor 1404 may include three electrodes such as a working electrode, a counter electrode and a reference electrode. In such cases, the bias voltage and probing potential modulations may be applied between the working electrode and the reference electrode, and current may be measured through the working electrode, for example.
- the CGM sensor 1404 includes chemicals which react with a glucose-containing solution in a reduction-oxidation reaction, which affects the concentration of charge carriers and the time-dependent impedance of the CGM sensor 1404 .
- Example chemicals include glucose oxidase, glucose dehydrogenase, or the like.
- a mediator such as ferricyanide or ferrocene may be employed.
- Probing potential modulation (ppm) currents and non-probing potential modulation (nppm) currents through CGM sensor 1404 in an analyte-containing fluid responsive to probing potential modulations and a constant bias voltage may be conveyed from CGM sensor 1404 to a current measurement (T meas ) circuit 1406 (also referred to as current sensing circuitry).
- Current measurement circuit 1406 may be configured to sense and/or record current measurement signals that have magnitudes indicative of the magnitudes of the currents conveyed from CGM sensor 1404 (e.g., using a suitable current-to-voltage converter (CVC), for example).
- CVC current-to-voltage converter
- current measurement circuit 1406 may include a resistor having a known nominal value and a known nominal precision (e.g., 0.1% to 5%, or even smaller than 0.1%, in some embodiments), through which the current conveyed from CGM sensor 1404 is passed.
- a voltage developed across the resistor of current measurement circuit 106 represents the magnitude of the current, and may be referred to as the current measurement signal (or raw glucose signal Signal Raw ).
- a sample circuit 1408 may be coupled to current measurement circuit 1406 , and may be configured to sample the current measurement signal, and may produce digitized time-domain sample data that is representative of the current measurement signal (e.g., digitized glucose signals).
- sample circuit 1408 may be any suitable A/D converter circuit configured to receive the current measurement signal, which is an analog signal, and convert it to a digital signal having a desired number of bits as an output. The number of bits output by sample circuit 1408 may be sixteen in some embodiments, but more or fewer bits may be used in other embodiments.
- sample circuit 1408 may sample the current measurement signal at a sampling rate in the range of about 10 samples per second to 1000 samples per second. Faster or slower sampling rates may be used. For example, sampling rates such as about 10 kHz to 100 kHz may be used and down-sampled to further reduce signal-to-noise ratio. Any suitable sampling circuitry may be employed.
- Memory 1412 also may have stored therein a plurality of instructions.
- processor 1410 may be a computational resource such as but not limited to a microprocessor, a microcontroller, an embedded microcontroller, a digital signal processor (DSP), a field programmable gate array (FPGA) configured to perform as a microcontroller, or the like.
- DSP digital signal processor
- FPGA field programmable gate array
- memory 1412 may have a plurality of instructions stored therein that, when executed by processor 1410 , cause processor 1410 to perform various actions specified by one or more of the stored plurality of instructions.
- Memory 1412 may further have portions reserved for one or more “scratchpad” storage regions that may be used for read or write operations by processor 1410 responsive to execution of one or more instructions of the plurality of instructions.
- bias circuit 1402 may be disposed within a wearable sensor portion 1416 of CGM device 1400 .
- wearable sensor portion 1416 may include a display 1417 for displaying information such as glucose concentration information (e.g., without use of external equipment).
- Display 1417 may be any suitable type of human-perceivable display, such as but not limited to, a liquid crystal display (LCD), a light-emitting diode (LED) display, or an organic light emitting diode (OLED) display.
- LCD liquid crystal display
- LED light-emitting diode
- OLED organic light emitting diode
- Wearable sensor portion 1416 of CGM device 1450 may be smaller and lighter, and therefore less invasive, than CGM device 1400 of FIG. 14 A because sample circuit 1408 , processor 1410 , memory 1412 , etc., are not included therein.
- Other component configurations may be employed.
- sample circuit 1408 may remain on wearable sensor portion 1416 (such that portable user device 1418 receive digitize glucose signals from wearable sensor portion 1416 ).
- FIG. 15 is a side schematic view of an example glucose sensor 1404 in accordance with embodiments provided herein.
- glucose sensor 1404 may include a working electrode 1502 , a reference electrode 1504 , a counter electrode 1506 and a background electrode 1508 .
- the working electrode may include a conductive layer coated with a chemical which reacts with a glucose-containing solution in a reduction-oxidation reaction (which affects the concentration of charge carriers and the time-dependent impedance of the CGM sensor 1404 ).
- the working electrode may be formed from platinum or surface roughened platinum. Other working electrode materials may be used.
- Example chemical catalysts for the working electrode 1502 include glucose oxidase, glucose dehydrogenase, or the like.
- the enzyme component may be immobilized onto the electrode surface by a cross-linking agent such as glutaraldehyde, for example.
- An outer membrane layer may be applied onto the enzyme layer to protect the overall inner components including the electrode and the enzyme layer.
- a mediator such as ferricyanide or ferrocene may be employed.
- Other chemical catalysts and/or mediators may be employed.
- reference electrode 1504 may be formed from Ag/AgCl.
- the counter electrode 1506 and/or the background electrode 1508 may be formed a suitable conductor such as platinum, gold, palladium, or the like. Other materials may be used for the reference, counter and/or background electrodes.
- the background electrode 1508 may be identical to the working electrode 1502 , but without the chemical catalyst and mediator.
- Counter electrode 1506 may be isolated from the other electrodes by an isolation layer 1510 (e.g., polyimide or another suitable material).
- method 1600 includes applying a probing potential modulation sequence to the sensor (Block 1610 ), measuring probing potential modulation current signals resulting from the probing potential modulation sequence (Block 1612 ) and storing measured probing potential modulation current signals in the memory (Block 1614 ).
- FIGS. 7 B- 7 F illustrate example probing potential modulation sequences that may be applied between primary current signal measurements, resulting in probing potential modulation currents that may be measured and stored in memory.
- method 1600 may include employing the primary current signal and a plurality of the measured probing potential modulation current signals associated with the primary current signal to determine a glucose value (Block 1616 ).
- a prediction equation similar to equation 5 may be used to compute glucose values based on primary current signals and probing potential modulation currents measured after (and/or before) each primary current signal, as previously described.
- the probing potential modulation currents used with a primary current signal to determine a glucose or other analyte value may be referred to as being “associated with” the primary current signal.
- probing potential modulation currents measured before or after a primary current signal is measured may be associated with the primary current signal (if used to compute a glucose or other analyte value).
- FIG. 17 is a flowchart of an example method 1700 of making a continuous glucose monitoring (CGM) device in accordance with embodiments provided herein.
- Method 1700 includes creating a prediction equation based on a plurality of probing potential modulation current signals measured for a reference CGM sensor in response to a probing potential modulation sequence applied to the reference CGM sensor before or after primary current signals are measured for the reference CGM sensor (Block 1702 ).
- a reference CGM sensor may include one or more CGM sensors used to generate primary data points and ppm currents in response to reference glucose concentrations represented by BGM readings (e.g., primary current and ppm currents measured for the purpose of determining prediction equations that are subsequently stored in a CGM device and used during continuous glucose monitoring).
- Method 1700 also includes providing a CGM device including a sensor, a memory and a processor (Block 1704 ); storing the prediction equation in the memory of the CGM device ( 1706 ); and storing computer program code (Block 1708 ) in the memory of the CGM device that, when executed by the processor, causes the CGM device to (a) apply a constant voltage potential to the sensor, measure primary current signals resulting from the constant voltage potential and store measured primary current signals in the memory; (b) between measurements of primary current signals, apply a probing potential modulation sequence to the sensor, measure probing potential modulation current signals resulting from the probing potential modulation sequence and store measured probing potential modulation current signals in the memory; (c) for each primary current signal, employ the primary current signal, a plurality of the measured probing potential modulation current signals associated with the primary current signal and the stored prediction equation to determine a glucose value; and (d) communicate determined glucose values to a user of the CGM device.
- a CGM device including a sensor, a memory and
- FIG. 18 is a flowchart of an example method 1800 of determining analyte concentrations during continuous monitoring measurements in accordance with embodiments provided herein.
- Method 1800 includes inserting a biosensor subcutaneously into a subject, the biosensor including a counter electrode, a reference electrode and a working electrode having a chemical composition configured to oxidize an analyte (Block 1802 ); applying a constant voltage to the working electrode having the chemical composition so as to generate a continuous current flow from the working electrode ( 1804 ); sensing and storing primary current signals from the working electrode into a memory ( 1806 ); after sensing each primary current signal, applying a probing potential modulation sequence to the working electrode, and sensing and storing probing potential modulation currents generated in response to the probing potential modulation sequence into the memory ( 1808 ); gathering a primary current signal and probing potential modulation currents generated after the primary current signal ( 1810 ); and employing the gathered primary current signal and probing potential modulation currents to compute an analyte
- FIG. 19 is a flowchart of an example method 1900 of probing a condition of a continuous analyte monitoring (CAM) sensor and of calibrating the sensor based thereon in accordance with embodiments provided herein.
- Method 1900 includes applying an operating voltage to the CAM sensor (Block 1902 ); probing a condition of the CAM sensor by applying at least one voltage potential step greater than the operating voltage and at least one voltage potential step less than the operating voltage (Block 1904 ); measuring output currents of the CAM sensor in response to the probing (Block 1906 ); calculating calibration indices via ratios of the output currents (Block 1908 ); and calibrating the CAM sensor based on the calibration indices (Block 1910 ).
- FIG. 20 is a flowchart of an example method 2000 of applying probing potential modulation during continuous analyte monitoring for determination of analyte concentration in accordance with embodiments provided herein.
- Method 2000 includes applying a constant operating voltage to an analyte sensor during a continuous sensor operation (Block 2002 ).
- a constant voltage potential such as 0.55 Volts or another suitable value, may be applied to the working electrode of a sensor.
- Block 2004 includes applying at least one probing potential modulation step different than the constant operating voltage in each cycle of the continuous sensor operation.
- a probing potential modulation sequence of voltage steps may be applied to the working electrode of a sensor so as to generate probing potential modulations currents, for example.
- Block 2006 includes measuring primary current from the constant operating voltage in each cycle and at least one companion probing potential modulation current in each cycle, responsive to analyte concentration. For example, following each measurement of a primary data point (e.g., a current signal caused by the constant operating voltage), probing potential modulation currents may be generated by application of a probing potential modulation sequence and these probing potential modulation currents may be measured (as “companion” probing potential modulation currents to the primary data point).
- Block 2008 includes determining analyte concentration from the primary current and the at least one companion probing potential modulation current from the at least one probing potential modulation step.
- determining analyte concentration may include accommodating a sensor sensitivity variation of at least ⁇ 25% from a center sensitivity of a manufacturing release without factory calibration. That is, large sensitivity variations between sensors may be accommodated through the use of ppm currents, without the use of factory calibrations. Further, in some embodiments, determining analyte concentration may include accommodating effects of background signal changes by at least 5 times. For example, analyte concentrations may be accurately determined by using ppm currents despite a 5 times change in background interference signals as described previously with reference to FIGS. 11 A- 11 F .
- determining analyte concentration may include accommodating daily sensitivity changes without an in-situ calibration. For example, analyte concentrations may be accurately determined by using ppm currents despite daily sensitivity changes as described with reference to FIGS. 13 A- 13 D (without using in-situ calibrations). Likewise, in some embodiments, determining analyte concentration may include determining analyte concentration with a warmup time not longer than 30 minutes as previously described (see, for example, FIG. 12 C ).
- the CAM device need not employ an in-situ calibration at any point during continuous analyte monitoring (e.g., no finger sticks or in-situ calibration for 7 to 14 days), such as to accommodate for sensor sensitivity changes or background signal changes due to different levels of interference substances.
- the CAM device may have a warm up time of not more than 30 minutes, and in some cases 5-15 minutes or less.
- use of probing potential modulation currents may eliminate the need for the CAM device to be factory calibrated (e.g., to accommodate lot-to-lot variations).
Landscapes
- Health & Medical Sciences (AREA)
- Life Sciences & Earth Sciences (AREA)
- Physics & Mathematics (AREA)
- Engineering & Computer Science (AREA)
- Molecular Biology (AREA)
- General Health & Medical Sciences (AREA)
- Biophysics (AREA)
- Biomedical Technology (AREA)
- Heart & Thoracic Surgery (AREA)
- Medical Informatics (AREA)
- Veterinary Medicine (AREA)
- Surgery (AREA)
- Animal Behavior & Ethology (AREA)
- Pathology (AREA)
- Public Health (AREA)
- Optics & Photonics (AREA)
- Emergency Medicine (AREA)
- Computer Networks & Wireless Communication (AREA)
- Chemical & Material Sciences (AREA)
- Chemical Kinetics & Catalysis (AREA)
- General Chemical & Material Sciences (AREA)
- Measurement Of The Respiration, Hearing Ability, Form, And Blood Characteristics Of Living Organisms (AREA)
- Investigating Or Analysing Biological Materials (AREA)
Priority Applications (1)
| Application Number | Priority Date | Filing Date | Title |
|---|---|---|---|
| US16/783,080 US11547330B2 (en) | 2019-02-05 | 2020-02-05 | Apparatus and methods for probing sensor operation of continuous analyte sensing and auto-calibration |
Applications Claiming Priority (2)
| Application Number | Priority Date | Filing Date | Title |
|---|---|---|---|
| US201962801592P | 2019-02-05 | 2019-02-05 | |
| US16/783,080 US11547330B2 (en) | 2019-02-05 | 2020-02-05 | Apparatus and methods for probing sensor operation of continuous analyte sensing and auto-calibration |
Publications (2)
| Publication Number | Publication Date |
|---|---|
| US20200245912A1 US20200245912A1 (en) | 2020-08-06 |
| US11547330B2 true US11547330B2 (en) | 2023-01-10 |
Family
ID=69570629
Family Applications (2)
| Application Number | Title | Priority Date | Filing Date |
|---|---|---|---|
| US16/783,080 Active 2041-02-26 US11547330B2 (en) | 2019-02-05 | 2020-02-05 | Apparatus and methods for probing sensor operation of continuous analyte sensing and auto-calibration |
| US16/782,974 Active 2041-08-20 US11737688B2 (en) | 2019-02-05 | 2020-02-05 | Apparatus and methods of probing sensor operation and/or determining analyte values during continuous analyte sensing |
Family Applications After (1)
| Application Number | Title | Priority Date | Filing Date |
|---|---|---|---|
| US16/782,974 Active 2041-08-20 US11737688B2 (en) | 2019-02-05 | 2020-02-05 | Apparatus and methods of probing sensor operation and/or determining analyte values during continuous analyte sensing |
Country Status (6)
| Country | Link |
|---|---|
| US (2) | US11547330B2 (enExample) |
| EP (2) | EP3920798B1 (enExample) |
| JP (2) | JP7494194B2 (enExample) |
| CN (1) | CN113490454A (enExample) |
| TW (2) | TWI882745B (enExample) |
| WO (1) | WO2020161099A1 (enExample) |
Cited By (2)
| Publication number | Priority date | Publication date | Assignee | Title |
|---|---|---|---|---|
| US12070313B2 (en) | 2022-07-05 | 2024-08-27 | Biolinq Incorporated | Sensor assembly of a microneedle array-based continuous analyte monitoring device |
| US12507921B2 (en) | 2024-07-19 | 2025-12-30 | Biolinq Incorporated | Sensor assembly of a microneedle array-based continuous analyte monitoring device |
Families Citing this family (7)
| Publication number | Priority date | Publication date | Assignee | Title |
|---|---|---|---|---|
| US11872035B2 (en) | 2020-08-04 | 2024-01-16 | Ascensia Diabetes Care Holdings Ag | Continuous analyte monitoring sensor calibration and measurements by a connection function |
| US12490920B2 (en) * | 2021-06-11 | 2025-12-09 | Medtronic Minimed, Inc. | Adjustable glucose sensor initialization sequences |
| CN115877009A (zh) * | 2021-09-29 | 2023-03-31 | 苏州睿感医疗科技有限公司 | 持续血糖校正方法、装置和电子设备 |
| US12216074B2 (en) | 2021-10-01 | 2025-02-04 | Pacific Diabetes Technologies, Inc. | Biosensors and methods for determining analyte concentration in the kinetic potential region of redox mediators |
| CN114343629B (zh) * | 2021-11-17 | 2025-08-12 | 浙江凯立特医疗器械有限公司 | 传感器信号漂移自动跟踪矫正的方法及相关装置 |
| DE102022134580A1 (de) * | 2022-12-22 | 2024-06-27 | Endress+Hauser Conducta Gmbh+Co. Kg | Verfahren zum Kalibrieren eines Sensors im laufenden Betrieb, Sensor mit implementiertem Verfahren zur Kalibration |
| CN118642028B (zh) * | 2024-08-12 | 2024-10-18 | 陕西正泽生物技术有限公司 | 一种医用回旋加速器测磁霍尔探头校准方法及装置 |
Citations (27)
| Publication number | Priority date | Publication date | Assignee | Title |
|---|---|---|---|---|
| US5792668A (en) | 1993-08-06 | 1998-08-11 | Solid State Farms, Inc. | Radio frequency spectral analysis for in-vitro or in-vivo environments |
| WO2001088534A2 (en) | 2000-05-16 | 2001-11-22 | Cygnus, Inc. | Methods for improving performance and reliability of biosensors |
| US20060094946A1 (en) | 2004-10-28 | 2006-05-04 | Sontra Medical Corporation | System and method for analyte sampling and analysis with hydrogel |
| EP1702561A2 (en) | 2002-03-22 | 2006-09-20 | Animas Technologies LLC | Improving performance for an analyte monitoring device |
| US20070167867A1 (en) | 2005-02-24 | 2007-07-19 | Erich Wolf | System for transcutaneous monitoring of intracranial pressure |
| US20070270675A1 (en) | 2006-05-17 | 2007-11-22 | Michael John Kane | Implantable Medical Device with Chemical Sensor and Related Methods |
| EP1218532B1 (en) | 1999-09-20 | 2007-12-26 | Roche Diagnostics Operations, Inc. | Method for monitoring an analyte using an electrochemical Biosensor which can be turned off by applying an electrical potential |
| US20080077015A1 (en) | 2006-05-17 | 2008-03-27 | Olga Boric-Lubecke | Determining presence and/or physiological motion of one or more subjects with multiple receiver Doppler radar systems |
| WO2008079435A2 (en) | 2006-06-27 | 2008-07-03 | Ultradian Diagnostics Llc | Biofouling self-compensating biosensor |
| US8233958B2 (en) | 2003-12-09 | 2012-07-31 | Dexcom, Inc. | Signal processing for continuous analyte sensor |
| US20120197576A1 (en) | 2003-10-31 | 2012-08-02 | Abbott Diabetes Care Inc. | Method of Calibrating an Analyte-Measurement Device, and Associated Methods, Devices and Systems |
| US20120283538A1 (en) | 2011-05-06 | 2012-11-08 | Medtronic Minimed, Inc. | Method and apparatus for continuous analyte monitoring |
| US20130071869A1 (en) | 2011-09-21 | 2013-03-21 | Bayer Healthcare Llc | Analysis Compensation Including Segmented Signals |
| US20130256156A1 (en) | 2005-07-20 | 2013-10-03 | Huan-Ping Wu | Gated Amperometry Methods |
| US8583205B2 (en) | 2008-03-28 | 2013-11-12 | Abbott Diabetes Care Inc. | Analyte sensor calibration management |
| US20140209460A1 (en) | 2008-12-08 | 2014-07-31 | Bayer Healthcare Llc | Biosensor Systems for Determining Analyte Concentration Based on Complex Index Functions |
| WO2014128638A1 (en) | 2013-02-20 | 2014-08-28 | Università Degli Studi Di Padova Area Trasfermiento Di Tecnologia | Retrospective retrofitting method to generate a continuous glucose concentration profile |
| US20140273042A1 (en) | 2013-03-15 | 2014-09-18 | Tandem Diabetes Care, Inc. | Predictive calibration |
| US20150073718A1 (en) | 2013-09-10 | 2015-03-12 | Lifescan Scotland Limited | Phase-difference determination using test meter |
| US20150198555A1 (en) * | 2012-09-21 | 2015-07-16 | Seung Ro LEE | Sample recognition method and biosensor using same |
| US20150351673A1 (en) | 2014-06-06 | 2015-12-10 | Dexcom, Inc. | Fault discrimination and responsive processing based on data and context |
| WO2017156584A1 (en) | 2016-03-18 | 2017-09-21 | La Trobe University | Mobile voltammetric analysis |
| US20180275089A1 (en) | 2010-06-07 | 2018-09-27 | Ascensia Diabetes Care Holdings Ag | Slope-Based Compensation Including Secondary Output Signals |
| US20190008426A1 (en) | 2017-07-04 | 2019-01-10 | Arkray, Inc. | Measuring Apparatus, Computer Readable Medium Storing Measuring Program and Measuring Method |
| CA3061574A1 (en) | 2017-07-03 | 2019-01-10 | F. Hoffmann-La Roche Ag | Method and electronics unit for detecting in-vivo properties of a biosensor |
| US20190125225A1 (en) * | 2017-11-01 | 2019-05-02 | Waveform Technologies, Inc. | Method for conditioning of a sensor |
| US20200268290A1 (en) | 2019-02-22 | 2020-08-27 | Ascensia Diabetes Care Holdings Ag | Methods and apparatus for analyte concentration monitoring using harmonic relationships |
Family Cites Families (6)
| Publication number | Priority date | Publication date | Assignee | Title |
|---|---|---|---|---|
| US20080234562A1 (en) * | 2007-03-19 | 2008-09-25 | Jina Arvind N | Continuous analyte monitor with multi-point self-calibration |
| US7783442B2 (en) | 2007-10-31 | 2010-08-24 | Medtronic Minimed, Inc. | System and methods for calibrating physiological characteristic sensors |
| US9801575B2 (en) * | 2011-04-15 | 2017-10-31 | Dexcom, Inc. | Advanced analyte sensor calibration and error detection |
| WO2017172391A1 (en) * | 2016-03-30 | 2017-10-05 | Dexcom, Inc. | Systems, devices and methods for analyte monitoring system |
| CA3028348A1 (en) | 2016-07-12 | 2018-01-18 | Ascensia Diabetes Care Holdings Ag | Method for electrochemical analysis by use of alternating output signals from two electrodes |
| CN108209936A (zh) | 2017-12-25 | 2018-06-29 | 重庆大学 | 一种皮下植入式血糖仪的自适应校准算法 |
-
2020
- 2020-02-04 EP EP20704796.0A patent/EP3920798B1/en active Active
- 2020-02-04 JP JP2021545766A patent/JP7494194B2/ja active Active
- 2020-02-04 WO PCT/EP2020/052673 patent/WO2020161099A1/en not_active Ceased
- 2020-02-04 CN CN202080016885.8A patent/CN113490454A/zh active Pending
- 2020-02-04 EP EP24186158.2A patent/EP4417124A3/en active Pending
- 2020-02-05 TW TW113111424A patent/TWI882745B/zh active
- 2020-02-05 US US16/783,080 patent/US11547330B2/en active Active
- 2020-02-05 US US16/782,974 patent/US11737688B2/en active Active
- 2020-02-05 TW TW109103528A patent/TWI839458B/zh active
-
2024
- 2024-05-21 JP JP2024082492A patent/JP7730951B2/ja active Active
Patent Citations (28)
| Publication number | Priority date | Publication date | Assignee | Title |
|---|---|---|---|---|
| US5792668A (en) | 1993-08-06 | 1998-08-11 | Solid State Farms, Inc. | Radio frequency spectral analysis for in-vitro or in-vivo environments |
| EP1218532B1 (en) | 1999-09-20 | 2007-12-26 | Roche Diagnostics Operations, Inc. | Method for monitoring an analyte using an electrochemical Biosensor which can be turned off by applying an electrical potential |
| WO2001088534A2 (en) | 2000-05-16 | 2001-11-22 | Cygnus, Inc. | Methods for improving performance and reliability of biosensors |
| EP1702561A2 (en) | 2002-03-22 | 2006-09-20 | Animas Technologies LLC | Improving performance for an analyte monitoring device |
| US20120197576A1 (en) | 2003-10-31 | 2012-08-02 | Abbott Diabetes Care Inc. | Method of Calibrating an Analyte-Measurement Device, and Associated Methods, Devices and Systems |
| US8233958B2 (en) | 2003-12-09 | 2012-07-31 | Dexcom, Inc. | Signal processing for continuous analyte sensor |
| US20060094946A1 (en) | 2004-10-28 | 2006-05-04 | Sontra Medical Corporation | System and method for analyte sampling and analysis with hydrogel |
| US20070167867A1 (en) | 2005-02-24 | 2007-07-19 | Erich Wolf | System for transcutaneous monitoring of intracranial pressure |
| US20130256156A1 (en) | 2005-07-20 | 2013-10-03 | Huan-Ping Wu | Gated Amperometry Methods |
| US20070270675A1 (en) | 2006-05-17 | 2007-11-22 | Michael John Kane | Implantable Medical Device with Chemical Sensor and Related Methods |
| US20080077015A1 (en) | 2006-05-17 | 2008-03-27 | Olga Boric-Lubecke | Determining presence and/or physiological motion of one or more subjects with multiple receiver Doppler radar systems |
| WO2008079435A2 (en) | 2006-06-27 | 2008-07-03 | Ultradian Diagnostics Llc | Biofouling self-compensating biosensor |
| US8583205B2 (en) | 2008-03-28 | 2013-11-12 | Abbott Diabetes Care Inc. | Analyte sensor calibration management |
| US20140209460A1 (en) | 2008-12-08 | 2014-07-31 | Bayer Healthcare Llc | Biosensor Systems for Determining Analyte Concentration Based on Complex Index Functions |
| US20180275089A1 (en) | 2010-06-07 | 2018-09-27 | Ascensia Diabetes Care Holdings Ag | Slope-Based Compensation Including Secondary Output Signals |
| US20120283538A1 (en) | 2011-05-06 | 2012-11-08 | Medtronic Minimed, Inc. | Method and apparatus for continuous analyte monitoring |
| US20130071869A1 (en) | 2011-09-21 | 2013-03-21 | Bayer Healthcare Llc | Analysis Compensation Including Segmented Signals |
| US20150198555A1 (en) * | 2012-09-21 | 2015-07-16 | Seung Ro LEE | Sample recognition method and biosensor using same |
| WO2014128638A1 (en) | 2013-02-20 | 2014-08-28 | Università Degli Studi Di Padova Area Trasfermiento Di Tecnologia | Retrospective retrofitting method to generate a continuous glucose concentration profile |
| US20140273042A1 (en) | 2013-03-15 | 2014-09-18 | Tandem Diabetes Care, Inc. | Predictive calibration |
| US20150073718A1 (en) | 2013-09-10 | 2015-03-12 | Lifescan Scotland Limited | Phase-difference determination using test meter |
| US20150351673A1 (en) | 2014-06-06 | 2015-12-10 | Dexcom, Inc. | Fault discrimination and responsive processing based on data and context |
| WO2017156584A1 (en) | 2016-03-18 | 2017-09-21 | La Trobe University | Mobile voltammetric analysis |
| CA3061574A1 (en) | 2017-07-03 | 2019-01-10 | F. Hoffmann-La Roche Ag | Method and electronics unit for detecting in-vivo properties of a biosensor |
| US20190008426A1 (en) | 2017-07-04 | 2019-01-10 | Arkray, Inc. | Measuring Apparatus, Computer Readable Medium Storing Measuring Program and Measuring Method |
| US20190125225A1 (en) * | 2017-11-01 | 2019-05-02 | Waveform Technologies, Inc. | Method for conditioning of a sensor |
| US20200268290A1 (en) | 2019-02-22 | 2020-08-27 | Ascensia Diabetes Care Holdings Ag | Methods and apparatus for analyte concentration monitoring using harmonic relationships |
| US20200268323A1 (en) | 2019-02-22 | 2020-08-27 | Ascensia Diabetes Care Holdings Ag | Methods and apparatus for analyte concentration monitoring using harmonic relationships |
Non-Patent Citations (16)
| Title |
|---|
| BOND ALAN M.; ELTON DARRELL; GUO SI-XUAN; KENNEDY GARETH F.; MASHKINA ELENA; SIMONOV ALEXANDR N.; ZHANG JIE: "An integrated instrumental and theoretical approach to quantitative electrode kinetic studies based on large amplitude Fourier transformed a.c. voltammetry: A mini review", ELECTROCHEMISTRY COMMUNICATIONS, ELSEVIER AMSTERDAM, NL, vol. 57, 8 May 2015 (2015-05-08), NL , pages 78 - 83, XP029212452, ISSN: 1388-2481, DOI: 10.1016/j.elecom.2015.04.017 |
| Bond et al., "An integrated instrumental and theoretical approach to quantitative electrode kinetic studies based on large amplitude Fourier transformed a.c. volatammetry: A mini review", Electrochemistry Communications, Elsevier, Amsterdam, NL, vol. 57, May 8, 2015, pp. 78-83, XP029212452, ISSN: 1388-2481, DOI: 10.1016/J.EIecom.2015.04.017. |
| Haxha et al.: "Optical Based Noninvasive Glucose Monitoring Sensor Prototype"; University of Bedfordshire, Luton , U.K.; IEEE Photonics Journal: vol. 8, No. 6, Dec. 2016. DOI: 10.1109/JPHOT.2016.26164911943-0655. |
| International Preliminary Report on Patentability of International Application No. PCT/EP2020/052673 dated Aug. 19, 2021. |
| International Search Report and Written Opinion of related International Application No. PCT/EP2020/052673 dated Jul. 9, 2020. |
| Nakata et al., "Discrimination of Glucose from Its Interferences Using an Amperometric Sensor Based on Electrochemical Nonlinearity", Analytical Chemistry, American Chemical Society, US, vol. 70, No. 20, Oct. 15, 1998, pp. 4304-4308, XP000789048, ISSN: 0003-2700, DOI: 10.1021/AC980442H. |
| Nakata et al., "Experimental Demonstration and Simulation of Electrochemical Non-linear Reponses to Glucose and Its Interferents with an Amperometric Senso", Analyst, London, GB, vol. 124, No. 8, Aug. 1, 1999, pp. 1175-1179, XP001039882, DOI: 10.1039/A903187A. |
| NAKATA S, ET AL.: "EXPERIMENTAL DEMONSTRATION AND SIMULATION OF ELECTROCHEMICAL NON-LINEAR RESPONSES TO GLUCOSE AND ITS INTERFERENTS WITH AN AMPEROMETRIC SENSOR", ANALYST, LONDON, GB, vol. 124, no. 08, 1 August 1999 (1999-08-01), GB , pages 1175 - 1179, XP001039882, DOI: 10.1039/a903187a |
| NAKATA S., TAKITANI R., HIRATA Y.: "DISCRIMINATION OF GLUCOSE FROM ITS INTERFERENCES USING AN AMPEROMETRIC SENSOR BASED ON ELECTROCHEMICAL NONLINEARITY.", ANALYTICAL CHEMISTRY, AMERICAN CHEMICAL SOCIETY, US, vol. 70., no. 20., 15 October 1998 (1998-10-15), US , pages 4304 - 4308., XP000789048, ISSN: 0003-2700, DOI: 10.1021/ac980442h |
| Nakata, S. et al.: Discrimination of Glucose from Its Interferences Using an Amperometric Sensor Based on Electrochemical Nonlinearity, Analytical Chemistry, 1998 70 (20), 4304-4308 (Year: 1998). |
| Parkes et al.: "A New Consensus Error Grid to Evaluate the Clinical Significance of Inaccuracies in the Measurement of Blood Glucose"; Diabetes Care, vol. 23, No. 8, Aug. 2000. |
| Provisional Search Report and Written Opinion of related International Application No. PCT/EP2020/052673 dated Apr. 17, 2020. |
| Stein et al.: "Microscale Enzymatic Optical Biosensors Using Mass-Transport Limiting Nanofilms. 1. Fabrication and Characterization Using Glucose as a Model Analyte"; Anal Chem. Feb. 15, 2007; 79(4): 1339-1348. DOI: 10.1021/ac061414z; https://www.ncbi.nlm.nih.gov/pmc/articles/PMC2518633/. |
| U.S. Appl. No. 17/014,947, filed Sep. 8, 2020, Wu. |
| U.S. Appl. No. 17/014,962, filed Sep. 8, 2020, Wu. |
| Xu, Liang, et al.: "Optimization method for simultaneous kinetic analysis", Analystical Chem. 1996 ACS, Washington, DC, USA, vol. 68, No. 11, Jun. 1, 1996. |
Cited By (2)
| Publication number | Priority date | Publication date | Assignee | Title |
|---|---|---|---|---|
| US12070313B2 (en) | 2022-07-05 | 2024-08-27 | Biolinq Incorporated | Sensor assembly of a microneedle array-based continuous analyte monitoring device |
| US12507921B2 (en) | 2024-07-19 | 2025-12-30 | Biolinq Incorporated | Sensor assembly of a microneedle array-based continuous analyte monitoring device |
Also Published As
| Publication number | Publication date |
|---|---|
| US20200245912A1 (en) | 2020-08-06 |
| EP4417124A3 (en) | 2024-11-13 |
| US11737688B2 (en) | 2023-08-29 |
| JP7494194B2 (ja) | 2024-06-03 |
| TWI839458B (zh) | 2024-04-21 |
| EP3920798A1 (en) | 2021-12-15 |
| JP2022519854A (ja) | 2022-03-25 |
| TW202430097A (zh) | 2024-08-01 |
| TWI882745B (zh) | 2025-05-01 |
| EP4417124A2 (en) | 2024-08-21 |
| US20200245911A1 (en) | 2020-08-06 |
| WO2020161099A1 (en) | 2020-08-13 |
| EP3920798B1 (en) | 2024-08-14 |
| JP7730951B2 (ja) | 2025-08-28 |
| CN113490454A (zh) | 2021-10-08 |
| TW202045095A (zh) | 2020-12-16 |
| JP2024105663A (ja) | 2024-08-06 |
Similar Documents
| Publication | Publication Date | Title |
|---|---|---|
| US11547330B2 (en) | Apparatus and methods for probing sensor operation of continuous analyte sensing and auto-calibration | |
| EP4192348B1 (en) | Non-steady-state determination of analyte concentration for continuous glucose monitoring by potential modulation | |
| US12514470B2 (en) | Biosensor with membrane structure for steady-state and non-steady-state conditions for determining analyte concentrations |
Legal Events
| Date | Code | Title | Description |
|---|---|---|---|
| FEPP | Fee payment procedure |
Free format text: ENTITY STATUS SET TO UNDISCOUNTED (ORIGINAL EVENT CODE: BIG.); ENTITY STATUS OF PATENT OWNER: LARGE ENTITY |
|
| STPP | Information on status: patent application and granting procedure in general |
Free format text: APPLICATION DISPATCHED FROM PREEXAM, NOT YET DOCKETED |
|
| AS | Assignment |
Owner name: ASCENSIA DIABETES CARE HOLDINGS AG, SWITZERLAND Free format text: ASSIGNMENT OF ASSIGNORS INTEREST;ASSIGNOR:WU, HUAN-PING;REEL/FRAME:053989/0010 Effective date: 20200313 |
|
| STPP | Information on status: patent application and granting procedure in general |
Free format text: DOCKETED NEW CASE - READY FOR EXAMINATION |
|
| STPP | Information on status: patent application and granting procedure in general |
Free format text: NON FINAL ACTION MAILED |
|
| STPP | Information on status: patent application and granting procedure in general |
Free format text: RESPONSE TO NON-FINAL OFFICE ACTION ENTERED AND FORWARDED TO EXAMINER |
|
| STPP | Information on status: patent application and granting procedure in general |
Free format text: NOTICE OF ALLOWANCE MAILED -- APPLICATION RECEIVED IN OFFICE OF PUBLICATIONS |
|
| STPP | Information on status: patent application and granting procedure in general |
Free format text: PUBLICATIONS -- ISSUE FEE PAYMENT VERIFIED |
|
| STCF | Information on status: patent grant |
Free format text: PATENTED CASE |