US11079357B2 - Method and apparatus for enhanced visualization of anomalies in a structure - Google Patents
Method and apparatus for enhanced visualization of anomalies in a structure Download PDFInfo
- Publication number
- US11079357B2 US11079357B2 US15/935,349 US201815935349A US11079357B2 US 11079357 B2 US11079357 B2 US 11079357B2 US 201815935349 A US201815935349 A US 201815935349A US 11079357 B2 US11079357 B2 US 11079357B2
- Authority
- US
- United States
- Prior art keywords
- laser
- user interface
- graphical user
- scanning head
- time window
- Prior art date
- Legal status (The legal status is an assumption and is not a legal conclusion. Google has not performed a legal analysis and makes no representation as to the accuracy of the status listed.)
- Active, expires
Links
- 238000000034 method Methods 0.000 title claims abstract description 52
- 238000012800 visualization Methods 0.000 title claims abstract description 23
- 238000003384 imaging method Methods 0.000 claims abstract description 32
- 238000012805 post-processing Methods 0.000 claims abstract description 24
- 238000013507 mapping Methods 0.000 claims abstract description 15
- 230000003993 interaction Effects 0.000 claims description 10
- 230000003213 activating effect Effects 0.000 claims description 8
- 230000004044 response Effects 0.000 claims description 6
- 238000012360 testing method Methods 0.000 description 48
- 238000004364 calculation method Methods 0.000 description 19
- 238000010586 diagram Methods 0.000 description 18
- 238000002604 ultrasonography Methods 0.000 description 17
- 239000002131 composite material Substances 0.000 description 14
- 230000006870 function Effects 0.000 description 11
- 230000003287 optical effect Effects 0.000 description 11
- 238000004422 calculation algorithm Methods 0.000 description 9
- 230000008569 process Effects 0.000 description 6
- 238000012545 processing Methods 0.000 description 6
- 230000000875 corresponding effect Effects 0.000 description 5
- 230000032798 delamination Effects 0.000 description 5
- 230000001276 controlling effect Effects 0.000 description 3
- 238000007689 inspection Methods 0.000 description 3
- 230000008901 benefit Effects 0.000 description 2
- 230000002596 correlated effect Effects 0.000 description 2
- 230000007547 defect Effects 0.000 description 2
- 230000001066 destructive effect Effects 0.000 description 2
- 238000011161 development Methods 0.000 description 2
- 239000000463 material Substances 0.000 description 2
- 230000000644 propagated effect Effects 0.000 description 2
- 230000001902 propagating effect Effects 0.000 description 2
- 238000013519 translation Methods 0.000 description 2
- 229920000049 Carbon (fiber) Polymers 0.000 description 1
- 239000004593 Epoxy Substances 0.000 description 1
- 229920002430 Fibre-reinforced plastic Polymers 0.000 description 1
- 239000004917 carbon fiber Substances 0.000 description 1
- 238000006243 chemical reaction Methods 0.000 description 1
- 238000001514 detection method Methods 0.000 description 1
- 238000002474 experimental method Methods 0.000 description 1
- 239000011151 fibre-reinforced plastic Substances 0.000 description 1
- 230000006872 improvement Effects 0.000 description 1
- 238000012804 iterative process Methods 0.000 description 1
- 238000004519 manufacturing process Methods 0.000 description 1
- VNWKTOKETHGBQD-UHFFFAOYSA-N methane Chemical compound C VNWKTOKETHGBQD-UHFFFAOYSA-N 0.000 description 1
- 238000012986 modification Methods 0.000 description 1
- 230000004048 modification Effects 0.000 description 1
- 230000008439 repair process Effects 0.000 description 1
- 230000037303 wrinkles Effects 0.000 description 1
Images


Classifications
-
- G—PHYSICS
- G01—MEASURING; TESTING
- G01N—INVESTIGATING OR ANALYSING MATERIALS BY DETERMINING THEIR CHEMICAL OR PHYSICAL PROPERTIES
- G01N29/00—Investigating or analysing materials by the use of ultrasonic, sonic or infrasonic waves; Visualisation of the interior of objects by transmitting ultrasonic or sonic waves through the object
- G01N29/04—Analysing solids
- G01N29/06—Visualisation of the interior, e.g. acoustic microscopy
- G01N29/0654—Imaging
- G01N29/069—Defect imaging, localisation and sizing using, e.g. time of flight diffraction [TOFD], synthetic aperture focusing technique [SAFT], Amplituden-Laufzeit-Ortskurven [ALOK] technique
-
- G—PHYSICS
- G01—MEASURING; TESTING
- G01N—INVESTIGATING OR ANALYSING MATERIALS BY DETERMINING THEIR CHEMICAL OR PHYSICAL PROPERTIES
- G01N29/00—Investigating or analysing materials by the use of ultrasonic, sonic or infrasonic waves; Visualisation of the interior of objects by transmitting ultrasonic or sonic waves through the object
- G01N29/04—Analysing solids
-
- G—PHYSICS
- G01—MEASURING; TESTING
- G01M—TESTING STATIC OR DYNAMIC BALANCE OF MACHINES OR STRUCTURES; TESTING OF STRUCTURES OR APPARATUS, NOT OTHERWISE PROVIDED FOR
- G01M5/00—Investigating the elasticity of structures, e.g. deflection of bridges or air-craft wings
- G01M5/0033—Investigating the elasticity of structures, e.g. deflection of bridges or air-craft wings by determining damage, crack or wear
-
- G—PHYSICS
- G01—MEASURING; TESTING
- G01N—INVESTIGATING OR ANALYSING MATERIALS BY DETERMINING THEIR CHEMICAL OR PHYSICAL PROPERTIES
- G01N19/00—Investigating materials by mechanical methods
- G01N19/08—Detecting presence of flaws or irregularities
-
- G—PHYSICS
- G01—MEASURING; TESTING
- G01N—INVESTIGATING OR ANALYSING MATERIALS BY DETERMINING THEIR CHEMICAL OR PHYSICAL PROPERTIES
- G01N21/00—Investigating or analysing materials by the use of optical means, i.e. using sub-millimetre waves, infrared, visible or ultraviolet light
- G01N21/17—Systems in which incident light is modified in accordance with the properties of the material investigated
- G01N21/1702—Systems in which incident light is modified in accordance with the properties of the material investigated with opto-acoustic detection, e.g. for gases or analysing solids
-
- G—PHYSICS
- G01—MEASURING; TESTING
- G01N—INVESTIGATING OR ANALYSING MATERIALS BY DETERMINING THEIR CHEMICAL OR PHYSICAL PROPERTIES
- G01N21/00—Investigating or analysing materials by the use of optical means, i.e. using sub-millimetre waves, infrared, visible or ultraviolet light
- G01N21/84—Systems specially adapted for particular applications
- G01N21/88—Investigating the presence of flaws or contamination
-
- G—PHYSICS
- G01—MEASURING; TESTING
- G01N—INVESTIGATING OR ANALYSING MATERIALS BY DETERMINING THEIR CHEMICAL OR PHYSICAL PROPERTIES
- G01N29/00—Investigating or analysing materials by the use of ultrasonic, sonic or infrasonic waves; Visualisation of the interior of objects by transmitting ultrasonic or sonic waves through the object
- G01N29/04—Analysing solids
- G01N29/043—Analysing solids in the interior, e.g. by shear waves
-
- G—PHYSICS
- G01—MEASURING; TESTING
- G01N—INVESTIGATING OR ANALYSING MATERIALS BY DETERMINING THEIR CHEMICAL OR PHYSICAL PROPERTIES
- G01N29/00—Investigating or analysing materials by the use of ultrasonic, sonic or infrasonic waves; Visualisation of the interior of objects by transmitting ultrasonic or sonic waves through the object
- G01N29/04—Analysing solids
- G01N29/06—Visualisation of the interior, e.g. acoustic microscopy
- G01N29/0654—Imaging
- G01N29/0672—Imaging by acoustic tomography
-
- G—PHYSICS
- G01—MEASURING; TESTING
- G01N—INVESTIGATING OR ANALYSING MATERIALS BY DETERMINING THEIR CHEMICAL OR PHYSICAL PROPERTIES
- G01N29/00—Investigating or analysing materials by the use of ultrasonic, sonic or infrasonic waves; Visualisation of the interior of objects by transmitting ultrasonic or sonic waves through the object
- G01N29/22—Details, e.g. general constructional or apparatus details
- G01N29/24—Probes
- G01N29/2418—Probes using optoacoustic interaction with the material, e.g. laser radiation, photoacoustics
-
- G—PHYSICS
- G01—MEASURING; TESTING
- G01N—INVESTIGATING OR ANALYSING MATERIALS BY DETERMINING THEIR CHEMICAL OR PHYSICAL PROPERTIES
- G01N29/00—Investigating or analysing materials by the use of ultrasonic, sonic or infrasonic waves; Visualisation of the interior of objects by transmitting ultrasonic or sonic waves through the object
- G01N29/22—Details, e.g. general constructional or apparatus details
- G01N29/26—Arrangements for orientation or scanning by relative movement of the head and the sensor
- G01N29/265—Arrangements for orientation or scanning by relative movement of the head and the sensor by moving the sensor relative to a stationary material
-
- G—PHYSICS
- G01—MEASURING; TESTING
- G01S—RADIO DIRECTION-FINDING; RADIO NAVIGATION; DETERMINING DISTANCE OR VELOCITY BY USE OF RADIO WAVES; LOCATING OR PRESENCE-DETECTING BY USE OF THE REFLECTION OR RERADIATION OF RADIO WAVES; ANALOGOUS ARRANGEMENTS USING OTHER WAVES
- G01S17/00—Systems using the reflection or reradiation of electromagnetic waves other than radio waves, e.g. lidar systems
- G01S17/02—Systems using the reflection of electromagnetic waves other than radio waves
-
- G—PHYSICS
- G06—COMPUTING; CALCULATING OR COUNTING
- G06F—ELECTRIC DIGITAL DATA PROCESSING
- G06F3/00—Input arrangements for transferring data to be processed into a form capable of being handled by the computer; Output arrangements for transferring data from processing unit to output unit, e.g. interface arrangements
- G06F3/01—Input arrangements or combined input and output arrangements for interaction between user and computer
- G06F3/048—Interaction techniques based on graphical user interfaces [GUI]
-
- G—PHYSICS
- G06—COMPUTING; CALCULATING OR COUNTING
- G06T—IMAGE DATA PROCESSING OR GENERATION, IN GENERAL
- G06T19/00—Manipulating 3D models or images for computer graphics
-
- G06T3/18—
-
- G—PHYSICS
- G01—MEASURING; TESTING
- G01N—INVESTIGATING OR ANALYSING MATERIALS BY DETERMINING THEIR CHEMICAL OR PHYSICAL PROPERTIES
- G01N21/00—Investigating or analysing materials by the use of optical means, i.e. using sub-millimetre waves, infrared, visible or ultraviolet light
- G01N21/17—Systems in which incident light is modified in accordance with the properties of the material investigated
- G01N21/1702—Systems in which incident light is modified in accordance with the properties of the material investigated with opto-acoustic detection, e.g. for gases or analysing solids
- G01N2021/1706—Systems in which incident light is modified in accordance with the properties of the material investigated with opto-acoustic detection, e.g. for gases or analysing solids in solids
-
- G—PHYSICS
- G01—MEASURING; TESTING
- G01N—INVESTIGATING OR ANALYSING MATERIALS BY DETERMINING THEIR CHEMICAL OR PHYSICAL PROPERTIES
- G01N21/00—Investigating or analysing materials by the use of optical means, i.e. using sub-millimetre waves, infrared, visible or ultraviolet light
- G01N21/17—Systems in which incident light is modified in accordance with the properties of the material investigated
- G01N2021/1765—Method using an image detector and processing of image signal
-
- G—PHYSICS
- G01—MEASURING; TESTING
- G01N—INVESTIGATING OR ANALYSING MATERIALS BY DETERMINING THEIR CHEMICAL OR PHYSICAL PROPERTIES
- G01N2291/00—Indexing codes associated with group G01N29/00
- G01N2291/01—Indexing codes associated with the measuring variable
- G01N2291/017—Doppler techniques
-
- G—PHYSICS
- G01—MEASURING; TESTING
- G01N—INVESTIGATING OR ANALYSING MATERIALS BY DETERMINING THEIR CHEMICAL OR PHYSICAL PROPERTIES
- G01N2291/00—Indexing codes associated with group G01N29/00
- G01N2291/02—Indexing codes associated with the analysed material
- G01N2291/023—Solids
- G01N2291/0231—Composite or layered materials
-
- G—PHYSICS
- G01—MEASURING; TESTING
- G01N—INVESTIGATING OR ANALYSING MATERIALS BY DETERMINING THEIR CHEMICAL OR PHYSICAL PROPERTIES
- G01N2291/00—Indexing codes associated with group G01N29/00
- G01N2291/26—Scanned objects
- G01N2291/263—Surfaces
- G01N2291/2632—Surfaces flat
-
- G—PHYSICS
- G06—COMPUTING; CALCULATING OR COUNTING
- G06T—IMAGE DATA PROCESSING OR GENERATION, IN GENERAL
- G06T2207/00—Indexing scheme for image analysis or image enhancement
- G06T2207/10—Image acquisition modality
- G06T2207/10016—Video; Image sequence
-
- G—PHYSICS
- G06—COMPUTING; CALCULATING OR COUNTING
- G06T—IMAGE DATA PROCESSING OR GENERATION, IN GENERAL
- G06T2207/00—Indexing scheme for image analysis or image enhancement
- G06T2207/10—Image acquisition modality
- G06T2207/10132—Ultrasound image
- G06T2207/10136—3D ultrasound image
Definitions
- This disclosure generally relates to apparatus and methods for processing images, and more particularly, to an apparatus and method for processing laser ultrasonic wave propagation images.
- Pulse-echo laser ultrasonic wave propagation imaging is a noncontact sensing technique that enables three-dimensional (3-D) visualization of anomalies in structures (e.g., fiber-reinforced plastic material, hereinafter referred to as “composite material”) for the purpose of non-destructive inspection.
- a Q-switched continuous-wave laser is used to linearly scan an area on a structure, the laser pulses being directed normal to the surface (e.g., in the thickness direction).
- a laser Doppler vibrometer is used to detect laser-generated ultrasonic waves that propagate in the thickness direction at each fixed point.
- the scan data output by the laser Doppler vibrometer is then bandpass filtered to produce raw UWPI video data, which may be further post-processed to enhance the acquired images.
- a single-time window amplitude mapping algorithm was employed to post-process a single image by using a single time window of ultrasonic wave propagation imaging data.
- this single-time window amplitude mapping algorithm forces users to choose an extended time window in order to represent every anomaly at different levels of thickness, which leads to inclusion of unnecessary frames and low quality of anomaly visualization.
- the calculation of the area of the anomaly using pulse-echo laser UMPI video data was only possible for simple shapes such as rectangles and circles and precisely locating the anomaly in the structure by observing only the scan result could be challenging.
- the subject matter disclosed in some detail below is directed to methods and apparatus for post-processing pulse-echo laser UMPI video data to enhance the visualization of anomalies in a structure.
- the post-processing enhancements proposed herein are of three types. First, a multiple-time window amplitude mapping algorithm is proposed herein that allows users to choose multiple time windows to visualize anomalies at different depths in a single image. Second, a polygonal anomaly area calculation enables automatic calculation of the area of a designated anomaly within the interface of the pulse-echo laser UWPI system. Third, an anomaly pointing function helps users to precisely locate the anomaly on the structure by interacting with a graphical user interface on which a UWPI video image is being displayed. These features enable enhanced visualization quality and precise calculation of the area and location of the anomaly.
- One aspect of the subject matter disclosed in detail below is a method for enhanced visualization of anomalies in a structure, comprising: (a) acquiring pulse-echo laser ultrasonic wave propagation imaging video data at a multiplicity of points in a scan area on a surface of a structure; (b) post-processing the pulse-echo laser ultrasonic wave propagation imaging video data using multiple-time window amplitude mapping to create a multiple-time window amplitude map; and (c) displaying the multiple-time window amplitude map on a graphical user interface.
- step (b) comprises: designating pulse-echo laser ultrasonic wave propagation imaging video data in selected time windows; summing amplitude data that is included in the designated pulse-echo laser ultrasonic wave propagation imaging video data; and mapping the summed amplitude data.
- Another aspect of the subject matter disclosed in detail below is a method for enhanced visualization of anomalies in a structure, comprising: (a) acquiring pulse-echo laser ultrasonic wave propagation imaging video data at a multiplicity of points in a scan area on a surface of a structure; (b) post-processing the pulse-echo laser ultrasonic wave propagation imaging video data to create a video freeze-frame; (c) displaying the video freeze-frame on a graphical user interface; (d) selecting at least three points on the video freeze-frame by human interaction with the graphical user interface; (e) calculating an area of a polygon defined by the at least three points; and (f) displaying alphanumeric symbology representing the area calculated in step (e) on the graphical user interface.
- the at least three points are positioned on a boundary of an image of an anomaly displayed on the graphical user interface.
- a further aspect of the subject matter disclosed in detail below is a method for enhanced visualization of anomalies in a structure, comprising: (a) acquiring pulse-echo laser ultrasonic wave propagation imaging video data at a multiplicity of points in a scan area on a surface of a structure; (b) post-processing the pulse-echo laser ultrasonic wave propagation imaging video data to create a video freeze-frame; (c) displaying the video freeze-frame on a graphical user interface; (d) selecting a point on the video freeze-frame by human interaction with the graphical user interface; (e) converting pixel coordinates of the point selected in step (d) to spatial coordinates in a frame of reference of a positioner that supports a laser scanning head; (f) controlling the positioner to move the laser scanning head to a pointing position having the spatial coordinates resulting from step (e); and (g) activating the laser scanning head to emit a laser beam while the laser scanning head is in the pointing position.
- a pulse-echo laser ultrasonic wave propagation imaging system comprising a laser scanning head; a graphical user interface; and a computer system configured to perform the following operations: (a) receiving pulse-echo laser ultrasonic wave propagation imaging video data from pulse-echo laser ultrasonic wave propagation imaging system; (b) post-processing the pulse-echo laser ultrasonic wave propagation imaging video data using multiple-time window amplitude mapping to create a multiple-time window amplitude map; and (c) controlling the graphical user interface to display the multiple-time window amplitude map.
- FIG. 1 is a block diagram identifying some components of a linear-scan pulse-echo laser UWPI system in accordance with one embodiment.
- FIG. 2 is a diagram showing two windows which appear on a graphical user interface in accordance with one embodiment, the window on the left displaying a pulse-echo (PE) laser UWPI video and the window on the right displaying a multiple-time window amplitude map (MTWAM).
- PE pulse-echo
- MTWAM multiple-time window amplitude map
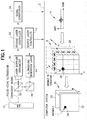
- FIG. 3 is a diagram showing steps in a method for producing a multiple-time window amplitude map in accordance with one embodiment.
- FIG. 4 is a flowchart identifying steps of a method for displaying a multiple-time window amplitude map in accordance with one embodiment.
- FIGS. 5A-5C show scan results for a 2.75-mm-thick composite test specimen having artificial inclusion anomalies distributed in a pattern.
- FIG. 6 is a flowchart identifying steps of a method for calculating the area of a polygon that approximates the shape of an anomaly in a test specimen in accordance with one embodiment.
- FIG. 7A is a diagram representing a scan area on a structure that includes a polygon-shaped anomaly.
- FIG. 7B is a diagram representing a window of a graphical user interface that is showing a video freeze-frame of the scan area depicted in FIG. 7A , which graphical user interface can be used to select vertices of a polygon that approximates the shape of an image of the anomaly depicted in
- FIG. 7A is a diagrammatic representation of FIG. 7A .
- FIG. 8A is a diagram representing a window on a graphical user interface that shows the result of a calculation of the area of an image of one anomaly of a multiplicity of artificial anomalies included in a 2.75-mm-thick composite test specimen, which image appears in one video freeze-frame of the UWPI video.
- FIG. 8B is a diagram representing a window on a graphical user interface that shows the result of a calculation of the area of an image of one anomaly from the same multiplicity of artificial anomalies that appear in FIG. 8A , which image appears in a multiple-time window amplitude map derived from the same UWPI from which the video freeze-frame depicted in FIG. 8A was extracted.
- FIG. 9 is a diagram representing a window on a graphical user interface that shows the result of a calculation of the area of one anomaly of a multiplicity of anomalies included in a 7-mm-thick composite test panel with impact damage that appear in one video freeze-frame of a UWPI video.
- FIG. 10 is a diagram showing the use of an anomaly pointing function to move a laser scanning head to a position whereat an emitted laser beam impinges on an anomaly in a test specimen.
- FIG. 11 shows a graphical user interface comprising respective windows containing a video freeze-frame, a video image of a test setup acquired by a video camera, and an amplitude-versus-time graph representing ultrasonic wave propagation when a laser pulse is pointed at an anomaly using an anomaly pointing function.
- FIG. 1 is a diagram identifying some components of a linear-scan pulse-echo laser UWPI system in accordance with one embodiment.
- This system comprises at least the following components: a source laser controller 12 , an ultrasound generation laser 14 (e.g., a Q-switched solid-state diode pumped laser), a first optical mirror 16 , a second optical mirror 18 , a laser Doppler vibrometer 20 (incorporating a sensing laser, a photodetector and other well-known optical components), a sensing laser controller 22 , an in-line signal conditioner 24 (incorporating bandpass filters and amplifiers), and a computer system 2 that is configured with programming that facilitates acquisition and post-processing of the video data acquired by the system.
- a source laser controller 12 e.g., an ultrasound generation laser 14 (e.g., a Q-switched solid-state diode pumped laser), a first optical mirror 16 , a second optical mirror 18 , a laser Doppler vibrometer 20 (incorporating a
- the ultrasound generation laser 14 , first and second optical mirrors 16 and 18 , and laser Doppler vibrometer 20 are fixedly incorporated in a laser scanning head (see scanning laser head 66 in FIG. 11 ) that is in turn mounted to a two-axis linear positioner capable of translating the laser scanning head in X and Y directions.
- the computer system 2 is configured to control the two-axis linear positioner to move the ultrasound generation laser 14 and laser Doppler vibrometer 20 spatially in relation to a stationary test specimen, thereby enabling an area on a surface of the test specimen to be scanned simultaneously by respective laser beams emitted by the ultrasound generation laser 14 and laser Doppler vibrometer 20 .
- the linear-scan pulse-echo laser UWPI system is depicted in relation to a test specimen 10 which has been placed in the path of the laser pulses produced by the ultrasound generation laser 14 under the control of the source laser controller 12 .
- the laser pulses are generated by a Q-switching technique at a pulse repetition rate.
- the laser pulses emitted by the ultrasound generation laser 14 are reflected by the first optical mirror 16 toward the second optical mirror 18 . That second optical mirror 18 in turn reflects the laser pulses toward the test specimen 10 , preferably at an angle normal to the surface of the test specimen 10 .
- the test specimen is a composite laminate comprising a stack of plies having a thickness
- the laser pulses are propagating in the thickness direction.
- the pulses of laser light emitted by the ultrasound generation laser 14 impinge on the surface of the test specimen, generating a thermoelastic wave with abrupt thermal expansion. That pulsating thermal expansion of the material of the test specimen 10 in turn induces ultrasonic waves that propagate in the thickness direction in various modes. Those ultrasonic waves in turn cause the surface of the test specimen to move, which movement are detected by the laser Doppler vibrometer 20 .
- the sensing laser inside the laser Doppler vibrometer 20 emits a sensing laser beam having a second wavelength different than the first wavelength of the pulsed laser beam.
- the sensing laser may be implemented using a continuous-wave laser interferometer.
- the laser Doppler vibrometer 20 is located so that the emitted sensing laser beam propagates through the second optical mirror 18 and is coincident with the pulsed laser beam from the ultrasound generation laser 14 .
- Ultrasonic sensing using the laser Doppler vibrometer 20 is based on the detection of the frequency shift of the returned laser light of the second wavelength (e.g., the frequency shift of the returned laser light of the first wavelength is filtered out).
- the amplitude and frequency of the ultrasonic waves are extracted from the Doppler shift in the frequency of the reflected laser beam, which shift is due to the motion of the surface of the test specimen.
- the laser Doppler vibrometer 20 is a two-beam laser interferometer that measures the frequency (or phase) difference between an internal reference beam and the sensing laser beam.
- the laser sensing beam is interfered with the reference beam on a photodetector, typically a photodiode.
- a photodetector typically a photodiode.
- Most commercial vibrometers work in a heterodyne regime by adding a known frequency shift (typically 30-40 MHz) to one of the beams. This frequency shift is usually generated by a Bragg cell or acousto-optic modulator.
- the output of the photodetector is a standard frequency modulated signal, with the Bragg cell frequency as the carrier frequency and the Doppler shift as the modulation frequency. This signal can be demodulated to derive the velocity of the vibrating surface of the test specimen during a time interval or window.
- the output of the laser Doppler vibrometer 20 is a continuous analog voltage that is directly proportional to the target velocity component along the direction of the laser beam.
- the electrical signals produced by the photodetector of the laser Doppler vibrometer 20 are amplified and band-pass filtered by the signal conditioner 24 to extract the measured time domain ultrasonic wave and then the signal-conditioned electrical signals (representing video data) are stored in a non-transitory tangible computer-readable storage medium either incorporated in the computer system 2 or accessible by the computer system 2 .
- the computer system 2 executes signal processing algorithms and then controls a display screen to visualize the wave propagation using a UWPI algorithm.
- the UWPI algorithm is configured to produce a visualization (e.g., a video freeze-frame 32 extracted from the UWPI video 30 ) of propagation for through-the-thickness ultrasonic waves, in the time or frequency domain, based on 3-D data processing.
- the ultrasonic wave propagation image generated by the computer system 2 is an image which shows ultrasonic waves that have propagated through at least a portion of the thickness of a structure and then returned to the surface over time.
- the ultrasonic propagation image corresponds to a moving or still image in which the results of the sensing acquired through scanning are time-synchronized and arrayed.
- an ultrasonic wave generated at the surface of the test specimen 10 by the laser pulses may propagate in the thickness direction toward the rear wall of the test specimen, but may be reflected at an interface where an anomaly is located.
- the through-the-thickness location of the anomaly may be calculated based on a propagating time and a propagation speed.
- the computer system 2 further processes the signals resulting from the sensing in a frequency, wave number, or wavelength domain, and presents the result of the sensing as a moving or still image.
- FIG. 1 illustrates at a high level some aspects of the post-processing operations which the computer system 2 is configured to perform.
- the computer system 2 detects the amplitude of the incoming electrical signals from the signal conditioner 24 as a function of time.
- the system operator may input a command instructing the computer system 2 to cause an amplitude-versus-time graph 4 to be displayed on an associated display screen.
- This display process may involve an image processor sending data and commands to a separate display processor that controls the display screen, both the image processor and the display processor being incorporated in the computer system 2 .
- the resulting waveform represents the time-varying amplitude of the pulse-echo ultrasound signal.
- the image processor is also configured to perform a through-the-thickness ultrasound-based pulse-echo ultrasonic propagation imaging technique.
- a through-the-thickness ultrasound-based pulse-echo ultrasonic propagation imaging technique As shown in FIG. 1 , an anomaly in the test specimen 10 is visualized (as represented by an image 26 of an anomaly) by using the pulse-echo ultrasonic propagation imaging technique based on the through-the-thickness ultrasonic waves acquired from the test specimen 10 as a result of scanning the surface of the test specimen 10 .
- One-dimensional electrical signals collected by scanning an array of points in an area on the surface of the test specimen are rearranged to form a three-dimensional video data array 6 (hereinafter “3-D data array 6 ”).
- Each time sequence in the 3-D data array 6 is a respective data subset representing a respective pulse-echo ultrasound signal at a respective point where a pulsed laser beam impinged during the scanning process.
- the number of data elements in a vertical dimension of the 3-D data array 6 (corresponding to the height of the scanned area on the surface of the test specimen 10 ) is V and the number of data elements in a horizontal dimension of the 3-D data array 6 (corresponding to the width of the scanned area on the surface of the test specimen 10 ) is H.
- the arrow T in FIG. 1 represents the time axis.
- the exemplary 3-D data array 6 presented in FIG. 1 shows a black area representing an image 26 of an anomaly.
- the dashed rectilinear lines in the 3-D data array 6 represent a slicing plane 28 , which can be used to produce a time sequence of N video freeze-frames 32 of video data to form a UWPI video 30 .
- the total number of data elements in the 3-D data array 6 will be the product of H ⁇ V ⁇ N.
- the system operator may input a command instructing the computer system 2 to cause any one of the multiplicity of video freeze-frames 32 to be displayed on the associated display screen. All of the video freeze-frames 32 may be taken at the moments when the maximum ultrasonic amplitudes at the anomaly location appeared.
- images can be generated along a time axis T to present a UWPI video 30 for viewing.
- the system operator is able visualize how uniform ultrasound waves are propagated through the thickness of the test specimen 10 over the full scan field.
- the ultrasound generation laser 14 emits a laser beam pulse that generates ultrasonic waves of various modes.
- the laser Doppler vibrometer 20 acquires a pulse-echo ultrasound signal, which is one point in a video freeze-frame 32 of a UWPI video 30 .
- Both the laser pulses and the sensing laser beam are emitted as coincident beams at each of a multiplicity of points that cover the scan area.
- FIG. 2 is a diagram showing two windows which may be displayed on a graphical user interface in accordance with one embodiment of the post-processing methodology proposed herein.
- the window on the left displays a freeze frame 32 extracted from a UWPI video 30 that visualizes ultrasonic wave propagation in a test specimen 10 having a multiplicity of artificial (e.g., manufactured) inclusion anomalies distributed in a pattern.
- the test specimen 10 was made of composite material (e.g., made of carbon fiber/epoxy prepregs) having a thickness of 2.75 mm.
- the window on the right displays a multiple-time window amplitude map 34 (MTWAM) derived from the UWPI video 30 using the methodology proposed herein.
- MTWAM multiple-time window amplitude map 34
- the contrasting images show an improvement in the visualization of anomalies at all depths when multiple-time window amplitude mapping is used.
- the post-processor e.g., computer system 2 configured with post-processing software
- FIG. 3 is a diagram showing steps in a method for deriving a multiple-time window amplitude map 34 from a pulse-echo ultrasonic wavefield 36 of a UWPI video 30 in accordance with one embodiment.
- the full UWPI video 30 comprises a multiplicity of video freeze-frames 32 ( 32 a , 32 b , 32 c ) which can be correlated with respective depths in the test specimen 10 (see FIG. 1 ) based on the speed of wave propagation.
- FIG. 1 the example depicted in FIG.
- first anomaly image 26 a an image 26 a of a first anomaly
- second anomaly image 38 b an image 26 b of a second anomaly
- no image of an anomaly is seen in the first video freeze-frame of a third time window 38 c .
- the time windows containing amplitude information produced by anomalies are selected for further processing. In the example depicted in FIG.
- time window 38 a and time window 38 b were selected.
- the amplitude magnitudes in the selected video freeze-frames of time windows 38 a and 38 b are summed to produce a multiple-time window amplitude map 34 .
- the resulting image contains first and second anomaly images 26 a and 26 b which are readily discernible by an observer.
- the above-described multiple-time window amplitude mapping technique enables multiple anomalies at different depths in a test specimen to be visualized in a single image and provides superior signal-to-noise ratio and visualization quality.
- FIG. 4 is a flowchart identifying steps of a method 50 for displaying multiple-time window amplitude map 34 in accordance with one embodiment.
- the first time window is selected in step 52 .
- the amplitude values of selected time windows are converted to absolute values in step 58 , and then those absolute values of the selected time windows are summed in step 60 .
- the results of this summation are then displayed in the form of a multiple-time window amplitude map (MTWAM) in step 62 , as seen in FIG. 2 .
- MTWAM multiple-time window amplitude map
- FIGS. 5A-5C show scan results for a 2.75-mm-thick composite test specimen having artificial inclusion anomalies distributed in a pattern.
- FIG. 5A shows a PE UWPI video freeze-frame at 2.933 ⁇ s. Some anomalies are not included because they were placed at different depths.
- FIG. 5B shows a PE UWPI video freeze-frame at 5.433 ⁇ s in which some of the anomalies not visible in FIG. 5A are now visible.
- 2.933-2.983 ⁇ s and 5.433-5.850 ⁇ s time windows for multiple-time window amplitude mapping
- a multiple-time window amplitude map 34 was obtained as shown in FIG. 5C .
- Comparison of the images depicted in FIGS. 5A-5C revealed that the multiple-time window amplitude map 34 contained every anomaly and provided superior quality of visualization.
- the computer system 2 is configured to execute an algorithm by which the area of a polygon approximating the shape of anomaly in a test specimen can be calculated.
- the result of the calculation is an estimated area of the anomaly. This estimate may vary from the actual area of the physical anomaly to the extent that the shape of the anomaly deviates from a true polygon.
- FIG. 6 is a flowchart identifying steps of a method 70 for calculating the area of a polygon that approximates the shape of an anomaly in a test specimen in accordance with one embodiment.
- the user viewing the graphical user interface that displays an image of an anomaly first selects one vertex of a polygon as a starting point by clicking on one point on the graphical user interface using a cursor in step 72 .
- the term “polygon” means a polygon that is either convex or concave and not self-intersecting. It should be borne in mind at this juncture in the disclosure that the final polygon does not yet appear on the graphical user interface when the first vertex is selected, but rather will only fully appear when all vertices have been selected.
- next vertex e.g. point
- the system receives an input from a user about whether the polygon is complete or not, in step 76 . If the user responds that the polygon is not complete, then the user repeats step 74 , following which step 76 is repeated.
- the computer system 2 stores the (x, y) coordinates of the pixel on the display screen that was clicked on. Digital data representing a list of the pixel coordinates of the vertices selected by the user is stored in a non-transitory tangible computer-readable storage medium.
- Steps 74 and 76 are reiterated until the user has indicated that the polygon is complete, meaning that the user has selected all vertices of the polygon.
- the user then interacts with the graphical user interface to instruct the computer system 2 to run a polygon area calculation algorithm on the list of points in step 78 .
- the following operations are performed by the computer system: (1) the digital data representing the pixel coordinates of the vertices of the polygon are retrieved from the non-transitory tangible computer-readable storage medium; (2) the retrieved pixel coordinates are converted into spatial coordinates in the frame of reference of the test specimen based on a conversion rate determined during a calibration procedure carried out before the start of the imaging session; and (3) an estimate of the area of the polygon is calculated using the spatial coordinates.
- the computed area is then displayed on the graphical user interface in step 80 .
- FIG. 7A is a diagram representing a scan area 40 on a structure that includes a polygon-shaped anomaly 25 .
- FIG. 7B is a diagram representing a window of a graphical user interface that is showing a video freeze-frame 32 of the scan area 40 depicted in FIG. 7A , which graphical user interface can be used to select vertices of a polygon that approximates the shape of an image 26 of the anomaly 25 depicted in FIG. 7A .
- the area of the polygon can be computed.
- the polygon area equation disclosed in the CRC Standard Mathematical Tables (Beyer, W. H. (Ed.), 28th ed., Boca Raton, Fla., CRC Press (1987), pp. 123-124) can be used.
- the user may select n vertices to form an n-sided polygon, where n is an integer greater than two.
- the coordinates (in the frame of reference of the test specimen, not the pixel coordinates) of the vertices of such an n-sided polygon are (x 1 , y 1 ), (x 2 , y 2 ), (x 3 , y 3 ), . . . , (x n , y n ).
- the area A of the polygon can then be computed using the equation:
- A 1 2 ⁇ ( ⁇ x 1 x 2 y 1 y 2 ⁇ + ⁇ x 2 x 3 y 2 y 3 ⁇ + ... + ⁇ x n x 1 y n y 1 ⁇ )
- the shape of that anomaly can be approximated by a polygon and then the area of that polygon can be computed in the coordinate system of the wing box to provide a measure of the size of the anomaly. More precisely, the polygon approximates the shape of the image of the anomaly that appears on the graphical user interface.
- the polygon is defined by the user selecting at least three points which are positioned on a boundary of the image of the anomaly.
- FIG. 8A is a diagram representing a window on a graphical user interface that shows the result of a calculation of the area of the image of one anomaly of a multiplicity of artificial anomalies included in a 2.75-mm-thick composite test specimen, which image appears in one video freeze-frame 32 of the UWPI video taken at 5.733 ⁇ s (which is the same as in FIG. 5B ).
- the result of the polygonal anomaly area calculation was 344.04 mm 2 .
- the calculation result is displayed on top of the video freeze-frame 32 .
- FIG. 8B is a diagram representing a window on the same graphical user interface that shows the result of a calculation of the area of the image of one of a multiplicity of artificial anomalies included in the same 2.75-mm-thick composite test specimen.
- This image appears in a multiple-time window amplitude map 34 derived from the same UWPI that produced the video freeze-frame 32 depicted in FIG. 8A , but using 2.933-2.983 ⁇ s and 5.433-5.850 ⁇ s time windows for the multiple-time window amplitude mapping (which is the same as in FIG. 5C ).
- the result of the polygonal anomaly area calculation was 129.62 mm 2 .
- the calculation result is displayed on top of the multiple-time window amplitude map 34 .
- a 7-mm-thick composite test panel was constructed with different types of anomalies, including delamination due to impact, sanded surfaces, wrinkles and patched piezoelectric transducers. That test panel was then subjected to UWPI.
- a video freeze-frame acquired at 8.3 ⁇ s is depicted in FIG. 9 , which represents a window on a graphical user interface and further shows the result of a calculation of the area of an image 26 of the anomaly in a selected area 44 of the video freeze-frame 32 .
- the anomaly is a delamination due to impact.
- Other anomalies included other delaminations in delamination areas 46 (indicated by dashed circles in FIG.
- FIG. 9 shows that the area of the image 26 of the anomaly in the selected area 44 was 814.06 mm 2 and clearly reveals that precise area calculation is also possible for a delamination due to impact having a very complex shape using the polygonal anomaly area calculation function.
- FIG. 10 is a diagram showing the use of an anomaly pointing function to move a laser scanning head 66 to a position whereat the emitted laser beam impinges on an anomaly in a scan area 40 on the surface of the test specimen 10 .
- the laser scanning head 66 houses the ultrasound generation laser 14 , first and second optical mirrors 16 and 18 , and laser Doppler vibrometer 20 .
- the scanning laser head 66 is mounted to a two-axis linear positioner 90 (see FIG. 11 ) capable of translating the laser scanning head 66 in X and Y directions.
- the rectangle in the upper left-hand corner of FIG. 10 represents a PE UWPI video freeze-frame 32 produced by scanning a scan area 40 (shown in the upper right-hand corner of FIG. 10 ).
- the black dots spaced at a regular scan interval ⁇ on scan area 40 represent respective laser spots 42 produced during scanning of the surface. Only some of the laser spots 42 are shown for the purpose of illustration, with the understanding that the entire scan area 40 is scanned by activating the laser beam 64 intermittently after each incremental movement by a distance equal to the scan interval ⁇ .
- the video freeze-frame 32 includes an image 26 of an anomaly which appears to have a quadrilateral shape (e.g., a polygon with four sides)
- the scan area 40 includes the physical anomaly 25 that produced the image 26 seen in freeze frame 32 .
- each pixel of the video freeze-frame 32 has pixel coordinates which are correlated to an (x, y) coordinate system of the test specimen with an origin (0, 0) at the lower left-hand corner of the freeze frame 32 .
- the scanning laser head 66 is at an initial scan position 82
- the laser beam 64 has coordinates (a, b) in the coordinate system of the two-axis linear positioner 90 .
- commands to move the linear scanning head 66 to another position are given in the form of coordinates in the frame of reference of the two-axis linear positioner 90 . For example, as depicted in FIG.
- the two-axis linear positioner 90 is instructed by the computer system 2 (see FIG. 1 ) to move the laser scanning head 66 such that the laser beam 64 impinges on a point having coordinates (x+a, y+b) in the frame of reference of the two-axis linear positioner 90 .
- the user selects a point 68 on the image 26 of an anomaly visible in the video freeze-frame 32 .
- the selected point has a position (x, y) in the coordinate system of the test specimen 10 .
- This position is then converted to a corresponding position (x+a, y+b) in the coordinate system of the two-axis linear positioner 90 .
- the scanning laser head 66 is moved from the position indicated by dashed lines in FIG. 10 to the selected position (x+a, y+b) (indicated by solid lines in FIG. 1 ) in order for the laser beam 64 to be pointed at the anomaly 25 .
- the laser beam 64 can be moved so that it points at whichever position within the scan area 40 has been selected by the user.
- the ability to point a laser beam 64 at a point on the composite part by clicking on a corresponding point on a video freeze-frame 32 allows an inspector to then perform additional inspection of the anomaly, including addition UWPI.
- the inspector may mark the position being pointed at on the composite part, thereby designating the area for testing or repair at a later time.
- FIG. 11 shows a graphical user interface 100 comprising a first window containing a video freeze-frame 32 , a second window comprising a video image 92 of the test setup acquired by a video camera (not shown), and a window showing an amplitude-versus-time graph 4 representing the propagation of the ultrasonic wave produced when a laser pulse is pointed at the anomaly using the anomaly pointing function.
- the coordinates of the laser spot may be displayed on the video freeze-frame 32 .
- the coordinates of the selected position in the frame of reference of the two-axis linear positioner 90 are (124.75, 121.5).
- the two-axis linear positioner 90 comprises a stationary mounting stage 84 , an X-axis linear stage 86 which is translatably coupled to the mounting stage 84 for translation in either direction along an X-axis, and a Y-axis linear stage 88 translatably coupled to the X-axis linear stage 86 for translation in either direction along a Y-axis.
- the laser scanning head 66 is fixedly coupled to the Y-axis linear stage 88 .
- the structure and operation of multi-axis linear positioners is well known in the art of robotics.
- a method for enhanced visualization of anomalies in a structure comprises the following steps: (a) acquiring pulse-echo laser ultrasonic wave propagation imaging video data at a multiplicity of points in a scan area on a surface of a structure; (b) post-processing the pulse-echo laser ultrasonic wave propagation imaging video data using multiple-time window amplitude mapping to create a multiple-time window amplitude map; (c) displaying the multiple-time window amplitude map on a graphical user interface; (d) selecting at least three points on the multiple-time window amplitude map by human interaction with the graphical user interface; (e) calculating an area of a polygon defined by the at least three points; (f) displaying alphanumeric symbology representing the area calculated in step (e) on the graphical user interface; (g) selecting a point on the multiple-time window amplitude map by human interaction with the graphical user interface; (h) converting pixel coordinate
- computer system should be construed broadly to encompass a system having at least one computer or processor, and which may have multiple computers or processors that communicate through a network or bus.
- Some steps of the methods described herein may be encoded as executable instructions embodied in a non-transitory tangible computer-readable storage medium, including, without limitation, a storage device and/or a memory device. Such instructions, when executed by a processing or computing system, cause the system device to perform at least a portion of the methods described herein.
Abstract
Description
In cases where a composite part, such as a wing box of an aircraft, undergoes UWPI and an anomaly is revealed, the shape of that anomaly can be approximated by a polygon and then the area of that polygon can be computed in the coordinate system of the wing box to provide a measure of the size of the anomaly. More precisely, the polygon approximates the shape of the image of the anomaly that appears on the graphical user interface. The polygon is defined by the user selecting at least three points which are positioned on a boundary of the image of the anomaly.
Claims (20)
Priority Applications (7)
| Application Number | Priority Date | Filing Date | Title |
|---|---|---|---|
| US15/935,349 US11079357B2 (en) | 2018-03-26 | 2018-03-26 | Method and apparatus for enhanced visualization of anomalies in a structure |
| EP19156269.3A EP3546933B1 (en) | 2018-03-26 | 2019-02-08 | Method and apparatus for enhanced visualization of anomalies in a structure using ultrasound |
| JP2019023450A JP7323295B2 (en) | 2018-03-26 | 2019-02-13 | Method and apparatus for improving visualization of anomalies in structures |
| BR102019005884-6A BR102019005884A2 (en) | 2018-03-26 | 2019-03-25 | METHOD AND APPARATUS FOR IMPROVED DISPLAY OF ANOMALIES IN A FRAMEWORK |
| CA3037906A CA3037906C (en) | 2018-03-26 | 2019-03-25 | Method and apparatus for enhanced visualization of anomalies in a structure |
| KR1020190034359A KR20190112670A (en) | 2018-03-26 | 2019-03-26 | Method and apparatus for enhanced visualization of anomalies in a structure |
| CN201910232470.3A CN110363864A (en) | 2018-03-26 | 2019-03-26 | Enhancing visualization method and equipment for textural anomaly |
Applications Claiming Priority (1)
| Application Number | Priority Date | Filing Date | Title |
|---|---|---|---|
| US15/935,349 US11079357B2 (en) | 2018-03-26 | 2018-03-26 | Method and apparatus for enhanced visualization of anomalies in a structure |
Publications (2)
| Publication Number | Publication Date |
|---|---|
| US20190293608A1 US20190293608A1 (en) | 2019-09-26 |
| US11079357B2 true US11079357B2 (en) | 2021-08-03 |
Family
ID=65365889
Family Applications (1)
| Application Number | Title | Priority Date | Filing Date |
|---|---|---|---|
| US15/935,349 Active 2040-01-12 US11079357B2 (en) | 2018-03-26 | 2018-03-26 | Method and apparatus for enhanced visualization of anomalies in a structure |
Country Status (7)
| Country | Link |
|---|---|
| US (1) | US11079357B2 (en) |
| EP (1) | EP3546933B1 (en) |
| JP (1) | JP7323295B2 (en) |
| KR (1) | KR20190112670A (en) |
| CN (1) | CN110363864A (en) |
| BR (1) | BR102019005884A2 (en) |
| CA (1) | CA3037906C (en) |
Families Citing this family (1)
| Publication number | Priority date | Publication date | Assignee | Title |
|---|---|---|---|---|
| US11209259B1 (en) * | 2020-09-30 | 2021-12-28 | Beihang University | All-optical ultrasonic detection device based on light-induced ultrasound and laser interference |
Citations (14)
| Publication number | Priority date | Publication date | Assignee | Title |
|---|---|---|---|---|
| US20030089171A1 (en) * | 2001-11-14 | 2003-05-15 | Kenefick Steven A. | Method for sizing surface breaking discontinuities with ultrasonic imaging |
| US6996480B2 (en) * | 2002-06-14 | 2006-02-07 | University Of South Carolina | Structural health monitoring system utilizing guided lamb waves embedded ultrasonic structural radar |
| JP2006519369A (en) * | 2003-02-21 | 2006-08-24 | ムルカイ,グイド,デー.,カー. ダ | Method and apparatus for scanning corrosion and surface defects |
| US20100042338A1 (en) * | 2008-08-12 | 2010-02-18 | University Of South Carolina | Structural Health Monitoring Apparatus and Methodology |
| WO2010048258A1 (en) * | 2008-10-23 | 2010-04-29 | Washington University In St. Louis | Reflection-mode photoacoustic tomography using a flexibly-supported cantilever beam |
| WO2010077044A2 (en) * | 2008-12-31 | 2010-07-08 | 전북대학교산학협력단 | Acoustic ultrasonic wave imaging apparatus |
| US20110087094A1 (en) * | 2009-10-08 | 2011-04-14 | Hiroyuki Ohuchi | Ultrasonic diagnosis apparatus and ultrasonic image processing apparatus |
| US20120327187A1 (en) * | 2011-06-22 | 2012-12-27 | The Boeing Company | Advanced remote nondestructive inspection system and process |
| US20130182008A1 (en) * | 2012-01-12 | 2013-07-18 | Siemens Medical Solutions Usa, Inc. | Symmetry-Based Visualization for Enhancing Anomaly Detection |
| JP5753346B2 (en) * | 2009-04-01 | 2015-07-22 | 三星メディソン株式会社Samsung Medison Co.,Ltd. | Ultrasound system and method for providing multiple 3D ultrasound images using volume slices |
| US20160217587A1 (en) * | 2014-12-11 | 2016-07-28 | Jeffrey R. Hay | Apparatus and Method for Analyzing Periodic Motions in Machinery |
| US20160252616A1 (en) * | 2015-02-27 | 2016-09-01 | Raytheon Company | Laser synthetic aperture sonar for buried object detection |
| US20160349217A1 (en) * | 2015-05-29 | 2016-12-01 | Korea Advanced Institute Of Science And Technology | Apparatus and method for full-field pulse-echo laser ultrasonic propagation imaging |
| US20190025258A1 (en) * | 2017-07-20 | 2019-01-24 | Airbus (S.A.S.) | Device and method for non-destructive ultrasound inspection of structures made of composite material |
Family Cites Families (10)
| Publication number | Priority date | Publication date | Assignee | Title |
|---|---|---|---|---|
| JP5413051B2 (en) * | 2009-08-21 | 2014-02-12 | 株式会社豊田中央研究所 | Ultrasonic inspection system |
| KR101173955B1 (en) * | 2010-02-26 | 2012-08-14 | 국방과학연구소 | Apparatus of in-plane or out-of-plane ultrasonic propagation imaging in frequency domain and method thereof |
| CN101852774B (en) * | 2010-05-14 | 2012-10-24 | 西安金波检测仪器有限责任公司 | Flaw detection system and flaw detection method |
| EP2745107A1 (en) | 2011-08-17 | 2014-06-25 | EMPA Eidgenössische Materialprüfungs- und Forschungsanstalt | Air coupled ultrasonic contactless method for non-destructive determination of defects in laminated structures |
| WO2013188713A1 (en) | 2012-06-13 | 2013-12-19 | Seno Medical Instruments, Inc. | System and method for normalizing range in an optoacoustic imaging system |
| JP5893538B2 (en) * | 2012-09-20 | 2016-03-23 | 日立Geニュークリア・エナジー株式会社 | Nondestructive inspection method and apparatus using guide wave |
| WO2014144257A1 (en) | 2013-03-15 | 2014-09-18 | Seno Medical Instruments, Inc. | Optoacoustic component utilization tracking |
| WO2016119247A1 (en) * | 2015-01-30 | 2016-08-04 | 深圳迈瑞生物医疗电子股份有限公司 | Ultrasonic imaging method and system |
| CN106102588B (en) * | 2015-09-06 | 2019-04-23 | 深圳迈瑞生物医疗电子股份有限公司 | Ultrasound grayscale imaging system and method |
| US10126122B2 (en) * | 2016-04-14 | 2018-11-13 | The Boeing Company | Ultrasonic inspection of wrinkles in composite objects |
-
2018
- 2018-03-26 US US15/935,349 patent/US11079357B2/en active Active
-
2019
- 2019-02-08 EP EP19156269.3A patent/EP3546933B1/en active Active
- 2019-02-13 JP JP2019023450A patent/JP7323295B2/en active Active
- 2019-03-25 BR BR102019005884-6A patent/BR102019005884A2/en unknown
- 2019-03-25 CA CA3037906A patent/CA3037906C/en active Active
- 2019-03-26 KR KR1020190034359A patent/KR20190112670A/en unknown
- 2019-03-26 CN CN201910232470.3A patent/CN110363864A/en active Pending
Patent Citations (14)
| Publication number | Priority date | Publication date | Assignee | Title |
|---|---|---|---|---|
| US20030089171A1 (en) * | 2001-11-14 | 2003-05-15 | Kenefick Steven A. | Method for sizing surface breaking discontinuities with ultrasonic imaging |
| US6996480B2 (en) * | 2002-06-14 | 2006-02-07 | University Of South Carolina | Structural health monitoring system utilizing guided lamb waves embedded ultrasonic structural radar |
| JP2006519369A (en) * | 2003-02-21 | 2006-08-24 | ムルカイ,グイド,デー.,カー. ダ | Method and apparatus for scanning corrosion and surface defects |
| US20100042338A1 (en) * | 2008-08-12 | 2010-02-18 | University Of South Carolina | Structural Health Monitoring Apparatus and Methodology |
| WO2010048258A1 (en) * | 2008-10-23 | 2010-04-29 | Washington University In St. Louis | Reflection-mode photoacoustic tomography using a flexibly-supported cantilever beam |
| WO2010077044A2 (en) * | 2008-12-31 | 2010-07-08 | 전북대학교산학협력단 | Acoustic ultrasonic wave imaging apparatus |
| JP5753346B2 (en) * | 2009-04-01 | 2015-07-22 | 三星メディソン株式会社Samsung Medison Co.,Ltd. | Ultrasound system and method for providing multiple 3D ultrasound images using volume slices |
| US20110087094A1 (en) * | 2009-10-08 | 2011-04-14 | Hiroyuki Ohuchi | Ultrasonic diagnosis apparatus and ultrasonic image processing apparatus |
| US20120327187A1 (en) * | 2011-06-22 | 2012-12-27 | The Boeing Company | Advanced remote nondestructive inspection system and process |
| US20130182008A1 (en) * | 2012-01-12 | 2013-07-18 | Siemens Medical Solutions Usa, Inc. | Symmetry-Based Visualization for Enhancing Anomaly Detection |
| US20160217587A1 (en) * | 2014-12-11 | 2016-07-28 | Jeffrey R. Hay | Apparatus and Method for Analyzing Periodic Motions in Machinery |
| US20160252616A1 (en) * | 2015-02-27 | 2016-09-01 | Raytheon Company | Laser synthetic aperture sonar for buried object detection |
| US20160349217A1 (en) * | 2015-05-29 | 2016-12-01 | Korea Advanced Institute Of Science And Technology | Apparatus and method for full-field pulse-echo laser ultrasonic propagation imaging |
| US20190025258A1 (en) * | 2017-07-20 | 2019-01-24 | Airbus (S.A.S.) | Device and method for non-destructive ultrasound inspection of structures made of composite material |
Non-Patent Citations (10)
| Title |
|---|
| Ehrhart et al., "Non-destructive evaluation (NDE) of aerospace composites: methods for testing adhesively bonded components," In: Non-Destructive Evaluation (NDE) of Polymer Matrix Composites, Jan. 1, 2013, pp. 220-237. |
| Endrerud et al., "DolphiCam User Manual," Jun. 27, 2013. |
| European Examination Communication dated Mar. 5, 2021 in European Patent Application No. 19156269.3 (European counterpart to the instant U.S. patent application). |
| Extended European Search Report dated Jul. 17, 2019 in European Patent Application No. 191562693 (European counterpart to the instant U.S. patent application). |
| Kumar et al., "Development and Applications of C-Scan Ultrasonic Facility," BARC Newsletter, No. 285, Oct. 1, 2007, pp. 49-57. |
| Lee, Chia, Park and Jeong, "Laser ultrasonic anomalous wave propagation imaging method with adjacent wave subtraction: Algorithm," Optics & Laser Technology, vol. 44 (2012), pp. 1507-1515. |
| Lee, Jang and Kong, "Fully Noncontact Wave Propagation Imaging in an Immersed Metallic Plate with a Crack," Shock and Vibration, vol. 2014, Article ID 895693, pp. 1-8 (http://dx.doi.org/10.1155/2014/895693). |
| Mallet et al., "Structural health monitoring using scanning laser vibrometry: II. Lamb waves for damage detection," Smart Materials and Structures, vol. 13, No. 2, Apr. 2, 2004, pp. 261-269. |
| Sao et al., "Scanning acoustic microscopy as a tool for quantitative characterisation of damage in CFRPs," Composites Science and Technology, vol. 59, No. 3, Dec. 4, 2013, pp. 345-354. |
| Teti et al., "Ultrasonic Identification and Measurement of Defects in Composite Material Laminates," CIRP Annals—Manufacturing Technology, vol. 39, No. 1, Jan. 1, 1990, pp. 527-530. |
Also Published As
| Publication number | Publication date |
|---|---|
| BR102019005884A2 (en) | 2019-10-01 |
| CA3037906A1 (en) | 2019-09-26 |
| JP7323295B2 (en) | 2023-08-08 |
| EP3546933B1 (en) | 2023-05-03 |
| CN110363864A (en) | 2019-10-22 |
| US20190293608A1 (en) | 2019-09-26 |
| EP3546933A1 (en) | 2019-10-02 |
| CA3037906C (en) | 2023-08-29 |
| JP2019174445A (en) | 2019-10-10 |
| KR20190112670A (en) | 2019-10-07 |
Similar Documents
| Publication | Publication Date | Title |
|---|---|---|
| CN101852774B (en) | Flaw detection system and flaw detection method | |
| KR101118657B1 (en) | Ultrasonic inspection device | |
| JP2013079949A (en) | Imaging system and method | |
| JP4634336B2 (en) | Ultrasonic flaw detection method and ultrasonic flaw detection apparatus | |
| WO2014050797A1 (en) | Ultrasonic inspection device, ultrasonic inspection method, program, and recording medium | |
| JP6263447B2 (en) | Ultrasonic diagnostic apparatus and program | |
| JP5905808B2 (en) | Ultrasonic inspection apparatus, ultrasonic image data generation method and program | |
| JP5623160B2 (en) | Ultrasonic diagnostic apparatus and method for operating the same | |
| CA3037906C (en) | Method and apparatus for enhanced visualization of anomalies in a structure | |
| JPWO2018212115A1 (en) | Apparatus and method for tomographically visualizing viscoelasticity of tissue | |
| JP5873412B2 (en) | Ultrasonic diagnostic apparatus, sound speed determination method and program | |
| JPS59122942A (en) | Ultrasonic wave microscope apparatus | |
| KR20160125934A (en) | Ultrasonic image display apparatus and control program thereof | |
| JP5235028B2 (en) | Ultrasonic flaw detection method and ultrasonic flaw detection apparatus | |
| JP2014064856A (en) | Ultrasonic examination apparatus, signal processing method of ultrasonic examination apparatus and program | |
| JPS6336465B2 (en) | ||
| Chia et al. | New design and algorithm for an ultrasonic propagation imaging system | |
| CN115684024B (en) | Residual stress distribution detection method and system based on laser ultrasound | |
| CN111929365B (en) | Ultrasonic imaging detection display method | |
| JP7059503B2 (en) | Image processing method for ultrasonic propagation video | |
| JP4787914B2 (en) | Sonic velocity measuring method, sonic velocity measuring apparatus, and ultrasonic image inspection apparatus | |
| CN115773836A (en) | Residual stress eliminating and detecting method based on laser ultrasound | |
| JP3324806B2 (en) | Ultrasound diagnostic equipment | |
| JP2013255598A (en) | Apparatus and method for ultrasonic diagnosis | |
| JPH0486553A (en) | Inclination adjusting device for sample in supersonic microscope |
Legal Events
| Date | Code | Title | Description |
|---|---|---|---|
| FEPP | Fee payment procedure |
Free format text: ENTITY STATUS SET TO UNDISCOUNTED (ORIGINAL EVENT CODE: BIG.); ENTITY STATUS OF PATENT OWNER: LARGE ENTITY |
|
| AS | Assignment |
Owner name: THE BOEING COMPANY, ILLINOIS Free format text: ASSIGNMENT OF ASSIGNORS INTEREST;ASSIGNOR:IHN, JEONG-BEOM;REEL/FRAME:045366/0603 Effective date: 20180323 |
|
| AS | Assignment |
Owner name: THE BOEING COMPANY, ILLINOIS Free format text: ASSIGNMENT OF ASSIGNORS INTEREST;ASSIGNOR:LEE, JUNG-RYUL;REEL/FRAME:048668/0820 Effective date: 20190314 Owner name: KOREA ADVANCED INSTITUTE OF SCIENCE AND TECHNOLOGY Free format text: ASSIGNMENT OF ASSIGNORS INTEREST;ASSIGNOR:LEE, JUNG-RYUL;REEL/FRAME:048669/0218 Effective date: 20190314 Owner name: KOREA ADVANCED INSTITUTE OF SCIENCE AND TECHNOLOGY, KOREA, REPUBLIC OF Free format text: ASSIGNMENT OF ASSIGNORS INTEREST;ASSIGNOR:LEE, JUNG-RYUL;REEL/FRAME:048669/0218 Effective date: 20190314 |
|
| AS | Assignment |
Owner name: KOREA ADVANCED INSTITUTE OF SCIENCE AND TECHNOLOGY Free format text: ASSIGNMENT OF ASSIGNORS INTEREST;ASSIGNOR:THE BOEING COMPANY;REEL/FRAME:050893/0695 Effective date: 20191030 Owner name: KOREA ADVANCED INSTITUTE OF SCIENCE AND TECHNOLOGY, KOREA, REPUBLIC OF Free format text: ASSIGNMENT OF ASSIGNORS INTEREST;ASSIGNOR:THE BOEING COMPANY;REEL/FRAME:050893/0695 Effective date: 20191030 |
|
| STPP | Information on status: patent application and granting procedure in general |
Free format text: RESPONSE TO NON-FINAL OFFICE ACTION ENTERED AND FORWARDED TO EXAMINER |
|
| STPP | Information on status: patent application and granting procedure in general |
Free format text: NON FINAL ACTION MAILED |
|
| STPP | Information on status: patent application and granting procedure in general |
Free format text: RESPONSE TO NON-FINAL OFFICE ACTION ENTERED AND FORWARDED TO EXAMINER |
|
| STPP | Information on status: patent application and granting procedure in general |
Free format text: NOTICE OF ALLOWANCE MAILED -- APPLICATION RECEIVED IN OFFICE OF PUBLICATIONS |
|
| STPP | Information on status: patent application and granting procedure in general |
Free format text: PUBLICATIONS -- ISSUE FEE PAYMENT VERIFIED |
|
| STCF | Information on status: patent grant |
Free format text: PATENTED CASE |