US10775440B2 - Methods, apparatuses, and systems for measuring impedance spectrum, power spectrum, or spectral density using frequency component analysis of power converter voltage and current ripples - Google Patents
Methods, apparatuses, and systems for measuring impedance spectrum, power spectrum, or spectral density using frequency component analysis of power converter voltage and current ripples Download PDFInfo
- Publication number
- US10775440B2 US10775440B2 US15/687,885 US201715687885A US10775440B2 US 10775440 B2 US10775440 B2 US 10775440B2 US 201715687885 A US201715687885 A US 201715687885A US 10775440 B2 US10775440 B2 US 10775440B2
- Authority
- US
- United States
- Prior art keywords
- ripple
- frequency
- current
- voltage
- power converter
- Prior art date
- Legal status (The legal status is an assumption and is not a legal conclusion. Google has not performed a legal analysis and makes no representation as to the accuracy of the status listed.)
- Active, expires
Links
- 238000001453 impedance spectrum Methods 0.000 title claims abstract description 116
- 230000003595 spectral effect Effects 0.000 title claims abstract description 111
- 238000001228 spectrum Methods 0.000 title claims abstract description 83
- 238000000034 method Methods 0.000 title claims abstract description 47
- 238000004458 analytical method Methods 0.000 title claims abstract description 42
- 238000012545 processing Methods 0.000 claims description 27
- 230000004044 response Effects 0.000 claims description 21
- 238000005259 measurement Methods 0.000 claims description 15
- 239000003990 capacitor Substances 0.000 claims description 6
- 238000001514 detection method Methods 0.000 claims description 5
- 230000036541 health Effects 0.000 claims description 5
- 238000012546 transfer Methods 0.000 claims description 3
- 238000010586 diagram Methods 0.000 description 16
- 238000004891 communication Methods 0.000 description 10
- 238000002847 impedance measurement Methods 0.000 description 9
- 230000006870 function Effects 0.000 description 8
- 230000008859 change Effects 0.000 description 6
- 239000000523 sample Substances 0.000 description 6
- 230000002457 bidirectional effect Effects 0.000 description 5
- 239000000446 fuel Substances 0.000 description 5
- 230000003287 optical effect Effects 0.000 description 5
- 230000008901 benefit Effects 0.000 description 4
- 230000000694 effects Effects 0.000 description 3
- 230000003044 adaptive effect Effects 0.000 description 2
- 238000001739 density measurement Methods 0.000 description 2
- 238000005516 engineering process Methods 0.000 description 2
- 230000001939 inductive effect Effects 0.000 description 2
- 230000010363 phase shift Effects 0.000 description 2
- 230000008569 process Effects 0.000 description 2
- 238000005070 sampling Methods 0.000 description 2
- 230000005355 Hall effect Effects 0.000 description 1
- 230000005540 biological transmission Effects 0.000 description 1
- 230000001419 dependent effect Effects 0.000 description 1
- 238000004519 manufacturing process Methods 0.000 description 1
- 239000000463 material Substances 0.000 description 1
- 230000007246 mechanism Effects 0.000 description 1
- 238000012544 monitoring process Methods 0.000 description 1
- 230000003094 perturbing effect Effects 0.000 description 1
- 238000004611 spectroscopical analysis Methods 0.000 description 1
- 238000012360 testing method Methods 0.000 description 1
Images


Classifications
-
- G—PHYSICS
- G01—MEASURING; TESTING
- G01R—MEASURING ELECTRIC VARIABLES; MEASURING MAGNETIC VARIABLES
- G01R31/00—Arrangements for testing electric properties; Arrangements for locating electric faults; Arrangements for electrical testing characterised by what is being tested not provided for elsewhere
- G01R31/36—Arrangements for testing, measuring or monitoring the electrical condition of accumulators or electric batteries, e.g. capacity or state of charge [SoC]
- G01R31/389—Measuring internal impedance, internal conductance or related variables
-
- G—PHYSICS
- G01—MEASURING; TESTING
- G01R—MEASURING ELECTRIC VARIABLES; MEASURING MAGNETIC VARIABLES
- G01R31/00—Arrangements for testing electric properties; Arrangements for locating electric faults; Arrangements for electrical testing characterised by what is being tested not provided for elsewhere
- G01R31/36—Arrangements for testing, measuring or monitoring the electrical condition of accumulators or electric batteries, e.g. capacity or state of charge [SoC]
- G01R31/392—Determining battery ageing or deterioration, e.g. state of health
-
- G—PHYSICS
- G01—MEASURING; TESTING
- G01R—MEASURING ELECTRIC VARIABLES; MEASURING MAGNETIC VARIABLES
- G01R23/00—Arrangements for measuring frequencies; Arrangements for analysing frequency spectra
- G01R23/16—Spectrum analysis; Fourier analysis
Definitions
- EIS Electrochemical AC/Complex Impedance Spectrum
- Methods, apparatuses, and systems for measuring impedance spectrum using frequency component analysis of power converter voltage and current ripples are described herein.
- Methods, apparatuses, and systems for measuring power spectrum or spectral density using frequency component analysis of power converter voltage and current ripples are also described herein.
- An example method for measuring impedance spectrum, power spectrum, or spectral density can include measuring an alternating current (AC) ripple associated with a power converter, where the AC ripple includes an AC current ripple and an AC voltage ripple.
- the method can also include performing a frequency analysis to obtain respective frequency components of the AC current ripple and the AC voltage ripple, and calculating an impedance spectrum, a power spectrum, or a spectral density of an electrical component based on the respective frequency components of the AC current ripple and the AC voltage ripple.
- AC alternating current
- the method can also include performing a frequency analysis to obtain respective frequency components of the AC current ripple and the AC voltage ripple, and calculating an impedance spectrum, a power spectrum, or a spectral density of an electrical component based on the respective frequency components of the AC current ripple and the AC voltage ripple.
- the impedance spectrum, the power spectrum, or the spectral density can include values at a plurality of frequencies.
- the plurality of frequencies can include frequencies equal to or greater than a switching ripple frequency of the power converter (e.g., a plurality of harmonic frequencies greater than the switching ripple frequency).
- the impedance spectrum, the power spectrum, or the spectral density can be calculated using measurements of the AC ripple obtained over a single switching ripple cycle of the power converter.
- the impedance spectrum, the power spectrum, or the spectral density can optionally be calculated using measurements of the AC ripple obtained over a plurality of switching ripple cycles of the power converter.
- the impedance spectrum, the power spectrum, or the spectral density can be calculated while the power converter is online delivering power to a load.
- performing the frequency analysis can include using a Discrete Fourier Transform (DFT) or the Fast Fourier Transform (FFT), for example.
- DFT Discrete Fourier Transform
- FFT Fast Fourier Transform
- measuring the AC ripple can include measuring voltage and current associated with the electrical component.
- the electrical component can be a power source or load.
- the power source or load can be, but is not limited to, a battery, a solar cell or panel, a fuel cell, a supercapacitor, a motor, a generator, an antenna, a wireless power coil, or a piezoelectric energy harvester.
- the electrical component can be a component of the power converter such as an inductor, capacitor, transistor, diode, or transformer.
- a plurality of electrical components can be connected in series and/or in parallel.
- measuring the AC ripple can include measuring respective voltages and currents associated with each of the electrical components.
- the method can further include calculating a respective impedance spectrum, power spectrum, or spectral density of each of the electrical components.
- the method can further include varying a switching frequency of the power converter.
- the impedance spectrum, the power spectrum, or the spectral density can be calculated based on respective frequency components of the AC current ripple and the AC voltage ripple at a first switching frequency and respective frequency components of the AC current ripple and the AC voltage ripple at a second switching frequency.
- the method can further include applying a step-function perturbation configured to increase an output voltage or current of the power converter, measuring voltage and current associated with the electrical component in response to the step-function perturbation, and performing a frequency analysis to obtain respective frequency components of the response voltage and current associated with the electrical component.
- the impedance spectrum, the power spectrum, or the spectral density can be calculated based on the respective frequency components of the response voltage and current associated with the electrical component.
- the step-function perturbation can be performed at a fundamental frequency less than the switching frequency of the power converter. For example, this perturbation can be performed at less than one-half the switching frequency of the power converter or at a frequency 10 or more times less than the switching frequency of the power converter.
- frequency components are obtained at the fundamental frequency of the step-function perturbation and a plurality of frequencies greater than the fundamental frequency.
- the impedance spectrum, the power spectrum, or the spectral density including values at the fundamental frequency of the step-function perturbation and its harmonic frequencies. This includes values of the impedance spectrum, the power spectrum, or the spectral density at frequencies less than the switching frequency of the power converter.
- the method can include applying a duty cycle perturbation to the power converter, which causes a change in the voltage and current responses.
- the impedance spectrum, the power spectrum, or the spectral density can include values at a plurality of frequencies equal to or less than a switching ripple frequency of the power converter.
- the impedance spectrum, the power spectrum, or the spectral density can be calculated using measurements of the AC ripple obtained over a plurality of switching ripple cycles of the power converter.
- the duty cycle perturbation can be performed at a fundamental frequency less than the switching frequency of the power converter. For example, this perturbation can be performed at less than one-half the switching frequency of the power converter or at a frequency 10 or more times less than the switching frequency of the power converter.
- frequency components are obtained at the fundamental frequency of the duty cycle perturbation and a plurality of frequencies greater than the fundamental frequency.
- the impedance spectrum, the power spectrum, or the spectral density including values at the fundamental frequency of the duty cycle perturbation and its harmonic frequencies. This includes values of the impedance spectrum, the power spectrum, or the spectral density at frequencies less than the switching frequency of the power converter.
- the method can include cancelling the effect of the step-function perturbation or the duty cycle perturbation on the resulted step ripple at the output of the power converter by controlling the power converter simultaneously with one or more other power converters.
- the method can include using the impedance spectrum, the power spectrum, or the spectral density to obtain a state of health (SOH) or state of charge (SOC) of the electrical component.
- SOH state of health
- SOC state of charge
- the method can include controlling the power converter based on the impedance spectrum, the power spectrum, or the spectral density.
- controlling the power converter can include at least one of adjusting a frequency, duty cycle, output voltage, or output current; performing fault detection; maximizing efficiency or power transfer; or performing maximum power point tracking.
- performing fault detection can further include detecting a fault in the electrical component based on a rate of change of the impedance spectrum, the power spectrum, or the spectral density.
- the method can further include isolating the electrical component or providing an alarm.
- the AC ripple can be a triangular or non-triangular waveform.
- the apparatus can include a current sensor configured for measuring current flowing through an electrical component, and a voltage sensor configured for measuring voltage across the electrical component.
- the measured current and voltage can include an alternating current (AC) ripple associated with a power converter, and the AC ripple can include an AC current ripple and an AC voltage ripple.
- the apparatus can also include a controller operably coupled to the current sensor and the voltage sensor.
- the controller can include a processing unit and a memory operably coupled to the processing unit, and the controller can be configured to measure impedance spectrum, power spectrum, or spectral density of the electrical component.
- the controller can be configured to receive and sample the current and voltage measured by the current and voltage sensors, perform a frequency analysis on the sampled current and voltage to obtain respective frequency components of the AC current ripple and the AC voltage ripple, and calculate an impedance spectrum, a power spectrum, or a spectral density of the electrical component based on the respective frequency components of the AC current ripple and the AC voltage ripple. It should be understood that the controller can be configured to measure impedance spectrum, power spectrum, or spectral density according to any of the techniques described herein.
- the electrical component can be a power source or load.
- the electrical component can be a component of the power converter.
- the apparatus can further include a power converter controller operably connected to the controller.
- the system can include a power converter electrically connected between a power source and a load, an electrical component operably connected with the power converter, a current sensor configured for measuring current flowing through the electrical component, and a voltage sensor configured for measuring voltage across the electrical component.
- the measured current and voltage can include an alternating current (AC) ripple associated with a power converter, and the AC ripple can include an AC current ripple and an AC voltage ripple.
- the system can also include a controller operably coupled to the current sensor and the voltage sensor.
- the controller can include a processing unit and a memory operably coupled to the processing unit, and the controller can be configured to measure impedance spectrum, power spectrum, or spectral density of the electrical component.
- the controller can be configured to receive and sample the current and voltage measured by the current and voltage sensors, perform a frequency analysis on the sampled current and voltage to obtain respective frequency components of the AC current ripple and the AC voltage ripple, and calculate an impedance spectrum, a power spectrum, or a spectral density of the electrical component based on the respective frequency components of the AC current ripple and the AC voltage ripple. It should be understood that the controller can be configured to measure impedance spectrum, power spectrum, or spectral density according to any of the techniques described herein.
- the system can include a plurality of electrical components, which can be connected to the power converter in series or in parallel.
- the current sensor and the voltage sensor can be configured to measure respective voltages and currents associated with each of the electrical components, and the controller can be configured to calculate a respective impedance spectrum, power spectrum, or spectral density of each of the electrical components.
- the system can optionally further include a power converter controller operably connected to the controller.
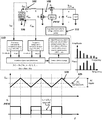
- FIG. 1 illustrates an example apparatus for measuring electrochemical impedance spectrum (EIS) of a battery using frequency component analysis of power converter voltage and current ripple.
- EIS electrochemical impedance spectrum
- FIG. 2 includes graphs illustrating example AC current ripple imposed on the DC value of current passing through a battery and example AC voltage ripple imposed on the DC value of voltage across the battery, as well as example operations for measuring the impedance spectrum of a battery (i.e., the EIS of the battery).
- FIG. 3A includes graphs illustrating the results of an example frequency analysis, i.e., respective voltage and current amplitudes as a function of frequency and graphs illustrating the resulting impedance spectrum, i.e., the complex impedance as a function of frequency, calculated using the results of the frequency analysis.
- FIG. 3B is a graph illustrating an example impedance spectrum in a real part versus imaginary part plot.
- FIG. 4 illustrates an apparatus including a controller configured to adjust the switching frequency of a power converter in order to vary the switching ripple frequency.
- FIG. 5A is a diagram illustrating waveforms in a bidirectional DC-DC boost/buck power converter during a single-frequency online impedance measurement.
- FIG. 5B is a diagram illustrating waveforms in a bidirectional DC-DC boost/buck power converter during a multi-frequency online impedance measurement using a step-function or step control signal perturbation.
- FIG. 6A includes an example set of waveforms illustrating possible AC coupled waveforms of a power converter output voltage (V 0 ), battery voltage (V bat ), and battery current (I bat ).
- FIG. 6B includes an example set of waveforms illustrating that the switching ripple still exists when a step-function perturbation is active.
- FIG. 7 is a diagram illustrating that the switching ripple still exists when a sinusoidal perturbation is active.
- FIG. 8A illustrates a plurality of DC-DC power converters (e.g., DC-DC 1, DC-DC 2, . . . DC-DC h) with power converter outputs connected in series and a multi-battery input (e.g., Battery 1, Battery 2, . . . Battery h).
- FIG. 8B is a block diagram illustrating an example controller for the system when two power converters are used for cancellation.
- FIG. 8C is a graph illustrating example power converter waveforms when two power converters are used for cancellation.
- FIG. 9A is a diagram illustrating a plurality of power sources (e.g., batteries) connected in series at the input of a power converter.
- FIG. 9B is a diagram illustrating a plurality of power sources (e.g., batteries) connected in parallel at the input of a power converter.
- FIG. 10 is a block diagram illustrating a power converter where the techniques described herein are used to measure impedance spectrum, power density, power spectral density, and/or energy spectral density of electrical components other than batteries.
- FIG. 11 is a block diagram of an example computing device.
- FIG. 12 is a diagram illustrating example perturbation waveforms according to implementations described herein.
- Ranges may be expressed herein as from “about” one particular value, and/or to “about” another particular value. When such a range is expressed, an aspect includes from the one particular value and/or to the other particular value. Similarly, when values are expressed as approximations, by use of the antecedent “about,” it will be understood that the particular value forms another aspect. It will be further understood that the endpoints of each of the ranges are significant both in relation to the other endpoint, and independently of the other endpoint.
- the apparatus can optionally be used for measuring the impedance spectrum of other electrical components including, but not limited to, a battery, a solar cell or panel, a fuel cell, a supercapacitor, a motor, a generator, an antenna, a wireless power coil, a piezoelectric energy harvester, an inductor, capacitor, transistor, diode, transformer, or other electrical component.
- the apparatus can optionally be used for measuring the complex power spectrum, the power spectral density, or the energy spectral density of an electrical component.
- the apparatus includes a current sensor 102 configured for measuring current flowing through an electrical component 104 .
- the current sensor 102 can be any type of current sensor known in the art such as an ammeter, current probe, sense resistor based current sensor, Hall effect based current sensor, transformer based current sensor, or inductive based current sensor.
- the current sensor 102 is configured for measuring direct current (DC) and/or alternating current (AC) currents. Current sensors are known in the art and are therefore not described in further detail herein.
- the electrical component 104 is a battery. It should be understood that a battery is provided only as an example and that the electrical component can be something other than a battery.
- the apparatus also includes a voltage sensor 106 for measuring voltage across the electrical component 104 .
- the voltage sensor 106 can be any type of voltage sensor known in the art such as a voltmeter, voltage probe, transformer based voltage sensor, or resistive network based voltage sensor.
- the voltage sensor 106 is configured for measuring DC and/or AC voltages. Voltage sensors are known in the art and are therefore not described in further detail herein.
- the apparatus can be used to measure the IS of the electrical component 104 (i.e., EIS of a battery in FIG. 1 ).
- the current sensor 102 and the voltage sensor 106 are used to measure an AC ripple or AC switching ripple, which includes both an AC current ripple and an AC voltage ripple, associated with a power converter 108 .
- the power converter 108 maintains/regulates the DC value of the output voltage (V o-reg ), the load current (I o-reg ), load power, or any variable that needs regulation.
- the power converter 108 is a bidirectional DC-DC boost/buck power converter.
- the naturally existing switching ripple (e.g., the AC ripple) of the power converter 108 is measured at the electrical component 104 (e.g., by measuring i Bat , V Bat in FIG. 1 ).
- the measured current and voltage e.g., i Bat , V Bat in FIG. 1
- FIG. 1 An example of the AC current ripple 120 imposed on the DC value 125 of current passing through the electrical component 104 is shown in FIG. 1 .
- This AC current ripple 120 has an ideal triangular waveform shape and is provided as an example only.
- AC ripple can have a triangular or non-triangular waveform shapes (e.g., a shape that is semi square wave, semi sinusoidal, or semi saw tooth).
- example AC current ripple 210 imposed on the DC value 215 of current passing through a battery and example AC voltage ripple 220 imposed on the DC value 225 of voltage across the battery are shown in FIG. 2 .
- a switching ripple i.e., AC ripple
- the frequency of the switching ripple may be equal to the switching frequency (f s ), for example, as is the case of the power converter 108 shown in FIG. 1 .
- This disclosure contemplates, however, that the frequency of the switching ripple can be equal to a fraction (e.g., 1 ⁇ 2) or multiple (e.g., double) of the switching frequency of the power converter 108 , for example.
- the AC ripple is a non-sinusoidal waveform (e.g., AC current ripple 120 of FIG.
- AC current ripple 210 of FIG. 2 contains a fundamental frequency component, as well as frequency components that are at greater than the fundamental frequency (e.g., harmonic frequencies).
- the frequency of the AC ripple (which is equal to the switching frequency of the power converter 108 in FIG. 1 ) is 10 kHz
- it is possible to obtain frequency components of the AC ripple at a plurality of frequencies e.g., frequencies 10 kHz, 30 kHz, 50 kHz, 70 kHz, 90 kHz, 110 kHz, 130 kHz, . . . etc.
- 10 kHz is provided only as an example of the frequency of the AC ripple, which can be a frequency more or less than 10 kHz.
- the apparatus also includes a controller 110 (e.g., a microcontroller) operably coupled to the current sensor 102 and the voltage sensor 106 .
- the controller 110 can be operably coupled to the current sensor 102 and the voltage sensor 106 through one or more communication links.
- This disclosure contemplates the communication links are any suitable communication link.
- a communication link may be implemented by any medium that facilitates data exchange between the controller 110 and the current sensor 102 /voltage sensor 106 including, but not limited to, wired, wireless and optical links.
- the controller 110 includes a processing unit and a memory operably coupled to the processing unit (e.g., computing device 1100 of FIG. 11 ) and is configured to measure impedance spectrum, power spectrum, or spectral density of the electrical component 104 as described herein.
- the current sensor 102 and the voltage sensor 106 are used to measure an AC ripple, which includes both an AC current ripple and an AC voltage ripple.
- the measured AC current ripple and AC voltage ripple is then sampled by an analog-to-digital converter (ADC).
- ADCs are well known in the art and therefore not described in further detail herein.
- the AC current ripple and AC voltage ripple can be received at the controller 110 , which can be configured to perform the sampling.
- the respective frequency components of the AC current ripple and the AC voltage ripple are then obtained by performing a frequency analysis.
- the frequency analysis can include using a Discrete Fourier Transform (DFT) or the Fast Fourier Transform (FFT), for example.
- DFT Discrete Fourier Transform
- FFT Fast Fourier Transform
- DFT and FFT are provided only as examples of a frequency analysis, and this disclosure contemplates that other frequency analyses can be used to obtain the respective frequency components of the AC current ripple and the AC voltage ripple.
- An impedance spectrum (or a power spectrum, a spectral density, etc.) of the electrical component 104 can then be calculated based on the respective frequency components of the AC current ripple and the AC voltage ripple.
- the controller 110 can be configured to perform the frequency analysis and calculate the impedance spectrum, power spectrum, spectral density, etc. of the electrical component 104 .
- FIG. 2 example operations for measuring the impedance spectrum of a battery (i.e., the EIS of the battery) are shown.
- a digital controller e.g., controller 110 of FIG. 1
- the voltage and current of a battery e.g., V Bat and i Bat in FIG. 2
- the voltage and current of the battery represent the AC voltage ripple 220 and the AC current ripple 210 of a power converter (e.g., power converter 108 of FIG. 1 ).
- DFT the respective frequency component amplitudes of the voltage (V ac (f 1 ), V ac (f 2 ), . . .
- V ac (f M )) and the current (I ac (f 1 ), I ac (f 2 ), . . . , I ac (f M )) and the corresponding phase shift ( ⁇ z (f 1 ), ⁇ z (f 2 ), . . . , ⁇ z (f M )) can be obtained as given by Equation (1).
- Example extracted voltage/current amplitudes and phases as a function of frequency are shown in FIG. 2 .
- N is the number of samples in the measured and sampled signal (e.g., the measured voltage or current of the battery)
- n is the current sample under consideration (0, 1, . . . , N ⁇ 1)
- x n is the value of the signal at time n
- k is the frequency under consideration (0 Hz to N ⁇ 1 Hz)
- X k is the value of the signal at frequency k which is a complex number that includes the amplitude and phase information of the signal at at frequency k.
- Equation (2) can then be used to calculate the impedance spectrum (i.e., the EIS for the battery) for a range of frequencies at 270 .
- the impedance spectrum includes values at a plurality of frequencies.
- the frequency analysis yields extracted voltage/current amplitudes and phases for a plurality of frequency components as shown in FIG. 2 , and thus, the impedance spectrum will also include values (i.e., complex impedance magnitudes and phases) at a plurality of frequencies as shown in FIG. 2 .
- the impedance spectrum can include values at a fundamental frequency and harmonic frequencies related to the switching frequency of the power converter.
- the plurality of frequencies can include frequencies equal to or greater than a switching ripple frequency of the power converter.
- the impedance spectrum can be calculated using measurements of the AC ripple obtained over a single switching ripple cycle of the power converter. This is in contrast to the single frequency impedance measurement described below with regard to FIG. 5A , which requires a plurality of switching ripple cycles to obtain the measurement at a single frequency (e.g., requires for each frequency at least one sinusoidal perturbation cycle which includes multiple switching cycles, e.g. 100 switching cycles, in order to obtain a single impedance value at a single frequency).
- the impedance spectrum can optionally be calculated using measurements of the AC ripple obtained over a plurality of switching ripple cycles of the power converter.
- the impedance spectrum can be calculated while the power converter is online delivering power to a load. It should also be understood that the impedance spectrum can be obtained without modifying control of the power converter, i.e., the power converter output current and voltage is maintained without inducing any ripple.
- X is the real part of the impedance and Y is the imaginary part of the impedance.
- f p is the fundamental frequency of the switching ripple of the voltage and current.
- FIG. 3A includes graphs illustrating the results of an example frequency analysis, i.e., respective voltage and current amplitudes as a function of frequency.
- FIG. 3A also includes graphs illustrating the resulting impedance spectrum, i.e., the complex impedance as a function of frequency, calculated using the results of the frequency analysis. It should be understood that the graphs in FIG. 3A are not to scale and are provided for illustration only.
- FIG. 3B is a graph illustrating an example impedance spectrum in a real part versus imaginary part plot.
- Equations (3)-(6) can be used to calculate the power spectrum, the energy spectral density, and/or the power spectral density for a range of frequencies.
- complex power at each respective frequency can be obtained by multiplying the voltage component by the current component at each respective frequency, for example, as shown by Equation (3).
- a Complex Power Spectroscopy (CPD) can be obtained by performing a frequency analysis such as DFT as shown in Equation (4).
- ESD Energy Spectral Density
- PSD Power Spectral Density
- Each of the CPD, ESD, and PSD includes values at a plurality of frequencies.
- the frequency analysis yields extracted voltage/current amplitudes and phases for a plurality of frequency components as shown in FIG. 2 , and thus, each of the CPD, ESD, and PSD will also include values at a plurality of frequencies.
- each of the CPD, ESD, and PSD can include values at a fundamental frequency and harmonic frequencies related to the switching frequency of the power converter.
- Equations (3)-(6) yield the CPD, ESD, and PSD at frequencies equal to or greater than a switching ripple frequency of the power converter.
- Each of the CPD, ESD, and PSD can be calculated using measurements of the AC ripple obtained over a single switching ripple cycle of the power converter, which is in contrast to the single frequency impedance measurement technique described with regard to FIG. 5A .
- each of the CPD, ESD, and PSD can optionally be calculated using measurements of the AC ripple obtained over a plurality of switching ripple cycles of the power converter.
- each of the CPD, ESD, and PSD can be calculated while the power converter is online delivering power to a load.
- N is the number of samples in the measured and sampled signal (e.g., the measured voltage or current of the battery)
- n is the current sample under consideration (0, 1, . . . , N ⁇ 1)
- p n is the value of the signal at time n
- k is the frequency under consideration (0 Hz to N ⁇ 1 Hz)
- P k is the value of the signal at frequency k which is a complex number that includes the amplitude and phase information of the signal at frequency k.
- ⁇ t is the sampling interval
- T N.
- ⁇ t based on a finite window 1 ⁇ n ⁇ N.
- the power converter 108 can optionally be operably coupled to a power converter controller 112 , for example, using one or more communication links.
- the power converter controller 112 is configured to control operations of the power converter 108 , e.g., maintains/regulates the DC value of the output voltage (V o-reg ), the load current (I o-reg ), load power, etc.
- the controller 110 can optionally be operably coupled to the power converter controller 112 , for example, using one or more communication links.
- a communication link may be implemented by any medium that facilitates data exchange including, but not limited to, wired, wireless and optical links.
- the impedance spectrum (IS), CPD, ESD, and/or PSD described above include values (i.e., complex magnitudes and phases) at a plurality of frequencies equal to or greater than a switching ripple frequency of the power converter.
- values i.e., complex magnitudes and phases
- FIG. 4 an apparatus including a controller configured to adjust the switching frequency of a power converter in order to vary the switching ripple frequency is shown.
- a controller configured to adjust the switching frequency of a power converter in order to vary the switching ripple frequency
- a current sensor 102 an electrical component 104 , a voltage sensor 106 , a power converter 108 , a controller 110 , and a power converter controller 112 are shown. These elements are described in detail above with regard to FIG. 1 and are therefore not described in further detail below.
- the switching frequency of the power converter is set to 20 kHz (e.g., a first switching frequency)
- the impedance spectrum, CPD, ESD, and/or PSD may be obtained for frequencies 20 kHz, 60 kHz, 100 kHz, 140 kHz, 180 kHz, . . . etc. (e.g., a plurality of frequencies including the fundamental frequency and harmonic frequencies related to the first switching frequency).
- the switching frequency of the power converter when the switching frequency of the power converter is set to 30 kHz (e.g., a second switching frequency), for example, the impedance spectrum, CPD, ESD, and/or PSD may be obtained for frequencies 30 kHz, 90 kHz, 150 kHz, 210 kHz, 270 kHz, . . . etc. (e.g., a plurality of frequencies including the fundamental frequency and harmonic frequencies related to the second switching frequency).
- the impedance spectrum, CPD, ESD, and/or PSD can be obtained, for example, using Equations (1)-(6) described above.
- the switching frequency of the power converter it is possible to obtain measurements having a wider frequency range.
- the first and second switching frequencies of 20 kHz and 30 kHz, respectively are provided only as examples and that the first and second switching frequencies can have other values. Additionally, this disclosure contemplates using more than two different switching frequencies.
- FIG. 5A a diagram illustrating waveforms in a bidirectional DC-DC boost/buck power converter during a single-frequency online impedance measurement is shown.
- This impedance measurement technique is described in detail in U.S. Pat. No. 9,368,991, issued Jun. 14, 2016 to Jaber Abu Qahouq and entitled “Distributed battery power electronics architecture and control,” the disclosure of which is incorporated herein by reference in its entirety.
- D AC sinusoidal duty cycle perturbation signal
- the perturbation frequency is significantly lower (e.g., 10 or more times lower) than the switching frequency of the power converter.
- This small duty cycle perturbation results in generating relatively small sinusoidal ripples superimposed over the power converter DC output voltage.
- the duty cycle perturbation is performed for a single frequency at a time, i.e., it is not possible to obtain measurements for a plurality of frequencies in a single switching ripple cycle or a single sinusoidal perturbation cycle using this technique. Additionally, by adjusting the duty cycle of the power converter, control of the power converter is modified.
- FIG. 5B a diagram illustrating waveforms in a bidirectional DC-DC boost/buck power converter during a multi-frequency online impedance measurement is shown.
- This impedance measurement technique uses a closed-loop step-function perturbation of the output voltage or current of the power converter while maintaining the regulation of the DC value of the output voltage (V o ) of the power converter.
- the closed-loop step-function e.g., a step control signal
- the step control signal can be a step pulse (e.g., a square or rectangular pulse).
- the step control signal when the step control signal is a step pulse (square waveform shape), it will cause a response containing more frequency components.
- the step control signal can have other waveform shapes including, but not limited to, saw-tooth waveform shape.
- the perturbation waveforms e.g., step-function, step control signal
- the perturbation waveforms can be of various types.
- the perturbation waveforms can be square waveforms or have other waveform shapes. Examples of other perturbation waveforms (other than square waveforms) are shown in FIG. 12 .
- One of these perturbation waveforms is the pulse waveform with variable width ( ⁇ t/T). When the width is not equal to 0.5 (e.g., as shown in FIGS.
- both odd and even harmonics can be obtained, which yield to a spectrum with higher frequency resolution (i.e., harmonics at larger number of frequency point within the same spectrum range).
- ⁇ t can be varied adaptively (e.g., to vary the pulse width) in order to control at which frequencies the harmonics are stronger (i.e., have larger magnitude). This facilitates obtaining accurate measurement at certain harmonics when such harmonics are larger in magnitude.
- an adaptive controller can adaptively switch between different types of perturbation waveforms with different magnitudes, widths, and/or frequencies in order to improve both accuracy and resolution, among others.
- An adaptive controller can also generate a perturbation waveform that is a result of adding, subtracting, multiplying, and/or dividing two or more waveforms and/or performing any other mathematical operation on one or more waveforms.
- the step-function can be obtained by applying a step-function to the closed-loop controller's reference voltage that regulates the voltage, or by applying a step function to the closed-loop controller's reference current that regulates the current, or by applying a step-function to the duty-cycle directly, among others.
- the closed-loop reference signal of the output voltage (V o-ref ) is stepped up and stepped down by a small change (V o-ref-AC-step ) around the DC value (V o-ref-Dc ) in order to generate a corresponding response by the battery voltage and the battery current, as given by Equation (7) and illustrated in FIG. 5B where f p is the perturbation frequency of the step function.
- V o - ref ⁇ ( t ) ⁇ V o - ref - D ⁇ ⁇ C + 0.5 ⁇ V o - ref - A ⁇ ⁇ C - step , 0 ⁇ t ⁇ 0.5 / f p V o - ref - D ⁇ ⁇ C - 0.5 ⁇ V o - ref - A ⁇ ⁇ C - step , 0.5 / f p ⁇ t ⁇ 1 / f p V o - ref - D ⁇ ⁇ C , Otherwise ( 7 )
- FIG. 6A includes an example set of waveforms illustrating possible AC coupled waveforms of a power converter output voltage (V 0 ), battery voltage (V bot ), and battery current (I bat ).
- FIG. 6B includes an example set of waveforms illustrating that the switching ripple still exists when a step-function perturbation is active. It should be understood that the desired output voltage and step-function described above are only provided as examples and can have other values.
- the AC coupled waveforms are also provided only as examples and may take other forms.
- the step-function described in FIG. 5B is done for controlled output voltage
- this disclosure contemplates that the step-function can also be done for controlled current.
- the controlled voltage or current in which the step-function is applied to can be any voltage or current in the circuit or power converter and is not intended to be limited to the power converter output voltage or output current.
- the voltage and current associated with an electrical component can be measured, for example, using voltage and current sensors (e.g., current sensor 102 and voltage sensor 106 of FIG. 1 ).
- the measured voltage and current can be sampled using an ADC.
- Equations (1)-(6) a frequency analysis to obtain respective frequency components of the response voltage and current can be performed, and the impedance spectrum, the power spectrum, or the power spectral density can be calculated based on the respective frequency components of the response voltage and current.
- a closed-loop step-function perturbation cycle at a given frequency f p provides the values for the impedance spectrum, the power spectrum, or the power spectral density within a specific range of interest.
- the step-function fundamental/perturbation frequency f p-step is lower than the switching frequency of the converter (e.g., >10 times lower) and therefore the range of results will include f p-step and its higher harmonics which will cover the low frequency range (e.g., mostly lower than the switching ripple frequency (f p-ripple )).
- the desired frequency range is wider, then more closed-loop step-function perturbation cycles can be used.
- the impedance spectrum, the power spectrum, or the spectral density is provided for 10 Hz, 30 Hz, 50 Hz, 70 Hz, 90 Hz, 100 Hz, 110 Hz, 130 Hz, 150 Hz, 170 Hz, 190 Hz, 300 Hz, 400 Hz, 500 Hz, 700 Hz, 900 Hz, 1 kHz, 1.1 kHz, 1.2 kHz, 2.8 kHz, 3 kHz, 3.6 kHz, 4.4 kHz, 5 kHz, 5.2 kHz, 6 kHz, 6.8 kHz, 7 kHz, 7.6 kHz, 9 kHz, and 11 kHz.
- f p1 , f p2 , f p3 , and f p4 are provided only as examples and that the number of closed-loop step-function perturbation cycles and/or values can be selected based on the desired frequency range and resolution.
- a small sinusoidal duty cycle perturbation signal (D AC ) can be added to D DC , for example, as shown in FIG. 5A .
- the perturbation frequency is lower than the switching frequency of the power converter.
- the duty cycle fundamental/perturbation frequency f p-duty cycle is lower than the switching frequency of the converter (e.g., >10 times lower) and therefore the range of results will include f p-duty cycle and its higher harmonics which will cover the low frequency range (e.g., mostly lower than the switching ripple frequency (f p-ripple )).
- This can be achieved by applying a duty cycle perturbation to the power converter (e.g., controlling the ON/OFF timing of switch(es) of the power converter).
- the small duty cycle perturbation results in generating relatively small sinusoidal ripples superimposed over the power converter DC output voltage, i.e., this causes a change in the AC ripple.
- the AC ripple can be measured, for example, using voltage and current sensors (e.g., current sensor 102 and voltage sensor 106 of FIG. 1 ). The measured voltage and current can be sampled using an ADC. Then, using Equations (1)-(6), a frequency analysis to obtain respective frequency components of the AC ripple can be performed, and the impedance spectrum, the power spectrum, or the spectral density can be calculated based on the respective frequency components of the AC ripple.
- FIG. 7 a diagram illustrating that switching ripple still exists when a sinusoidal perturbation is active.
- the AC ripple has two components—a low frequency perturbation ripple, which results from the duty cycle perturbation, and a high frequency switching ripple.
- the high frequency switching ripple is superimposed on the low frequency perturbation ripple.
- performing a frequency analysis e.g., DFT, FFT
- a frequency analysis e.g., DFT, FFT
- these frequencies are related to the fundamental and harmonic frequencies of the switching frequency of the power converter and are therefore typically equal to or greater than the switching ripple frequency.
- a closed-loop step-function perturbation or a duty cycle perturbation can be used to obtain the impedance spectrum, power spectrum, or spectral density including values at a plurality of frequencies less than the switching ripple frequency. As shown in FIG. 6B , switching ripple still exists when step-function perturbations are active.
- the AC ripple has two components—a low frequency perturbation ripple, which results from the step-function perturbation, and a high frequency switching ripple. Additionally, as shown in FIG. 7 , switching ripple is superimposed on the low frequency induced ripple resulting from the duty cycle perturbations.
- the AC ripple has two components—a low frequency perturbation ripple, which results from the duty cycle perturbation, and a high frequency switching ripple. Therefore, it is possible to obtain the impedance spectrum, power spectrum, or spectral density including values at frequencies both greater and less than the switching ripple frequency using techniques described herein in combination.
- a larger closed-loop step-function perturbation step size (e.g., larger V o-ref-AC-step in Equation (7)) may be desired for higher accuracy and/or lower hardware requirements such as ADC resolution and speed requirements.
- a closed-loop step-function perturbation step size V o-ref-AC-step in the range of 100 mV-200 mV or less may be sufficient, a 500 mV or larger step size can lead to more accurate results for a wider range at lower frequencies.
- the larger step size has the disadvantage of larger induced voltage ripple at the output of the power converter or the power supply bus.
- a ripple cancellation technique can be used, which applies to a battery system with two or more battery cells.
- FIG. 8A a plurality of DC-DC power converters (e.g., DC-DC 1, DC-DC 2, . . . DC-DC h) with power converter outputs connected in series and a multi-battery input (e.g., Battery 1, Battery 2, . . . Battery h) is shown.
- FIG. 8B is a block diagram illustrating an example controller for the system when two power converters are used for cancellation.
- FIG. 8C is a graph illustrating example power converter waveforms when two power converters are used for cancellation. As shown in FIG.
- each power converter input has a power source (e.g., a battery) at its input
- V o-ref-1 (t) of power converter 1 and V o-ref-2 (t) of power converter 2 with respect to each other by 180° as shown in FIG. 8B
- the total output voltage will become perturbation ripple free as a result of cancellation while performing impedance spectrum, power spectrum, and/or spectral density measurements for each of the batteries individually.
- An example ripple free total output voltage in such a case is shown in FIG. 8C .
- each two V o-ref (t) for two of the power converters can be shifted by 180°.
- the system has an odd number of power converters (e.g., 3, 5, 7, . . . , etc. power converters)
- impedance spectrum, power spectrum, and/or spectral density measurements can be done for h ⁇ 1 power converters at a time, where h is the total of power converters.
- phase shifts more or less than 180 can be used depending on the number of power converters used for cancelling the effects of the induced step-function or duty cycle perturbation ripple.
- the step-function or duty cycle magnitude/step size can also be made different for even or odd number of power converters to realize cancellation.
- FIG. 9A is a diagram illustrating a plurality of power sources (e.g., batteries) connected in series at the input of a power converter.
- FIG. 9B is a diagram illustrating a plurality of power sources (e.g., batteries) connected in parallel at the input of a power converter. This disclosure contemplates that each of the power converter outputs can be connected in series as shown in FIG. 8A to achieve induced step-function perturbation or duty cycle ripple cancellation.
- a plurality of electrical components can be connected in series and/or in parallel at the input of a power converter.
- the respective voltages and currents associated with each of the electrical components can be individually measured, and a respective impedance spectrum, power spectrum, or spectral density of each of the electrical components can be calculated.
- FIG. 9A illustrates a plurality of batteries connected in series at the input of a power converter.
- the current (i.e., i bat ) flowing through each of the batteries is the same and can be measured with a current sensor, and the voltages (i.e., V bat1 , V bat2 , . . .
- FIG. 9B illustrates a plurality of batteries connected in parallel at the input of a power converter.
- the currents (i.e., i bat1 , i bat2 , . . . i bath ) flowing through each of the batteries can be separately measured with a current sensor, and the voltage (i.e., V bat ) across each of the batteries is the same and can be measured with a voltage sensor.
- a frequency analysis can be performed on the respective current and voltage measured for each of the batteries using Equation (1).
- the respective impedance spectrum, power spectrum, and/or spectral density of each of the batteries can then be calculated, for example, using Equations (2)-(6).
- closed-loop step-function perturbations and/or duty cycle perturbations can be used as described above for each of the batteries individually.
- a closed-loop step-function perturbation of the power converter output voltage in an h-cell system results in h battery voltage responses and one battery current response (i.e., the current is the same for all cells that are connected in series). Therefore, in this scenario, there is a need to measure h+1 variables for an h cell battery system in order to obtain the individual impedance spectrum, power spectrum, and/or spectral density for each battery cell in the system.
- a closed-loop step-function perturbation of the power converter output current in an h-cell system results in h battery current responses and one or h battery voltage response(s).
- the impedance spectrum, the power or energy spectrum, or the spectral density can optionally be used to obtain a state of health (SOH) or state of charge (SOC) of the electrical component. It can also be used to obtain information that are of interest for many monitoring and control functions such as the minimum impedance point and its corresponding frequency, the frequency and the corresponding impedance value when the impedance angle/phase is zero, several points that indicate the model parameters of the battery, the slope of impedance change, the frequency when the power or energy spectrum or spectral density are mostly concentrated/maximum or are mostly weak/minimum, and the location of the closed-loop compensator poles and zeros that will result in the making the power or energy spectrum or spectral density concentrated/maximized at a frequency of interest such as the switching frequency of the power converter, among others.
- SOH state of health
- SOC state of charge
- the power converter can be controlled based on the impedance spectrum, the power spectrum, or the power spectral density.
- controlling the power converter can include at least one of adjusting a frequency, duty cycle, output voltage, or output current; performing fault detection; maximizing efficiency or power transfer; or performing maximum power point tracking.
- performing fault detection further can include detecting a fault in the electrical component based on a rate of change of the impedance spectrum, the power spectrum, or the power spectral density.
- the method can further include isolating the electrical component or providing an alarm.
- the electrical component is a battery, which is used only as an example for the purposes of illustrating various techniques used to measure impedance spectrum, power density, power spectral density, and/or energy spectral density using frequency component analysis of power converter voltage and current ripple.
- the electrical component can be other electrical components including, but not limited to, a solar cell or panel, a fuel cell, a supercapacitor, a motor, a generator, an antenna, a wireless power coil, a piezoelectric energy harvester, an inductor, capacitor, transistor, diode, or transformer.
- FIG. 10 a block diagram illustrating a power converter circuit where the techniques described herein are used to measure impedance spectrum, power density, power spectral density, and/or energy spectral density of electrical components other than batteries. A number of example measurements are provided below:
- Impedance spectrum, power density, power spectral density, and/or energy spectral density for a transistor that is placed anywhere in the power converter e.g., input, output, middle, . . . etc.
- Impedance spectrum, power density, power spectral density, and/or energy spectral density for a load such as an light emitting diode (LED), motor, . . . etc.
- a load such as an light emitting diode (LED), motor, . . . etc.
- Impedance spectrum, power density, power spectral density, and/or energy spectral density for one or more solar cells are configured to provide Impedance spectrum, power density, power spectral density, and/or energy spectral density for one or more solar cells.
- Impedance spectrum, power density, power spectral density, and/or energy spectral density for one or more fuel cells are provided.
- the logical operations described herein with respect to the various figures may be implemented (1) as a sequence of computer implemented acts or program modules (i.e., software) running on a computing device (e.g., the computing device described in FIG. 11 ), (2) as interconnected machine logic circuits or circuit modules (i.e., hardware) within the computing device and/or (3) a combination of software and hardware of the computing device.
- a computing device e.g., the computing device described in FIG. 11
- the logical operations discussed herein are not limited to any specific combination of hardware and software.
- the implementation is a matter of choice dependent on the performance and other requirements of the computing device. Accordingly, the logical operations described herein are referred to variously as operations, structural devices, acts, or modules.
- an example computing device 1100 upon which embodiments of the invention may be implemented is illustrated. It should be understood that the example computing device 1100 is only one example of a suitable computing environment upon which embodiments of the invention may be implemented.
- the computing device 1100 can be a well-known computing system including, but not limited to, personal computers, servers, handheld or laptop devices, multiprocessor systems, microprocessor-based systems, network personal computers (PCs), minicomputers, mainframe computers, embedded systems, and/or distributed computing environments including a plurality of any of the above systems or devices.
- Distributed computing environments enable remote computing devices, which are connected to a communication network or other data transmission medium, to perform various tasks.
- the program modules, applications, and other data may be stored on local and/or remote computer storage media.
- computing device 1100 In its most basic configuration, computing device 1100 typically includes at least one processing unit 1106 and system memory 1104 . Depending on the exact configuration and type of computing device, system memory 1104 may be volatile (such as random access memory (RAM)), non-volatile (such as read-only memory (ROM), flash memory, etc.), or some combination of the two. This most basic configuration is illustrated in FIG. 11 by dashed line 1102 .
- the processing unit 1106 may be a standard programmable processor that performs arithmetic and logic operations necessary for operation of the computing device 1100 .
- the computing device 1100 may also include a bus or other communication mechanism for communicating information among various components of the computing device 1100 .
- Computing device 1100 may have additional features/functionality.
- computing device 1100 may include additional storage such as removable storage 1108 and non-removable storage 1110 including, but not limited to, magnetic or optical disks or tapes.
- Computing device 1100 may also contain network connection(s) 1116 that allow the device to communicate with other devices.
- Computing device 1100 may also have input device(s) 1114 such as a keyboard, mouse, touch screen, etc.
- Output device(s) 1112 such as a display, speakers, printer, etc. may also be included.
- the additional devices may be connected to the bus in order to facilitate communication of data among the components of the computing device 1100 . All these devices are well known in the art and need not be discussed at length here.
- the processing unit 1106 may be configured to execute program code encoded in tangible, computer-readable media.
- Tangible, computer-readable media refers to any media that is capable of providing data that causes the computing device 1100 (i.e., a machine) to operate in a particular fashion.
- Various computer-readable media may be utilized to provide instructions to the processing unit 1106 for execution.
- Example tangible, computer-readable media may include, but is not limited to, volatile media, non-volatile media, removable media and non-removable media implemented in any method or technology for storage of information such as computer readable instructions, data structures, program modules or other data.
- System memory 1104 , removable storage 1108 , and non-removable storage 1110 are all examples of tangible, computer storage media.
- Example tangible, computer-readable recording media include, but are not limited to, an integrated circuit (e.g., field-programmable gate array or application-specific IC), a hard disk, an optical disk, a magneto-optical disk, a floppy disk, a magnetic tape, a holographic storage medium, a solid-state device, RAM, ROM, electrically erasable program read-only memory (EEPROM), flash memory or other memory technology, CD-ROM, digital versatile disks (DVD) or other optical storage, magnetic cassettes, magnetic tape, magnetic disk storage or other magnetic storage devices.
- an integrated circuit e.g., field-programmable gate array or application-specific IC
- a hard disk e.g., an optical disk, a magneto-optical disk, a floppy disk, a magnetic tape, a holographic storage medium, a solid-state device, RAM, ROM, electrically erasable program read-only memory (EEPROM), flash memory or other memory technology, CD-ROM, digital versatile disks (
- the processing unit 1106 may execute program code stored in the system memory 1104 .
- the bus may carry data to the system memory 1104 , from which the processing unit 1106 receives and executes instructions.
- the data received by the system memory 1104 may optionally be stored on the removable storage 1108 or the non-removable storage 1110 before or after execution by the processing unit 1106 .
- the various techniques described herein may be implemented in connection with hardware or software or, where appropriate, with a combination thereof.
- the methods and apparatuses of the presently disclosed subject matter, or certain aspects or portions thereof may take the form of program code (i.e., instructions) embodied in tangible media, such as floppy diskettes, CD-ROMs, hard drives, or any other machine-readable storage medium wherein, when the program code is loaded into and executed by a machine, such as a computing device, the machine becomes an apparatus for practicing the presently disclosed subject matter.
- the computing device In the case of program code execution on programmable computers, the computing device generally includes a processor, a storage medium readable by the processor (including volatile and non-volatile memory and/or storage elements), at least one input device, and at least one output device.
- One or more programs may implement or utilize the processes described in connection with the presently disclosed subject matter, e.g., through the use of an application programming interface (API), reusable controls, or the like.
- API application programming interface
- Such programs may be implemented in a high level procedural or object-oriented programming language to communicate with a computer system.
- the program(s) can be implemented in assembly or machine language, if desired. In any case, the language may be a compiled or interpreted language and it may be combined with hardware implementations.
Landscapes
- Physics & Mathematics (AREA)
- General Physics & Mathematics (AREA)
- Measurement Of Resistance Or Impedance (AREA)
Abstract
Description
Claims (18)
Priority Applications (1)
| Application Number | Priority Date | Filing Date | Title |
|---|---|---|---|
| US15/687,885 US10775440B2 (en) | 2016-08-28 | 2017-08-28 | Methods, apparatuses, and systems for measuring impedance spectrum, power spectrum, or spectral density using frequency component analysis of power converter voltage and current ripples |
Applications Claiming Priority (2)
| Application Number | Priority Date | Filing Date | Title |
|---|---|---|---|
| US201662380457P | 2016-08-28 | 2016-08-28 | |
| US15/687,885 US10775440B2 (en) | 2016-08-28 | 2017-08-28 | Methods, apparatuses, and systems for measuring impedance spectrum, power spectrum, or spectral density using frequency component analysis of power converter voltage and current ripples |
Publications (2)
| Publication Number | Publication Date |
|---|---|
| US20180059191A1 US20180059191A1 (en) | 2018-03-01 |
| US10775440B2 true US10775440B2 (en) | 2020-09-15 |
Family
ID=61242152
Family Applications (1)
| Application Number | Title | Priority Date | Filing Date |
|---|---|---|---|
| US15/687,885 Active 2037-12-04 US10775440B2 (en) | 2016-08-28 | 2017-08-28 | Methods, apparatuses, and systems for measuring impedance spectrum, power spectrum, or spectral density using frequency component analysis of power converter voltage and current ripples |
Country Status (1)
| Country | Link |
|---|---|
| US (1) | US10775440B2 (en) |
Families Citing this family (34)
| Publication number | Priority date | Publication date | Assignee | Title |
|---|---|---|---|---|
| US10992144B2 (en) * | 2017-05-17 | 2021-04-27 | Galley Power LLC | Battery balancing and current control with bypass circuit for load switch |
| US11018668B2 (en) * | 2017-11-14 | 2021-05-25 | Shuze Zhao | Characterization of power delivery network in field programmable gate arrays or digital integrated circuits |
| CN108693407B (en) * | 2018-05-08 | 2021-04-02 | 湖北工业大学 | Reference resistance pair optimal impedance spectrum measurement method with minimum error |
| CA3100397C (en) * | 2018-05-15 | 2021-07-13 | Btech Inc. | Battery monitor control system |
| CN108663631B (en) * | 2018-05-16 | 2020-12-25 | 哈尔滨工业大学 | Electrochemical impedance spectrum on-line measuring device for lithium ion battery pack |
| CN109342964A (en) * | 2018-12-07 | 2019-02-15 | 西南交通大学 | A method for analyzing the state of health of a proton exchange membrane fuel cell stack |
| JP2020180861A (en) * | 2019-04-25 | 2020-11-05 | トヨタ自動車株式会社 | Battery resistance measuring device |
| JP7226147B2 (en) * | 2019-07-04 | 2023-02-21 | 株式会社デンソー | battery monitor |
| RU195087U1 (en) * | 2019-08-15 | 2020-01-15 | Зиновская Евгения Ильинична | Individual device for determination of nitrates in products, water hardness and radiation background |
| CN111123135B (en) * | 2020-01-14 | 2022-06-10 | 苏州英威腾电力电子有限公司 | Online identification method and system for internal resistance of fuel cell |
| CN111190068A (en) * | 2020-02-24 | 2020-05-22 | 江苏大学 | A method for determining the optimal power of supercapacitors |
| KR20230011309A (en) * | 2020-04-17 | 2023-01-20 | 아이온트라 엘엘씨 | Systems and methods for battery charging |
| US12431728B2 (en) * | 2020-04-17 | 2025-09-30 | Iontra Inc | Systems and methods for electrochemical device charging and discharging |
| US11415636B2 (en) * | 2020-05-12 | 2022-08-16 | Analog Devices International Unlimited Company | Differential electrical impedance spectroscopy |
| EP4185881A4 (en) | 2020-07-24 | 2024-08-14 | Analog Devices International Unlimited Company | TRACKING THE CHARGE STATE OF A NON-RECHARGEABLE BATTERY USING IMPEDANCE SPECTROSCOPY |
| KR20230048348A (en) * | 2020-07-30 | 2023-04-11 | 아이온트라 엘엘씨 | Systems and methods for charging and discharging electrochemical devices |
| CN114280492B (en) * | 2020-09-27 | 2024-10-11 | 比亚迪股份有限公司 | Battery electrochemical impedance spectrum generation method, system, vehicle and medium |
| CN112230153B (en) * | 2020-10-13 | 2021-07-20 | 东华大学 | Method and device for measuring battery impedance |
| CN114578181B (en) * | 2020-12-01 | 2025-11-18 | 华为技术有限公司 | A method and apparatus for detecting islands |
| CN112924881B (en) * | 2021-01-27 | 2024-07-23 | 西安新艾电气技术有限公司 | An impedance spectrum online detection system and method for multiple battery strings |
| CN112924882A (en) * | 2021-01-27 | 2021-06-08 | 西安新艾电气技术有限公司 | Battery impedance spectrum online detection system and detection method based on DCDC |
| CN112924883A (en) * | 2021-01-27 | 2021-06-08 | 西安新艾电气技术有限公司 | DC/AC-based battery impedance spectrum online detection system and detection method |
| DE112021006988T5 (en) * | 2021-02-05 | 2023-11-30 | Mitsubishi Electric Corporation | Control device and energy storage system |
| CN113189513B (en) * | 2021-04-29 | 2022-10-21 | 电子科技大学 | Ripple-based redundant power supply current sharing state identification method |
| HUE066301T2 (en) | 2021-08-26 | 2024-07-28 | Contemporary Amperex Technology Co Ltd | Electrochemical impedance spectroscopy testing apparatus, and battery management system |
| CN113960353B (en) * | 2021-10-19 | 2024-05-31 | 科威尔技术股份有限公司 | High-precision low-ripple testing device of high-voltage power supply |
| CN116014190B (en) * | 2021-10-22 | 2025-05-27 | 中车时代电动汽车股份有限公司 | Method, device, equipment and medium for detecting internal resistance of hydrogen stack in hydrogen fuel cell vehicle |
| DE102021131645A1 (en) * | 2021-12-01 | 2023-06-01 | Audi Aktiengesellschaft | Method for evaluating an electrical connection of an electrical energy store with an on-board network, and electronic battery evaluation system and vehicle |
| CN115208308A (en) * | 2022-07-14 | 2022-10-18 | 云南电网有限责任公司电力科学研究院 | Photovoltaic system direct-current fault arc detection method and related equipment |
| DE102022209536B4 (en) | 2022-09-13 | 2024-04-25 | Volkswagen Aktiengesellschaft | Method and device for operating a pulse inverter |
| CN115932625A (en) * | 2023-01-09 | 2023-04-07 | 安徽中科海奥电气股份有限公司 | A Method of Online Tracking the Minimum Complex Impedance Amplitude of Lithium Batteries |
| CN117239884B (en) * | 2023-11-14 | 2024-02-02 | 西南交通大学 | Battery power interface converter control method with ultra-wideband EIS measurement function |
| EP4560335A1 (en) * | 2023-11-22 | 2025-05-28 | Volvo Truck Corporation | In-situ eis |
| US20250208224A1 (en) * | 2023-12-20 | 2025-06-26 | Analog Devices International Unlimited Company | Stimulus sourcing for hydrogen stack eis-based health assessment |
Citations (6)
| Publication number | Priority date | Publication date | Assignee | Title |
|---|---|---|---|---|
| WO1993022666A1 (en) * | 1992-05-07 | 1993-11-11 | Bell Communications Research, Inc. | Testing a battery connected to operating equipment |
| US20030066555A1 (en) * | 2000-12-04 | 2003-04-10 | Hui Ron Shu Yuen | Maximum power tracking technique for solar panels |
| US8035396B2 (en) * | 2005-12-08 | 2011-10-11 | Kim Deuk Soo | Method and device for measuring internal impedance of stationary battery |
| US20130229156A1 (en) * | 2010-08-27 | 2013-09-05 | Imperial Innovations Limited | Battery monitoring in electric vehicles, hybrid electric vehicles and other applications |
| US20140125284A1 (en) * | 2012-10-30 | 2014-05-08 | Board Of Trustees Of The University Of Alabama | Distributed battery power electronics architecture and control |
| US20140320094A1 (en) * | 2013-04-26 | 2014-10-30 | Richtek Technology Corporation | Control circuit for power converter and related control method |
-
2017
- 2017-08-28 US US15/687,885 patent/US10775440B2/en active Active
Patent Citations (7)
| Publication number | Priority date | Publication date | Assignee | Title |
|---|---|---|---|---|
| WO1993022666A1 (en) * | 1992-05-07 | 1993-11-11 | Bell Communications Research, Inc. | Testing a battery connected to operating equipment |
| US20030066555A1 (en) * | 2000-12-04 | 2003-04-10 | Hui Ron Shu Yuen | Maximum power tracking technique for solar panels |
| US8035396B2 (en) * | 2005-12-08 | 2011-10-11 | Kim Deuk Soo | Method and device for measuring internal impedance of stationary battery |
| US20130229156A1 (en) * | 2010-08-27 | 2013-09-05 | Imperial Innovations Limited | Battery monitoring in electric vehicles, hybrid electric vehicles and other applications |
| US20140125284A1 (en) * | 2012-10-30 | 2014-05-08 | Board Of Trustees Of The University Of Alabama | Distributed battery power electronics architecture and control |
| US9368991B2 (en) | 2012-10-30 | 2016-06-14 | The Board Of Trustees Of The University Of Alabama | Distributed battery power electronics architecture and control |
| US20140320094A1 (en) * | 2013-04-26 | 2014-10-30 | Richtek Technology Corporation | Control circuit for power converter and related control method |
Non-Patent Citations (1)
| Title |
|---|
| Huang, W. et al., "An Online Battery Impedance Measurement Method Using DC-DC Power Converter Control," IEEE Transactions on Industrial Electronics, vol. 61, No. 11, Nov. 2014. |
Also Published As
| Publication number | Publication date |
|---|---|
| US20180059191A1 (en) | 2018-03-01 |
Similar Documents
| Publication | Publication Date | Title |
|---|---|---|
| US10775440B2 (en) | Methods, apparatuses, and systems for measuring impedance spectrum, power spectrum, or spectral density using frequency component analysis of power converter voltage and current ripples | |
| US12320858B2 (en) | Apparatus and method for characterizing and managing stacked energy storage cells | |
| JP7333531B2 (en) | Electrical architecture for electrochemical impedance spectroscopy | |
| Qahouq et al. | Single-perturbation-cycle online battery impedance spectrum measurement method with closed-loop control of power converter | |
| US9977059B2 (en) | Electrochemical analysis apparatus and electrochemical system | |
| Sadeghi et al. | Controllable electrochemical impedance spectroscopy: From circuit design to control and data analysis | |
| US11509145B2 (en) | In-situ on-line and embedded battery impedance measurement device using active balancing circuits | |
| US20180156852A1 (en) | Method and apparatus for monitoring capacitance of dc bus capacitor | |
| US20160006061A1 (en) | Power converter for fuel cell and method for controlling the same | |
| Xia et al. | An online battery impedance spectrum measurement method with increased frequency resolution | |
| US7746084B2 (en) | Impedance measurement using line-to-line current injection | |
| Huang et al. | Online impedance measurement of operational batteries utilizing Sinc function signal injection via DC-DC power converter | |
| Oldenburger et al. | A new approach to measure the non-linear Butler–Volmer behavior of electrochemical systems in the time domain | |
| US20240418792A1 (en) | Battery health determination apparatus and method | |
| US20250231249A1 (en) | Method for controlling battery power interface converter with ultra-wideband eis measurement function | |
| Hidalgo-León et al. | Li-ion battery discharge emulator based on three-phase interleaved DC-DC boost converter | |
| US11733190B2 (en) | Method and system for measurement of impedance of electrochemical devices | |
| Yao et al. | Battery impedance measurement using fast square current perturbation | |
| Hussain et al. | Implementation of quadrature based RMS calculation on real-time power monitoring systems | |
| García et al. | Soc estimation in li-ion batteries exploiting high-frequency model properties | |
| Timergalina et al. | Application of new signal processing methods for electrochemical power source relaxation modes detection | |
| Zhang et al. | Online Battery Impedance Spectrum Measurement Based On Cross-correlation | |
| JP3995578B2 (en) | Storage battery internal impedance measuring device and storage battery internal impedance measuring method | |
| Kim et al. | Online Battery Resistance Estimation Algorithm with Down-Sampling and Preprocessing Filter in Embedded DC-DC Power Converters | |
| Liu et al. | Online Battery Impedance Identification Based on DC-DC Converter with Low Ripple |
Legal Events
| Date | Code | Title | Description |
|---|---|---|---|
| FEPP | Fee payment procedure |
Free format text: ENTITY STATUS SET TO UNDISCOUNTED (ORIGINAL EVENT CODE: BIG.); ENTITY STATUS OF PATENT OWNER: SMALL ENTITY |
|
| FEPP | Fee payment procedure |
Free format text: ENTITY STATUS SET TO SMALL (ORIGINAL EVENT CODE: SMAL); ENTITY STATUS OF PATENT OWNER: SMALL ENTITY |
|
| STPP | Information on status: patent application and granting procedure in general |
Free format text: DOCKETED NEW CASE - READY FOR EXAMINATION |
|
| AS | Assignment |
Owner name: THE BOARD OF TRUSTEES OF THE UNIVERSITY OF ALABAMA, ALABAMA Free format text: ASSIGNMENT OF ASSIGNORS INTEREST;ASSIGNOR:ABU QAHOUQ, JABER A.;REEL/FRAME:044312/0140 Effective date: 20170829 Owner name: THE BOARD OF TRUSTEES OF THE UNIVERSITY OF ALABAMA Free format text: ASSIGNMENT OF ASSIGNORS INTEREST;ASSIGNOR:ABU QAHOUQ, JABER A.;REEL/FRAME:044312/0140 Effective date: 20170829 |
|
| STPP | Information on status: patent application and granting procedure in general |
Free format text: NON FINAL ACTION MAILED |
|
| STPP | Information on status: patent application and granting procedure in general |
Free format text: RESPONSE TO NON-FINAL OFFICE ACTION ENTERED AND FORWARDED TO EXAMINER |
|
| STPP | Information on status: patent application and granting procedure in general |
Free format text: FINAL REJECTION MAILED |
|
| STPP | Information on status: patent application and granting procedure in general |
Free format text: DOCKETED NEW CASE - READY FOR EXAMINATION |
|
| STPP | Information on status: patent application and granting procedure in general |
Free format text: NOTICE OF ALLOWANCE MAILED -- APPLICATION RECEIVED IN OFFICE OF PUBLICATIONS |
|
| STPP | Information on status: patent application and granting procedure in general |
Free format text: PUBLICATIONS -- ISSUE FEE PAYMENT VERIFIED |
|
| STCF | Information on status: patent grant |
Free format text: PATENTED CASE |
|
| MAFP | Maintenance fee payment |
Free format text: PAYMENT OF MAINTENANCE FEE, 4TH YR, SMALL ENTITY (ORIGINAL EVENT CODE: M2551); ENTITY STATUS OF PATENT OWNER: SMALL ENTITY Year of fee payment: 4 |