US10690902B2 - Image processing device and microscope system - Google Patents
Image processing device and microscope system Download PDFInfo
- Publication number
- US10690902B2 US10690902B2 US16/160,244 US201816160244A US10690902B2 US 10690902 B2 US10690902 B2 US 10690902B2 US 201816160244 A US201816160244 A US 201816160244A US 10690902 B2 US10690902 B2 US 10690902B2
- Authority
- US
- United States
- Prior art keywords
- images
- plane
- cell
- image processing
- processing device
- Prior art date
- Legal status (The legal status is an assumption and is not a legal conclusion. Google has not performed a legal analysis and makes no representation as to the accuracy of the status listed.)
- Active, expires
Links
Images


Classifications
-
- G—PHYSICS
- G02—OPTICS
- G02B—OPTICAL ELEMENTS, SYSTEMS OR APPARATUS
- G02B21/00—Microscopes
- G02B21/36—Microscopes arranged for photographic purposes or projection purposes or digital imaging or video purposes including associated control and data processing arrangements
- G02B21/365—Control or image processing arrangements for digital or video microscopes
- G02B21/367—Control or image processing arrangements for digital or video microscopes providing an output produced by processing a plurality of individual source images, e.g. image tiling, montage, composite images, depth sectioning, image comparison
-
- G—PHYSICS
- G02—OPTICS
- G02B—OPTICAL ELEMENTS, SYSTEMS OR APPARATUS
- G02B21/00—Microscopes
- G02B21/0004—Microscopes specially adapted for specific applications
- G02B21/002—Scanning microscopes
- G02B21/0024—Confocal scanning microscopes (CSOMs) or confocal "macroscopes"; Accessories which are not restricted to use with CSOMs, e.g. sample holders
- G02B21/0052—Optical details of the image generation
- G02B21/0076—Optical details of the image generation arrangements using fluorescence or luminescence
-
- G06K9/0014—
-
- G06T11/206—
-
- G—PHYSICS
- G06—COMPUTING OR CALCULATING; COUNTING
- G06T—IMAGE DATA PROCESSING OR GENERATION, IN GENERAL
- G06T11/00—Two-dimensional [2D] image generation
- G06T11/20—Drawing from basic elements
- G06T11/26—Drawing of charts or graphs
-
- G—PHYSICS
- G06—COMPUTING OR CALCULATING; COUNTING
- G06T—IMAGE DATA PROCESSING OR GENERATION, IN GENERAL
- G06T15/00—Three-dimensional [3D] image rendering
- G06T15/08—Volume rendering
-
- G—PHYSICS
- G06—COMPUTING OR CALCULATING; COUNTING
- G06T—IMAGE DATA PROCESSING OR GENERATION, IN GENERAL
- G06T19/00—Manipulating three-dimensional [3D] models or images for computer graphics
-
- G—PHYSICS
- G06—COMPUTING OR CALCULATING; COUNTING
- G06T—IMAGE DATA PROCESSING OR GENERATION, IN GENERAL
- G06T5/00—Image enhancement or restoration
- G06T5/50—Image enhancement or restoration using two or more images, e.g. averaging or subtraction
-
- G—PHYSICS
- G06—COMPUTING OR CALCULATING; COUNTING
- G06T—IMAGE DATA PROCESSING OR GENERATION, IN GENERAL
- G06T7/00—Image analysis
- G06T7/50—Depth or shape recovery
- G06T7/55—Depth or shape recovery from multiple images
- G06T7/571—Depth or shape recovery from multiple images from focus
-
- G—PHYSICS
- G06—COMPUTING OR CALCULATING; COUNTING
- G06T—IMAGE DATA PROCESSING OR GENERATION, IN GENERAL
- G06T7/00—Image analysis
- G06T7/70—Determining position or orientation of objects or cameras
- G06T7/73—Determining position or orientation of objects or cameras using feature-based methods
-
- G—PHYSICS
- G06—COMPUTING OR CALCULATING; COUNTING
- G06V—IMAGE OR VIDEO RECOGNITION OR UNDERSTANDING
- G06V20/00—Scenes; Scene-specific elements
- G06V20/60—Type of objects
- G06V20/69—Microscopic objects, e.g. biological cells or cellular parts
- G06V20/695—Preprocessing, e.g. image segmentation
-
- G—PHYSICS
- G06—COMPUTING OR CALCULATING; COUNTING
- G06T—IMAGE DATA PROCESSING OR GENERATION, IN GENERAL
- G06T2200/00—Indexing scheme for image data processing or generation, in general
- G06T2200/24—Indexing scheme for image data processing or generation, in general involving graphical user interfaces [GUIs]
-
- G—PHYSICS
- G06—COMPUTING OR CALCULATING; COUNTING
- G06T—IMAGE DATA PROCESSING OR GENERATION, IN GENERAL
- G06T2207/00—Indexing scheme for image analysis or image enhancement
- G06T2207/10—Image acquisition modality
- G06T2207/10056—Microscopic image
-
- G—PHYSICS
- G06—COMPUTING OR CALCULATING; COUNTING
- G06T—IMAGE DATA PROCESSING OR GENERATION, IN GENERAL
- G06T2207/00—Indexing scheme for image analysis or image enhancement
- G06T2207/10—Image acquisition modality
- G06T2207/10141—Special mode during image acquisition
- G06T2207/10148—Varying focus
-
- G—PHYSICS
- G06—COMPUTING OR CALCULATING; COUNTING
- G06T—IMAGE DATA PROCESSING OR GENERATION, IN GENERAL
- G06T2207/00—Indexing scheme for image analysis or image enhancement
- G06T2207/20—Special algorithmic details
- G06T2207/20092—Interactive image processing based on input by user
- G06T2207/20104—Interactive definition of region of interest [ROI]
-
- G—PHYSICS
- G06—COMPUTING OR CALCULATING; COUNTING
- G06T—IMAGE DATA PROCESSING OR GENERATION, IN GENERAL
- G06T2207/00—Indexing scheme for image analysis or image enhancement
- G06T2207/20—Special algorithmic details
- G06T2207/20212—Image combination
- G06T2207/20221—Image fusion; Image merging
-
- G—PHYSICS
- G06—COMPUTING OR CALCULATING; COUNTING
- G06T—IMAGE DATA PROCESSING OR GENERATION, IN GENERAL
- G06T2207/00—Indexing scheme for image analysis or image enhancement
- G06T2207/30—Subject of image; Context of image processing
- G06T2207/30004—Biomedical image processing
- G06T2207/30024—Cell structures in vitro; Tissue sections in vitro
-
- G—PHYSICS
- G06—COMPUTING OR CALCULATING; COUNTING
- G06T—IMAGE DATA PROCESSING OR GENERATION, IN GENERAL
- G06T2219/00—Indexing scheme for manipulating 3D models or images for computer graphics
- G06T2219/008—Cut plane or projection plane definition
-
- G—PHYSICS
- G06—COMPUTING OR CALCULATING; COUNTING
- G06V—IMAGE OR VIDEO RECOGNITION OR UNDERSTANDING
- G06V2201/00—Indexing scheme relating to image or video recognition or understanding
- G06V2201/12—Acquisition of 3D measurements of objects
- G06V2201/122—Computational image acquisition in electron microscopy
-
- H—ELECTRICITY
- H04—ELECTRIC COMMUNICATION TECHNIQUE
- H04N—PICTORIAL COMMUNICATION, e.g. TELEVISION
- H04N7/00—Television systems
- H04N7/18—Closed-circuit television [CCTV] systems, i.e. systems in which the video signal is not broadcast
Definitions
- the present invention relates to an image processing device and a microscope system.
- the fluorescence or luminescence signals are measured, the cells are identified from the distribution and the intensities thereof, and gallery display in which 2D images of the identified cells are arranged and displayed in a list is used, thereby making it possible to facilitate visual confirmation of the cells, which are measurement targets.
- An object of the present invention is to provide an image processing device and a microscope system that facilitate visual observation of morphological features of a cell group or individual cells acquired in 3D image data, thus making it possible to improve the observation accuracy.
- the present invention provides an image processing device including at least one processor that is provided with hardware, wherein the at least one processor is configured to: generate, on the basis of a plurality of 2D images acquired by a microscope at different focus positions on a cell clump, 3D images of respective cells constituting the cell clump; process the generated 3D images and analyze feature quantities on the basis of at least one measurement parameter; display analysis results in a graph; allow a user to select a region of interest on the displayed graph; and generate, from the 3D images that correspond to the plurality of cells that are included in the selected region of interest, 2D display images each in a plane with reference to an axis that is determined on the basis of a shape feature of the corresponding cell and display the 2D display images in a list.
- the present invention provides an image processing device including at least one processor that is provided with hardware, wherein the at least one processor is configured to: generate, on the basis of a plurality of 2D images acquired by a microscope at different focus positions on a plurality of cell clumps, 3D images of the respective cell clumps; process the generated 3D images and analyze feature amounts on the basis of at least one measurement parameter; display analysis results in a graph; allow a user to select a region of interest on the displayed graph; and generate, from the 3D images that correspond to the plurality of cell clumps that are included in the selected region of interest, 2D display images each in a plane with reference to an axis that is determined on the basis of a shape feature of the corresponding cell clump and display the 2D display images in a list.
- the present invention provides a microscope system including: any one of the above-mentioned image processing devices; and a microscope that acquires the plurality of 2D images at different focus positions on the cell clump.
- the present invention provides a non-transitory computer-readable medium that stores a computer-readable program for implementing a control method for controlling a microscope system, the method including: a step of generating, on the basis of a plurality of 2D images acquired by a microscope at different focus positions on a cell clump, 3D images of respective cells constituting the cell clump; a step of processing the generated 3D images and analyzing feature amounts on the basis of at least one measurement parameter; a step of displaying analysis results in a graph; a step of allowing a user to select a region of interest on the displayed graph; and a step of generating, from the 3D images that correspond to the plurality of cells that are included in the selected region of interest, 2D display images each in a plane with reference to an axis that is determined on the basis of a shape feature of the corresponding cell and displaying the 2D display images in a list.
- FIG. 1 is a view showing the overall configuration of a microscope system according to one embodiment of the present invention.
- FIG. 2 is a perspective view showing an example cell clump to be observed by the microscope system shown in FIG. 1 .
- FIG. 3 is a view showing an example label image.
- FIG. 4 is a view showing an example table.
- FIG. 5 is a view showing a state in which an XY cross-sectional image, an XZ cross-sectional image, and a YZ cross-sectional image are displayed side by side on a monitor.
- FIG. 6 is a view showing a state in which the respective cross-sectional images, a graph, and a gallery display are displayed side by side on the monitor.
- FIG. 7 is a view for explaining a case in which a region of interest is specified on a histogram, in an image processing device provided in the microscope system shown in FIG. 1 .
- FIG. 8 is a view showing an example screen on which conditions for gallery display are input, in the image processing device provided in the microscope system shown in FIG. 1 .
- FIG. 9 is a flowchart for explaining a procedure for performing gallery display of individual cells, by using the microscope system shown in FIG. 1 .
- FIG. 10 is a perspective view showing a longitudinal axis and a center-of-gravity position extracted in a 3D image of a cell included in the region of interest shown in FIG. 7 , and a transverse section that includes the center-of-gravity position and that is perpendicular to the longitudinal axis.
- FIG. 11 is a perspective view showing a longitudinal axis and a center position extracted in a 3D image of a cell included in the region of interest shown in FIG. 7 , and a transverse section that includes the center position and that is perpendicular to the longitudinal axis.
- FIG. 12 is a perspective view showing a longitudinal axis extracted in a 3D image of a cell included in the region of interest shown in FIG. 7 , and an example projection image in which the maximum brightness value in the cell in the direction along the longitudinal axis thereof is projected on a projection plane perpendicular to the longitudinal axis.
- FIG. 13 is a perspective view showing a longitudinal axis and a center-of-gravity position extracted in a 3D image of a cell included in the region of interest shown in FIG. 7 , and a longitudinal section that includes the center-of-gravity position and that extends along the longitudinal axis.
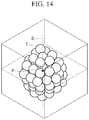
- FIG. 14 is a perspective view for explaining a case in which a longitudinal axis and a center-of-gravity position of a cell clump are extracted in the cell clump, and a 2D image in a plane that passes through the center-of-gravity position and that is perpendicular to the longitudinal axis is generated.
- the microscope system 1 of this embodiment is provided with: a laser scanning microscope (microscope) 3 ; a control device 5 that controls the laser scanning microscope 3 and that constructs an image; a monitor 7 that displays the image constructed by the control device 5 ; a PC (Personal Computer, image processing device) 9 ; and an input unit 11 , such as a mouse or a keyboard, through which an operator performs various inputs.
- a laser scanning microscope microscope
- control device 5 controls the laser scanning microscope 3 and that constructs an image
- a monitor 7 that displays the image constructed by the control device 5
- PC Personal Computer, image processing device
- an input unit 11 such as a mouse or a keyboard, through which an operator performs various inputs.
- the laser scanning microscope 3 is provided with: a motorized stage 13 on which a transparent container (not shown), such as a petri dish, for accommodating a spheroid (cell clump) T composed of a plurality of cells S (see FIG. 2 ) is mounted; a laser light source unit 15 that emits laser light; a scanner 17 that two-dimensionally scans the laser light emitted by the laser light source unit 15 ; an objective lens 19 that focuses the laser light scanned by the scanner 17 onto a cell S; an image acquisition unit 21 that detects fluorescence produced in the cell S when the cell S is irradiated with the laser light through the objective lens 19 and that acquires an image of the cell S; and a dark box 23 that accommodates the above components of the laser scanning microscope 3 .
- the motorized stage 13 is provided with three motors (not shown), so that the motorized stage 13 moves independently along motion axes in X, Y, and Z directions perpendicular to one another, thus making it possible to move the container mounted thereon in a three-dimensional direction.
- the interior of the dark box 23 is divided into an upper area 25 A, which includes the motorized stage 13 and is located at an upper side, and a lower area 25 B, which is located lower than the upper area 25 A.
- a heater 27 is disposed in the upper area 25 A, so that the temperature in the upper area 25 A is adjusted to a predetermined culture condition (for example, 27° C. ⁇ 0.5° C.).
- a sample holder 29 that is mounted on the motorized stage 13 in a positioned state is disposed in the upper area 25 A.
- the sample holder 29 can hold, on the motorized stage 13 , the container in a positioned state.
- the container held by the sample holder 29 is accommodated in a simple incubator 31 , thus maintaining the culture conditions thereof (for example, humidity of 100% and CO2 concentration of 0.5%).
- reference sign 33 denotes a phase-difference condenser for phase-difference observation.
- the laser light source unit 15 is provided with: a plurality of laser diodes 35 that produce laser light at different wavelengths; and a mirror 37 and dichroic mirrors 39 that cause the laser light produced by the plurality of laser diodes 35 to merge into a single light path.
- the scanner 17 is, for example, a so-called proximity galvanometer mirror that is formed by opposing two galvanometer mirrors that are made to swivel about axes perpendicular to each other.
- the objective lens 19 is provided such that an objective lens 19 A for dry observation and an objective lens 19 B for oil-immersion or water-immersion observation can be switched by a revolver 41 .
- the objective lens 19 has an auto-focus function, detects an in-focus position periodically or as needed, and is moved in the direction along the optical axis, thereby making it possible to match the focus position of the objective lens 19 with the surface of the cell S.
- reference sign 43 denotes a pump for supplying immersion oil for oil immersion or water for water immersion to the space between the objective lens 19 B and the bottom of the container
- reference sign 45 denotes an airbrush for removing the water or the immersion oil.
- a pupil projection lens 47 and an imaging lens 49 that focus the laser light scanned by the scanner 17 are disposed between the scanner 17 and the objective lens 19 .
- the image acquisition unit 21 is provided with: a beam splitter 51 that is inserted between the laser light source unit 15 and the scanner 17 and that splits off, from the light path of the laser light, fluorescence that is produced by the cell S and that returns vis the objective lens 19 , the imaging lens 49 , the pupil projection lens 47 , and the scanner 17 ; a confocal lens 53 that focuses the fluorescence split off by the beam splitter 51 ; a variable pinhole 55 ; a collimating lens 57 ; a grating 59 that diffracts the fluorescence converted into approximately collimated light by the collimating lens 57 , thus separating the fluorescence into wavelengths; a focusing lens 61 that focuses the fluorescence separated by the grating 59 ; a beam splitter 63 that splits the focused fluorescence into wavelengths; and light detectors 65 that respectively detect the fluorescence split by the beam splitter 63 .
- the variable pinhole 55 is disposed in an optically conjugate positional
- the control device 5 controls driving of the motorized stage 13 and the scanner 17 and constructs an image on the basis of luminance information output from the light detectors 65 .
- the control device 5 moves the motorized stage 13 three-dimensionally with respect to the objective lens 19 , thereby moving the spheroid T three-dimensionally with respect to the focus position of the objective lens 19 , and, at the same time, the control device 5 causes the scanner 17 to two-dimensionally scan the laser light at each focus position.
- a slice image (acquired image) of a cell S that is disposed at the focus position of the objective lens 19 is constructed on the basis of a luminance signal output from the light detector 65 that has detected the fluorescence produced by the cell S, and thus, a plurality of slice images of each cell S are acquired.
- control device 5 subjects the plurality of slice images of each cell S to image processing, thereby constructing a 3D image of the entire spheroid T. Data for the plurality of slice images and the 3D image obtained by the control device 5 is sent to the PC 9 .
- the control device 5 is constituted of: a first communication I/F circuit (not shown) for performing data communication with the PC 9 ; a second communication I/F circuit (not shown) for performing data communication with the laser scanning microscope 3 in order to control the motorized stage 13 , the scanner 17 , the light detectors 65 , etc.; a CPU (not shown); a memory (not shown); and so on.
- a GPU Graphics Processing Unit, not shown
- a GPU Graphics Processing Unit, not shown
- the image processing device of this embodiment is formed of the PC 9 .
- the PC 9 is provided with: a disk (HDD (Hard Disk Drive)) 69 that stores various programs, image data, graph data, etc.; a CPU (Central Processing Unit, 3D-image generating unit, analysis unit, region-of-interest selecting unit, analysis-result displaying unit, gallery generating unit) 71 that executes the programs stored in the disk 69 ; and a memory 73 , such as a RAM (Random Access Memory), that stores recognition results and analysis results of the cells S obtained through the execution of the programs in the CPU 71 .
- a disk HDD (Hard Disk Drive)
- CPU Central Processing Unit, 3D-image generating unit, analysis unit, region-of-interest selecting unit, analysis-result displaying unit, gallery generating unit
- a memory 73 such as a RAM (Random Access Memory), that stores recognition results and analysis results of the cells S obtained through the execution of the programs in the CPU 71 .
- the disk 69 stores, as the programs to be executed by the CPU 71 , a recognition program, a display program, and a measurement program, for example.
- the disk 69 stores image data, such as a plurality of slice images of each cell S and a 3D image of the entire spheroid T, acquired by the control device 5 .
- the CPU 71 performs recognition processing with respect to the entire spheroid T and individual cells S on a 3D image.
- the recognition processing for example, a plurality of LoG (Laplacian Of Gaussian) filters having different sizes are adopted, a local peak position and the size thereof are detected from output values of the LoG filters, and this peak position is set as a seed (the center position of the cell S). Then, the LoG filters are applied two-dimensionally and three-dimensionally, and the results are combined. Next, trimming and, adaptively, binarization processing are applied to a neighborhood region around the seed on the basis of the size thereof, thus forming a region of the recognized cell S.
- LoG Laplacian Of Gaussian
- the CPU 71 identifies the recognized entire spheroid T or individual cells S by giving, thereto, labels different from one another, thus generating, for example, a label image, such as that shown in FIG. 3 , and a table, such as that shown in FIG. 4 .
- the CPU 71 generates 3D images of the recognized individual cells S.
- the label image is a 2D image that expresses recognized objects respectively assigned, as the labels, object IDs (for example, 1, 2, 3, 4, . . . , k, . . . n) and an unrecognized background assigned 0.
- the table is information in which the label (object ID), center position information, and circumscribed rectangle are associated, as shown in FIG. 4 .
- the label image, the 3D images and the table generated by the CPU 71 are stored in the memory 73 .
- the CPU 71 measures and analyzes, from the 3D images, the recognized individual cells S, which constitute the spheroid T, and generates graphs showing the distribution of characteristics of the measured and analyzed cells S.
- the graphs for example, a histogram, a scattergram, a line graph, etc., can be included.
- the graphs generated by the CPU 71 are stored in the disk 69 .
- the CPU 71 simultaneously displays three cross-sectional images, i.e., an XY cross-sectional image, an XZ cross-sectional image, and a YZ cross-sectional image, that constitute a 3D image and that are perpendicular to one another, on the monitor 7 in an associated manner, for example, as shown in FIG. 5 (three-plane display).
- the coordinate axis Z corresponds to the direction of gravity
- an XY plane corresponds to the horizontal direction.
- the respective cross-sectional images correspond to an acquired image in the XY direction and 2D images formed of cross sections obtained by cutting a 3D image in the XZ direction and the YZ direction.
- the CPU 71 displays, on the monitor 7 , the graphs, such as a histogram and a scattergram, and a statistic display that show the distribution of characteristics of the measured and analyzed cells S, side by side with the respective cross-sectional images. Furthermore, the CPU 71 allows a user to select a region of interest on the graphs, such as a histogram and a scattergram, displayed on the monitor 7 .
- the user draws a rectangular diagram on the histogram so as to surround a region of interest, thereby selecting cells S included in the region of interest surrounded by the diagram.
- the CPU 71 displays, on the monitor 7 , a screen for allowing the user to select conditions for gallery display.
- the conditions for gallery display can include: a display mode indicating the type of images to be displayed; the position, in the cells S, of the images to be displayed; a display order when a list of the images is displayed in a matrix; and a display channel.
- the type of images to be displayed can include, for example, a cross-sectional image and a projection image.
- the cross-sectional image can be, for example, an image in a transverse section perpendicular to the longitudinal axis A of a cell S.
- the projection image can be, for example, an image in which the maximum brightness in the direction along the longitudinal axis A of a cell S is projected on a plane perpendicular to the longitudinal axis A.
- the position, in the cells S, of the images to be displayed can be chosen from, for example, a center position C in the direction along the longitudinal axis A of each of the cells S or a transverse section at a center-of-gravity position G of the cells S.
- the display order can be selected from: the order of the size of a transverse section to be displayed; the order of the magnitude of the maximum brightness; or the order of the magnitude of the average brightness.
- the order can be switched between ascending order and descending order.
- the display channel it is possible to choose from: display of an image generated on the basis of fluorescence detected by the light detector 65 of a channel CH 1 or CH 2 ; or display of images generated on the basis of fluorescence detected by the light detectors 65 of both channels CH 1 and CH 2 .
- the CPU 71 processes 3D images of the cells S corresponding to all labels searched for as the cells S included in the region of interest, extracts the longitudinal axes A of the respective cells S, generates 2D images of the respective cells S according to the input conditions, and displays the 2D images in a list on the monitor 7 .
- the container is held by the sample holder 29 , the container is mounted on the motorized stage 13 , and the laser light source unit 15 is made to produce laser light.
- the laser light produced by the laser light source unit 15 is two-dimensionally scanned by the scanner 17 and is focused on a cell S in the container via the pupil projection lens 47 , the imaging lens 49 , and the objective lens 19 .
- a fluorescent substance existing in the cell S is excited to produce fluorescence.
- the produced fluorescence returns along the light path of the laser light via the objective lens 19 , the imaging lens 49 , the pupil projection lens 47 , and the scanner 17 and is split off therefrom by the beam splitter 51 , thus entering the image acquisition unit 21 .
- the fluorescence entering the image acquisition unit 21 is focused by the confocal lens 53 , and only fluorescence that has passed through the variable pinhole 55 is converted into substantially collimated light by the collimating lens 57 . Then, the fluorescence is diffracted by the grating 59 , travels via the focusing lens 61 and the beam splitter 63 , and is detected by the different light detectors 65 for respective wavelengths. Then, in the control device 5 , slice images of the cell S are constructed on the basis of luminance signals output from the light detectors 65 , the plurality of constructed slice images are subjected to image processing, and a 3D image is constructed.
- variable pinhole 55 is sufficiently narrowed down, thereby making it possible to allow only fluorescence that is produced at the focus position of the objective lens 19 to pass therethrough and to be detected by the light detectors 65 , and to acquire a clear confocal fluorescence image with no blurring.
- the CPU 71 executes the recognition program, recognizes individual cells S in a 3D image stored in the disk 69 , identifies the cells S by giving, thereto, labels different from one another, and generates a label image, such as that shown in FIG. 3 , and a table, such as that shown in FIG. 4 . 3D images of the recognized individual cells S are generated.
- the CPU 71 executes the measurement program, measures and analyzes the recognized individual cells S from the 3D images, and generates graphs showing the distribution of characteristics of the measured and analyzed cells S. Then, the CPU 71 executes the display program and displays an XY cross-sectional image, an XZ cross-sectional image, and a YZ cross-sectional image that constitute a 3D image, and the graphs, such as a histogram, on the monitor 7 , side by side in association with one another.
- Step SA 1 when the user specifies, by means of the input unit 11 , an arbitrary region of interest on the histogram displayed on the monitor 7 (Step SA 1 ), the CPU 71 displays, on the monitor 7 , the screen for allowing the user to select the conditions for gallery display, as shown in FIG. 8 (Step SA 2 ).
- the CPU 71 searches the label image and the table, which are stored in the disk 69 , for the labels of all cells S included in the region of interest (Step SA 3 ).
- Step SA 4 If the corresponding labels exist (Step SA 4 ), 2D images of the respective cells S in the region of interest are generated according to the conditions set in the screen shown in FIG. 8 (Step SA 5 ).
- the longitudinal axis A and the center-of-gravity position G of each of the cells S are detected, and a 2D image in a plane (in the figure, a shaded region) that is perpendicular to the longitudinal axis A of the cell S and that includes the center-of-gravity position G, i.e., a transverse sectional image at the center-of-gravity position G of the cell S, is generated.
- Step SA 6 If the 2D images of the all cells S included in the region of interest are generated (Step SA 6 ), the generated 2D images of the respective cells S are displayed in a list in descending order of the size of the transverse sectional area (gallery display) (Step SA 7 ).
- the center position C As shown in FIG. 11 , from the 3D images of all cells S included in the specified region of interest, the longitudinal axis A and the center position C in the longitudinal-axis direction of each of the cells S are detected, and a 2D image in a plane (in the figure, a shaded region) that is perpendicular to the longitudinal axis A of the cell S and that includes the center position C in the longitudinal-axis direction, i.e., a transverse sectional image at the center in the longitudinal-axis direction of the cell S, is generated.
- the longitudinal axis A of each of the cells S is detected, and an image in which the maximum brightness in the direction along the longitudinal axis A is projected on a plane B perpendicular to the longitudinal axis A is generated.
- the image processing device 9 and the microscope system 1 of this embodiment because the 2D images of the respective cells S constituting a spheroid T are displayed in a list, the user can compare and observe the states of the cells S at a glance.
- the 2D image of each of the cells S is in a plane with reference to the longitudinal axis A, which is an axis determined on the basis of a shape feature of the cell S, thus successfully expressing the shape feature of the cell S; and the 2D image of each of the cells S is generated according to the same reference, thus making is possible to facilitate comparison between the cells S.
- transverse sectional images in planes perpendicular to the longitudinal axes A of cells S and in the planes including the center positions C in the longitudinal-axis direction or the center-of-gravity positions G are subjected to gallery display
- the present invention is not limited thereto, and, for example, as shown in FIG. 13 , longitudinal sectional images each in a plane (in the figure, a shaded region) along the longitudinal-axis direction and in the plane including the center-of-gravity position G may also be subjected to gallery display.
- the conditions for gallery display are input by the user, instead of this, some of the above-described conditions may be set in advance, and, when a region of interest is specified, 2D images of all cells S included in the region of interest may be generated with the set conditions and subjected to gallery display.
- the display order in the gallery display is set to the order of the size of the cross sectional area, the order of the magnitude of the maximum brightness, or the order of the magnitude of the average brightness, the present invention is not limited thereto, and it is also possible to perform display in detection order, for example.
- the longitudinal axis A or D of a cell S or a spheroid T is shown as an axis determined on the basis of the shape feature of the cell S or the spheroid T, the present invention is not limited thereto.
- the present invention is not limited thereto, and the present invention may be applied to any of: a three-dimensionally cultured cell group, such as a neurosphere and an organoid; micro-tissue, such as an iPS cell or an ES cell, that is derived and differentiated from a stem cell or that is in a regeneration process; a small animal, such as a nematode, zebrafish, or a mouse; tissue, such as liver, brain, or a tumor; and an embryo at an early stage of development.
- a three-dimensionally cultured cell group such as a neurosphere and an organoid
- micro-tissue such as an iPS cell or an ES cell, that is derived and differentiated from a stem cell or that is in a regeneration process
- a small animal such as a nematode, zebrafish, or a mouse
- tissue such as liver, brain, or a tumor
- an embryo at an early stage of development such as embryo at an early stage of development.
- the present invention provides an image processing device including at least one processor that is provided with hardware, wherein the at least one processor is configured to: generate, on the basis of a plurality of 2D images acquired by a microscope at different focus positions on a cell clump, 3D images of respective cells constituting the cell clump; process the generated 3D images and analyze feature quantities on the basis of at least one measurement parameter; display analysis results in a graph; allow a user to select a region of interest on the displayed graph; and generate, from the 3D images that correspond to the plurality of cells that are included in the selected region of interest, 2D display images each in a plane with reference to an axis that is determined on the basis of a shape feature of the corresponding cell and display the 2D display images in a list.
- 3D images of respective cells constituting the cell clump are generated by the 3D-image generating unit.
- the generated 3D images are processed by the analysis unit, thus analyzing feature quantities on the basis of at least one measurement parameter, and analysis results are displayed in a graph by the analysis-result displaying unit.
- the gallery generating unit When the user selects a region of interest on the graph, the gallery generating unit generates, from the 3D images that correspond to the plurality of cells included in the selected region of interest, 2D display images each in a plane with reference to an axis that is determined on the basis of a shape feature of the corresponding cell and displays the 2D display images in a list.
- the 2D display images of the respective cells displayed in the list are 2D images each in a plane with reference to an axis that is determined on the basis of a shape feature of the corresponding cell, not in an arbitrary transverse section of the cell, the 2D display images are easily compared with one another, and visual observation of morphological features of the respective cells acquired in 3D image data is facilitated, thus making it possible to improve the observation accuracy.
- the above-described aspect may further include a storage unit that stores at least one computer program to be executed by the at least one processor.
- the axis may be a longitudinal axis of the cell.
- 2D images each in a plane with reference to the longitudinal axis of the corresponding cell are displayed in a list, thereby making it possible to compare meaningful 2D images as images expressing the shape features of the respective cells, to easily compare the 2D images with one another, to facilitate visual observation of morphological features of the respective cells acquired in 3D image data, and to improve the observation accuracy.
- the plane may be a plane that includes a center-of-gravity position of the cell, among planes perpendicular to the longitudinal axis or planes along the longitudinal axis.
- the plane may be a plane that includes a center position in the longitudinal-axis direction, among planes perpendicular to the longitudinal axis.
- the plane may be a plane that includes a center-of-gravity position of the cell, among planes along the longitudinal axis.
- the plane may be a plane perpendicular to the longitudinal axis or a plane along the longitudinal axis; and the display images may be images in each of which the maximum value of brightness of pixels arrayed in the longitudinal-axis direction or in a direction perpendicular to the longitudinal-axis direction is projected on the plane.
- the present invention provides an image processing device including at least one processor that is provided with hardware, wherein the at least one processor is configured to: generate, on the basis of a plurality of 2D images acquired by a microscope at different focus positions on a plurality of cell clumps, 3D images of the respective cell clumps; process the generated 3D images and analyze feature amounts on the basis of at least one measurement parameter; display analysis results in a graph; allow a user to select a region of interest on the displayed graph; and generate, from the 3D images that correspond to the plurality of cell clumps that are included in the selected region of interest, 2D display images each in a plane with reference to an axis that is determined on the basis of a shape feature of the corresponding cell clump and display the 2D display images in a list.
- 3D images of the respective cell clumps are generated by the 3D-image generating unit.
- the generated 3D images are processed by the analysis unit, thus analyzing feature quantities on the basis of at least one measurement parameter, and analysis results are displayed in a graph by the analysis-result displaying unit.
- the gallery generating unit When the user selects a region of interest on the graph, the gallery generating unit generates, from the 3D images that correspond to the plurality of cell clumps included in the selected region of interest, 2D display images each in a plane with reference to an axis that is determined on the basis of a shape feature of the corresponding cell clump and displays the 2D display images in a list.
- the 2D display images of the respective cell clumps displayed in the list are 2D images each in a plane with reference to an axis that is determined on the basis of a shape feature of the corresponding cell clump, not in an arbitrary transverse section of the cell clump, the 2D display images are easily compared with one another, and visual observation of morphological features of the respective cell clumps acquired in 3D image data is facilitated, thus making it possible to improve the observation accuracy.
- the above-described aspect may further include a storage unit that stores at least one computer program to be executed by the at least one processor.
- the axis may be a longitudinal axis of the cell clump.
- the plane may be a plane that includes a center-of-gravity position of the cell clump, among planes perpendicular to the longitudinal axis or planes along the longitudinal axis.
- the plane may be a plane that includes a center position in the longitudinal-axis direction, among planes perpendicular to the longitudinal axis.
- the plane may be a plane that includes a center-of-gravity position of the cell clump, among planes along the longitudinal axis.
- the plane is a plane perpendicular to the longitudinal axis or a plane along the longitudinal axis; and the display images are images in each of which the maximum value of brightness of pixels arrayed in the longitudinal-axis direction or in a direction perpendicular to the longitudinal-axis direction is projected on the plane.
- the present invention provides a microscope system including: any one of the above-mentioned image processing devices; and a microscope that acquires the plurality of 2D images at different focus positions on the cell clump.
- the present invention provides a non-transitory computer-readable medium that stores a computer-readable program for implementing a control method for controlling a microscope system, the method including: a step of generating, on the basis of a plurality of 2D images acquired by a microscope at different focus positions on a cell clump, 3D images of respective cells constituting the cell clump; a step of processing the generated 3D images and analyzing feature amounts on the basis of at least one measurement parameter; a step of displaying analysis results in a graph; a step of allowing a user to select a region of interest on the displayed graph; and a step of generating, from the 3D images that correspond to the plurality of cells that are included in the selected region of interest, 2D display images each in a plane with reference to an axis that is determined on the basis of a shape feature of the corresponding cell and displaying the 2D display images in a list.
Landscapes
- Engineering & Computer Science (AREA)
- Physics & Mathematics (AREA)
- General Physics & Mathematics (AREA)
- Theoretical Computer Science (AREA)
- Multimedia (AREA)
- Computer Vision & Pattern Recognition (AREA)
- Analytical Chemistry (AREA)
- Optics & Photonics (AREA)
- Chemical & Material Sciences (AREA)
- Computer Graphics (AREA)
- Biomedical Technology (AREA)
- Health & Medical Sciences (AREA)
- Life Sciences & Earth Sciences (AREA)
- General Health & Medical Sciences (AREA)
- Molecular Biology (AREA)
- Software Systems (AREA)
- General Engineering & Computer Science (AREA)
- Computer Hardware Design (AREA)
- Microscoopes, Condenser (AREA)
- Investigating, Analyzing Materials By Fluorescence Or Luminescence (AREA)
Abstract
Description
- 1 microscope system
- 3 laser scanning microscope (microscope)
- PC (image processing device)
- CPU (analysis unit, region-of-interest selecting unit, analysis-result displaying unit, gallery generating unit, 3D-image generating unit)
- A, D longitudinal axis (axis)
- C center position
- G center-of-gravity position
- S cell
- T spheroid (cell clump)
Claims (17)
Applications Claiming Priority (2)
| Application Number | Priority Date | Filing Date | Title |
|---|---|---|---|
| JP2017-205693 | 2017-10-25 | ||
| JP2017205693A JP7015144B2 (en) | 2017-10-25 | 2017-10-25 | Image processing equipment and microscope system |
Publications (2)
| Publication Number | Publication Date |
|---|---|
| US20190121112A1 US20190121112A1 (en) | 2019-04-25 |
| US10690902B2 true US10690902B2 (en) | 2020-06-23 |
Family
ID=66170547
Family Applications (1)
| Application Number | Title | Priority Date | Filing Date |
|---|---|---|---|
| US16/160,244 Active 2038-11-07 US10690902B2 (en) | 2017-10-25 | 2018-10-15 | Image processing device and microscope system |
Country Status (2)
| Country | Link |
|---|---|
| US (1) | US10690902B2 (en) |
| JP (1) | JP7015144B2 (en) |
Families Citing this family (3)
| Publication number | Priority date | Publication date | Assignee | Title |
|---|---|---|---|---|
| US11422355B2 (en) | 2020-07-22 | 2022-08-23 | Sartorius Bioanalytical Instruments, Inc. | Method and system for acquisition of fluorescence images of live-cell biological samples |
| KR102746473B1 (en) | 2021-07-09 | 2024-12-26 | 주식회사 넥스트앤바이오 | Producing method of image data using virtual organoid |
| EP4535307A1 (en) * | 2023-10-05 | 2025-04-09 | Ceva Santé Animale | A system and method for analyzing biological sample in view of parasite characterisation |
Citations (8)
| Publication number | Priority date | Publication date | Assignee | Title |
|---|---|---|---|---|
| WO2009110614A1 (en) | 2008-03-07 | 2009-09-11 | Kobayashi Yasunobu | Effector cell function measurement method, measurement kit and measurement system |
| US20110090223A1 (en) * | 2004-05-27 | 2011-04-21 | Aperio Technologies, Inc. | Creating and viewing three dimensional virtual slides |
| US20120002033A1 (en) * | 2010-07-01 | 2012-01-05 | Sony Corporation | Microscope control device, image management server, image processing method, program, and image management system |
| US20120007977A1 (en) * | 2010-07-12 | 2012-01-12 | Sony Corporation | Microscope control device, image display device, image management server, in-focus position information generating method, image display method, image management method and microscope image management system |
| US20140022236A1 (en) * | 2012-07-19 | 2014-01-23 | Sony Corporation | Method and apparatus for navigating stacked microscopy images |
| US20150143274A1 (en) * | 2012-05-02 | 2015-05-21 | Leica Microsystems Cms Gmbh | Method to be carried out when operating a microscope and microscope |
| US20180204047A1 (en) | 2017-01-16 | 2018-07-19 | Olympus Corporation | Observation system |
| WO2018158810A1 (en) * | 2017-02-28 | 2018-09-07 | 株式会社島津製作所 | Cell observation device |
Family Cites Families (2)
| Publication number | Priority date | Publication date | Assignee | Title |
|---|---|---|---|---|
| KR101400410B1 (en) * | 2012-08-14 | 2014-05-28 | 이화여자대학교 산학협력단 | Method and apparatus for analyzing cells in microscopy image |
| JP2016220613A (en) * | 2015-05-29 | 2016-12-28 | オリンパス株式会社 | Cell analysis method |
-
2017
- 2017-10-25 JP JP2017205693A patent/JP7015144B2/en active Active
-
2018
- 2018-10-15 US US16/160,244 patent/US10690902B2/en active Active
Patent Citations (9)
| Publication number | Priority date | Publication date | Assignee | Title |
|---|---|---|---|---|
| US20110090223A1 (en) * | 2004-05-27 | 2011-04-21 | Aperio Technologies, Inc. | Creating and viewing three dimensional virtual slides |
| WO2009110614A1 (en) | 2008-03-07 | 2009-09-11 | Kobayashi Yasunobu | Effector cell function measurement method, measurement kit and measurement system |
| US20120002033A1 (en) * | 2010-07-01 | 2012-01-05 | Sony Corporation | Microscope control device, image management server, image processing method, program, and image management system |
| US20120007977A1 (en) * | 2010-07-12 | 2012-01-12 | Sony Corporation | Microscope control device, image display device, image management server, in-focus position information generating method, image display method, image management method and microscope image management system |
| US20150143274A1 (en) * | 2012-05-02 | 2015-05-21 | Leica Microsystems Cms Gmbh | Method to be carried out when operating a microscope and microscope |
| US20140022236A1 (en) * | 2012-07-19 | 2014-01-23 | Sony Corporation | Method and apparatus for navigating stacked microscopy images |
| US20180204047A1 (en) | 2017-01-16 | 2018-07-19 | Olympus Corporation | Observation system |
| JP2018115875A (en) | 2017-01-16 | 2018-07-26 | オリンパス株式会社 | Observation system |
| WO2018158810A1 (en) * | 2017-02-28 | 2018-09-07 | 株式会社島津製作所 | Cell observation device |
Also Published As
| Publication number | Publication date |
|---|---|
| US20190121112A1 (en) | 2019-04-25 |
| JP7015144B2 (en) | 2022-02-02 |
| JP2019078884A (en) | 2019-05-23 |
Similar Documents
| Publication | Publication Date | Title |
|---|---|---|
| US12216055B2 (en) | Microscope image capturing methods | |
| US12130418B2 (en) | Microscope system | |
| US11822066B2 (en) | Sample observation device and sample observation method | |
| US9383570B2 (en) | Image analysis method and image analysis apparatus | |
| JP6548965B2 (en) | Microscope system and microscopic observation method | |
| WO2019229912A1 (en) | Information processing device, information processing method, information processing program, and microscope | |
| US10690902B2 (en) | Image processing device and microscope system | |
| US12482098B2 (en) | Plaque detection method for imaging of cells | |
| JP2022132488A (en) | Apparatus, method and program | |
| JP7626765B2 (en) | Sample observation device and sample observation method | |
| JP2013109119A (en) | Microscope controller and program | |
| US10417482B2 (en) | Observation system | |
| JP2000292422A (en) | Scanning site meter | |
| US20240102912A1 (en) | Plaque counting assay method | |
| US10475198B2 (en) | Microscope system and specimen observation method | |
| US10845357B2 (en) | Observation system | |
| JP7382289B2 (en) | Image processing method, program and recording medium | |
| US7983466B2 (en) | Microscope apparatus and cell observation method | |
| US12591976B2 (en) | Cell segmentation image processing methods | |
| US20230341748A1 (en) | Method and apparatus for displaying cultured cells | |
| JP7767182B2 (en) | Analysis method and analysis device | |
| JP2025149755A (en) | Image acquisition system and image acquisition method |
Legal Events
| Date | Code | Title | Description |
|---|---|---|---|
| AS | Assignment |
Owner name: OLYMPUS CORPORATION, JAPAN Free format text: ASSIGNMENT OF ASSIGNORS INTEREST;ASSIGNORS:KITAGAWA, HISAO;YAMASHITA, YUSUKE;REEL/FRAME:047166/0747 Effective date: 20180928 |
|
| FEPP | Fee payment procedure |
Free format text: ENTITY STATUS SET TO UNDISCOUNTED (ORIGINAL EVENT CODE: BIG.); ENTITY STATUS OF PATENT OWNER: LARGE ENTITY |
|
| STPP | Information on status: patent application and granting procedure in general |
Free format text: DOCKETED NEW CASE - READY FOR EXAMINATION |
|
| STPP | Information on status: patent application and granting procedure in general |
Free format text: NON FINAL ACTION MAILED |
|
| STPP | Information on status: patent application and granting procedure in general |
Free format text: RESPONSE TO NON-FINAL OFFICE ACTION ENTERED AND FORWARDED TO EXAMINER |
|
| STPP | Information on status: patent application and granting procedure in general |
Free format text: PUBLICATIONS -- ISSUE FEE PAYMENT VERIFIED |
|
| STCF | Information on status: patent grant |
Free format text: PATENTED CASE |
|
| AS | Assignment |
Owner name: EVIDENT CORPORATION, JAPAN Free format text: ASSIGNMENT OF ASSIGNORS INTEREST;ASSIGNOR:OLYMPUS CORPORATION;REEL/FRAME:062492/0267 Effective date: 20221024 |
|
| MAFP | Maintenance fee payment |
Free format text: PAYMENT OF MAINTENANCE FEE, 4TH YEAR, LARGE ENTITY (ORIGINAL EVENT CODE: M1551); ENTITY STATUS OF PATENT OWNER: LARGE ENTITY Year of fee payment: 4 |