US10677768B2 - Gas sensing systems and methods of operation thereof - Google Patents
Gas sensing systems and methods of operation thereof Download PDFInfo
- Publication number
- US10677768B2 US10677768B2 US15/663,711 US201715663711A US10677768B2 US 10677768 B2 US10677768 B2 US 10677768B2 US 201715663711 A US201715663711 A US 201715663711A US 10677768 B2 US10677768 B2 US 10677768B2
- Authority
- US
- United States
- Prior art keywords
- sensor
- data points
- sensor data
- obtaining
- sensing
- Prior art date
- Legal status (The legal status is an assumption and is not a legal conclusion. Google has not performed a legal analysis and makes no representation as to the accuracy of the status listed.)
- Active, expires
Links
- 238000000034 method Methods 0.000 title claims abstract description 99
- 238000010438 heat treatment Methods 0.000 claims description 61
- OKTJSMMVPCPJKN-UHFFFAOYSA-N Carbon Chemical compound [C] OKTJSMMVPCPJKN-UHFFFAOYSA-N 0.000 claims description 18
- 229910021389 graphene Inorganic materials 0.000 claims description 18
- 230000004044 response Effects 0.000 claims description 18
- 238000000611 regression analysis Methods 0.000 claims description 13
- 238000009529 body temperature measurement Methods 0.000 claims description 3
- 239000000758 substrate Substances 0.000 description 76
- 230000007613 environmental effect Effects 0.000 description 64
- 239000007789 gas Substances 0.000 description 49
- 238000007781 pre-processing Methods 0.000 description 21
- 238000012937 correction Methods 0.000 description 20
- 239000012491 analyte Substances 0.000 description 13
- 238000012805 post-processing Methods 0.000 description 10
- 230000000875 corresponding effect Effects 0.000 description 8
- 230000035945 sensitivity Effects 0.000 description 8
- 238000012417 linear regression Methods 0.000 description 6
- 238000005259 measurement Methods 0.000 description 6
- 238000012986 modification Methods 0.000 description 6
- 230000004048 modification Effects 0.000 description 6
- 238000004422 calculation algorithm Methods 0.000 description 4
- 230000008859 change Effects 0.000 description 4
- 238000001514 detection method Methods 0.000 description 4
- YMWUJEATGCHHMB-UHFFFAOYSA-N Dichloromethane Chemical compound ClCCl YMWUJEATGCHHMB-UHFFFAOYSA-N 0.000 description 3
- 230000003044 adaptive effect Effects 0.000 description 3
- 230000008901 benefit Effects 0.000 description 3
- 230000000694 effects Effects 0.000 description 3
- 230000006870 function Effects 0.000 description 3
- 238000012545 processing Methods 0.000 description 3
- 238000005070 sampling Methods 0.000 description 3
- 238000004458 analytical method Methods 0.000 description 2
- 239000004020 conductor Substances 0.000 description 2
- 239000010949 copper Substances 0.000 description 2
- 230000001419 dependent effect Effects 0.000 description 2
- 239000010931 gold Substances 0.000 description 2
- 230000003993 interaction Effects 0.000 description 2
- 238000010801 machine learning Methods 0.000 description 2
- 239000000463 material Substances 0.000 description 2
- 229910052751 metal Inorganic materials 0.000 description 2
- 239000002184 metal Substances 0.000 description 2
- 238000012544 monitoring process Methods 0.000 description 2
- 238000000513 principal component analysis Methods 0.000 description 2
- 230000001105 regulatory effect Effects 0.000 description 2
- 239000004065 semiconductor Substances 0.000 description 2
- 230000026683 transduction Effects 0.000 description 2
- 238000010361 transduction Methods 0.000 description 2
- 239000012855 volatile organic compound Substances 0.000 description 2
- 238000012935 Averaging Methods 0.000 description 1
- RYGMFSIKBFXOCR-UHFFFAOYSA-N Copper Chemical compound [Cu] RYGMFSIKBFXOCR-UHFFFAOYSA-N 0.000 description 1
- XUIMIQQOPSSXEZ-UHFFFAOYSA-N Silicon Chemical compound [Si] XUIMIQQOPSSXEZ-UHFFFAOYSA-N 0.000 description 1
- BQCADISMDOOEFD-UHFFFAOYSA-N Silver Chemical compound [Ag] BQCADISMDOOEFD-UHFFFAOYSA-N 0.000 description 1
- 229910052782 aluminium Inorganic materials 0.000 description 1
- XAGFODPZIPBFFR-UHFFFAOYSA-N aluminium Chemical compound [Al] XAGFODPZIPBFFR-UHFFFAOYSA-N 0.000 description 1
- 238000013528 artificial neural network Methods 0.000 description 1
- 239000000919 ceramic Substances 0.000 description 1
- 125000003636 chemical group Chemical group 0.000 description 1
- 229910052802 copper Inorganic materials 0.000 description 1
- 230000002596 correlated effect Effects 0.000 description 1
- 238000003066 decision tree Methods 0.000 description 1
- 238000013461 design Methods 0.000 description 1
- 238000003795 desorption Methods 0.000 description 1
- 238000004141 dimensional analysis Methods 0.000 description 1
- 230000003292 diminished effect Effects 0.000 description 1
- 230000005684 electric field Effects 0.000 description 1
- PCHJSUWPFVWCPO-UHFFFAOYSA-N gold Chemical compound [Au] PCHJSUWPFVWCPO-UHFFFAOYSA-N 0.000 description 1
- 229910052737 gold Inorganic materials 0.000 description 1
- 229930195733 hydrocarbon Natural products 0.000 description 1
- 150000002430 hydrocarbons Chemical class 0.000 description 1
- 238000007477 logistic regression Methods 0.000 description 1
- WSFSSNUMVMOOMR-NJFSPNSNSA-N methanone Chemical compound O=[14CH2] WSFSSNUMVMOOMR-NJFSPNSNSA-N 0.000 description 1
- 238000013488 ordinary least square regression Methods 0.000 description 1
- 230000008569 process Effects 0.000 description 1
- 239000011253 protective coating Substances 0.000 description 1
- 238000007637 random forest analysis Methods 0.000 description 1
- 230000009467 reduction Effects 0.000 description 1
- 229910052710 silicon Inorganic materials 0.000 description 1
- 239000010703 silicon Substances 0.000 description 1
- 229910052709 silver Inorganic materials 0.000 description 1
- 239000004332 silver Substances 0.000 description 1
- 238000001179 sorption measurement Methods 0.000 description 1
- 239000000126 substance Substances 0.000 description 1
- 238000012706 support-vector machine Methods 0.000 description 1
- 239000010409 thin film Substances 0.000 description 1
- 238000013024 troubleshooting Methods 0.000 description 1
- WFKWXMTUELFFGS-UHFFFAOYSA-N tungsten Chemical compound [W] WFKWXMTUELFFGS-UHFFFAOYSA-N 0.000 description 1
- 229910052721 tungsten Inorganic materials 0.000 description 1
- 239000010937 tungsten Substances 0.000 description 1
Images


Classifications
-
- G—PHYSICS
- G01—MEASURING; TESTING
- G01N—INVESTIGATING OR ANALYSING MATERIALS BY DETERMINING THEIR CHEMICAL OR PHYSICAL PROPERTIES
- G01N33/00—Investigating or analysing materials by specific methods not covered by groups G01N1/00 - G01N31/00
- G01N33/0004—Gaseous mixtures, e.g. polluted air
- G01N33/0006—Calibrating gas analysers
- G01N33/0008—Details concerning storage of calibration data, e.g. in EEPROM
-
- G—PHYSICS
- G01—MEASURING; TESTING
- G01N—INVESTIGATING OR ANALYSING MATERIALS BY DETERMINING THEIR CHEMICAL OR PHYSICAL PROPERTIES
- G01N33/00—Investigating or analysing materials by specific methods not covered by groups G01N1/00 - G01N31/00
- G01N33/0004—Gaseous mixtures, e.g. polluted air
- G01N33/0009—General constructional details of gas analysers, e.g. portable test equipment
- G01N33/0062—General constructional details of gas analysers, e.g. portable test equipment concerning the measuring method, e.g. intermittent, or the display, e.g. digital
- G01N2033/0068—General constructional details of gas analysers, e.g. portable test equipment concerning the measuring method, e.g. intermittent, or the display, e.g. digital using a computer specifically programmed
-
- G—PHYSICS
- G01—MEASURING; TESTING
- G01N—INVESTIGATING OR ANALYSING MATERIALS BY DETERMINING THEIR CHEMICAL OR PHYSICAL PROPERTIES
- G01N27/00—Investigating or analysing materials by the use of electric, electrochemical, or magnetic means
- G01N27/02—Investigating or analysing materials by the use of electric, electrochemical, or magnetic means by investigating impedance
- G01N27/04—Investigating or analysing materials by the use of electric, electrochemical, or magnetic means by investigating impedance by investigating resistance
- G01N27/12—Investigating or analysing materials by the use of electric, electrochemical, or magnetic means by investigating impedance by investigating resistance of a solid body in dependence upon absorption of a fluid; of a solid body in dependence upon reaction with a fluid, for detecting components in the fluid
-
- G—PHYSICS
- G01—MEASURING; TESTING
- G01N—INVESTIGATING OR ANALYSING MATERIALS BY DETERMINING THEIR CHEMICAL OR PHYSICAL PROPERTIES
- G01N27/00—Investigating or analysing materials by the use of electric, electrochemical, or magnetic means
- G01N27/02—Investigating or analysing materials by the use of electric, electrochemical, or magnetic means by investigating impedance
- G01N27/04—Investigating or analysing materials by the use of electric, electrochemical, or magnetic means by investigating impedance by investigating resistance
- G01N27/14—Investigating or analysing materials by the use of electric, electrochemical, or magnetic means by investigating impedance by investigating resistance of an electrically-heated body in dependence upon change of temperature
- G01N27/16—Investigating or analysing materials by the use of electric, electrochemical, or magnetic means by investigating impedance by investigating resistance of an electrically-heated body in dependence upon change of temperature caused by burning or catalytic oxidation of surrounding material to be tested, e.g. of gas
-
- G—PHYSICS
- G01—MEASURING; TESTING
- G01N—INVESTIGATING OR ANALYSING MATERIALS BY DETERMINING THEIR CHEMICAL OR PHYSICAL PROPERTIES
- G01N33/00—Investigating or analysing materials by specific methods not covered by groups G01N1/00 - G01N31/00
- G01N33/0004—Gaseous mixtures, e.g. polluted air
- G01N33/0006—Calibrating gas analysers
-
- Y—GENERAL TAGGING OF NEW TECHNOLOGICAL DEVELOPMENTS; GENERAL TAGGING OF CROSS-SECTIONAL TECHNOLOGIES SPANNING OVER SEVERAL SECTIONS OF THE IPC; TECHNICAL SUBJECTS COVERED BY FORMER USPC CROSS-REFERENCE ART COLLECTIONS [XRACs] AND DIGESTS
- Y10—TECHNICAL SUBJECTS COVERED BY FORMER USPC
- Y10S—TECHNICAL SUBJECTS COVERED BY FORMER USPC CROSS-REFERENCE ART COLLECTIONS [XRACs] AND DIGESTS
- Y10S435/00—Chemistry: molecular biology and microbiology
- Y10S435/807—Gas detection apparatus
Definitions
- the present invention relates generally to a sensing system, and, in particular embodiments, to gas sensing system structures and the methods of operation thereof.
- Sensing systems including sensor devices such as resistive gas sensors can detect the presence of target analytes in an ambient environment. It may be important to design sensor devices with the ability to output detection events in real-time with high sensitivity. Sensor devices may also be designed for high accuracy and specificity with respect to a target analyte or group of target analytes. In the specific case of resistive gas sensors, detection events may be based on the change in resistance or capacitance of a semiconducting thin-film structure that is influenced by the adsorption of gas molecules.
- the influence of external environmental factors on the sensor device may also increase.
- environmental factors may include temperature, humidity, composition and concentration of species in the ambient atmosphere, and electromagnetic interference, among others.
- High sensitivity to external environmental factors may decrease sensor accuracy. Therefore, sensor devices which compensate for external environmental influences may be desirable in order to provide both high sensitivity and high accuracy.
- a method of sensing includes obtaining first sensor data points by a sensor, obtaining first reference data points, and determining a correlation between the first sensor data points and the first reference data points.
- the method of sensing further includes measuring second sensor data points by the sensor, obtaining second reference data points, and adjusting the second sensor data points using the correlation and the second reference data points to obtain corrected sensor data points.
- the method of sensing also includes determining sensed values from the corrected sensor data points and storing the sensed values.
- a method of sensing includes obtaining first sensor data points by a sensor and obtaining first reference data points. Obtaining the first sensor data points and the first reference data points is performed during a first time interval. The method of sensing further includes measuring second sensor data points by the sensor and generating corrected second sensor data points by correcting for baseline variation in the second sensor data points using a relationship between the first sensor data points and the first reference data points. The measuring the second sensor data points and generating the corrected second sensor data points is performed after the first time interval during a second time interval. The method of sensing also includes determining sensed values from the corrected second sensor data points.
- a sensor device in accordance with still another embodiment of the invention, includes a gas sensor disposed on a first substrate.
- the gas sensor is configured to measure first sensor data points and second sensor data points.
- a heating element is disposed within the first substrate. The gas sensor overlaps the heating element.
- a processor is operatively coupled to the gas sensor and the heating element.
- the sensor device also includes a memory storing a program to be executed by the processor.
- the program includes instructions for recording first resistance values and second resistance values of the heating element.
- the program also includes instructions for adjusting the second sensor data points using the first sensor data points, the first resistance values, and the second resistance values to obtain corrected sensor data points.
- the program further includes instructions for determining sensed values from the corrected sensor data points.
- FIG. 1 illustrates a method of sensing and a sensing system in accordance with an embodiment of the invention where FIG. 1A illustrates the method of sensing and FIG. 1.13 illustrates the sensing system;
- FIG. 2 illustrates another method of sensing in which baseline variation is corrected based on correlation with reference data points in accordance with an embodiment of the invention
- FIG. 3 illustrates still another method of sensing in which baseline variation is corrected based on correlation with reference data points in accordance with an embodiment of the invention
- FIG. 4 illustrates a method of preprocessing sensing data in accordance with an embodiment of the invention
- FIG. 5 illustrates another method of preprocessing sensing data in accordance with an embodiment of the invention
- FIG. 6 illustrates a method of adjusting a baseline to correct baseline variation and normalizing sensor data points in accordance with an embodiment of the invention
- FIG. 7 illustrates an example sensor device including a substrate, a heating element, and a sensor in accordance with an embodiment of the invention
- FIG. 8 illustrates an example sensor device including a substrate, a heating element, a sensor, and an environmental sensor in accordance with an embodiment of the invention
- FIG. 9 illustrates an example sensor device including a substrate, a heating element, a sensor, and a reference sensor in accordance with an embodiment of the invention
- FIG. 10 illustrates an example sensor device including a substrate, a heating element, a sensor, an environmental sensor, and a reference sensor where the environmental sensor is located on the substrate in accordance with an embodiment of the invention
- FIG. 11 illustrates another example sensor device including a substrate, a heating element, a sensor, an environmental sensor, and a reference sensor where the environmental sensor is located on a second substrate in accordance with an embodiment of the invention
- FIG. 12 illustrates a top view of an example sensor device including multiple sensors and a reference sensor in accordance with an embodiment of the invention
- FIG. 13 illustrates a top view of an example sensor device including multiple sensors and multiple reference sensors in accordance with an embodiment of the invention
- FIG. 14 illustrates a top view of an example sensor device including multiple pairs of a sensor and a reference sensor in accordance with an embodiment of the invention
- FIG. 15 illustrates a top view of an example sensor device including multiple pairs of a sensor and a reference sensor and further including an environmental sensor in accordance with an embodiment of the invention
- FIG. 16 illustrates a top view of an example sensor device including multiple sensors, an environmental sensor, and a reference sensor where the environmental sensor is located on a second substrate in accordance with an embodiment of the invention
- FIG. 17 illustrates a top view of an example sensor device including multiple sensors, and environmental sensor, and multiple reference sensors where the environmental sensor is located on a second substrate in accordance with an embodiment of the invention
- FIG. 18 illustrates a top view of an example sensor device including multiple pairs of a sensor and a reference sensor and further including an environmental sensor where the environmental sensor is located on a second substrate in accordance with an embodiment of the invention
- FIG. 19 illustrates qualitative graphs of sensor resistance versus time and heating element resistance versus time with baseline variation due to sensor drift
- FIG. 19A illustrates resistance responses of a sensor and a heating element before correcting the baseline variation
- FIG. 19B illustrates resistance responses of the sensor and the heating element after correcting the baseline variation
- FIG. 20 illustrates qualitative graphs of sensor resistance versus time with baseline variation due to sensor drift over multiple correction intervals where FIG. 20A illustrates resistance responses of a sensor before correcting the baseline variation and FIG. 20B illustrates resistance responses of the sensor after correcting the baseline variation.
- Sensing systems may be designed to detect quantities of a target analyte by determining the deviation of a measured value from a baseline value.
- electrical resistance of a sensor may be used as a measured value to detect target gases.
- the baseline or reference resistance may be on the order of 1 k ⁇ , for example, when no target gases are present.
- Target gases may then be sensed by evaluating deviations of the sensor resistance from the value of 1 k ⁇ .
- external factors that are unrelated to the target gas such as environmental factors may affect the sensor. These external factors may cause the baseline value to vary over time which may negatively impact the accuracy of the sensing system. Therefore, a sensing system that corrects for baseline variation may be advantageous.
- a sensing system includes a sensor device configured to correct for baseline variation by processing sensing data according to an algorithm to correlate sensor output with reference measurements.
- the algorithm may include the steps of obtaining sensor data points and reference data points, determining a correlation between the sensor data points and the reference data points, and adjusting the sensor data points to correct for baseline variation.
- the sensor device may be a gas sensor in various embodiments and is a graphene-based resistive gas sensor in one embodiment.
- the baseline variation may be caused by environmental factors such as temperature and/or humidity.
- the sensor device may advantageously enable higher sensitivity by correcting for baseline variation caused by external environmental factors.
- baseline variation may be a time-varying change in the baseline of a sensor and may be referred to as sensor drift in some implementations.
- the contribution to the signal caused by baseline variation may be diminished or removed entirely in various embodiments which may advantageously enable higher sensitivity to target analytes.
- the correction of baseline variation may beneficially enable accurate detection of low concentrations of gas molecules on the scale of parts-per-million (ppm), parts-per-billion (ppb), or lower.
- the sensor device may also have the benefit of correcting for baseline variation without requiring that the sensor device operate at a specific temperature value.
- the sensor device may operate at any temperature and baseline variation due to temperature fluctuation may be corrected.
- Another possible benefit of the sensor device may be that materials that are sensitive to environmental factors such as graphene may be used in the structure of the sensor device.
- a conventional sensor device without correction for baseline variation may be designed to be very insensitive to the environment which may limit possible materials, structure, and performance of the conventional sensor device.
- the sensor device may also advantageously perform adaptive corrections for baseline variation.
- Adaptive correction may include correlating changes in the baseline with the cause of baseline variation in real-time or near-real-time which may result in more accurate correction for baseline variation.
- the effects of the environment on the baseline of a sensor device may vary over time and may not be known prior to the sensing events.
- Adaptive corrections for baseline variation may determine correlations immediately before performing corrections which may improve accuracy of the corrections as well as being applicable to many different sensing environments.
- Embodiments provided below describe various structures and methods of operating sensing systems, and in particular, sensing systems that compensate for baseline variation. The following description describes the embodiments.
- Several embodiment methods of sensing are described using FIGS. 1-3 .
- Two embodiment methods of preprocessing data are described using FIGS. 4 and 5 .
- An embodiment method of adjusting a baseline and normalizing data points is described using FIG. 6 .
- Various embodiment sensor devices which may be included in sensing system implementations are described using FIGS. 7-18 .
- Qualitative graphs of two baseline correction scenarios are described using FIGS. 19 and 20 .
- FIG. 1 illustrates a method of sensing and a sensing system in accordance with an embodiment of the invention where FIG. 1A illustrates the method of sensing and FIG. 1B illustrates the sensing system.
- a method 100 of sensing includes the following steps which may be performed by a sensing system 105 .
- Step 101 includes obtaining sensing data and may be performed by a sensing array 90 .
- the step of obtaining sensing data may take various forms ranging from recording a single data point at an instant in time from a single sensor to recording multiple data points from a sensor array over a period time.
- step 101 includes obtaining sensing data by recording a single data point from a sensor and recording a single reference point from a reference sensor at an instant in time.
- step 101 includes obtaining sensing data by recording four data points per second from each sensor in a sensor array and also from an environmental sensor over a period of ten seconds.
- Other variations may be apparent to those of ordinary skill in the art and may depend on a specific implementation of a sensor device.
- the sensing array 90 may include only a single sensor or may include multiple sensors and types of sensors.
- sensor array 90 includes a sensing sensor 92 and a reference sensor 93 .
- the reference sensor 93 may be used to determine appropriate baseline values for sensing sensor 92 .
- Step 102 includes preprocessing the sensing data.
- the step of preprocessing the sensing data may include processing steps that prepare the sensing data to be interpreted as sensing events. For example, if a sensor device includes multiple sensors in a sensor array, an averaging step may be performed while preprocessing the sensing data. As another example, preprocessing the sensor data may include detecting and removing outliers in the sensing data. Other possible preprocessing steps may include determining a baseline, correcting a baseline, normalizing data points, combining multiple types of data points, multiplying by scalar factors, removing data points from the beginning or end of a data set, and the like.
- Step 103 includes post processing the sensing data.
- the sensing data may include sensing events in the form of peaks or other identifiable features.
- the sensing events may be identified using criteria specific to the sensor implementation and sensed values may be determined from the sensing events.
- the processing steps 102 and 103 may be performed locally by a processor within a sensor device such as an application-specific integrated circuit (ASIC), a field-programmable gate array (FPGA), or a general purpose processor coupled to a memory storing a program, as examples.
- steps 102 and 103 may be performed externally by a computer that is connected to the sensor device such as a desktop computer, laptop computer, server, tablet computer, smart phone, and the like.
- Steps 102 and 103 may be performed by a processor 94 .
- the processor may be operatively coupled to sensing array 90 as well as a memory 95 .
- memory 95 may be used to store information obtained by preprocessing and post processing the sensing data.
- Memory 95 may also be used to store computer instructions that, when executed by processor 94 , may perform steps 102 and 103 among others.
- Memory 95 may be a non-volatile computer-readable storage medium such as a computer hard drive, random access memory, and the like.
- Step 104 includes outputting the sensed values in a format understandable by a user or a connected device.
- Step 104 may be performed by a display 91 operatively coupled to sensing array 90 , processor 94 , and memory 95 .
- the sensed values may be output to a digital display or formatted in a data file and stored on a computer-readable storage medium.
- the sensed values may be output as a concentration such as parts-per-million (ppm) or parts-per-billion (ppb) to communicate a concentration of a sensed gas in an ambient environment.
- ppm parts-per-million
- ppb parts-per-billion
- FIG. 2 illustrates another method of sensing in which baseline variation is corrected based on correlation with reference data points in accordance with an embodiment of the invention.
- a method 200 of sensing includes the following steps.
- Step 211 includes obtaining sensor data points and step 221 includes obtaining reference data points.
- Steps 211 and 221 may be executed at the same time or at different times.
- steps 211 and 221 are part of a step 101 of obtaining sensing data such as previously described in reference to FIG. 1 .
- Sensor data points may be obtained by recording measurements from sensors configured to respond to sensing events.
- Reference data points may be obtained by recording measurements from reference sensors that are configured to be used as a reference or that have an identifiable trait that may be used as a reference.
- a gas sensing system may comprise one reference sensor for providing the reference data and a plurality of sensors for measuring different type of target analytes so as to generate sensor data.
- the sensor data may comprise detected concentration for each target analyte that is being measured.
- Step 212 includes determining a correlation between the sensor data points and the reference data points.
- the correlation may be determined by comparing the sensor data points and reference data points.
- the existence of a correlation between the sensor data points and the reference data points may indicate the existence of an external influence that is unrelated to target analyte of the sensor.
- the sensor data points may be obtained from a sensor that is sensitive to the presence of a target analyte while the reference data points may be obtained from a reference sensor that is not affected by the presence of the target analyte.
- a correlation between the sensor data points and the reference data points may then indicate that influences unrelated to the target analyte affect the sensor and the reference sensor in a similar manner.
- the reference data points may be measurements from an environmental sensor.
- the output of the environmental sensor may be chosen to be unrelated to the sensing target.
- the environmental sensor may measure an environmental factor (e.g., temperature, humidity, pressure, and others) that is known to affect the performance of the sensing sensor.
- the environmental sensor may be a temperature sensor, a humidity sensor, or a pressure sensor, for example. In this way a correlation between the environmental factor and the sensor response of the sensing sensor can be determined by using the correlation between the sensor data points and the reference data points.
- the reference data points may be measurements from a structural reference sensor that has a similar structure as a sensing sensor, but is unresponsive to the sensing target. Since the output of the structural reference sensor is not affected by the sensing target, a correlation between the sensor output and the structural reference sensor output may be related to an external influence, which contributes to baseline variation. In some embodiments, the reference data points may be obtained from a combination of environmental sensor and structural reference sensor measurements.
- Step 222 includes adjusting the sensor data points to correct for baseline variation.
- the sensor data points may reflect a sensor output with a constant baseline.
- an equation relating the correlation and the reference points to baseline values may be used to obtain a correction for each sensor data point.
- Possible equations include linear regression, multiple regression, n th order polynomial fitting such as quadratic, cubic, quartic, etc., logarithmic fitting, and exponential fitting, as examples.
- the baseline used as a reference by the sensor data points is made constant using the reference data points. That is, background noise and/or baseline variation in the signal caused by external effects may be significantly reduced or removed from the sensor data points.
- Step 232 includes normalizing the sensor data points.
- the measured sensor response resulting in the set of sensor data points may need to be dimensionless to facilitate accurate post processing.
- the sensor data points may be represented as a percentage or a ratio rather than in specific units of measure.
- step 232 is optional and may be omitted depending on specific post processing implementations.
- steps 212 , 222 , and 232 are part of a step 102 of preprocessing the sensing data such as previously described in reference to FIG. 1 .
- Steps 211 , 221 , 212 , 222 , and 232 may be repeated for a first period of time t 1 .
- first period of time t 1 may be referred to as a sampling time.
- step 213 includes identifying and extracting features from the sensor data points.
- a feature may be identified by determining that a value exceeds a predetermined threshold.
- the beginning and end of a feature may be identified by determining that a rate of change of the sensing data crosses a predetermined threshold.
- regions of interest may also be identified.
- feature may be considered synonymous with region of interest, but this may depend on specific sensing implementations.
- the identification of regions of interest and/or features may include complex analysis of the shape of a curve defined by the sensing data. Following identification, the regions of interest and/or features may be extracted by removing remaining data points.
- Step 223 includes classifying the extracted features using a set of predetermined criteria.
- Classification of the extracted features may be used to determine the most important features and/or remove features that do not contain sensing information. For example, removal of features may be performed in a dimensional reduction step. A set of features may be reduced to the most important features using dimensional analysis methods such as principal component analysis (PCA), Kernel PCA, linear discriminant analysis (LDA), Random forests, etc.
- PCA principal component analysis
- Kernel PCA Kernel PCA
- LDA linear discriminant analysis
- Random forests etc.
- Classification of the extracted features may be performed using a standard machine learning algorithm such as Na ⁇ ve Bayes, logistic regression, decision trees, support vector machines, neural networks, K-nearest neighbors, etc. Once classified, the data can be cross referenced with stored calibration values (such as a look-up table) to extract sensed values.
- step 233 includes determining sensed values from the classified features.
- steps 213 , 223 , and 233 are part of a step 103 of post processing the sensing data such as previously described in reference to FIG. 1 .
- Step 104 includes outputting sensed values and is as previously described.
- FIG. 3 illustrates still another method of sensing in which baseline variation is corrected based on correlation with reference data points in accordance with an embodiment of the invention.
- the method 300 of sensing includes the following steps.
- Step 211 includes obtaining sensor data points and step 221 includes obtaining reference data points and may be as previously described with respect to FIG. 2 .
- steps 211 and 221 may be part of a step 101 of obtaining sensing data that may be repeated for a second period of time t 2 before the sensing data is processed in subsequent steps.
- the second period of time t 2 may be referred to as a sampling time.
- Step 212 includes determining a correlation between the sensor data points and the reference data points and may be part of a step 102 of preprocessing the sensing data that has been obtained in step 101 .
- Method 300 differs from method 200 in that the step 212 of determining the correlation is performed after the second period of time t 2 has passed rather than multiple times over a first period of time t 1 , as in method 200 .
- Step 301 includes a step 311 of obtaining additional sensor data points and a step 321 of obtaining additional reference data points similar to steps 211 and 221 as previously described.
- step 212 may then be used in conjunction with the additional sensing data for adjusting the additional sensor data points to correct for baseline variation in step 222 .
- An optional step 232 includes normalizing the additional sensor data points. Steps 222 and 232 of method 300 are similar to corresponding steps in method 200 and may be part of a step 302 of preprocessing additional sensing data.
- Step 103 of post processing data and a step 104 of outputting sensed values is performed.
- Steps 103 and 104 may be as previously described.
- Steps 301 , 302 , 103 and 104 may be repeated for a third period of time t 3 during which the same correlation that is determined in step 212 may be used to correct any number of additional sensing data sets.
- step 301 may be repeated for a sampling time similar to step 101 .
- a sensing system may acquire new data in steps 101 or 301 at the same time as previously acquired data is being processed in steps 102 , 302 , and/or 103 .
- output values may be display in step 104 while new sensing data sets are being obtained and processed.
- a first sensing data set is used to determine the correlation and subsequent sensing data sets are corrected using the correlation and the optionally normalized. For example, in one scenario, no sensing events may take place during the second period of time L. This may advantageously improve the accuracy of the correlation that is determined between the sensor data points and the reference data points.
- sensing system may output sensed values that are adjusted to correct for baseline variation using the correlation determined from sensing data with no detection events.
- step 305 of beginning the process anew at step 101 may be performed.
- step 305 may be performed after determining that the sensed values that are output in step 104 have been below a threshold for a predetermined amount of time.
- step 305 may be performed when the number of sensing events identified in step 103 is below a predetermined threshold.
- second time t 2 may be 10 seconds
- third period of time t 3 may be 30 seconds
- step 305 may be performed after each expiration of the third period of time t 3 .
- a correlation is determined every 40 seconds after 10 seconds of obtaining sensing data. The correlation is then used to correct for baseline variation on additional sensing data that is continuously gathered for 30 seconds.
- sensed values are output for 75% of every cycle.
- sensor system may be refreshed to improve the sensing accuracy during the 75% uptime.
- Any combination of values of the second and third period of time t 2 and t 3 is possible and may be chosen based on a potential tradeoff between accuracy of the correction to the baseline variation and the desired uptime of the sensor.
- the values of the second and third periods of time t 2 and t 3 may be dynamic or manually adjustable.
- the third period of time t 3 may extend until a predetermined amount of time without a sensing event has passed. Step 305 and optional step 306 may then be performed.
- the sensing data points and reference data points obtained during the time without a sensing event may be used in step 212 to determine a new correlation.
- sensor downtime may be advantageously reduced by only determining coefficients when no sensor events are occurring.
- step 101 may be omitted when performing step 305 which is shown as a dotted arrow 306 proceeding directly to step 102 .
- the criteria to perform step 305 may coincide with the criteria to use a set of sensing data in step 212 enabling step 101 to be omitted in some or all iterations of method 300 .
- FIG. 4 illustrates a method of preprocessing sensing data in accordance with an embodiment of the invention.
- a method 400 of preprocessing sensing data includes a step 412 of determining correlation coefficients using regression analysis.
- the regression analysis may be any suitable method in which a relationship between a dependent variable and one or more in independent variables. Possible regression analysis methods may include linear regression, ordinary least squares regression, polynomial regression, nonlinear regression, and the like. In one embodiment, the regression analysis used in step 412 is simple linear regression.
- a sensing system may include a sensor with resistance R S that is sensitive to fluctuations in temperature.
- the sensing system may include a heating element with a resistance R H that is variable in time t. The temperature of the heating element may depend on the heating element resistance R H .
- a set of sensor data points R S and a set of reference data points R H may be obtained over a period of time t 0 ⁇ t ⁇ t f .
- Correlation coefficients C 0 and C 1 may then be determined from the first order polynomial equation below.
- R S ( t ) C 1 R H ( t )+ C 0
- a sensing system may include a sensor with resistance R S that is sensitive to fluctuations in temperature.
- the sensing system may also include a heating element driven by a current that is regulated using a closed loop control such as pulse-width modulation (PWM) modes or proportional-integral-derivative (PID) control.
- PWM pulse-width modulation
- PID proportional-integral-derivative
- the sensing system may also include a temperature sensor located near the sensor that measures the ambient temperature T. Since the current through the heating element is regulated, the baseline variation of the sensor may be primarily caused by fluctuations in ambient temperature.
- a set of sensor data points R S and a set of reference data points T may be obtained over a period of time t 0 ⁇ t ⁇ t f .
- Correlation coefficients C 0 and C 1 may then be determined from the first order polynomial equation below.
- R S ( t ) C 1 T ( t )+ C 0
- a sensing system may include a sensor with resistance R S that is sensitive to fluctuations in temperature and humidity.
- the sensing system may also include a heating element, a humidity sensor, and an array of temperature sensors located near both the heating element and the sensor.
- the array of temperature sensors may measure the temperature T at the sensor and the humidity sensor may measure the humidity R H at the sensor.
- a set of sensor data points R S and two sets of reference data points T, RH may be obtained over a period of time t 0 ⁇ t ⁇ t f .
- Correlation coefficients C 0 , C 1 , and C 2 may then be determined from the equation below.
- R S ( t ) C 2 RH ( t )+ C 1 T ( t )+ C 0
- the regression analysis used in step 412 is polynomial regression.
- regression analysis may be replaced with machine learning algorithms.
- step 412 may be performed for each sensor in an array of sensors resulting in a set of correlation coefficients for each sensor.
- step 412 may be performed using the average output of a sensor array or for the average output of subsets of a sensor array.
- the correlation coefficients may be stored in a computer-readable memory for future use in an optional step 442 .
- the correlation coefficients may be determined immediately prior to every use and not stored in a memory.
- the correlation coefficients that are stored in step 442 may overwrite previously stored correlation coefficients and/or may be appended to a history of stored correlation coefficients.
- the history of correlation coefficients may be used to ensure that the new correlation coefficients are reasonable and for potential troubleshooting of the sensor.
- the steps 412 and 442 may be part of a step 102 of preprocessing the sensing data as previously described.
- FIG. 5 illustrates another method of preprocessing sensing data in accordance with an embodiment of the invention.
- a method 500 of preprocessing sensing data includes a step 412 of determining correlation coefficients using regression analysis and a step 442 which may be a previously described with respect to FIG. 4 .
- method 500 includes a step 522 of quantifying the correlation between the sensor data points and the reference data points after step 412 .
- the quantity determined in step 522 may be a coefficient of determination R 2 .
- the coefficient of determination R 2 may be used as an indicator of the level of correlation between the sensor data points and the reference data points. Other indicators such as the square of the Pearson correlation coefficient may also be used and may be apparent to those of ordinary skill in the aft.
- Step 532 includes a branching step that determines if the quantity determined in step 522 is higher than a predetermined threshold.
- a sensing system may exhibit desired performance using the correlation coefficients determined in step 412 when the coefficient of determination R 2 is above 0.91.
- the predetermined threshold for step 522 may be 0.91.
- the correlation coefficients are stored in memory in step 442 . If the coefficient of determination R 2 is less than or equal to 0.91, a step 552 is performed which does not store the new correlation coefficients in memory and which continues on to a later step. In this way, an older set of correlation coefficients which meet the required correlation may be used instead of new set that is not sufficiently correlated.
- the steps 412 , 522 , 532 , 552 , and 442 may be part of a step 102 of preprocessing the sensing data as previously described.
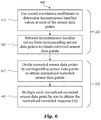
- FIG. 6 illustrates a method of adjusting a baseline to correct baseline variation and normalizing sensor data points in accordance with an embodiment of the invention. The method illustrated in FIG. 6 may be incorporated as appropriate into the methods of any of the previously described embodiments.
- a method 600 of adjusting a baseline to correct baseline variation and normalizing sensor data points includes a step 612 of using stored correlation coefficients to determine instantaneous baseline values at each of the sensor data points.
- an equation is used to determine a set of correlation coefficients C 0 and C 1 .
- the same equation may be used to determine the instantaneous baseline values R S,baseline (t) for each time t using the stored correlation coefficients C 0 and C 1 and a new reference data point R H,new (t) corresponding to each new sensor data point R S,new (t) as shown below.
- R S,baseline ( t ) C 1 R H,new ( t )+ C 0
- any equation that is used in determining a set correlation coefficients such as in step 412 may be used in conjunction with the set of correlation coefficients and new reference data points to determine a set of instantaneous baseline values in step 612 .
- the step 622 includes subtracting instantaneous baseline values R S,baseline (t) from corresponding new sensor data points R S,new (t) to obtain corrected sensor data points R S,corrected (t).
- Steps 612 and 622 may be part of a step 222 of adjusting sensor data points to correct for baseline variation which may be as previously described.
- the corrected sensor data points may optionally be normalized in step 632 and represented as a relative percentage in step 642 .
- Steps 632 and 642 may be part of a step 232 of normalizing sensor data points which may be as previously described.
- Step 632 includes dividing the corrected sensor data points R S,corrected (t) by corresponding new sensor data points R S,new (t) and results in normalized corrected sensor data points. Additionally, step 642 includes multiplying each normalized corrected sensor data point by 100 to obtain a set of normalized corrected sensor data points represented as a relative percentage R S,normalized (t). The set of normalized corrected sensor data points may be referred to as a normalized corrected response.
- An equation using the scenario of the above example is given below.
- step 642 may be omitted and the normalized corrected sensor data points may be represented as a relative ratio.
- steps 632 and 642 may be omitted and the corrected sensor data points may be post processed.
- method 600 as described in reference to FIG. 6 includes steps 222 and 232 which are also described in reference to FIGS. 2 and 3 . Therefore, steps 222 and 232 as described in method 600 may be incorporated into methods 200 and 300 and so on.
- FIGS. 7-18 illustrate various sensor devices which may be included in implementations of sensing systems that are configured to perform the methods described in reference to FIGS. 1-6 . All similarly numbered elements in FIGS. 7-18 refer to like elements between the various embodiments.
- FIG. 7 illustrates an example sensor device including a substrate, a heating element, and a sensor in accordance with an embodiment of the invention.
- a sensor device 700 includes a sensor 30 disposed on a substrate 10 .
- the sensor 30 may be any suitable type of sensor such as a chemical sensor configured to detect a target analyte or group of target analytes.
- the sensor 30 is a gas sensor.
- the gas sensor is a resistive gas sensor, and in one embodiment, sensor 30 is a graphene-based resistive gas sensor.
- the graphene-based resistive gas sensor may generate sensing events by monitoring the change in resistance of one or more sheets of graphene, which is modulated by gas molecules being adsorbed and desorbed from the surface of the graphene.
- the sensor resistance may decrease when adsorbed gas species provide donor electrons to the graphene surface. Alternatively, the resistance may decrease when adsorbed gas species draw electrons away from the path of conduction.
- the transduction method for the graphene-based gas sensor may also be different in various embodiments.
- sensor 30 may be a capacitive gas sensor and is a graphene-based capacitive gas sensor in one embodiment.
- Other possible transduction methods include work function monitoring, inversion n-type to p-type and may be apparent to those of ordinary skill in the aft.
- Sensor 30 may be configured to have selectivity towards a target analyte.
- sensor 30 may selectively sense concentrations of volatile organic compounds (VOCs) in the ambient atmosphere.
- VOCs volatile organic compounds
- sensor 30 may be configured to sense volatile gases such as hydrocarbons, methylene chloride, formaldehyde, and the like.
- the sensor 30 may be sensitive to one or more environmental factors that affect the baseline of the sensor 30 .
- environmental factors may include fluctuations in temperature, humidity, pressure, electric field, magnetic field, composition of the ambient atmosphere, concentration of species in the ambient atmosphere, and the like.
- fluctuations in temperature may affect the performance of the sensor 30 .
- the sensor 30 may be suspended between two or more electrodes 34 .
- the electrodes 34 may include a conductive material and may be a patterned metal in various embodiments.
- the electrodes 34 may include copper (Cu), silver (Ag), gold (Au), aluminum (Al), tungsten (W), and the like.
- the senor 30 may also include surface modifications 32 .
- the surface modifications 32 may be chemical groups attached to the surface of sensor 30 to increase the sensitivity of sensor 30 to target analytes and/or reduce the sensitivity of sensor 30 to environmental factors or species other than target analytes.
- the surface modifications 32 may be a protective coating and may cover all or most of the sensor 30 .
- the substrate 10 may be any suitable substrate.
- substrate 10 is a laminate substrate and is a printed circuit board in one embodiment.
- substrate 10 is a semiconductor substrate and is part of a monolithic integrated circuit chip including sensor 30 .
- substrate 10 is a silicon substrate and sensor 30 is included in an integrated circuit.
- substrate 10 is a ceramic substrate.
- Substrate 10 may also be a metallic substrate or include a metallic substrate.
- substrate 10 may be packaged to form a sensor package including sensor 30 .
- a heating element 20 may be included on or within substrate 20 .
- the heating element 20 may heat the sensor 30 and sensor device 700 in order to maintain an optimal operating temperature or range of operating temperatures.
- the heating element 20 may heat the sensor 30 to 200° C. in one embodiment.
- the heating element 20 may heat the sensor 30 to 400° C.
- the temperature may need to be elevated to facilitate desorption of gas molecules for continued sensing.
- refresh cycles may be used to heat the sensor 30 to a temperature well above the normal operating temperature in order to remove all species from the surface of sensor 30 before beginning a new data acquisition period.
- the heating element 20 may also be used as a reference for baseline variation of sensor 30 .
- the resistance of heating element 20 may be recorded periodically during data acquisition periods and used as reference data points when correcting for baseline variation of sensor 30 .
- the heating element 20 may be a metal conductor in one embodiment. In other embodiments, the heating element 20 may be a microelectromechanical systems (MEMS) heater integrated into a semiconductor substrate. The heating element 20 and/or sensor 30 may also be suspended over an opening in substrate 10 . This may facilitate increased interaction with the ambient atmosphere as well as reduce heat loss in the heating element 20 .
- MEMS microelectromechanical systems
- FIG. 8 illustrates an example sensor device including a substrate, a heating element, a sensor, and an environmental sensor in accordance with an embodiment of the invention.
- a sensor device 800 includes a sensor 30 and a heating element 20 attached to a substrate 10 as previously described.
- sensor device 800 also includes an environmental sensor 40 .
- the environmental sensor 40 may be a temperature sensor, humidity sensor, pressure sensor, and the like.
- the environmental sensor 40 may be configured to measure reference data points to for use in correcting the baseline variation of sensor 30 as described in previous methods.
- FIG. 9 illustrates an example sensor device including a substrate, a heating element, a sensor, and a structural reference sensor in accordance with an embodiment of the invention.
- a sensor device 900 includes a sensor 30 and a heating element 20 attached to a substrate 10 as previously described. Instead of the environmental sensor 40 included in sensor device 800 , sensor device 900 includes a structural reference sensor 50 .
- the structural reference sensor 50 may be sufficiently similar in structure or function to sensor 30 so as to provide reference data points for use in correcting the baseline variation of sensor 30 .
- sensor 30 and structural reference sensor 50 may both be graphene-based resistive gas sensors, but structural reference sensor 50 may not include surface modifications 32 .
- the surface of sensor 30 is bare graphene and the surface of structural reference sensor 50 is coated or otherwise modified to be unresponsive to the target analyte of sensor 30 . In this way, the contribution of the sensing target may be removed from the signal of the structural reference sensor 50 and only the effects of environmental factors remain. Significant correlation between the sensor 30 and the structural reference sensor 50 may then be primarily caused by environmental factors and reflect baseline variation in both sensors.
- FIG. 10 illustrates an example sensor device including a substrate, a heating element, a sensor, an environmental sensor, and a reference sensor where the environmental sensor is located on the substrate in accordance with an embodiment of the invention.
- a sensor device no includes a sensor 30 , an environmental sensor 40 , a reference sensor 50 , and a heating element 20 attached to a substrate 10 . Any combination of the heating element 20 , environmental sensor 40 , and structural reference sensor 50 may be used to obtain reference data points to correct for baseline variation of sensor 30 .
- FIG. 11 illustrates another example sensor device including a substrate, a heating element, a sensor, an environmental sensor, and a structural reference sensor where the environmental sensor is located on a second substrate in accordance with an embodiment of the invention.
- a sensor device in includes a sensor 30 , a structural reference sensor 50 , and a heating element attached to a substrate 10 as previously described.
- sensor device in differs from sensor device no in that an included environmental sensor 40 is attached to a second substrate 12 rather than substrate 10 .
- the substrate 10 is operatively coupled to the second substrate 12 and both are contained in a package 60 .
- the second substrate 12 may include a processor such as an application-specific integrated circuit (ASIC) or a field-programmable gate array (FPGA).
- the processor may be configured to perform any of the method steps as described in previous embodiments such as obtaining sensing data, preprocessing the sensing data, post processing the sensing data, and outputting sensed values.
- the substrate 10 and the second substrate 12 may be rigidly attached to the package 60 . However, in some embodiments, the substrate 10 and the second substrate 12 may be elastically attached to the package 60 .
- the package 60 includes an opening 70 which facilitates interactions of sensor 30 , environmental sensor 40 , and reference sensor 50 with the ambient environment. It should be noted that although package 60 and opening 70 are only illustrated in FIG. 11 , package 60 and opening 70 may be included in all embodiment sensor device described herein and apparent to those of ordinary skill in the art.
- FIG. 12 illustrates a top view of an example sensor device including multiple sensors and a reference sensor in accordance with an embodiment of the invention.
- a sensor device 112 includes multiple sensors 30 and a centrally located structural reference sensor 50 attached to a substrate 10 .
- a heating element 20 is also included on or within substrate 10 which provides heat to the sensors 30 and structural reference sensor 50 .
- eight sensors 30 form and array of sensors 30 and a single structural reference sensor 50 is included in the center of a box arrangement of sensors 30 .
- any arrangement of multiple sensors 30 and a structural reference sensor 50 is possible.
- a 5 ⁇ 5 array of sensors 30 may be located on the left side of substrate 10 while a structural reference sensor 50 is located on the right side.
- the number and arrangement of sensors 30 and structural reference sensor 50 may depend on specific application and is not limited to exactly the patterns illustrated in this or other embodiments.
- FIG. 13 illustrates a top view of an example sensor device including multiple sensors and multiple reference sensors in accordance with an embodiment of the invention.
- a sensor device 113 includes multiple sensors 30 arranged in an array in a central region of a substrate 10 and four structural reference sensors 50 located in respective corner regions of the substrate 10 .
- the four structural reference sensors 50 may be averaged for use in determining correlation coefficients or a multiple regression may be used with four dependent variables as previously described.
- the heating element may also be used as a reference.
- FIG. 14 illustrates a top view of an example sensor device including multiple pairs of a sensor and a reference sensor in accordance with an embodiment of the invention.
- a sensor device 114 includes multiple pairs of a sensor 30 and a structural reference sensor 50 arranged in an array on a substrate 10 .
- the substrate 10 also includes a heating element 20 as previously described.
- a structural reference sensor 50 may be used to correct the baseline variation for each corresponding sensor 30 . This may be useful if there is variation between sensors 30 over the substrate 10 or if there are multiple types of sensor 30 on the same substrate 10 . Additionally, the corrected sensor data from each sensor 30 may be treated individually or averaged before post processing depending on specific application.
- FIG. 15 illustrates a top view of an example sensor device including multiple pairs of a sensor and a reference sensor and further including an environmental sensor in accordance with an embodiment of the invention.
- a sensor device 115 includes multiple pairs of sensor 30 and a structural reference sensor 50 arranged in an array on a substrate 10 and a heating element in or within substrate 10 as previously described. In contrast to sensor device 114 , sensor device 115 also includes an environmental sensor 40 centrally located on substrate 10 . The environmental sensor 40 may be used as a reference for correcting the baseline variation of sensors 30 in addition to the structural reference sensors 50 .
- FIGS. 16, 17, and 18 illustrate top views of example sensor devices including multiple sensors, and an environmental sensor where the environmental sensor is located on a second substrate in accordance with embodiments of the invention.
- FIG. 16 illustrates an example sensor device that includes a single reference sensor
- FIG. 17 illustrates an example sensor device that includes multiple reference sensors
- FIG. 18 illustrates an example sensor device that includes multiple pairs of a sensor and a reference sensor.
- a sensor device 116 includes a sensor device 112 as previously described in reference to FIG. 12 operatively coupled to a second substrate 12 .
- An environmental sensor 40 is attached to the second substrate 12 .
- a sensor device 117 includes a sensor device 113 as previously described in reference to FIG. 13 operatively coupled to a second substrate 12 .
- An environmental sensor 40 is attached to the second substrate 12 .
- a sensor device 118 includes a sensor device 114 as previously described in reference to FIG. 14 operatively coupled to a second substrate 12 .
- An environmental sensor 40 is attached to the second substrate 12 .
- additional environmental sensors may also be included. Additional types of environmental sensors may also be included as described in an example in reference to FIG. 4 . Multiple types of sensors may also be included on the same substrate or in the same sensor device, sensor package, or sensing system. The invention is also not limited to the correcting the baseline variation of sensors, but may also be applied to any device that is significantly affected by environmental factors.
- FIG. 19 illustrates qualitative graphs of sensor resistance versus time and heating element resistance versus time with baseline variation due to sensor drift
- FIG. 19A illustrates resistance responses of a sensor and a heating element before correcting the baseline variation
- FIG. 19B illustrates resistance responses of the sensor and the heating element after correcting the baseline variation.
- graph 190 shows a heating element resistance curve 85 a and a sensor resistance curve 86 a as a function of time.
- Heating element resistance 85 a may be considered an indication of a variable baseline, as can be seen by the gradual increase in heater resistance over time.
- Sensor resistance curve 86 a is also shown to follow this trend of increasing resistance which may indicate a correlation between the response of the heating element and the response of the sensor.
- corrected heating element resistance curve 85 b is constant in time.
- Sensor resistance curve 86 a and corrected sensor resistance curve 86 b are shown to have a feature in each of five time intervals: first time interval 80 , second time interval 81 , third time interval 82 , fourth time interval 83 , and fifth time interval 84 .
- first time interval 80 and fifth time interval 85 a small concentration of a target analyte is detected in first time interval 80 and fifth time interval 85
- second time interval 81 and fourth time interval 83 a large concentration of a target analyte is detected in third time interval 82 .
- the respective features of the five time intervals are now advantageously measured from a constant baseline.
- FIG. 20 illustrates qualitative graphs of sensor resistance versus time with baseline variation due to sensor drift over multiple correction intervals where FIG. 20A illustrates resistance responses of a sensor before correcting the baseline variation and FIG. 20B illustrates resistance responses of the sensor after correcting the baseline variation.
- graph 120 shows a sensor resistance curve 87 a subject to baseline variation with a first correction interval 88 and a second correction interval 89 .
- Graph 121 shows a corrected sensor resistance curve 87 b where the baseline is now constant.
- a correlation is determined between the sensor and a reference prior to first correction interval 88 and then used to correct the sensor resistance during first correction interval 88 .
- first correction time interval 88 a correlation is again determined between the sensor and the reference and used to correct the sensor resistance during the second correction interval 89 . This may continue to be repeated as has been described in further detail in previous embodiments.
- a method of sensing including: obtaining, by a sensor, first sensor data points; obtaining first reference data points; determining a correlation between the first sensor data points and the first reference data points; measuring, by the sensor, second sensor data points; obtaining second reference data points; adjusting the second sensor data points using the correlation and the second reference data points to obtain corrected sensor data points; determining sensed values from the corrected sensor data points; and storing the sensed values.
- determining the correlation includes determining a plurality of correlation coefficients using regression analysis.
- adjusting the second sensor data points includes using the correlation to determine instantaneous baseline values for each of the second sensor data points, and subtracting the instantaneous baseline values from the corresponding second sensor data points.
- the method of one of examples 1 to 6, where obtaining the first reference points and obtaining the second reference points includes obtaining resistance values of a heating element.
- the method of one of examples 1 to 6, where obtaining the first reference points and obtaining the second reference points includes obtaining ambient temperature measurements from a temperature sensor.
- a method of sensing including: obtaining, by a sensor, first sensor data points during a first time interval; obtaining first reference data points during the first time interval; and during a second time interval and after the first time interval, measuring, by the sensor, second sensor data points, generating corrected second sensor data points by correcting for baseline variation in the second sensor data points using a relationship between the first sensor data points and the first reference data points, and determining sensed values from the corrected second sensor data points.
- obtaining the first reference points includes obtaining resistance values of a heating element.
- a sensor device including: a gas sensor disposed on a first substrate, the gas sensor being configured to measure first sensor data points and second sensor data points; a heating element disposed within the first substrate, where the gas sensor overlaps the heating element; a processor operatively coupled to the gas sensor and the heating element; and a memory storing a program to be executed by the processor, the program including instructions for recording first resistance values and second resistance values of the heating element, adjusting the second sensor data points using the first sensor data points, the first resistance values, and the second resistance values to obtain corrected sensor data points, and determining sensed values from the corrected sensor data points.
- ASIC application-specific integrated circuit
Abstract
Description
R S(t)=C 1 R H(t)+C 0
R S(t)=C 1 T(t)+C 0
R S(t)=C 2 RH(t)+C 1 T(t)+C 0
R S,baseline(t)=C 1 R H,new(t)+C 0
R S,corrected(t)=R S,new(t)−R S,baseline(t)=R S,new(t)−[C 1 R H,new(t)+C s]
Claims (20)
Priority Applications (3)
| Application Number | Priority Date | Filing Date | Title |
|---|---|---|---|
| US15/663,711 US10677768B2 (en) | 2017-07-29 | 2017-07-29 | Gas sensing systems and methods of operation thereof |
| US16/852,035 US11287405B2 (en) | 2017-07-29 | 2020-04-17 | Gas sensing systems and methods of operation thereof |
| US17/651,717 US11656210B2 (en) | 2017-07-29 | 2022-02-18 | Gas sensing systems and methods of operation thereof |
Applications Claiming Priority (1)
| Application Number | Priority Date | Filing Date | Title |
|---|---|---|---|
| US15/663,711 US10677768B2 (en) | 2017-07-29 | 2017-07-29 | Gas sensing systems and methods of operation thereof |
Related Child Applications (1)
| Application Number | Title | Priority Date | Filing Date |
|---|---|---|---|
| US16/852,035 Division US11287405B2 (en) | 2017-07-29 | 2020-04-17 | Gas sensing systems and methods of operation thereof |
Publications (2)
| Publication Number | Publication Date |
|---|---|
| US20190033274A1 US20190033274A1 (en) | 2019-01-31 |
| US10677768B2 true US10677768B2 (en) | 2020-06-09 |
Family
ID=65038522
Family Applications (3)
| Application Number | Title | Priority Date | Filing Date |
|---|---|---|---|
| US15/663,711 Active 2038-04-20 US10677768B2 (en) | 2017-07-29 | 2017-07-29 | Gas sensing systems and methods of operation thereof |
| US16/852,035 Active 2037-09-17 US11287405B2 (en) | 2017-07-29 | 2020-04-17 | Gas sensing systems and methods of operation thereof |
| US17/651,717 Active US11656210B2 (en) | 2017-07-29 | 2022-02-18 | Gas sensing systems and methods of operation thereof |
Family Applications After (2)
| Application Number | Title | Priority Date | Filing Date |
|---|---|---|---|
| US16/852,035 Active 2037-09-17 US11287405B2 (en) | 2017-07-29 | 2020-04-17 | Gas sensing systems and methods of operation thereof |
| US17/651,717 Active US11656210B2 (en) | 2017-07-29 | 2022-02-18 | Gas sensing systems and methods of operation thereof |
Country Status (1)
| Country | Link |
|---|---|
| US (3) | US10677768B2 (en) |
Families Citing this family (10)
| Publication number | Priority date | Publication date | Assignee | Title |
|---|---|---|---|---|
| US20210172904A1 (en) * | 2018-01-04 | 2021-06-10 | Lyten, Inc. | Container including analyte sensing device |
| US20210181146A1 (en) * | 2018-01-04 | 2021-06-17 | Lyten, Inc. | Sensing device for detecting analytes in packages |
| US11913901B2 (en) * | 2018-01-04 | 2024-02-27 | Lyten, Inc. | Analyte sensing device |
| JP2019168289A (en) * | 2018-03-22 | 2019-10-03 | 株式会社東芝 | Method for sensing gas, gas sensor, and gas sensing system |
| JP6931259B2 (en) * | 2018-05-17 | 2021-09-01 | フィガロ技研株式会社 | Gas detector and gas detection method using metal oxide semiconductor gas sensor |
| US20200204884A1 (en) * | 2018-12-25 | 2020-06-25 | Arasens, Inc. | Correlation-Based Sensor Network and Control Method thereof |
| CN114062283A (en) * | 2020-07-31 | 2022-02-18 | 瑞益系统公司 | Apparatus, computer-implemented method, and computer program product for dynamic iterative baseline adjustment |
| TWI759855B (en) * | 2020-09-10 | 2022-04-01 | 財團法人工業技術研究院 | Sensing devices and correction method |
| US11143641B1 (en) * | 2021-04-05 | 2021-10-12 | Vivante Health, Inc. | Gas sensor calibration method |
| SE545975C2 (en) * | 2021-06-14 | 2024-04-02 | Senseair Ab | Gas sensor device and method for updating baseline calibration parameter |
Citations (11)
| Publication number | Priority date | Publication date | Assignee | Title |
|---|---|---|---|---|
| US5347474A (en) | 1991-09-19 | 1994-09-13 | Gaztech Corporation | Self-calibration of an NDIR gas sensor |
| US20020092779A1 (en) | 2000-02-04 | 2002-07-18 | Abdeltif Essalik | Drift compensation for gas component sensors |
| US20060155486A1 (en) * | 2004-10-07 | 2006-07-13 | Walsh Alicia M | Computer-implemented system and method for analyzing mixtures of gases |
| US20060173637A1 (en) | 2003-08-11 | 2006-08-03 | Martin Hans Evald G | Method of compensating for a measuring error and an electronic arrangement to this end |
| US20110218414A1 (en) * | 2003-08-22 | 2011-09-08 | Dexcom, Inc. | Systems and methods for processing analyte sensor data |
| CN102778538A (en) * | 2012-07-06 | 2012-11-14 | 广东电网公司电力科学研究院 | Soft measuring method based on improved SVM (Support Vector Machine) for measuring boiler unburned carbon content in fly ash |
| US20130018599A1 (en) | 2011-07-12 | 2013-01-17 | Haibing Peng | Design of ultra-fast suspended graphene nano-sensors suitable for large scale production |
| US20140238100A1 (en) * | 2013-02-27 | 2014-08-28 | Qualcomm Incorporated | Method for calibration of sensors embedded or wirelessly connected to a mobile device |
| US20140260547A1 (en) * | 2013-03-15 | 2014-09-18 | The Regents Of The University Of California | Graphene-based gas and bio sensor with high sensitivity and selectivity |
| US20140260545A1 (en) * | 2013-03-15 | 2014-09-18 | Infineon Technologies Ag | Sensor and sensing method |
| US20180195947A1 (en) * | 2015-06-30 | 2018-07-12 | Denso Corporation | Particulate matter detection system |
Family Cites Families (5)
| Publication number | Priority date | Publication date | Assignee | Title |
|---|---|---|---|---|
| US5716506A (en) * | 1995-10-06 | 1998-02-10 | Board Of Trustees Of The University Of Illinois | Electrochemical sensors for gas detection |
| US8759153B2 (en) * | 2011-09-06 | 2014-06-24 | Infineon Technologies Ag | Method for making a sensor device using a graphene layer |
| US10605795B2 (en) * | 2015-02-17 | 2020-03-31 | H2Scan Corporation | Method for measuring gas concentrations based on sensor response times |
| EP3144669A1 (en) * | 2015-09-17 | 2017-03-22 | IDT Europe GmbH | A single gas sensor for sensing different gases and a method using the gas sensor |
| US10295457B1 (en) * | 2017-06-13 | 2019-05-21 | Larry Ocheltree | Airplane cabin air quality monitoring system |
-
2017
- 2017-07-29 US US15/663,711 patent/US10677768B2/en active Active
-
2020
- 2020-04-17 US US16/852,035 patent/US11287405B2/en active Active
-
2022
- 2022-02-18 US US17/651,717 patent/US11656210B2/en active Active
Patent Citations (11)
| Publication number | Priority date | Publication date | Assignee | Title |
|---|---|---|---|---|
| US5347474A (en) | 1991-09-19 | 1994-09-13 | Gaztech Corporation | Self-calibration of an NDIR gas sensor |
| US20020092779A1 (en) | 2000-02-04 | 2002-07-18 | Abdeltif Essalik | Drift compensation for gas component sensors |
| US20060173637A1 (en) | 2003-08-11 | 2006-08-03 | Martin Hans Evald G | Method of compensating for a measuring error and an electronic arrangement to this end |
| US20110218414A1 (en) * | 2003-08-22 | 2011-09-08 | Dexcom, Inc. | Systems and methods for processing analyte sensor data |
| US20060155486A1 (en) * | 2004-10-07 | 2006-07-13 | Walsh Alicia M | Computer-implemented system and method for analyzing mixtures of gases |
| US20130018599A1 (en) | 2011-07-12 | 2013-01-17 | Haibing Peng | Design of ultra-fast suspended graphene nano-sensors suitable for large scale production |
| CN102778538A (en) * | 2012-07-06 | 2012-11-14 | 广东电网公司电力科学研究院 | Soft measuring method based on improved SVM (Support Vector Machine) for measuring boiler unburned carbon content in fly ash |
| US20140238100A1 (en) * | 2013-02-27 | 2014-08-28 | Qualcomm Incorporated | Method for calibration of sensors embedded or wirelessly connected to a mobile device |
| US20140260547A1 (en) * | 2013-03-15 | 2014-09-18 | The Regents Of The University Of California | Graphene-based gas and bio sensor with high sensitivity and selectivity |
| US20140260545A1 (en) * | 2013-03-15 | 2014-09-18 | Infineon Technologies Ag | Sensor and sensing method |
| US20180195947A1 (en) * | 2015-06-30 | 2018-07-12 | Denso Corporation | Particulate matter detection system |
Non-Patent Citations (1)
| Title |
|---|
| Hossein-Babaei et al., "Compensation for the drift-like terms caused by environmental fluctuations in the responses of chemoresistive gas sensors" Sensors and Actuators B 143 (2010) 641-648 (Year: 2010). * |
Also Published As
| Publication number | Publication date |
|---|---|
| US11656210B2 (en) | 2023-05-23 |
| US20220170898A1 (en) | 2022-06-02 |
| US20200319153A1 (en) | 2020-10-08 |
| US20190033274A1 (en) | 2019-01-31 |
| US11287405B2 (en) | 2022-03-29 |
Similar Documents
| Publication | Publication Date | Title |
|---|---|---|
| US11656210B2 (en) | Gas sensing systems and methods of operation thereof | |
| US11035825B2 (en) | Sensing systems and methods for the estimation of analyte concentration | |
| Bougrini et al. | Aging time and brand determination of pasteurized milk using a multisensor e-nose combined with a voltammetric e-tongue | |
| US9170225B2 (en) | Obtaining selectivity in gas sensors via a sensor array system composed of P and N type material | |
| EP3899515B1 (en) | Systems and methods for measuring kinetic response of chemical sensor elements comprising graphene varactors | |
| EP3144669A1 (en) | A single gas sensor for sensing different gases and a method using the gas sensor | |
| EP3879266A1 (en) | Gas sensing device and method for operating a gas sensing device | |
| JP2006275606A (en) | Gas detecting method and gas detector | |
| US11680932B2 (en) | Method and apparatus for operating a multi-gas sensor | |
| Minh et al. | Gas sensing performance at room temperature of nanogap interdigitated electrodes for detection of acetone at low concentration | |
| EP2833129B1 (en) | Method and apparatus for analyzing a gas by a conductance-type particulate metal-oxide gas sensor | |
| Tomic et al. | Standardization methods for handling instrument related signal shift in gas-sensor array measurement data | |
| US7680607B1 (en) | System and method for gas recognition by analysis of bispectrum functions | |
| Ionescu et al. | Dealing with humidity in the qualitative analysis of CO and NO2 using a WO3 sensor and dynamic signal processing | |
| US11698356B2 (en) | Gas detection device and gas detection method using metal-oxide semiconductor gas sensor | |
| CN114072670A (en) | Method and system for determining a concentration of a target gas in a fluid environment | |
| US10495595B2 (en) | Gas sensor device, gas measurement method, and gas measurement device | |
| JP4248087B2 (en) | Gas detection method | |
| US20220011283A1 (en) | Gas sensing device for sensing one or more gases in a mixture of gases | |
| Madrolle et al. | Dual-temperature mode for quantitative analysis of gas mixtures with MOX sensor | |
| KR102031900B1 (en) | Semiconductor sensor for detecting chemical materials, detection method and detection system using the same | |
| Bryant-Genevier et al. | Multivariate curve resolution of co-eluting vapors from a gas chromatograph with microsensor array detector | |
| US20220003702A1 (en) | Method for detecting at least one gas quantity of at least one predetermined gas by a measurement sensor of a plurality of gases | |
| Kuchmenko et al. | Substantiation of the operating life of gas piezosensors in detection of vapors of organic compounds | |
| EP3276343B1 (en) | Method and device for characterising an analyte |
Legal Events
| Date | Code | Title | Description |
|---|---|---|---|
| AS | Assignment |
Owner name: INFINEON TECHNOLOGIES AG, GERMANY Free format text: ASSIGNMENT OF ASSIGNORS INTEREST;ASSIGNORS:MAKARAM, PRASHANTH;ONARAN, ABIDIN GUCLU;REEL/FRAME:043666/0552 Effective date: 20170717 |
|
| STPP | Information on status: patent application and granting procedure in general |
Free format text: DOCKETED NEW CASE - READY FOR EXAMINATION |
|
| STPP | Information on status: patent application and granting procedure in general |
Free format text: NON FINAL ACTION MAILED |
|
| STPP | Information on status: patent application and granting procedure in general |
Free format text: RESPONSE TO NON-FINAL OFFICE ACTION ENTERED AND FORWARDED TO EXAMINER |
|
| STPP | Information on status: patent application and granting procedure in general |
Free format text: NON FINAL ACTION MAILED |
|
| STPP | Information on status: patent application and granting procedure in general |
Free format text: FINAL REJECTION MAILED |
|
| STPP | Information on status: patent application and granting procedure in general |
Free format text: NOTICE OF ALLOWANCE MAILED -- APPLICATION RECEIVED IN OFFICE OF PUBLICATIONS |
|
| STPP | Information on status: patent application and granting procedure in general |
Free format text: PUBLICATIONS -- ISSUE FEE PAYMENT VERIFIED |
|
| STCF | Information on status: patent grant |
Free format text: PATENTED CASE |
|
| MAFP | Maintenance fee payment |
Free format text: PAYMENT OF MAINTENANCE FEE, 4TH YEAR, LARGE ENTITY (ORIGINAL EVENT CODE: M1551); ENTITY STATUS OF PATENT OWNER: LARGE ENTITY Year of fee payment: 4 |