US10526639B2 - Genome architecture mapping - Google Patents
Genome architecture mapping Download PDFInfo
- Publication number
- US10526639B2 US10526639B2 US15/533,890 US201515533890A US10526639B2 US 10526639 B2 US10526639 B2 US 10526639B2 US 201515533890 A US201515533890 A US 201515533890A US 10526639 B2 US10526639 B2 US 10526639B2
- Authority
- US
- United States
- Prior art keywords
- loci
- cell
- compartment
- genome
- segregation
- Prior art date
- Legal status (The legal status is an assumption and is not a legal conclusion. Google has not performed a legal analysis and makes no representation as to the accuracy of the status listed.)
- Active
Links
- 238000013507 mapping Methods 0.000 title abstract description 19
- 238000000034 method Methods 0.000 claims abstract description 114
- 238000005204 segregation Methods 0.000 claims abstract description 66
- 210000004940 nucleus Anatomy 0.000 claims abstract description 50
- 150000007523 nucleic acids Chemical class 0.000 claims abstract description 45
- 102000039446 nucleic acids Human genes 0.000 claims abstract description 44
- 108020004707 nucleic acids Proteins 0.000 claims abstract description 44
- 208000037265 diseases, disorders, signs and symptoms Diseases 0.000 claims abstract description 24
- 201000010099 disease Diseases 0.000 claims abstract description 21
- 238000007619 statistical method Methods 0.000 claims abstract description 10
- 238000000926 separation method Methods 0.000 claims abstract description 5
- 210000004027 cell Anatomy 0.000 claims description 109
- 210000000349 chromosome Anatomy 0.000 claims description 65
- WSFSSNUMVMOOMR-UHFFFAOYSA-N Formaldehyde Chemical compound O=C WSFSSNUMVMOOMR-UHFFFAOYSA-N 0.000 claims description 55
- 238000001514 detection method Methods 0.000 claims description 49
- 238000012163 sequencing technique Methods 0.000 claims description 21
- 210000001519 tissue Anatomy 0.000 claims description 19
- 230000001413 cellular effect Effects 0.000 claims description 13
- 210000005260 human cell Anatomy 0.000 claims description 7
- 238000007481 next generation sequencing Methods 0.000 claims description 7
- 239000003431 cross linking reagent Substances 0.000 claims description 6
- 210000004962 mammalian cell Anatomy 0.000 claims description 5
- 238000004132 cross linking Methods 0.000 claims description 4
- 241000894006 Bacteria Species 0.000 claims description 3
- 208000035475 disorder Diseases 0.000 claims description 3
- 210000003527 eukaryotic cell Anatomy 0.000 claims description 3
- 210000001236 prokaryotic cell Anatomy 0.000 claims description 3
- 238000004017 vitrification Methods 0.000 claims description 3
- 230000002538 fungal effect Effects 0.000 claims description 2
- 210000003470 mitochondria Anatomy 0.000 claims description 2
- 108090000623 proteins and genes Proteins 0.000 abstract description 65
- 238000004458 analytical method Methods 0.000 abstract description 41
- 230000001105 regulatory effect Effects 0.000 abstract description 11
- 230000014509 gene expression Effects 0.000 abstract description 10
- 230000004807 localization Effects 0.000 abstract description 5
- 238000009646 cryomilling Methods 0.000 abstract description 4
- 210000003855 cell nucleus Anatomy 0.000 abstract description 3
- 230000003993 interaction Effects 0.000 description 121
- 108010077544 Chromatin Proteins 0.000 description 75
- 210000003483 chromatin Anatomy 0.000 description 75
- 239000003623 enhancer Substances 0.000 description 55
- 108020004414 DNA Proteins 0.000 description 39
- 239000000523 sample Substances 0.000 description 34
- 238000013459 approach Methods 0.000 description 25
- 241000699666 Mus <mouse, genus> Species 0.000 description 22
- 239000011159 matrix material Substances 0.000 description 21
- 238000013518 transcription Methods 0.000 description 16
- 238000009826 distribution Methods 0.000 description 14
- ZNJHFNUEQDVFCJ-UHFFFAOYSA-M sodium;2-[4-(2-hydroxyethyl)piperazin-1-yl]ethanesulfonic acid;hydroxide Chemical compound [OH-].[Na+].OCCN1CCN(CCS(O)(=O)=O)CC1 ZNJHFNUEQDVFCJ-UHFFFAOYSA-M 0.000 description 12
- 230000035897 transcription Effects 0.000 description 12
- 238000005056 compaction Methods 0.000 description 11
- 230000008707 rearrangement Effects 0.000 description 10
- 238000011144 upstream manufacturing Methods 0.000 description 10
- 238000005516 engineering process Methods 0.000 description 9
- 238000013412 genome amplification Methods 0.000 description 9
- IJGRMHOSHXDMSA-UHFFFAOYSA-N Atomic nitrogen Chemical compound N#N IJGRMHOSHXDMSA-UHFFFAOYSA-N 0.000 description 8
- 206010028980 Neoplasm Diseases 0.000 description 8
- 238000002360 preparation method Methods 0.000 description 8
- 201000011510 cancer Diseases 0.000 description 7
- 230000000694 effects Effects 0.000 description 7
- 230000008520 organization Effects 0.000 description 7
- 239000008188 pellet Substances 0.000 description 7
- 102000004169 proteins and genes Human genes 0.000 description 7
- 239000000243 solution Substances 0.000 description 7
- 230000027455 binding Effects 0.000 description 6
- 238000005119 centrifugation Methods 0.000 description 6
- 230000002596 correlated effect Effects 0.000 description 6
- 238000003384 imaging method Methods 0.000 description 6
- 238000007901 in situ hybridization Methods 0.000 description 6
- 238000003908 quality control method Methods 0.000 description 6
- 108700028369 Alleles Proteins 0.000 description 5
- 108091023040 Transcription factor Proteins 0.000 description 5
- 102000040945 Transcription factor Human genes 0.000 description 5
- 230000002759 chromosomal effect Effects 0.000 description 5
- 229940079593 drug Drugs 0.000 description 5
- 239000003814 drug Substances 0.000 description 5
- 238000001001 laser micro-dissection Methods 0.000 description 5
- 239000002609 medium Substances 0.000 description 5
- 239000013642 negative control Substances 0.000 description 5
- 210000002353 nuclear lamina Anatomy 0.000 description 5
- 238000003860 storage Methods 0.000 description 5
- 230000005945 translocation Effects 0.000 description 5
- 108091032973 (ribonucleotides)n+m Proteins 0.000 description 4
- 206010006187 Breast cancer Diseases 0.000 description 4
- 208000026310 Breast neoplasm Diseases 0.000 description 4
- 101150025421 ETS gene Proteins 0.000 description 4
- 101000779641 Homo sapiens ALK tyrosine kinase receptor Proteins 0.000 description 4
- 208000000236 Prostatic Neoplasms Diseases 0.000 description 4
- 229930006000 Sucrose Natural products 0.000 description 4
- CZMRCDWAGMRECN-UGDNZRGBSA-N Sucrose Chemical compound O[C@H]1[C@H](O)[C@@H](CO)O[C@@]1(CO)O[C@@H]1[C@H](O)[C@@H](O)[C@H](O)[C@@H](CO)O1 CZMRCDWAGMRECN-UGDNZRGBSA-N 0.000 description 4
- 239000000872 buffer Substances 0.000 description 4
- 238000004364 calculation method Methods 0.000 description 4
- 238000012217 deletion Methods 0.000 description 4
- 230000037430 deletion Effects 0.000 description 4
- 238000011161 development Methods 0.000 description 4
- 230000018109 developmental process Effects 0.000 description 4
- 239000000834 fixative Substances 0.000 description 4
- 230000004927 fusion Effects 0.000 description 4
- 239000007788 liquid Substances 0.000 description 4
- 229910052757 nitrogen Inorganic materials 0.000 description 4
- 238000010606 normalization Methods 0.000 description 4
- 239000002773 nucleotide Substances 0.000 description 4
- 125000003729 nucleotide group Chemical group 0.000 description 4
- 230000002093 peripheral effect Effects 0.000 description 4
- 238000004321 preservation Methods 0.000 description 4
- 238000011160 research Methods 0.000 description 4
- 238000013179 statistical model Methods 0.000 description 4
- 239000005720 sucrose Substances 0.000 description 4
- 238000012360 testing method Methods 0.000 description 4
- 230000001225 therapeutic effect Effects 0.000 description 4
- 230000002103 transcriptional effect Effects 0.000 description 4
- 238000011282 treatment Methods 0.000 description 4
- 102100033793 ALK tyrosine kinase receptor Human genes 0.000 description 3
- 208000027205 Congenital disease Diseases 0.000 description 3
- 238000007400 DNA extraction Methods 0.000 description 3
- 241000283074 Equus asinus Species 0.000 description 3
- 108091029865 Exogenous DNA Proteins 0.000 description 3
- 206010058467 Lung neoplasm malignant Diseases 0.000 description 3
- 108091028043 Nucleic acid sequence Proteins 0.000 description 3
- 206010060862 Prostate cancer Diseases 0.000 description 3
- 102000009572 RNA Polymerase II Human genes 0.000 description 3
- 108010009460 RNA Polymerase II Proteins 0.000 description 3
- 230000003321 amplification Effects 0.000 description 3
- 238000001574 biopsy Methods 0.000 description 3
- 230000015572 biosynthetic process Effects 0.000 description 3
- 230000022131 cell cycle Effects 0.000 description 3
- 238000010382 chemical cross-linking Methods 0.000 description 3
- 230000000295 complement effect Effects 0.000 description 3
- 230000000875 corresponding effect Effects 0.000 description 3
- 238000005520 cutting process Methods 0.000 description 3
- 230000003247 decreasing effect Effects 0.000 description 3
- 238000003745 diagnosis Methods 0.000 description 3
- 238000001493 electron microscopy Methods 0.000 description 3
- 238000010201 enrichment analysis Methods 0.000 description 3
- 230000003628 erosive effect Effects 0.000 description 3
- 239000012634 fragment Substances 0.000 description 3
- 238000013467 fragmentation Methods 0.000 description 3
- 238000006062 fragmentation reaction Methods 0.000 description 3
- 238000007710 freezing Methods 0.000 description 3
- 230000008014 freezing Effects 0.000 description 3
- 239000000499 gel Substances 0.000 description 3
- 238000001415 gene therapy Methods 0.000 description 3
- 201000005202 lung cancer Diseases 0.000 description 3
- 208000020816 lung neoplasm Diseases 0.000 description 3
- 239000003550 marker Substances 0.000 description 3
- 238000005259 measurement Methods 0.000 description 3
- 239000000203 mixture Substances 0.000 description 3
- 238000003199 nucleic acid amplification method Methods 0.000 description 3
- 238000013442 quality metrics Methods 0.000 description 3
- 230000010076 replication Effects 0.000 description 3
- 230000006641 stabilisation Effects 0.000 description 3
- 239000000725 suspension Substances 0.000 description 3
- 238000012070 whole genome sequencing analysis Methods 0.000 description 3
- -1 4%) Chemical compound 0.000 description 2
- IGAZHQIYONOHQN-UHFFFAOYSA-N Alexa Fluor 555 Chemical compound C=12C=CC(=N)C(S(O)(=O)=O)=C2OC2=C(S(O)(=O)=O)C(N)=CC=C2C=1C1=CC=C(C(O)=O)C=C1C(O)=O IGAZHQIYONOHQN-UHFFFAOYSA-N 0.000 description 2
- 241001156002 Anthonomus pomorum Species 0.000 description 2
- XKRFYHLGVUSROY-UHFFFAOYSA-N Argon Chemical compound [Ar] XKRFYHLGVUSROY-UHFFFAOYSA-N 0.000 description 2
- 241000030939 Bubalus bubalis Species 0.000 description 2
- 201000009030 Carcinoma Diseases 0.000 description 2
- 102000004190 Enzymes Human genes 0.000 description 2
- 108090000790 Enzymes Proteins 0.000 description 2
- 101150099612 Esrrb gene Proteins 0.000 description 2
- 208000031448 Genomic Instability Diseases 0.000 description 2
- 101000686031 Homo sapiens Proto-oncogene tyrosine-protein kinase ROS Proteins 0.000 description 2
- 101000638154 Homo sapiens Transmembrane protease serine 2 Proteins 0.000 description 2
- 241001599018 Melanogaster Species 0.000 description 2
- 208000008589 Obesity Diseases 0.000 description 2
- 241000283973 Oryctolagus cuniculus Species 0.000 description 2
- 241001494479 Pecora Species 0.000 description 2
- 108091000080 Phosphotransferase Proteins 0.000 description 2
- 102100023347 Proto-oncogene tyrosine-protein kinase ROS Human genes 0.000 description 2
- 101100247004 Rattus norvegicus Qsox1 gene Proteins 0.000 description 2
- 102000004389 Ribonucleoproteins Human genes 0.000 description 2
- 108010081734 Ribonucleoproteins Proteins 0.000 description 2
- 108091027544 Subgenomic mRNA Proteins 0.000 description 2
- 102100031989 Transmembrane protease serine 2 Human genes 0.000 description 2
- 230000002159 abnormal effect Effects 0.000 description 2
- 230000006978 adaptation Effects 0.000 description 2
- 230000004075 alteration Effects 0.000 description 2
- 230000008901 benefit Effects 0.000 description 2
- 239000011230 binding agent Substances 0.000 description 2
- 238000004113 cell culture Methods 0.000 description 2
- 239000006285 cell suspension Substances 0.000 description 2
- 238000006243 chemical reaction Methods 0.000 description 2
- 238000009833 condensation Methods 0.000 description 2
- 230000002559 cytogenic effect Effects 0.000 description 2
- 238000004925 denaturation Methods 0.000 description 2
- 230000036425 denaturation Effects 0.000 description 2
- 238000013461 design Methods 0.000 description 2
- VYFYYTLLBUKUHU-UHFFFAOYSA-N dopamine Chemical compound NCCC1=CC=C(O)C(O)=C1 VYFYYTLLBUKUHU-UHFFFAOYSA-N 0.000 description 2
- 238000002474 experimental method Methods 0.000 description 2
- 238000000605 extraction Methods 0.000 description 2
- 239000000835 fiber Substances 0.000 description 2
- MHMNJMPURVTYEJ-UHFFFAOYSA-N fluorescein-5-isothiocyanate Chemical compound O1C(=O)C2=CC(N=C=S)=CC=C2C21C1=CC=C(O)C=C1OC1=CC(O)=CC=C21 MHMNJMPURVTYEJ-UHFFFAOYSA-N 0.000 description 2
- 238000001943 fluorescence-activated cell sorting Methods 0.000 description 2
- 238000005194 fractionation Methods 0.000 description 2
- 238000010353 genetic engineering Methods 0.000 description 2
- 238000012165 high-throughput sequencing Methods 0.000 description 2
- 238000011534 incubation Methods 0.000 description 2
- 238000003780 insertion Methods 0.000 description 2
- 230000037431 insertion Effects 0.000 description 2
- NOESYZHRGYRDHS-UHFFFAOYSA-N insulin Chemical compound N1C(=O)C(NC(=O)C(CCC(N)=O)NC(=O)C(CCC(O)=O)NC(=O)C(C(C)C)NC(=O)C(NC(=O)CN)C(C)CC)CSSCC(C(NC(CO)C(=O)NC(CC(C)C)C(=O)NC(CC=2C=CC(O)=CC=2)C(=O)NC(CCC(N)=O)C(=O)NC(CC(C)C)C(=O)NC(CCC(O)=O)C(=O)NC(CC(N)=O)C(=O)NC(CC=2C=CC(O)=CC=2)C(=O)NC(CSSCC(NC(=O)C(C(C)C)NC(=O)C(CC(C)C)NC(=O)C(CC=2C=CC(O)=CC=2)NC(=O)C(CC(C)C)NC(=O)C(C)NC(=O)C(CCC(O)=O)NC(=O)C(C(C)C)NC(=O)C(CC(C)C)NC(=O)C(CC=2NC=NC=2)NC(=O)C(CO)NC(=O)CNC2=O)C(=O)NCC(=O)NC(CCC(O)=O)C(=O)NC(CCCNC(N)=N)C(=O)NCC(=O)NC(CC=3C=CC=CC=3)C(=O)NC(CC=3C=CC=CC=3)C(=O)NC(CC=3C=CC(O)=CC=3)C(=O)NC(C(C)O)C(=O)N3C(CCC3)C(=O)NC(CCCCN)C(=O)NC(C)C(O)=O)C(=O)NC(CC(N)=O)C(O)=O)=O)NC(=O)C(C(C)CC)NC(=O)C(CO)NC(=O)C(C(C)O)NC(=O)C1CSSCC2NC(=O)C(CC(C)C)NC(=O)C(NC(=O)C(CCC(N)=O)NC(=O)C(CC(N)=O)NC(=O)C(NC(=O)C(N)CC=1C=CC=CC=1)C(C)C)CC1=CN=CN1 NOESYZHRGYRDHS-UHFFFAOYSA-N 0.000 description 2
- 238000000370 laser capture micro-dissection Methods 0.000 description 2
- 238000012417 linear regression Methods 0.000 description 2
- 210000001161 mammalian embryo Anatomy 0.000 description 2
- 239000000463 material Substances 0.000 description 2
- 239000012528 membrane Substances 0.000 description 2
- 238000001531 micro-dissection Methods 0.000 description 2
- 210000002569 neuron Anatomy 0.000 description 2
- 235000020824 obesity Nutrition 0.000 description 2
- 210000000056 organ Anatomy 0.000 description 2
- 230000002018 overexpression Effects 0.000 description 2
- 101150093695 pitx3 gene Proteins 0.000 description 2
- 230000008569 process Effects 0.000 description 2
- 238000012545 processing Methods 0.000 description 2
- 239000000047 product Substances 0.000 description 2
- 238000011002 quantification Methods 0.000 description 2
- 238000009877 rendering Methods 0.000 description 2
- 108091008146 restriction endonucleases Proteins 0.000 description 2
- 229920006395 saturated elastomer Polymers 0.000 description 2
- 238000012216 screening Methods 0.000 description 2
- 238000011105 stabilization Methods 0.000 description 2
- 150000003445 sucroses Chemical class 0.000 description 2
- 239000006228 supernatant Substances 0.000 description 2
- 230000009897 systematic effect Effects 0.000 description 2
- 210000004881 tumor cell Anatomy 0.000 description 2
- 238000011179 visual inspection Methods 0.000 description 2
- XLYOFNOQVPJJNP-UHFFFAOYSA-N water Substances O XLYOFNOQVPJJNP-UHFFFAOYSA-N 0.000 description 2
- DGVVWUTYPXICAM-UHFFFAOYSA-N β‐Mercaptoethanol Chemical compound OCCS DGVVWUTYPXICAM-UHFFFAOYSA-N 0.000 description 2
- JKMHFZQWWAIEOD-UHFFFAOYSA-N 2-[4-(2-hydroxyethyl)piperazin-1-yl]ethanesulfonic acid Chemical compound OCC[NH+]1CCN(CCS([O-])(=O)=O)CC1 JKMHFZQWWAIEOD-UHFFFAOYSA-N 0.000 description 1
- FWBHETKCLVMNFS-UHFFFAOYSA-N 4',6-Diamino-2-phenylindol Chemical compound C1=CC(C(=N)N)=CC=C1C1=CC2=CC=C(C(N)=N)C=C2N1 FWBHETKCLVMNFS-UHFFFAOYSA-N 0.000 description 1
- 229920000936 Agarose Polymers 0.000 description 1
- 239000012103 Alexa Fluor 488 Substances 0.000 description 1
- 108091003079 Bovine Serum Albumin Proteins 0.000 description 1
- 238000001353 Chip-sequencing Methods 0.000 description 1
- 206010065163 Clonal evolution Diseases 0.000 description 1
- 108091026890 Coding region Proteins 0.000 description 1
- OHOQEZWSNFNUSY-UHFFFAOYSA-N Cy3-bifunctional dye zwitterion Chemical compound O=C1CCC(=O)N1OC(=O)CCCCCN1C2=CC=C(S(O)(=O)=O)C=C2C(C)(C)C1=CC=CC(C(C1=CC(=CC=C11)S([O-])(=O)=O)(C)C)=[N+]1CCCCCC(=O)ON1C(=O)CCC1=O OHOQEZWSNFNUSY-UHFFFAOYSA-N 0.000 description 1
- 102000016928 DNA-directed DNA polymerase Human genes 0.000 description 1
- 108010014303 DNA-directed DNA polymerase Proteins 0.000 description 1
- 102000004163 DNA-directed RNA polymerases Human genes 0.000 description 1
- 108090000626 DNA-directed RNA polymerases Proteins 0.000 description 1
- 241000252212 Danio rerio Species 0.000 description 1
- 102000016911 Deoxyribonucleases Human genes 0.000 description 1
- 108010053770 Deoxyribonucleases Proteins 0.000 description 1
- 206010012559 Developmental delay Diseases 0.000 description 1
- 208000012239 Developmental disease Diseases 0.000 description 1
- SHIBSTMRCDJXLN-UHFFFAOYSA-N Digoxigenin Natural products C1CC(C2C(C3(C)CCC(O)CC3CC2)CC2O)(O)C2(C)C1C1=CC(=O)OC1 SHIBSTMRCDJXLN-UHFFFAOYSA-N 0.000 description 1
- 206010061818 Disease progression Diseases 0.000 description 1
- 241000255581 Drosophila <fruit fly, genus> Species 0.000 description 1
- 108091071901 ETS family Proteins 0.000 description 1
- 102100039563 ETS translocation variant 1 Human genes 0.000 description 1
- 102100039578 ETS translocation variant 4 Human genes 0.000 description 1
- 102100039577 ETS translocation variant 5 Human genes 0.000 description 1
- 102100027100 Echinoderm microtubule-associated protein-like 4 Human genes 0.000 description 1
- 241000196324 Embryophyta Species 0.000 description 1
- 108010067770 Endopeptidase K Proteins 0.000 description 1
- 241000588724 Escherichia coli Species 0.000 description 1
- 101001077417 Gallus gallus Potassium voltage-gated channel subfamily H member 6 Proteins 0.000 description 1
- 108010010803 Gelatin Proteins 0.000 description 1
- 230000010558 Gene Alterations Effects 0.000 description 1
- 108700028146 Genetic Enhancer Elements Proteins 0.000 description 1
- 239000007995 HEPES buffer Substances 0.000 description 1
- 101000813729 Homo sapiens ETS translocation variant 1 Proteins 0.000 description 1
- 101000813747 Homo sapiens ETS translocation variant 4 Proteins 0.000 description 1
- 101000813745 Homo sapiens ETS translocation variant 5 Proteins 0.000 description 1
- 101001057929 Homo sapiens Echinoderm microtubule-associated protein-like 4 Proteins 0.000 description 1
- 101001053430 Homo sapiens Iroquois-class homeodomain protein IRX-3 Proteins 0.000 description 1
- 101000605528 Homo sapiens Kallikrein-2 Proteins 0.000 description 1
- 101000605496 Homo sapiens Kinesin light chain 1 Proteins 0.000 description 1
- 101001050559 Homo sapiens Kinesin-1 heavy chain Proteins 0.000 description 1
- 101000800847 Homo sapiens Protein TFG Proteins 0.000 description 1
- 101000579425 Homo sapiens Proto-oncogene tyrosine-protein kinase receptor Ret Proteins 0.000 description 1
- 101000648196 Homo sapiens Striatin Proteins 0.000 description 1
- 101001010792 Homo sapiens Transcriptional regulator ERG Proteins 0.000 description 1
- 101001135565 Homo sapiens Tyrosine-protein phosphatase non-receptor type 3 Proteins 0.000 description 1
- 102000001706 Immunoglobulin Fab Fragments Human genes 0.000 description 1
- 108010054477 Immunoglobulin Fab Fragments Proteins 0.000 description 1
- 208000026350 Inborn Genetic disease Diseases 0.000 description 1
- 102000004877 Insulin Human genes 0.000 description 1
- 108090001061 Insulin Proteins 0.000 description 1
- 102100024374 Iroquois-class homeodomain protein IRX-3 Human genes 0.000 description 1
- 102100038356 Kallikrein-2 Human genes 0.000 description 1
- 102100038306 Kinesin light chain 1 Human genes 0.000 description 1
- 102100023422 Kinesin-1 heavy chain Human genes 0.000 description 1
- 102000006835 Lamins Human genes 0.000 description 1
- 108010047294 Lamins Proteins 0.000 description 1
- 102000003960 Ligases Human genes 0.000 description 1
- 108090000364 Ligases Proteins 0.000 description 1
- 241000337544 Limnoriidae Species 0.000 description 1
- 241000124008 Mammalia Species 0.000 description 1
- 241001529936 Murinae Species 0.000 description 1
- 241000699660 Mus musculus Species 0.000 description 1
- 108020004711 Nucleic Acid Probes Proteins 0.000 description 1
- 108091005461 Nucleic proteins Proteins 0.000 description 1
- 108010047956 Nucleosomes Proteins 0.000 description 1
- 102000012547 Olfactory receptors Human genes 0.000 description 1
- 108050002069 Olfactory receptors Proteins 0.000 description 1
- 108700020796 Oncogene Proteins 0.000 description 1
- 208000025174 PANDAS Diseases 0.000 description 1
- 208000021155 Paediatric autoimmune neuropsychiatric disorders associated with streptococcal infection Diseases 0.000 description 1
- 240000000220 Panda oleosa Species 0.000 description 1
- 235000016496 Panda oleosa Nutrition 0.000 description 1
- 229930040373 Paraformaldehyde Natural products 0.000 description 1
- ZYFVNVRFVHJEIU-UHFFFAOYSA-N PicoGreen Chemical compound CN(C)CCCN(CCCN(C)C)C1=CC(=CC2=[N+](C3=CC=CC=C3S2)C)C2=CC=CC=C2N1C1=CC=CC=C1 ZYFVNVRFVHJEIU-UHFFFAOYSA-N 0.000 description 1
- 208000020584 Polyploidy Diseases 0.000 description 1
- 102100022807 Potassium voltage-gated channel subfamily H member 2 Human genes 0.000 description 1
- 241000288906 Primates Species 0.000 description 1
- 102100033661 Protein TFG Human genes 0.000 description 1
- 102100028286 Proto-oncogene tyrosine-protein kinase receptor Ret Human genes 0.000 description 1
- 241000700159 Rattus Species 0.000 description 1
- 108091007568 SLC45A3 Proteins 0.000 description 1
- 102000005635 SOXB1 Transcription Factors Human genes 0.000 description 1
- 108010045179 SOXB1 Transcription Factors Proteins 0.000 description 1
- 240000004808 Saccharomyces cerevisiae Species 0.000 description 1
- 102100037253 Solute carrier family 45 member 3 Human genes 0.000 description 1
- 238000002105 Southern blotting Methods 0.000 description 1
- 238000003646 Spearman's rank correlation coefficient Methods 0.000 description 1
- 102100028898 Striatin Human genes 0.000 description 1
- 101710172711 Structural protein Proteins 0.000 description 1
- 108700009124 Transcription Initiation Site Proteins 0.000 description 1
- 102100024270 Transcription factor SOX-2 Human genes 0.000 description 1
- 108050000630 Transcription factor SOX-2 Proteins 0.000 description 1
- 108700019146 Transgenes Proteins 0.000 description 1
- 108091000117 Tyrosine 3-Monooxygenase Proteins 0.000 description 1
- 102000048218 Tyrosine 3-monooxygenases Human genes 0.000 description 1
- 102100033131 Tyrosine-protein phosphatase non-receptor type 3 Human genes 0.000 description 1
- 241000700605 Viruses Species 0.000 description 1
- 239000002253 acid Substances 0.000 description 1
- 150000007513 acids Chemical class 0.000 description 1
- 239000000853 adhesive Substances 0.000 description 1
- 230000001070 adhesive effect Effects 0.000 description 1
- 230000002776 aggregation Effects 0.000 description 1
- 238000004220 aggregation Methods 0.000 description 1
- 210000004102 animal cell Anatomy 0.000 description 1
- 229910052786 argon Inorganic materials 0.000 description 1
- 238000003491 array Methods 0.000 description 1
- 210000000227 basophil cell of anterior lobe of hypophysis Anatomy 0.000 description 1
- 239000011324 bead Substances 0.000 description 1
- 210000000481 breast Anatomy 0.000 description 1
- 239000008366 buffered solution Substances 0.000 description 1
- 230000000981 bystander Effects 0.000 description 1
- 230000015556 catabolic process Effects 0.000 description 1
- 230000001364 causal effect Effects 0.000 description 1
- 239000006143 cell culture medium Substances 0.000 description 1
- 230000006037 cell lysis Effects 0.000 description 1
- 210000002230 centromere Anatomy 0.000 description 1
- 239000003795 chemical substances by application Substances 0.000 description 1
- 238000004587 chromatography analysis Methods 0.000 description 1
- 230000008711 chromosomal rearrangement Effects 0.000 description 1
- 238000003776 cleavage reaction Methods 0.000 description 1
- 239000003086 colorant Substances 0.000 description 1
- 230000005494 condensation Effects 0.000 description 1
- 230000003624 condensation of chromatin Effects 0.000 description 1
- 239000000470 constituent Substances 0.000 description 1
- 238000011109 contamination Methods 0.000 description 1
- 238000001816 cooling Methods 0.000 description 1
- 230000006378 damage Effects 0.000 description 1
- 238000007405 data analysis Methods 0.000 description 1
- 238000006731 degradation reaction Methods 0.000 description 1
- 230000003111 delayed effect Effects 0.000 description 1
- 230000001419 dependent effect Effects 0.000 description 1
- 230000006866 deterioration Effects 0.000 description 1
- 230000004069 differentiation Effects 0.000 description 1
- QONQRTHLHBTMGP-UHFFFAOYSA-N digitoxigenin Natural products CC12CCC(C3(CCC(O)CC3CC3)C)C3C11OC1CC2C1=CC(=O)OC1 QONQRTHLHBTMGP-UHFFFAOYSA-N 0.000 description 1
- SHIBSTMRCDJXLN-KCZCNTNESA-N digoxigenin Chemical compound C1([C@@H]2[C@@]3([C@@](CC2)(O)[C@H]2[C@@H]([C@@]4(C)CC[C@H](O)C[C@H]4CC2)C[C@H]3O)C)=CC(=O)OC1 SHIBSTMRCDJXLN-KCZCNTNESA-N 0.000 description 1
- 238000010790 dilution Methods 0.000 description 1
- 239000012895 dilution Substances 0.000 description 1
- 230000005750 disease progression Effects 0.000 description 1
- 238000002224 dissection Methods 0.000 description 1
- 229960003638 dopamine Drugs 0.000 description 1
- 230000003291 dopaminomimetic effect Effects 0.000 description 1
- 239000012149 elution buffer Substances 0.000 description 1
- 210000001671 embryonic stem cell Anatomy 0.000 description 1
- 230000002255 enzymatic effect Effects 0.000 description 1
- 210000000267 erythroid cell Anatomy 0.000 description 1
- 210000002304 esc Anatomy 0.000 description 1
- 238000011156 evaluation Methods 0.000 description 1
- 230000003203 everyday effect Effects 0.000 description 1
- 239000012091 fetal bovine serum Substances 0.000 description 1
- 239000008098 formaldehyde solution Substances 0.000 description 1
- 239000008273 gelatin Substances 0.000 description 1
- 229920000159 gelatin Polymers 0.000 description 1
- 235000019322 gelatine Nutrition 0.000 description 1
- 235000011852 gelatine desserts Nutrition 0.000 description 1
- 208000016361 genetic disease Diseases 0.000 description 1
- 230000002068 genetic effect Effects 0.000 description 1
- 239000011521 glass Substances 0.000 description 1
- 238000003306 harvesting Methods 0.000 description 1
- 206010020718 hyperplasia Diseases 0.000 description 1
- 230000006872 improvement Effects 0.000 description 1
- 238000011065 in-situ storage Methods 0.000 description 1
- 229910052738 indium Inorganic materials 0.000 description 1
- 210000004263 induced pluripotent stem cell Anatomy 0.000 description 1
- 229940125396 insulin Drugs 0.000 description 1
- 230000010354 integration Effects 0.000 description 1
- 238000012482 interaction analysis Methods 0.000 description 1
- 230000016507 interphase Effects 0.000 description 1
- 208000030776 invasive breast carcinoma Diseases 0.000 description 1
- 238000002955 isolation Methods 0.000 description 1
- 210000005053 lamin Anatomy 0.000 description 1
- 210000000265 leukocyte Anatomy 0.000 description 1
- 230000000670 limiting effect Effects 0.000 description 1
- 238000010859 live-cell imaging Methods 0.000 description 1
- 238000013178 mathematical model Methods 0.000 description 1
- 230000007246 mechanism Effects 0.000 description 1
- 108020004999 messenger RNA Proteins 0.000 description 1
- 239000002184 metal Substances 0.000 description 1
- 230000031864 metaphase Effects 0.000 description 1
- 238000000386 microscopy Methods 0.000 description 1
- 230000000394 mitotic effect Effects 0.000 description 1
- 238000012986 modification Methods 0.000 description 1
- 230000004048 modification Effects 0.000 description 1
- 238000013425 morphometry Methods 0.000 description 1
- 210000000663 muscle cell Anatomy 0.000 description 1
- 230000035772 mutation Effects 0.000 description 1
- 208000002154 non-small cell lung carcinoma Diseases 0.000 description 1
- 239000002853 nucleic acid probe Substances 0.000 description 1
- 210000001623 nucleosome Anatomy 0.000 description 1
- 230000001151 other effect Effects 0.000 description 1
- 238000010422 painting Methods 0.000 description 1
- 210000000496 pancreas Anatomy 0.000 description 1
- 229920002866 paraformaldehyde Polymers 0.000 description 1
- 230000007170 pathology Effects 0.000 description 1
- 230000010412 perfusion Effects 0.000 description 1
- 102000020233 phosphotransferase Human genes 0.000 description 1
- 230000010399 physical interaction Effects 0.000 description 1
- 230000004962 physiological condition Effects 0.000 description 1
- 229920002401 polyacrylamide Polymers 0.000 description 1
- 239000013641 positive control Substances 0.000 description 1
- XJMOSONTPMZWPB-UHFFFAOYSA-M propidium iodide Chemical compound [I-].[I-].C12=CC(N)=CC=C2C2=CC=C(N)C=C2[N+](CCC[N+](C)(CC)CC)=C1C1=CC=CC=C1 XJMOSONTPMZWPB-UHFFFAOYSA-M 0.000 description 1
- 210000002307 prostate Anatomy 0.000 description 1
- 238000000575 proteomic method Methods 0.000 description 1
- 238000000746 purification Methods 0.000 description 1
- 238000004445 quantitative analysis Methods 0.000 description 1
- 239000002096 quantum dot Substances 0.000 description 1
- 230000006798 recombination Effects 0.000 description 1
- 238000005215 recombination Methods 0.000 description 1
- 230000009467 reduction Effects 0.000 description 1
- 230000002829 reductive effect Effects 0.000 description 1
- 238000007670 refining Methods 0.000 description 1
- 230000031267 regulation of DNA replication Effects 0.000 description 1
- 230000014493 regulation of gene expression Effects 0.000 description 1
- 230000008521 reorganization Effects 0.000 description 1
- 230000008439 repair process Effects 0.000 description 1
- 230000003252 repetitive effect Effects 0.000 description 1
- 230000008672 reprogramming Effects 0.000 description 1
- 230000000717 retained effect Effects 0.000 description 1
- 238000003757 reverse transcription PCR Methods 0.000 description 1
- 238000012552 review Methods 0.000 description 1
- 235000002020 sage Nutrition 0.000 description 1
- 201000000980 schizophrenia Diseases 0.000 description 1
- 230000007017 scission Effects 0.000 description 1
- 239000013049 sediment Substances 0.000 description 1
- 101150041148 skap1 gene Proteins 0.000 description 1
- 210000001626 skin fibroblast Anatomy 0.000 description 1
- 230000009870 specific binding Effects 0.000 description 1
- 239000003381 stabilizer Substances 0.000 description 1
- 210000000130 stem cell Anatomy 0.000 description 1
- 210000004895 subcellular structure Anatomy 0.000 description 1
- 210000003523 substantia nigra Anatomy 0.000 description 1
- 208000024891 symptom Diseases 0.000 description 1
- 230000001360 synchronised effect Effects 0.000 description 1
- 210000003411 telomere Anatomy 0.000 description 1
- 108091035539 telomere Proteins 0.000 description 1
- 102000055501 telomere Human genes 0.000 description 1
- 238000003325 tomography Methods 0.000 description 1
- 238000013519 translation Methods 0.000 description 1
- 230000003612 virological effect Effects 0.000 description 1
- 230000000007 visual effect Effects 0.000 description 1
- 238000012800 visualization Methods 0.000 description 1
Images


Classifications
-
- C—CHEMISTRY; METALLURGY
- C12—BIOCHEMISTRY; BEER; SPIRITS; WINE; VINEGAR; MICROBIOLOGY; ENZYMOLOGY; MUTATION OR GENETIC ENGINEERING
- C12Q—MEASURING OR TESTING PROCESSES INVOLVING ENZYMES, NUCLEIC ACIDS OR MICROORGANISMS; COMPOSITIONS OR TEST PAPERS THEREFOR; PROCESSES OF PREPARING SUCH COMPOSITIONS; CONDITION-RESPONSIVE CONTROL IN MICROBIOLOGICAL OR ENZYMOLOGICAL PROCESSES
- C12Q1/00—Measuring or testing processes involving enzymes, nucleic acids or microorganisms; Compositions therefor; Processes of preparing such compositions
- C12Q1/68—Measuring or testing processes involving enzymes, nucleic acids or microorganisms; Compositions therefor; Processes of preparing such compositions involving nucleic acids
-
- C—CHEMISTRY; METALLURGY
- C12—BIOCHEMISTRY; BEER; SPIRITS; WINE; VINEGAR; MICROBIOLOGY; ENZYMOLOGY; MUTATION OR GENETIC ENGINEERING
- C12N—MICROORGANISMS OR ENZYMES; COMPOSITIONS THEREOF; PROPAGATING, PRESERVING, OR MAINTAINING MICROORGANISMS; MUTATION OR GENETIC ENGINEERING; CULTURE MEDIA
- C12N15/00—Mutation or genetic engineering; DNA or RNA concerning genetic engineering, vectors, e.g. plasmids, or their isolation, preparation or purification; Use of hosts therefor
- C12N15/09—Recombinant DNA-technology
- C12N15/10—Processes for the isolation, preparation or purification of DNA or RNA
- C12N15/1003—Extracting or separating nucleic acids from biological samples, e.g. pure separation or isolation methods; Conditions, buffers or apparatuses therefor
-
- G—PHYSICS
- G16—INFORMATION AND COMMUNICATION TECHNOLOGY [ICT] SPECIALLY ADAPTED FOR SPECIFIC APPLICATION FIELDS
- G16B—BIOINFORMATICS, i.e. INFORMATION AND COMMUNICATION TECHNOLOGY [ICT] SPECIALLY ADAPTED FOR GENETIC OR PROTEIN-RELATED DATA PROCESSING IN COMPUTATIONAL MOLECULAR BIOLOGY
- G16B20/00—ICT specially adapted for functional genomics or proteomics, e.g. genotype-phenotype associations
- G16B20/40—Population genetics; Linkage disequilibrium
-
- C—CHEMISTRY; METALLURGY
- C12—BIOCHEMISTRY; BEER; SPIRITS; WINE; VINEGAR; MICROBIOLOGY; ENZYMOLOGY; MUTATION OR GENETIC ENGINEERING
- C12Q—MEASURING OR TESTING PROCESSES INVOLVING ENZYMES, NUCLEIC ACIDS OR MICROORGANISMS; COMPOSITIONS OR TEST PAPERS THEREFOR; PROCESSES OF PREPARING SUCH COMPOSITIONS; CONDITION-RESPONSIVE CONTROL IN MICROBIOLOGICAL OR ENZYMOLOGICAL PROCESSES
- C12Q2523/00—Reactions characterised by treatment of reaction samples
- C12Q2523/10—Characterised by chemical treatment
- C12Q2523/101—Crosslinking agents, e.g. psoralen
-
- C—CHEMISTRY; METALLURGY
- C12—BIOCHEMISTRY; BEER; SPIRITS; WINE; VINEGAR; MICROBIOLOGY; ENZYMOLOGY; MUTATION OR GENETIC ENGINEERING
- C12Q—MEASURING OR TESTING PROCESSES INVOLVING ENZYMES, NUCLEIC ACIDS OR MICROORGANISMS; COMPOSITIONS OR TEST PAPERS THEREFOR; PROCESSES OF PREPARING SUCH COMPOSITIONS; CONDITION-RESPONSIVE CONTROL IN MICROBIOLOGICAL OR ENZYMOLOGICAL PROCESSES
- C12Q2565/00—Nucleic acid analysis characterised by mode or means of detection
- C12Q2565/10—Detection mode being characterised by the assay principle
- C12Q2565/133—Detection mode being characterised by the assay principle conformational analysis
Definitions
- the present invention relates to the field of analysis of the three-dimensional structure of the genome, i.e., for genome architecture mapping (GAM).
- GAM genome architecture mapping
- the invention provides a method of determining spatial proximity of a plurality of nucleic acid loci in a compartment such as the cell nucleus, by exploiting their co-segregation amongst fractions of that compartment, identified upon separation of the nucleic acid loci from each other depending on their localization in the compartment to obtain a collection of fractions, e.g., by cryo-sectioning the compartment or, e.g. by cryomilling; determining the presence or absence of the plurality of loci in said fractions; and determining the co-segregation of said plurality of loci.
- Co-segregation may then be analysed with statistical methods to determine spatial proximity.
- the method can be used e.g., for determining physical distance between a plurality of loci; and mapping loci and/or genome architecture, e.g., in the nucleus; identification of regulatory regions directing expression of a specific gene through spatial contacts; identifying the nuclear position of an exogenous nucleic acid in the nucleus; determining chromatin compaction and/or diagnosing a disease associated with a disturbed co-segregation of loci.
- chromosomal interactions influencing gene expression is a chromosomal region which can fold in order to bring an enhancer and associated transcription factors within close proximity of a gene.
- Studying the structural properties and spatial organization of chromosomes is important for the understanding and evaluation of the regulation of gene expression, DNA replication and repair, and recombination.
- the folding of chromosomes and their contacts has important implications for disease mechanisms and elucidation of targets for therapeutic approaches, e.g., in cancer or congenital diseases.
- Chromatin exists in interacting and non-interacting states. Interacting states have different properties depending on the characteristics of the binding sites involved in the interactions, namely (a) their number, distance and distribution, (b) their specificity and affinity for binders, and (c) the concentration and specificity of binders. Chromatin interactions can also involve different numbers of loci associating simultaneously (multiplicity of interaction).
- Fluorescence in situ hybridization uses microscopy to directly measure spatial distances between genomic loci, but it can only be applied to the study of a small number of genomic regions at a time in the same nucleus (e.g., Pombo A. 2003. Cellular genomics: which genes are transcribed when and where? Trends Biochem. Sci. 28, 6). It is theoretically possible to re-probe the same cells or tissue sections with different sets of probes, but there are concerns that repeated re-probing causes structural artefacts, e.g. due to DNA denaturation necessary to dissociate subsequent sets of probes, that e.g. induce artificial aggregation (contacts) of loci (i.e.
- RNA-FISH is a milder FISH approach that does not involve DNA denaturation but that can only be used to determine the nuclear position of actively transcribed genes (not silent genes). Samples from cells in the interphase stage of the cell cycle, where functional chromatin contacts are most often mapped, can be re-probed for RNA-FISH only about three times, although the preservation of structure has not been measured in detail.
- the number of probes which can be simultaneously applied in either DNA- or RNA-FISH is limited by distinguishable fluorescent markers, e.g. 181 barcodes can in principle be obtained by combining five colours, four colour ratios and two different levels of intensity (Pombo A. 2003. Cellular genomics: which genes are transcribed when and where? Trends Biochem. Sci. 28, 6).
- this approach fails when the loci analysed are so close in space that the combination of fluorochromes in one probe is not distinguishable from the combination in another, and is therefore not amenable to the identification of loci that are spatially proximal.
- FISH can only be applied to analyse interactions of known loci of interest, and fails e.g. in the detection of endogenous or exogenous DNA sequences unless they are known a priori, e.g. viral subtype integration positions and the exact sequences of exogenous DNA.
- FISH is also confounded by a priori assumptions of linear genome organisation, which are not acceptable to study chromatin positioning features, e.g. chromatin contacts, when e.g. the influence of natural variation in genomic sequence in organism populations is of interest, e.g. in studying human samples, due to the fact that FISH does not inherently detect sequence variations such as copy number variations, or genomic rearrangements, without a priori probe design or a priori whole genome sequencing of the sample followed by probe design.
- 3C-based methods generally start with weak chemical crosslinking of proteins that mediate genomic contacts. After chromatin extraction, crosslinked pieces of DNA are treated with a restriction enzyme for DNA fragmentation. Addition of a ligase then connects (ligates) two pieces of DNA. Different variants of 3C use different methods of detecting such ligation events: a popular one is sequencing (Hi-C, 4C-seq).
- binding sites genome wide in an unbiased manner, and as a result we fail to understand which nuclear components establish different aspects of chromosome architecture, and how long-range chromatin contacts help maintain genome stability and influence genome function (e.g. gene expression). Therefore, the identification of binding sites and measurement of the frequency with which binding sites interact with each other are major current challenges.
- the present inventors addressed the problem of providing an improved method for determining the spatial proximity of nucleic acids, which avoids bias based on ligation of fragmented nucleic acids for detection of nucleic acids interactions, and which allows for simultaneous analysis of several high multiplicity interactions (each involving more than two loci), in particular, more than two interactions, and in one embodiment, for simultaneous analysis of substantially all nucleic acid interactions in the genome and their inter-dependencies.
- This problem is solved by the method of the invention, as described below and in the claims. This method is designated Genome Architecture Mapping (GAM).
- GAM Genome Architecture Mapping
- the present invention provides a method of determining spatial proximity of a plurality of nucleic acid loci in a compartment, comprising steps of
- a locus is the specific location of a gene, DNA sequence, or position on a chromosome (Wikipedia). Each chromosome carries many genes; the number of protein coding genes in the haploid human genome is estimated to be 20,000-25,000, on the 23 different chromosomes. A variant of the similar DNA sequence located at a given locus is called an allele.
- the nucleic acid may be DNA or RNA or a combination of both, e.g., if interactions between genes being actively transcribed and other genomic regions are to be analysed. Usually, co-segregation of DNA is analysed with the method of the invention.
- the co-segregation of loci may be analysed in any cellular or organ compartment comprising nucleic acids, such as the nucleus of a eukaryotic cell, a mitochondrion or a prokaryotic cell.
- nucleic acids such as the nucleus of a eukaryotic cell, a mitochondrion or a prokaryotic cell.
- co-segregation of nucleic acid, in particular, DNA, loci in the nucleus of a eukaryotic cell will be analysed.
- the method of the invention thus constitutes a solution to analyse locus proximity in the nucleus, through measuring their frequency of co-segregation in fractionated nuclei.
- the cell from which the compartment is derived may be a bacterium, a protozoan, a plant cell, a fungal cell or an animal cell, e.g., a mammalian cell, such as a cell from a patient (preferably, a human patient) having a disease or a disorder, or being diagnosed for a disorder, or a healthy subject.
- the cell may be, e.g., a tumor cell or a stem cell, such as an induced pluripotent stem cell generated, e.g., through reprogramming of human tissues.
- Such cells can advantageously be used to apply GAM to study human developmental disorders or congenital disease. If the cell is an embryonic stem cell, it is preferably not generated in a method involving destruction of a human embryo.
- the mammal preferably is a human, but it may also be of interest to investigate, and, optionally, compare the genomic architecture of other organisms, such as E. coli , yeast, A. thaliana, C. elegans, X laevis, D. rerio, D. melanogaster , mouse, rat or primate.
- other organisms such as E. coli , yeast, A. thaliana, C. elegans, X laevis, D. rerio, D. melanogaster , mouse, rat or primate.
- Cells can be derived from cell culture or analysed ex vivo from a specific tissue from a living organism or a dead organism, i.e., post-mortem, or from a whole experimental organism (e.g. a whole D. melanogaster embryo or C. elegans ).
- Cells used in the analysis are preferably selected, e.g., to share a common stage in the cell cycle, or to analyse only cells belonging to a specific developmental lineage or cell type (e.g. within a biopsy of a human organ). For example, in the pancreas, only the insulin producing ⁇ -cells may be analysed. This approach is preferable to synchronizing the cells in a particular stage of the cell cycle, or sorting the cells e.g.
- fluorescence activated cell sorting to capture a particular cell type, as (a) these approaches can alter the arrangement of nucleic acids in the compartment of interest prior to their measurement, and (b) they produce only small numbers of cells (e.g. from size-limited biopsies), which may lead to problems with downstream analyses.
- Synchronized cells or cells sorted by e.g. by fluorescence activated cell sorting can also be used in the invention.
- a marker can be used to help with cell type selection, e.g., an antibody specific for a protein uniquely expressed in the cell type or cell stage of interest, or detected by in situ hybridization e.g. with a nucleic acid probe that detects a specific e.g.
- RNA, or other RNA, expressed specifically in the cell type of interest or a fluorescent marker such as GFP showing expression of a specific gene or characteristic of a specific stage.
- a GFP transgene under the control of the promoter of the Pitx3 transcription factor can be used to mark dopamine-expressing neurons (Maxwell et al., 2005, Pitx3 regulates tyrosine hydroxylase expression in the substantia nigra and identifies a subgroup of mesencephalic dopaminergic progenitor neurons during mouse development, Dev. Biol., 282 (2): 467-479).
- Cells can be pre-treated with an agent, e.g., to test the effect of drugs on co-segregation or positioning of loci.
- Nuclei, cells, tissues or whole organisms are preferably treated with a crosslinking agent before step (a) is carried out.
- the crosslinking agent may comprise formaldehyde or another stabilizing agent compatible with DNA extraction.
- Formaldehyde will preferably be used, at a concentration of 0.5-8%, preferably, 1-8%, 2-8% or, most preferably, 4-8% (all w/w), e.g., in a buffered solution of 250 mM HEPES-NaOH pH 7.0-8.0, preferably for mammalian cells at pH 7.6-7.8, for 10 min to 24 h, preferably for 10 min at 4% followed by 2 h at 8%.
- whole tissues can be crosslinked by perfusion with HEPES-buffered formaldehyde solution (e.g., 4%), preferably for at least 30 min, followed by tissue dissection in ice-cold 4% formaldehyde in 250 mM HEPES-NaOH pH 7.6 for 30 min to 1 h, followed by ice-cold 8% formaldehyde in 250 mM HEPES-NaOH pH 7.6 for 1-3 h (Möller et al., 2012, Proteomic analysis of mitotic RNA polymerase II complexes reveals novel interactors and association with proteins dysfunctional in disease. Mol. Cell. Proteomics 11(6):M111.011767).
- HEPES-buffered formaldehyde solution e.g., 4%
- cells are sedimented by centrifugation (e.g. 150-300 ⁇ g for mammalian cells), before the cell sediment (pellet) is resuspended, e.g. in 4% formaldehyde in 250 mM HEPES-NaOH pH 7.6.
- Cells are sedimented by centrifugation (e.g. 150-300 ⁇ g for mammalian cells), the supernatant decanted, before adding 8% formaldehyde in 250 mM HEPES-NaOH pH 7.6, without disturbing the cell pellet thereafter.
- the cell pellet is allowed to crosslink for, e.g. 1 h.
- the cell pellet is progressively compacted by centrifugation at increased centrifugational force (in steps as e.g. 500 ⁇ g, 1000 ⁇ g, 2000 ⁇ g, 4000 ⁇ g, 8000 ⁇ g, and in some cell types up to 10000 ⁇ g; each 2 min, last step 5-10 min).
- Total time in 8% concentrated fixative, as stated above, is up to 24 h, preferably about 2 h.
- the 8% formaldehyde supernatant is removed in the last centrifugation, and substituted for 1% formaldehyde in 250 mM HEPES-NaOH pH 7.6, without disturbing the cell pellet.
- the crosslinking agent induces linkage of proteins with each other and between nucleic acids and proteins.
- the method of the invention allows for the use of stronger cross-linking conditions than are compatible with current 3C-based methods, and therefore better preservation of the nuclear structure. It was surprising to the inventors that sequencing of nucleic acids was still possible after the nucleic acids were subjected to the cross-linking step which is compatible with optimal structural preservation of subcellular structure. The method is also theoretically possible without a crosslinking step, as fractionation of nuclei is possible through sectioning of vitrified cells (e.g. as discussed in Dubochet et al., 1988. Cryo-electron microscopy of vitrified specimens. Q. Rev. Biophys.
- vitrification i.e. rapid freezing
- chemical crosslinking agents e.g. formaldehyde
- the separation of nucleic acids from each other, depending on their localization in the compartment, to obtain a plurality of fractions in step (a) is carried out by sectioning the compartment, preferably, by ultracryosectioning the compartment.
- the method of the invention involving sectioning is also designated sGAM.
- the separation can be carried out through cryomilling (Oeffinger M, Wei K E, Rogers R, DeGrasse J A, Chait B T, Aitchison J D, Rout M P, 2007 Comprehensive analysis of diverse ribonucleoprotein complexes. Nat Methods. 4, 951-6; Hakhverdyan et al. 2015. Rapid, optimized interactomic screening. Nature Methods 12, 553).
- the nuclear cryosections are produced in the absence of resin-embedding, e.g., by the Tokuyasu method (Tokuyasu, K. T., 1973, J. Cell Biol. 57, 551-65, A technique for ultracryotomy of cell suspensions and tissues.), which involves cryoprotection of fixed tissues using embedding in a saturated sucrose solution for at least about 30 min, or at least about 2 h, or at least about 1 day, or up to 1 week, at a temperature of 0° C.-25° C., preferably, at room temperature (20-25° C.) or at about 4° C., e.g., for 2 h at room temperature, or for 2 h at room temperature followed for short term storage for 1 day up to a week at about 4° C.
- sucrose-embedded cell pellet or tissue, or organism e.g. on a metal stub which acts as a sample holder, before freezing in liquid nitrogen, and sectioning preferably at ⁇ 80 to ⁇ 110° C., depending on the tissue, e.g., about ⁇ 100° C.
- Slightly modified methods (Guillot P V, Xie S Q, Hollinshead M, Pombo A (2004) Fixation-induced redistribution of hyperphosphorylated RNA polymerase II in the nucleus of human cells. Exp. Cell Res.
- Sections e.g., of a nucleus, can have a thickness of about 70 nm to about 1000 nm, preferably, 150-220 nm or 180-200 nm for a nucleus 5-15 micrometer in diameter.
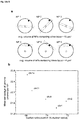
- the inventors for example cryosectioned mouse embryonic stem (ES) cells (mESCs; which have 9 ⁇ m diameter nuclei) at a thickness of 220 nm according to established protocols 3 ( FIG. 5 a,b ).
- ES mouse embryonic stem
- mESCs which have 9 ⁇ m diameter nuclei
- Commercial equipment for cryosectioning in a sucrose medium for fixed cells is available (e.g., Leica UltraCut UCT 52 ultracryomicrotome).
- Sectioning leads to a collection of fractions, i.e. a plurality of fractions.
- the optimal thickness of sections depends on the size of the compartment, which is, in step (a), preferably separated into 5-300 fractions, 10-100 fractions, more preferably, 40-60 fractions or about 45-50 fractions, which, as explained in detail below, has been found to be appropriate for a mouse or human cell nucleus (or a nucleus having a similar size).
- the thickness of the fractions should be homogenous for the whole analysis.
- all sections of a compartment, in particular, of one nucleus are analysed in the method of the invention, rendering an analysis of the genome architecture of a single cell possible.
- the analysed fractions may be sampled from a plurality of compartments, e.g., a plurality of nuclei, across the population of cells of interest.
- more than 180 fractions are analysed, e.g., about 180 to about 10000 fractions, preferably, about 200 to 5000, about 220 to 4000, about 230-3500, about 250-3000, 300-2000 or 500-1000 fractions may be analysed, wherein these fractions may be obtained from a plurality of cells (or nucleic acid containing cellular compartments).
- NPs Single nuclear profiles
- the presence or absence of the plurality of loci may be determined by a non-microscopical method, e.g., by sequencing, preferably, by next generation sequencing.
- a non-microscopical method e.g., by sequencing, preferably, by next generation sequencing.
- sequencing preferably, by next generation sequencing.
- WGA single cell whole genome amplification
- the nucleic acids of loci in the fraction are sequenced substantially or completely. This is of particular interest if the method is carried out to detect possible interactions between different loci in a research setting, and a “normal” co-segregation pattern has not yet been established for the cell type of interest in the physiological conditions used.
- the method of the invention may thus be used to analyse spatial proximity (and, consequently, interactions) of unknown and/or unspecified loci.
- nucleic acids such as DNA
- WGA single-cell whole genome amplification
- FIG. 5 d WGA-amplified DNA
- Illumina HISEQ Illumina HISEQ technology
- interacting loci of interest are already known.
- a significant difference in interacting loci may have been found between different patient groups (e.g., healthy subjects and subjects having a disease such as a tumor or a congenital disease).
- presence or absence of the two (or more) loci of interest can also be determined by specific PCR, or by otherwise specifically checking for their presence, e.g., by Southern blot or by Illumina HISEQ technology, after selection of nucleic acids covering locus of interest, e.g. via IDT target capture for next generation sequencing (IDT, Coralville, Iowa, USA).
- sGAM thus preferably combines ultracryosectioning with DNA detection (e.g. by whole genome amplification and next generation sequencing).
- DNA detection e.g. by whole genome amplification and next generation sequencing.
- loci that are closer to each other in the nuclear space are found together in the same section more often than distant loci (i.e. they co-segregate more frequently, FIG. 1 b ).
- the nuclear distance between genomic loci can then be inferred by scoring the presence or absence of loci among a number of sections through individual nuclei ( FIG. 1 c ).
- the resulting table can be used to compute the co-segregation frequency of each locus against every other locus ( FIG. 1 d ) to create a matrix of inferred relative distances between loci. Therefore GAM allows for the calculation of chromatin contacts genome wide.
- Co-segregation may be analysed with a statistical method to determine spatial proximity (e.g. Weibel, E. R., 1979. Stereological Methods: Practical Methods for Biological Morphometry. Vol. 1 Academic Press, London, UK; Weibel, E. R., 1980. Stereological Methods: Theoretical Foundations. Vol. 2. Academic Press, London, UK). Close spatial proximity can be a sign for specific interaction of loci. Specific interaction of loci may thus also be determined by analysing co-segregation with a statistical method.
- Statistical methods used in the method of the invention may be, e.g., inferential statistic methods.
- Statistical methods used in the examples may also be used in the method of the invention to analyse samples of different origin and/or for different loci of interest, e.g., as mentioned herein.
- the loci are determined to be proximal to each other, or to interact specifically, when they co-segregate at a frequency higher than expected from their linear genomic distance on a chromosome.
- Statistical methods can also differentiate between a specific interaction and a general condensation of chromatin and/or a reduction in nuclear volume, e.g., in a diagnostic setting.
- GAM may be used to determine relative distances. Absolute distances can be calculated by relating the relative distance to the size of the nucleus.
- GAM may be used to assess the radial position of loci of interest in the compartment of interest, e.g.
- sectioning yields equatorial sections with larger variety of DNA loci, and apical sections with lower variety of DNA loci, hence the radial position of the locus in the spherical compartment can be inferred from the complexity of DNA loci in the sections where it is detected.
- Alterations in radial positioning of DNA loci are associated with e.g. human disease (e.g. Maeburn K. J. et al. 2009 Disease-specific gene repositioning in breast cancer. J. Cell Biol. 187(6):801-12; Kubben N. et al. 2012. Mapping of lamin A- and progerin-interacting genome regions. Chromosoma 121(5): 447-64).
- GAM measures the frequency with which two loci co-segregate in the same nuclear profile, and can measure the co-segregation of all genomic loci simultaneously, producing quantitative information that is amenable to (a) the identification of genomic coordinates that more frequently interact with other genomic regions, but also (b) to a wide-range of mathematical treatments that calculate the probability of loci interacting above some random (expected) behaviour.
- GAM has the potential to identify loci with interactions significantly above random levels, by applying statistical models that distinguish non-random contacts from the expected random behavior of loci at a given genomic distance. This can be accomplished e.g. by the SLICE computational platform (StatisticaL Inference of locus Co-sEgregation; see FIG. 11 ). SLICE returns a matrix with the statistically significant direct interactions, taking into account random proximity effects as much as other effects, such as the different compaction levels found in different chromatin regions and chromosomal territories positions.
- SLICE also dissects the probability of a simultaneous, three-way interaction (triplets), and more generally multivalent contacts between several loci.
- SLICE analysis within the GAM pipeline can also be exploited to estimate the optimal values of the control parameters required to fine tune the experimental procedure to optimize costs and efficiency under the specific application of interest, such as the ideal section thickness and the minimal number of nuclear profiles per tube, the number of tubes required in order to achieve robust detection of chromatin interactions above given thresholds, taking into account the effects of window resolution and detectability.
- the simplest approach is to consider the random case in which loci at a given genomic distance are randomly distributed in 3D space, up to a maximum distance calculated from the assumption that chromatin is homogeneously distributed inside the nucleus.
- GAM and SLICE can take into consideration for example other spatial parameters, some of which can be measured experimentally or even be inferred from GAM data itself.
- the volume that a chromosome, a subchromosomal region or single locus occupies in the nucleus of interest is proportional to the frequency with each its loci are found in nuclear profiles (NPs).
- a plurality of loci means two or more loci, optionally, at least three, at least four, at least five, at least six, at least seven, at least eight, at least nine, at least ten, at least eleven, at least 12, at least 13, at least 15, at least 20, at least 30, at least 40, at least 50, at least 75, at least 100, at least 200, at least 500 or at least 1000 loci and up to several million or billion loci, which are analysed simultaneously. For example, allele specific analysis of a human cell at 5 kb resolution requires simultaneous analysis of 1.3 million loci. In one option, substantially all loci or all loci in a compartment are analysed with the method of the invention, e.g., by sequencing substantially all nucleic acids, preferably, all DNA, in the compartment.
- the loci to be analysed may be determined in a biased way (e.g. by choosing to analyse all 23000 protein coding genes in a human cell), or in an unbiased way, e.g. by dividing the genome into windows of a certain size, e.g., windows of 100 bp to 10 Mb, preferably, 1 kb to 1 Mb, 5 kb-50 kb, or 10 kb-30 kb windows.
- the method of the invention can be applied in a way which does not distinguish between different alleles (e.g. the two homologous copies of a gene present in a normal human cell), or, alternatively, it can be used to distinguish the two (or more, in the case of e.g. polyploid amphibian cells) alleles of a locus in the same cell.
- the method of the invention allows for the detection of multiple co-segregating loci, in particular, more than two co-segregating loci, preferably, more than three, more than four, more than 8, or more then 20, co-segregating loci.
- identification of multiple interactions using 3C-based methods has been attempted and shown to be both inefficient and highly biased (Sexton et al., 2012, Cell 148:458-72).
- restriction sites are not randomly distributed in the genome, leading to a bias in detection.
- the efficiency of ligation is affected by the different length of DNA fragments, which adds further bias to 3C-based results.
- the method of the invention is preferably not or not substantially affected by these biases ( FIG. 10 ).
- no restriction digest of nucleic acids is required in the GAM methods, which involve sectioning of the compartment.
- no ligation occurs between nucleic acids originally present in the compartment, in particular, no ligation has to be performed prior to step (b).
- ligation e.g., with external linkers is possible in the context of detection of the presence or absence of nucleic acid loci, e.g., for amplification or sequencing.
- the avoidance of both restriction digest and ligation of nucleic acids derived from the compartment with each other overcomes the structural bias of 3C-based methods.
- GAM is unique compared with competing technologies, as it can simultaneously identify all loci present in a given section (which would be technically impossible by FISH), and it can identify proximity of loci both when they are interacting and when they are not, together with detecting the multiplicity of loci interacting simultaneously, where there are more than three loci interacting at once (which is not possible by 3C-based methods). It is also one of the advantages of the method of the invention that it can be used to identify spatial proximity of loci which were not known before the method was carried out, i.e., interactions can be identified between newly discovered or non-defined loci. For example, the method of the invention can be used to identify all loci which interact with a specific locus of interest, wherein it is not required that any of these loci are known before the analysis is carried out.
- FISH Fluorescence In situ hybridization
- the ETS gene can be ERG, ETV1, ETV4, ETV5 and probably others (Brenner et al, 2009, Translocations in Epithelial Cancers. Biochimica Et Biophysica Acta 1796 (2): 201-15); and the ETS gene can be joined to TMPRSS2, SLC45A3, KLK2 and other genes (Brenner et al, 2009); and this can be achieved by various rearrangements (Clark et al, 2008, Complex Patterns of ETS Gene Alteration Arise During Cancer Development in the Human Prostate. Oncogene 27 (14): 1993-2003).
- ALK may be fused to many other genes including KIF5B, TFG, KLC1, PTPN3, and STRN (Hallberg & Palmer, 2013, Mechanistic Insight Into ALK Receptor Tyrosine Kinase in Human Cancer Biology. Nature Reviews Cancer 13 (10): 685-700), and there are other kinases that are fused, including ROS1, which is fused to at least 5 partners (Takeuchi et al 2012. RET, ROS1 and ALK Fusions in Lung Cancer. Nature Medicine 18 (3): 378-81).
- the present invention also provides the use of the method of the invention for
- the present invention thus also provides a method of diagnosing a disease associated with a disturbed co-segregation of loci in a patient, comprising, in a sample taken from said patient, analysing co-segregation of a plurality of loci in the patient, and comparing said co-segregation with co-segregation of said loci in a subject already diagnosed with said disease, wherein the co-segregation is preferably also compared with co-segregation in a healthy subject.
- co-segregation of loci may be compared between specific sub-groups of cells, which may be derived from the same patient, e.g., tumor cells and normal tissue.
- “a” is meant to refer to “at least one”, if not specifically mentioned otherwise.
- the present invention may be used to investigate a disturbed co-segregation of loci in a patient, i.e., chromatin misfolding, it may also contribute to treatment of patients having a disease associated with chromatin misfolding, as such patients may, after diagnosis with a method of the invention, be treated to correct chromatin misfolding (Deng et al., 2014, Curr Op Genet Dev. 25:1-7).
- human disease can be caused by “enhancer adoption”: the inappropriate localization of enhancers in close spatial proximity to genes that they do not normally regulate (Lettice et al., 2011, Hum Mutat. 32:1492-1499).
- the method of the invention may be used to investigate the spatial proximity of an enhancer in patient-derived tissues, in order to diagnose the patient with, for example, a particular subtype of cancer (Northcott et al. 2014, Nature 511:428-434).
- the method of the invention may be used to identify enhancers that have become localized proximal to the gene of interest and that therefore may present potential targets for therapeutic intervention.
- disease-associated genetic variants in coding regions of a given gene may lead to altered gene expression of that gene that confounds discovery of a mis-regulated chromatin contact which directly explain the disease phenotype, but is only uncovered by unbiased mapping of chromatin contacts (Smemo et al. 2014 Obesity-associated variants within FTO form long-range functional connections with IRX3. Nature 507, 371).
- the method of the invention can thus be used for diagnosis of, e.g., cancer or genetically predisposed obesity.
- the invention provides integrated genome-wide information about radial position, chromatin contacts, and chromatin compaction in one single embodiment, which has the potential of providing more refined predictive markers of disease state.
- the three parameters are studied independently using separate approaches. For example, locus-specific radial reposition of specific genomic loci has been identified in association with prostate cancer and/or hyperplasia which indicates locus-specific reorganisation during disease progression and the potential to stratify patients (Leshner M et al. 2015. Locus-specific gene repositioning in prostate cancer. Mol Biol Cell. 2015. pii: mbc.E15-05-0280. [Epub ahead of print]).
- Altered radial position of specific genomic loci has also been identified in human invasive breast cancer compared to normal breast tissue, which are independent of genomic instability (Meaburn K J et al. 2009 Disease-specific gene repositioning in breast cancer. J Cell Biol.; 187(6):801-12. doi: 10.1083/jcb.200909127). Altered chromatin contacts have also been found in association with different stages of breast cancer progression, such as decreased contacts between two different chromosomes, and between sub-chromosomal regions (Barutcu A R et al. 2015. Chromatin interaction analysis reveals changes in small chromosome and telomere clustering between epithelial and breast cancer cells. Genome Biol. 16(1):214. doi: 10.1186/s13059-015-0768-0).
- FIG. 1 Genome architecture mapping can measure nuclear proximity of loci by measuring their co-segregation in nuclear slices.
- Loci which are close along the linear genome may not be in close proximity in the nucleus, so methods are required to measure the distances between loci in the nuclear space.
- b When thin slices are taken through a nucleus (nuclear profiles or NP), loci which are closer together in the nuclear space are more frequently found in the same NP.
- c In principle, any method of DNA detection (PCR, next-generation sequencing etc.) can be used to score locus presence or absence in each NP.
- the co-segregation of loci can be used to generate co-segregation matrices, which indicate the nuclear distance between pairs of loci.
- FIG. 2 GAM independently reproduces features of genome architecture previously found in Hi-C studies.
- Sequencing tracks from individual NPs show patterns consistent with a chromatin fibre looping in and out of a thin slice, b,
- the sequencing depth obtained by multiplexing 48 NPs on a single 1 HISEQ lane is sufficient to saturate the detection of 30 kb windows in each sample.
- the percentage of genomic 30 kb windows identified in almost all NPs is within the range of the percentage of nuclear volumes expected from 220 nm slices of a 9 ⁇ diameter sphere, c, GAM and FISH show similar detection efficiencies of three ⁇ 40 kb regions in the HoxB locus, d, GAM and Hi-C identify similar A and B compartments by PCA at 1 Mb resolution (65% compartment overlap), e, GAM identifies topologically associating domains similar to those identified by Hi-C.
- FIG. 3 Interaction probability matrices extracted by a simple modelling approach are enriched for contacts between enhancers and active genes.
- Loci which are closer in nuclear space than expected by random chromatin folding can be modelled as a large population of cells in which the loci are distributed following the random case, and a small sub-population of cells which demonstrate a much closer interaction.
- This model assumes therefore a bi-modal distribution of nuclear distances.
- Modelling pairs of loci as mixtures of strongly interacting or randomly folded states identifies discrete interaction foci in the Pou5fl locus.
- a statistical enrichment for interactions within and between 30 kb windows overlapping enhancers or active genes was identified by calculating the mean interaction probability estimated with SLICE between all 30 kb windows overlapping two specific features (e.g. between all windows overlapping active genes and those overlapping enhancers) and comparing to the same value obtained after randomization of the matrix diagonals.
- FIG. 4 Limitations of current genome-wide methods for measuring chromatin contacts.
- the table lists the current genome-wide methods for measuring chromatin interactions and compares their various limitations. GAM suffers from few of the limitations that affect current genome-wide methods for mapping genome architecture.
- FIG. 5 Outline of the GAM method.
- GAM combines the existing technologies of cryosectioning, laser capture microdissection, whole genome amplification and next-generation sequencing in a novel sequence of steps.
- Cryosectioning produces a slice through a field of nuclei, with an extremely thin section thickness.
- c Individual NPs are identified and isolated from cryosections using laser capture microdissection.
- d Whole genome amplification is used to extract and amplify DNA from isolated NPs through microdissection.
- hgDNA human genomic DNA.
- Next generation sequencing identifies which loci of the mouse genome were present in each original NP. As expected from random sectioning, each NP contains a different complement of chromosomes and subchromosomal loci therein, and not all chromosomes are identified in each NP.
- FIG. 6 Quality control of the GAM dataset.
- a The percentage of reads mapped to the mouse genome and the total number of identified windows were found to be the best discriminator of negative controls. No batch effects were identified in these parameters between groups of NPs collected on the same day and processed together. NPs with ⁇ 15% reads mapped to the mouse genome were discarded before further processing.
- b Almost all genomic windows at resolutions from 30 kb to 1 Mb are detected in at least one NP (grey bars). Some windows have no defined sequence in the mm9 assembly (e.g. at centromeres) and therefore are not detected (black lines). The proportion of windows detected in at least one NP increases with decreasing genomic resolution (i.e. increased window size).
- c An average of 6% of each chromosome is found in single NPs, and this proportion is constant across chromosomes.
- FIG. 7 Normalization of co-segregation matrices to account for differences in locus detection frequency.
- FIG. 8 Four hundred and eight NPs are sufficient to extract most of the information about co-segregation of pairs of loci at 30 kb resolution.
- FIG. 9 GAM reproduces a significant depletion of off-diagonal contacts around previously identified TAD boundaries.
- Off-diagonal contacts were quantified as the mean normalized linkage in a 3 ⁇ 3 box moved at an offset of 2 from the matrix diagonal. This mean normalized linkage is lower around a TAD boundary identified by Hi-C (Dixon J. R. et al., 2012. Topological domains in mammalian genomes identified by analysis of chromatin interactions. Nature 485, 376-380).
- b The off-diagonal depletion was calculated for each TAD boundary in a previously published list of TAD boundaries in mouse ES cells (mESC), and the median depletion of these boundaries was found to be greater than that observed in any of 5000 randomly shuffled lists of TAD boundaries.
- c The profile of off-diagonal interactions averaged over all TAD boundaries shows a large depletion at the boundary. The largest depletion observed for 5000 lists of shuffled boundaries is shown for comparison.
- FIG. 10 Bias in the measurement of chromatin contact strength in Hi-C and GAM data, before and after normalization
- Raw Hi-C data displays a greater level of bias with respect to a, restriction site density, b, GC content, c, mappability, d, replication time and e, repeat coverage than raw GAM data.
- Normalization of Hi-C data ICE only partially removes biases, whilst biases in GAM data are effectively removed after normalization.
- For each potential source of bias we divided all 50 kb windows in the mouse genome into 10 equal groups (or 9 groups in the case of HindIII site density) based on the potential bias in question. The mean ⁇ upper and lower quartiles for each group are shown in the top left bar chart.
- FIG. 11 The SLICE statistical method for detecting significantly interacting locus pairs from GAM data
- SLICE Statistical Inference of Co-segregation
- SLICE derives the expected co-segregation frequency of a locus pair in the different cases; i.e., the probabilities that 0, 1 or 2 loci in a pair co-segregate when they are in an interacting (t 0 ,t 1 ,t 2 ) or non-interacting state (u 0 ,u 1 ,u 2 ).
- t 0 ,t 1 ,t 2 the probability that 0, 1 or 2 loci in a pair co-segregate when they are in an interacting
- u 0 ,u 1 ,u 2 non-interacting state
- the expected number of NPs can be derived as a function of Pi and compared with observed data, once the probabilities of the nucleus states P 2 , P 1 and P 0 have been defined.
- FIG. 12 Chromatin interactions identified by the SLICE statistical model include many different genomic features and extend over large genomic distances.
- a Number of significant interactions involving 30 kb windows either overlapping or not overlapping a gene.
- b Number of significant interactions by overlapping feature present in each window.
- c Genomic distances between pairs of windows with significant interactions by overlapping feature.
- d The statistical enrichment for interactions within and between 30 kb windows overlapping enhancers or active genes was reproduced without SLICE analysis by identifying the top 5% interacting pairs of loci at each genomic distance from normalized linkage disequilibrium matrices, and then counting the number of these interactions involving windows overlapping two specific features (e.g. the number of top 5% interactions identified between windows overlapping active genes and those overlapping enhancers). Enrichment was then calculated by comparing to the same value obtained after randomization of the interaction positions.
- FIG. 13 Significantly interacting locus pairs identified by SLICE co-segregate more frequently than non-interacting locus pairs across all genomic distances
- Mean co-segregation frequency of pairs of significantly interacting windows identified by SLICE (solid line) is consistently higher than the mean co-segregation frequency of non-interacting windows (dashed line) ⁇ standard deviation (hatched area) across a wide range of genomic distances.
- FIG. 14 Super-enhancers are highly enriched among the most highly interacting TAD triplets identified by GAM.
- a, 2D interaction matrices can show overlapping contacts between three regions, which can be incorrectly interpreted as a single simultaneous triplet interaction. With pairwise contact data alone, the simultaneous case is indistinguishable from separate pairwise events (or a complex mix of the two).
- b Strategy for identifying TADs most likely to be involved in truly simultaneous, three-way interactions. Bottom graph shows the final ranking of TAD triplets according to their triplet interaction score, and the position of the threshold above which TAD triplets were taken to be truly simultaneously interacting.
- c Example of a three-way interaction between TADs on chromosome 1. Matrix shows significant pairwise interactions over the entire region, insets show zoom of significant interactions between the three TADs. Classification of TADs is shown below.
- TAD triplets overlapping the genomic region shown. Each vertical line connects three TADs that are likely to interact simultaneously (based on their frequent co-segregation across the population of NPs).
- e Classification of TADs. TADs overlapping Super Enhancers are designated SE.
- SE Non-SE TADs are designated low transcription when their GRO-seq coverage is in the bottom 25% quartile, or high transcription when it is in the top 25%.
- f Genomic span of top 5% triplet interactions by TAD class.
- Top 5% triplets are highly enriched for TADs containing an SE region, and highly transcribed TADs, with interactions between three SE TADs being the single most enriched combination.
- FIG. 15 Analysis of TADs interacting in triplets.
- a Enrichment analysis as in FIG. 14 g additionally showing TADs not falling into any of the other classes (medium TADs).
- b Strategy for refining the discovery of specific binding sites by identifying average linkage at 5 kb resolution, within each 30 kb window. For each significant interaction identified by SLICE connecting 30 kb windows in the Active or Enhancer class, we asked whether specific sub-windows within the larger 30 kb window displayed the highest linkage with the partner 30 kb window. In particular, we were interested in asking whether e.g.
- Average three-way linkage to two other super-enhancer TADs forming a top triplet is enriched for the 40 kb window directly overlapping the super-enhancer compared to the 40 kb windows 120 kb upstream or downstream of the super-enhancer. This enrichment is not seen between a super-enhancer (SE) and two highly expressed (High) TADs forming a top triplet (dashed line), nor is it observed between a super-enhancer and two other super-enhancer TADs which are not involved in a top triplet (dotted line).
- SE super-enhancer
- High Highly expressed
- FIG. 16 GAM also provides information about locus radial positioning and compaction.
- a locus positioned centrally within the nucleus is more frequently found in equatorial NPs, which have a larger volume. In contrast, a locus positioned close to the nuclear periphery is more frequently found in apical sections, which have a smaller volume.
- the mean percentage of the genome covered per NP (as a proxy for NP volume) is negatively correlated with radial positioning in the five mouse autosomes for which radial position data is available.
- a more de-compacted locus with a larger volume is intersected more frequently (i.e. is detected in more NPs) than a corresponding compacted locus with a larger volume.
- Thin nuclear cryosections were produced in the absence of resin-embedding, by a modified Tokuyasu method (Tokuyasu, K. T., 1973, J. Cell Biol. 57, 551-65, A technique for ultracryotomy of cell suspensions and tissues; Guillot P V, Xie S Q, Hollinshead M, Pombo A (2004) Fixation-induced redistribution of hyperphosphorylated RNA polymerase II in the nucleus of human cells. Exp. Cell Res. 295, 460-468; Pombo A, Hollinshead M, Cook P R (1999) Bridging the resolution gap: Imaging the same transcription factories in cryosections by light and electron microscopy. J. Histochem. Cytochem.
- each NP contained a different complement of sub-chromosomal regions ( FIG. 5 a ), as expected from chromatin passing in and out of a thin nuclear slice. Furthermore, each NP contained only a restricted subset of chromosomes (on average, 7 chromosomes per NP; FIG. 5 e ).
- the mouse genome was divided into windows of equal size in order to measure their co-segregation.
- window size regular genomic windows over a range of sizes from 10 kb to 1 Mb were defined and an adaptation of previously described negative-binomial approaches was used to detect the presence of these windows in individual NPs.
- Sequential erosion of sequencing reads was used to determine the depth of sequencing required to saturate the detection of positive windows in each sample ( FIG. 2 b ). 600 k unique reads were sufficient to saturate the detection of 30 kb windows for >95% of tested samples, which allows multiplexing of 48 NPs on a single HISEQ lane.
- the frequency of detection of single loci was compared by GAM and Fluorescence In-Situ Hybridization (FISH) at ⁇ 40 kb resolution.
- FISH Fluorescence In-Situ Hybridization
- Three genomic windows across the HoxB locus were tested, and a remarkable agreement was found between FISH and GAM with a detection frequency of 7-12% for the three 40 kb windows in both methods ( FIG. 2 c ).
- the genome-wide frequency of locus detection was measured across the whole dataset of NPs. As expected, the distribution of locus detection frequencies is well approximated by a binomial distribution ( FIG. 7 a ).
- the GAM dataset was compared to a previously published Hi-C dataset from mESCs 7 . Visual comparisons revealed similar patterns in both datasets, particularly at smaller length scales ( FIG. 2 d,e ).
- the Hi-C and GAM datasets were correlated at 1 Mb resolution with an overall correlation coefficient of 0.63 and pairwise correlations between individual chromosomes ranging from 0.43 to 0.71 (Spearman's rank correlation coefficient).
- PCA principle components analysis
- the model was applied to estimate interaction matrices between couples of loci.
- a statistically determined threshold was then applied to the dataset to retain only those interactions which are of a high enough frequency to give statistical confidence.
- the SLICE model was used to identify all locus pairs that are more frequently positioned at short physical distances ( ⁇ 100 nm) in the nuclear space than expected for their genomic distance, and to estimate the frequency of locus interaction across the population of cells. 100 nm was chosen as a stringent distance for specific contacts, as recently measured by FISH (Williamson et al. 2014 58 ).
- Pi was estimated for all possible pairs of loci on the same chromosome. The inventors then selected only those loci with significant interactions, meaning those that had a Pi larger than would be expected by chance.
- the most significant interactions identified by SLICE correspond to locus pairs that most often co-segregate in the same slice ( FIG. 13 ). For example, loci separated by 10 Mb co-segregate in 5.3 out of 408 NPs on average (1.29%). In contrast, significantly interacting loci separated by 10 Mb co-segregate in 10.1 out of 408 NPs (2.47%).
- This approach yields interaction matrices with a much less homogenous pattern than that of either Hi-C or GAM co-segregation matrices ( FIG. 3 b ).
- the maps contain many more discrete spots, which may denote the specific bases (loci) of chromatin loops formed by interactions above the given threshold.
- SLICE was used to estimate the detection efficiency at different resolutions. This approach suggested that the detection efficiency is 80% at 30 kb resolution, confirms 30 kb as the optimal resolution for this dataset and agrees well with the estimate of efficiency from comparing GAM to cryoFISH.
- the model was also used to consider the possibility of cutting more than one NP into each tube and of cutting sections at a range of different thicknesses.
- One NP per tube at a thickness of 220 nm is optimal for the present purposes, but may not be the best choice for studying organisms with much larger or smaller nuclei, where more than one NP, preferably 2, 3 or more, could be simultaneously analysed in a single tube.
- mRNA-seq and ChIP-seq 11 in mESCs were used to divide genes into three classes: active (FPKM>1), Polycomb repressed (FPKM ⁇ 1, H3K27me3+ and/or H3Aub1+) or inactive (FPKM ⁇ 1, no H3K27me3 or H3Aub1).
- active FPKM>1
- Polycomb repressed FPKM ⁇ 1, H3K27me3+ and/or H3Aub1+
- inactive FPKM ⁇ 1, no H3K27me3 or H3Aub1
- a list of predicted enhancers was also included from a previous study 12 . All 30 kb windows which overlapped with a gene or enhancer were scored, and the number of significant interactions between different gene/enhancer categories was compared with random expectation. It was found that the interaction matrices contained an especially high number of significant interactions within and between the active gene and enhancer categories ( FIG. 3 c ).
- GAM has the potential to capture many additional aspects of chromatin spatial organization genome-wide, such as multivalent chromatin interactions (interactions involving two, three or more genomic regions), radial distributions of chromosomes and sub-chromosomal regions and chromatin compaction.
- the inventors showed that the mESC-400 dataset already held enough information to reveal multivalent interactions between 3 or more loci.
- Detailed analyses of GAM statistics indicate that the current mESC-400 dataset allows detection of triplet contacts at the resolution of hundreds of kilobases, which corresponds to the chromatin organization level of TADs.
- Pairwise contact matrices cannot distinguish simultaneous triplet interactions from independent pairwise events that do not occur in the same cell ( FIG. 14 a ).
- the inventors extended SLICE to consider triplets, and calculated the probability of a simultaneous, three-way interaction (Pi 3 ) at the same stringent spatial distance of ⁇ 100 nm, for all possible combinations windows within three TADs ( FIG. 14 b ). They considered only triplets of TADs that were connected by significant pairwise interactions and used 40 kb windows to match resolution with published TAD definitions (Dixon et al., 2012)(Methods). Then, candidate TAD triplets were ranked by the mean Pi 3 of their constituent 40 kb windows ( FIG. 14 c , FIG. 15 a ) and the top 5% TAD triplets with the highest interaction scores retained. These top 5% represent 170,000 highly interacting triplets across the mouse autosomes ( FIG. 14 d ).
- TADs that did not contain SEs were subdivided according to their level of transcription using a published Genome Run-On (GRO-seq) dataset (Min et al., 2011), as a measure of transcriptional activity ( FIG. 14 e ).
- GRO-seq Genome Run-On
- the inventors find that SEs, low-transcribed and highly-transcribed TADs are present in the set of most highly interacting triplets over a large range of genomic distances (for example, of 41982 triplets involving SEs, 19% span genomic distances of less than 30 Mb and 81% span between 30 and 116 Mb ( FIG. 14 f ).
- the inventors also find enrichments for triplets formed between highly transcribed TADs, or combinations of SE and highly-transcribed TADs, consistent with previous observations that active genes co-localize (Pombo et al., 1999; Osborne et al., 2004). In contrast, triplets composed of the least transcribed TADs occur less often than expected by chance, which is likely a consequence of their preferential association with the nuclear lamina (Peric-Hupkes et al., 2010) ( FIG. 14 h ).
- GAM holds the power to explore additional spatial features of chromatin organization in the 3D nuclear space.
- the inventors exploited two stereological applications of the GAM method using the mESC-400 dataset.
- the DNA content of NPs originated from different latitudes of the nucleus can be used to estimate radial distributions of genomic regions.
- NPs cut through nuclei close to their periphery contain, by definition, a smaller proportion of the nuclear volume (or DNA content; Branco et al., 2008) than equatorial NPs ( FIG. 16 a ).
- the percentage of the genome covered by each NP could be used as a proxy for its latitude relative to the most equatorial NPs. Indeed, the inventors find that the frequency with which chromosomes are detected in smaller NPs correlates with their radial position (as previously measured for five chromosomes in mESCs (Mayer et al., 2005)), with lower average DNA content corresponding to more peripheral positions ( FIG. 16 b ).
- the inventors further explored a more local feature of chromatin folding, which can in principle also be assessed by GAM.
- the inventors reasoned that de-condensed genomic loci will occupy larger volumes (or adopt more elongated conformations) than more condensed loci. More de-condensed loci should therefore be intersected more frequently (and be detected more frequently in randomly-oriented nuclear profiles) than smaller or more spherical loci ( FIG. 16 c ).
- De-condensed chromatin ought to be more accessible to enzymatic cleavage, e.g.
- GAM is a novel, ligation-free method for capturing chromatin contacts in an unbiased manner, independent of all other current technologies used to measure 3D genome topology and positioning.
- GAM uncovers a complex organization of the 3D structure of chromatin in mESCs, where functional genomic regions underlie specific chromatin contacts. Especially notable is the enrichment for pairwise chromatin interactions within and between enhancer elements and transcribed regions.
- the identification of abundant three-way interactions between TADs, where multiple strong enhancers and highly transcribed regions associate simultaneously in the same nucleus, reveals that regulatory elements form higher-order contacts across large genomic regions.
- proximity to the nuclear lamina appears to curb the formation of higher complexity contacts involving highly transcribed TADs, either by restricting access to more central enhancer clusters or by limiting the surface available for the formation of multiple contacts.
- the results obtained by GAM independently verify findings made using other methods, including the identification of preferentially self-associating genomic regions (TADs) by 5C/Hi-C and the observed clustering of chromatin bound by the transcription factor Sox2 (an enhancer marker) in live-cell imaging.
- TADs preferentially self-associating genomic regions
- Sox2 an enhancer marker
- SLICE provides a general statistical model for GAM that can extract quantitative information about chromatin interactions from GAM datasets. This permits identification of prominent pairwise and three-way contacts taking into account genomic distance. With larger GAM datasets, SLICE can be extended to integrate different nuclear or chromosome shapes or volumes, association to the nuclear periphery and other features of nuclear architecture, to enhance the detection of specifically interacting chromatin regions at high resolution.
- GAM can direct these analyses to rare cell types specifically selected by microdissection from precious tissue samples, for example those obtained from biopsies of individual patients.
- GAM should be compatible with simultaneous detection of specific chromatin contacts and active transcription in single cells (Dey et al., 2015. Integrated genome and transcriptome sequencing of the same cell. Nature Biotechnology, 33(3): 285-289), which will be crucially important for dissecting causal relationships.
- GAM adds a powerful new tool to the genome biologist's repertoire and significantly expands our ability to finely dissect three dimensional chromatin structures, rendering many previously unanswerable questions experimentally tractable in a wider range of model systems, cell types and valuable human samples.
- GAM's unique suitability to study chromosome folding in rare cell types will be invaluable in dissecting the role of natural sequence variation in human disease.
- mice ES cells used for this example were the 46C line 13 , a Sox1-GFP derivative of E14tg2a and gift of Domingos Henrique (Institute of Molecular Medicine, Lisbon, Portugal).
- mESC culture was carried out as previously described 14 . Briefly, cells were grown at 37° C. in a 5% CO 2 incubator in Glasgow Modified Eagles Medium, supplemented with 10% fetal bovine serum, 2 ng/ml LIF and 1 mM 2-mercaptoethanol, on 0.1% gelatin-coated dishes. Cells were passaged every other day. After the last passage 24 h before harvesting, mESCs were re-plated in serum-free ESGRO Complete Clonal Grade medium (Millipore Inc.). Other cells may be used instead.
- the cells were prepared for cryosectioning as described previously 2 . Briefly, cells were fixed in 4% and 8% paraformaldehyde in 250 mM HEPES-NaOH (pH 7.6; 10 min and 2 h, respectively), pelleted, embedded (2 h) in 2.1 M sucrose in PBS and frozen in liquid nitrogen. Frozen cells may be stored in liquid nitrogen indefinitely. Ultrathin cryosections were cut using an UltraCut UCT 52 ultracryomicrotome (Leica, Milton Keynes, UK) at around 220 nm thickness. Sections were captured in sucrose solution drops and transferred to 1 mm-thick PEN membrane covered glass slides for laser microdissection (Leica, Milton Keynes, UK).
- NPs Individual NPs were isolated from the cryosection by laser microdissection using a PALM Microbeam Laser microdissection microscope (Carl Zeiss, Jena, Germany). Nuclei were identified under bright-field imaging and the laser was used to cut the slide membrane surrounding each nucleus. Cut NPs were then catapulted using the Laser Pressure Catapult into a PCR Cap Strip filled with opaque adhesive material. One well in each strip of eight was left empty and taken through the WGA process as a negative control. Five of these negative controls were also used to make sequencing libraries for quality control purposes ( FIG. 6 a ).
- the PCR plate was left to cool at room temperature for 5 min, before it was inverted and centrifuged at 800 ⁇ g for 3 min.
- the plate was heat-inactivated at 99° C. for 4 min in a PCR machine and cooled on ice for 2 min.
- 2.9 ⁇ l 1 ⁇ single cell library preparation buffer and 1.4 ⁇ l library stabilisation solution were added to each well and the plate was incubated at 95° C. for 4 min, before cooling on ice for 2 min.
- 1.4 ⁇ l of library preparation enzyme was added to each reaction, then the plate was incubated on a PCR machine at 16° C. for 20 min, 24° C. for 20 min, 37° C. for 20 min and finally 75° C. for 5 min.
- the PCR plate was centrifuged at 800 ⁇ g for 3 min. 10 ⁇ amplification master mix (10.8 ⁇ l), water (69.8 ⁇ l) and WGA DNA Polymerase (7.2 ⁇ l) were added to each well and the sample was PCR amplified using the program provided by the supplier.
- WGA amplified DNA was purified using a Qiagen MinElute PCR Purification Kit and eluted in 50 ⁇ l of the provided elution buffer. The concentration of each sample was measured by PicoGreen quantification. Sequencing libraries were then made using either the Illumina TruSeq DNA HT Sample Prep Kit or the TruSeq Nano DNA HT kits. In both cases, samples were made up to 55 ⁇ l with resuspension buffer. For the DNA HT kits, a maximum of 1.1 ⁇ g DNA was added to each reaction, whereas for the Nano kits, a maximum of 200 ng was used.
- library concentrations were estimated using a Qubit 2.0 fluorometer (Thermo Fisher Scientific, Waltham, Mass., USA) and libraries were pooled together in batches of 96. Each library pool was sequenced in a single end, 100 bp run on two lanes of an Illumina HISEQ machine in rapid-run mode. Due to the presence of the 30 bp WGA adaptor at both ends of every read, the first 30 bp of each run were performed without imaging the flow cell (these are known as dark cycles) using a custom run recipe provided by Illumina.
- the mouse genome was split into equal size windows using bedtools 16 , and bedtools multibamcov was used to calculate the number of reads in each nuclear profile which overlapped each genomic window.
- the Pandas and NumPy python packages 17 were used to calculate a histogram from the number of reads overlapping each window, and the fmin function from SciPy was used to fit a negative binomial distribution (representing sequencing noise) and a lognormal distribution (representing true signal) to the depth histogram.
- a threshold number of reads x was determined, where the probability of observing more than x reads mapping to a single genomic window was less than 0.001. Such a threshold was thus independently determined for each sample, and windows were scored as positive if the number of sequenced reads was greater than the determined threshold.
- NumPy was used to erode reads from the matrix of read depths per window per sample. Thirteen new matrices were produced with erosion rates from 10% to 95%, and positive windows were called for each of the eroded datasets. Each sample was compared across the eroded datasets to obtain a saturation curve, where the number of positive windows identified is plotted against the percentage of reads remaining after erosion. Samples were classified as saturated or unsaturated by splitting the saturation curves into two parts and comparing a linear regression of the two parts to a linear regression on the whole curve. The putative saturation point was defined as the point where the mean of the R-squared values from the two-part fit was highest.
- Samples were classified as saturated if the gradient of the second of the two parts was less than the gradient of the first (i.e. if the number of additional positive windows identified increased more slowly at higher read depths) and if the mean R-squared of the two-part fit was more than 0.25 greater than the R-squared of the linear fit against the whole curve (i.e. if the curve differed significantly from a straight line).
- DNA FISH was performed as previously described 18 .
- Mouse ES-OS25 cells (kindly provided by W. Bickmore) were grown as previously described 36 .
- the HoxB13, HoxB1-3 and Skap1 loci were detected with fosmid probes (G135P6799B3, G135P67637D6 and G135P60674A4, respectively).
- Fosmid probes were obtained from BACPAC Resources (California, USA). The specificity of fosmid probes was confirmed by PCR using specific primers (not shown).
- Probes were labelled with digoxigenin-11-dUTP, fluorescein-12-dUTP or tetramethyl-rhodamine-5-dUTP by nick translation (Roche), and separated from unincorporated nucleotides using MicroBioSpin P-30 chromatography columns (BioRad, Hertfordshire, UK).
- the signal of rhodamine-labelled probes was amplified with rabbit anti-rhodamine antibodies (2 h; 1:500; Invitrogen) and Cyanine3-conjugated donkey antibodies against rabbit IgG (1 h; 1:1000; Jackson ImmunoResearch Laboratories).
- Probes labelled with digoxigenin were detected with sheep anti-digoxigenin Fab fragments (2 h; 1:200; Roche) and AlexaFluor555 donkey antibodies against sheep IgG (1 h; 1:1000; Invitrogen).
- Probes labelled with FITC were detected with mouse antibodies against FITC (1 h, 1:500; Jackson ImmunoResearch Laboratories) and AlexaFluor488 donkey antibodies against mouse IgG (1 h, 1:1000; Invitrogen). Nuclei were stained with DAPI and coverslips were mounted with VectaShield (Vector Laboratories) before imaging.
- Images were acquired on a confocal laser-scanning microscope (Leica TCS SPS; 63 ⁇ oil objective, NA 1.4) equipped with a 405 nm diode, and Argon (488 nm), HeNe (543 nm) and HeNe (633 nm) lasers, using pinhole equivalent to 1 Airy disk. Images from different channels were collected sequentially to prevent fluorescence bleedthrough. Raw images (TIFF files) were merged in ImageJ and contrast stretched without thresholding in Adobe Photoshop.
- the genomic windows from each sample that overlap the region of interest were first extracted.
- the co-segregation is the number of nuclear profiles in which both windows are scored as positive divided by the total number of nuclear profiles.
- Linkage disequilibrium (D) and normalized linkage disequilibrium (D′) are calculated as previously defined 6 .
- the linkage between two genomic windows A and B is defined as the co-segregation of A and B (see above) minus the product of their marginal detection frequencies.
- the marginal detection frequency of A is simply the number of nuclear profiles in which A is detected divided by the total number of nuclear profiles.
- the normalized linkage between two genomic windows A and B is defined as the linkage of A and B divided by the maximum possible linkage between A and B (Dmax).
- Dmax is calculated as min((marg(A)*(1 ⁇ marg(B))), (marg(B)*(1 ⁇ marg(A)))), where marg(A) is the marginal detection frequency of A. If linkage ⁇ 0, Dmax is calculated as min((marg(A)*marg(B)), ((1 ⁇ marg(A))*(1 ⁇ marg(B)))).
- marg(A) is the marginal detection frequency of A.
- Heatmaps of linkage between all regions on the same chromosome were calculated from linkage matrices L(i,j) where each entry is the normalized linkage of i and j. These calculations can be trivially extended to consider any number of loci. For example, linkage between three loci is calculated as the co-segregation of A, B and C minus the products of the marginal detection frequencies of A, B and C.
- Compartments A and B were calculated for GAM and Hi-C according to the previously published method 8,23 .
- Each chromosome is represented as a matrix O(i,j) where each entry records the observed interactions between locus i and locus j.
- a new matrix E(i,j) was generated where each entry is the mean number of interactions for all positions in matrix O with the same distance between i and j.
- O was divided by E to give K(i,j) a matrix of observed over expected values.
- the final matrix C(i,j) was then calculated, where each position is the correlation between column i and column j of matrix K.
- a principle components analysis was conducted on the correlation matrix C and the three components that explain the most variance were then extracted. Of these three components, the one with the best correlation to GC content is used to define the A and B compartments.
- the list of topologically associating domain boundaries was obtained from a previous study in mESCs 7 .
- the mean normalized linkage disequilibrium was measured in a 3 ⁇ 3 box moved at an offset of two windows from the diagonal of the linkage matrix as a measure of off-diagonal interactions.
- the depletion of off-diagonal interactions was measured for these previously defined boundaries in the dataset. The statistical significance of this depletion was assessed by comparing the observed off-diagonal depletion with the depletion measured from 5000 randomly shuffled sets of TADs.
- the ratio between the number of tubes containing two loci and the number of tubes containing at least one member of a locus pair was measured for all pairs of 30 kb windows in the mouse genome. The average of this ratio over all pairs of loci at the same genomic distance was then taken, calculated separately for each chromosome. By comparing this genomic average to the observed ratio for each individual locus pair, it was possible to identify pairs of loci which co-segregate more frequently than the average pair of loci at the same distance on the same chromosome. A mathematical model was used to estimate the fraction of cells which would need to have a close ( ⁇ 100 nm) interaction in order to give the observed value of the ratio. Then any loci pairs in which the observed ratio was within the 95 th percentile of the ratio expected for non-interacting loci at that genomic distance were discarded.
- TADs were first identified where all three TADs displayed significant pairwise interactions identified by SLICE. For all such triplets, the Pi 3 of all the 40 kb windows making up the TADs were calculated using SLICE. 40 kb windows were used here as the TAD positions in Dixon et al. (2012) are given at 40 kb resolution. Finally, all triplets were ranked by their mean Pi 3 and the top 5% selected for enrichment analysis. TADs were assigned as SE TADs if they overlapped any previously identified super-enhancers (SEs; Whyte et al., 2013).
- TADs not overlapping SEs were classified as low-transcription or high-transcription if they had GRO-seq coverage below the first or above the third quartile respectively.
- TADs in the middle two quartiles of coverage were classified as medium-transcription.
- Enrichment was calculated as the observed number of each TAD triplet class (e.g. SE/SE/SE) divided by the mean over 500 randomly permuted lists of TAD triplets, and was called as significant if the observed count was greater than or smaller than all of the randomly permuted values.
- TADs were categorized into most (top 15%) and least (bottom 15%) triplet forming in accordance to the number of triplets in the top 5% that contained the TAD.
- the distances of TADs in each category to LADs were calculating using the closestBED tool (Quinlan et al., 2010).
- each row represents a single interaction between two 30 kb windows and the columns represent the linkage for the 5 kb window of interest ⁇ three 5 kb windows upstream/downstream.
- each row was divided by its own mean.
- the mean of each column was taken to obtain the average linkage at each distance from the 5 kb window of interest.
- these mean values were divided by the mean of the first and last column to obtain the average enrichment at the TSS relative to 15 kb upstream/downstream.
- non-interacting (SLICE p-value >0.05) 30 kb window pairs comprising the same features (enhancer, TSS, TES) were used.
- the true interactions were sorted into 10 bins by their genomic distance and the control group was randomly reduced so that bin counts for each genomic distance range were the same.
- each chromosome was calculated as the mean number of reads per Mb for each NP. For each chromosome, every NP in which that chromosome was in the top quartile of coverage was taken and the percentage of all genomic 1 Mb windows that were positive calculated.
- the percentage coverage of an NP is a measure of its radius (Branco et al., 2008), and therefore the mean percentage coverage of NPs containing a given chromosome is a measure of the preference of that chromosome to appear in NPs with a large radius (as is expected of more centrally positioned chromosomes).
- the inventors correlated the mean percentage coverage of NPs containing chromosomes 1,2,9,11 and 14 with their radial position, previously measured in Mayer et al. (2005), and found a tendency for more peripheral chromosomes to be found in NPs with lower genomic coverage.
- the mouse genome was divided into 30 kb windows and the number of NPs where each window was detected calculated (its detection frequency). This value was correlated with the mean coverage of a previously published GRO-seq dataset (Min et al., 2011) and with the mean coverage of DNAse-seq (a measure of chromatin openness at the nucleosome level; Yue, F. et al. 2014. Nature 515, 355-364). over each 30 kb window
Landscapes
- Life Sciences & Earth Sciences (AREA)
- Health & Medical Sciences (AREA)
- Chemical & Material Sciences (AREA)
- Engineering & Computer Science (AREA)
- Bioinformatics & Cheminformatics (AREA)
- Genetics & Genomics (AREA)
- Physics & Mathematics (AREA)
- Organic Chemistry (AREA)
- Biotechnology (AREA)
- Proteomics, Peptides & Aminoacids (AREA)
- General Health & Medical Sciences (AREA)
- Analytical Chemistry (AREA)
- Molecular Biology (AREA)
- Biophysics (AREA)
- Zoology (AREA)
- Wood Science & Technology (AREA)
- General Engineering & Computer Science (AREA)
- Spectroscopy & Molecular Physics (AREA)
- Evolutionary Biology (AREA)
- Medical Informatics (AREA)
- Theoretical Computer Science (AREA)
- Bioinformatics & Computational Biology (AREA)
- Biomedical Technology (AREA)
- Microbiology (AREA)
- Biochemistry (AREA)
- Immunology (AREA)
- Ecology (AREA)
- Physiology (AREA)
- Crystallography & Structural Chemistry (AREA)
- Plant Pathology (AREA)
- Measuring Or Testing Involving Enzymes Or Micro-Organisms (AREA)
Applications Claiming Priority (4)
| Application Number | Priority Date | Filing Date | Title |
|---|---|---|---|
| EP14197405.5 | 2014-12-11 | ||
| EP14197405 | 2014-12-11 | ||
| EP14197405.5A EP3031929A1 (en) | 2014-12-11 | 2014-12-11 | Genome architecture mapping |
| PCT/EP2015/079413 WO2016092070A1 (en) | 2014-12-11 | 2015-12-11 | Genome architecture mapping |
Publications (2)
| Publication Number | Publication Date |
|---|---|
| US20170342462A1 US20170342462A1 (en) | 2017-11-30 |
| US10526639B2 true US10526639B2 (en) | 2020-01-07 |
Family
ID=52102530
Family Applications (1)
| Application Number | Title | Priority Date | Filing Date |
|---|---|---|---|
| US15/533,890 Active US10526639B2 (en) | 2014-12-11 | 2015-12-11 | Genome architecture mapping |
Country Status (8)
| Country | Link |
|---|---|
| US (1) | US10526639B2 (ja) |
| EP (2) | EP3031929A1 (ja) |
| JP (1) | JP6837970B2 (ja) |
| CN (1) | CN107406873B (ja) |
| CA (1) | CA2968629C (ja) |
| DK (1) | DK3230465T3 (ja) |
| IL (1) | IL252591B (ja) |
| WO (1) | WO2016092070A1 (ja) |
Cited By (1)
| Publication number | Priority date | Publication date | Assignee | Title |
|---|---|---|---|---|
| WO2021167986A1 (en) | 2020-02-17 | 2021-08-26 | 10X Genomics, Inc. | In situ analysis of chromatin interaction |
Families Citing this family (7)
| Publication number | Priority date | Publication date | Assignee | Title |
|---|---|---|---|---|
| CN110691792A (zh) | 2017-01-10 | 2020-01-14 | 朱诺治疗学股份有限公司 | 细胞疗法的表观遗传学分析及相关方法 |
| EP3580338B1 (en) * | 2017-02-10 | 2024-09-11 | The Rockefeller University | Methods for cell-type specific profiling to identify markers for nuclei isolation |
| CN108647492B (zh) * | 2018-05-02 | 2019-04-16 | 中国人民解放军军事科学院军事医学研究院 | 一种染色质拓扑相关结构域的表征方法及装置 |
| CN109448783B (zh) * | 2018-08-07 | 2022-05-13 | 清华大学 | 一种染色质拓扑结构域边界的分析方法 |
| AU2021258994A1 (en) * | 2020-04-23 | 2022-11-03 | Koninklijke Nederlandse Akademie Van Wetenschappen | Structural variation detection in chromosomal proximity experiments |
| EP3988669A1 (en) * | 2020-10-22 | 2022-04-27 | Max-Delbrück-Centrum für Molekulare Medizin in der Helmholtz-Gemeinschaft | Method for nucleic acid detection by oligo hybridization and pcr-based amplification |
| CN115050417B (zh) * | 2022-06-27 | 2024-07-19 | 华南农业大学 | 一种基于染色质随机折叠过程预测染色质域结构tad的方法 |
Citations (2)
| Publication number | Priority date | Publication date | Assignee | Title |
|---|---|---|---|---|
| US20010051344A1 (en) * | 1994-06-17 | 2001-12-13 | Shalon Tidhar Dari | Methods for constructing subarrays and uses thereof |
| WO2007004057A2 (en) | 2005-07-04 | 2007-01-11 | Erasmus University Medical Center | Chromosome conformation capture-on-chip (4c) assay |
Family Cites Families (5)
| Publication number | Priority date | Publication date | Assignee | Title |
|---|---|---|---|---|
| GB0810051D0 (en) * | 2008-06-02 | 2008-07-09 | Oxford Biodynamics Ltd | Method of diagnosis |
| WO2010065266A1 (en) * | 2008-12-02 | 2010-06-10 | Bio-Rad Laboratories, Inc. | Chromatin structure detection |
| CN104169433A (zh) * | 2011-02-04 | 2014-11-26 | 宾夕法尼亚大学董事会 | 在单细胞中同时检测染色体结构和基因表达的方法 |
| US20140073520A1 (en) * | 2011-12-23 | 2014-03-13 | California Institute Of Technology | Imaging chromosome structures by super-resolution fish with single-dye labeled oligonucleotides |
| EP4321628A3 (en) * | 2013-05-23 | 2024-04-24 | The Board of Trustees of the Leland Stanford Junior University | Transposition into native chromatin for personal epigenomics |
-
2014
- 2014-12-11 EP EP14197405.5A patent/EP3031929A1/en not_active Withdrawn
-
2015
- 2015-12-11 JP JP2017531604A patent/JP6837970B2/ja active Active
- 2015-12-11 WO PCT/EP2015/079413 patent/WO2016092070A1/en active Application Filing
- 2015-12-11 CN CN201580067332.4A patent/CN107406873B/zh active Active
- 2015-12-11 US US15/533,890 patent/US10526639B2/en active Active
- 2015-12-11 DK DK15808219.8T patent/DK3230465T3/da active
- 2015-12-11 CA CA2968629A patent/CA2968629C/en active Active
- 2015-12-11 EP EP15808219.8A patent/EP3230465B1/en active Active
-
2017
- 2017-05-30 IL IL252591A patent/IL252591B/en unknown
Patent Citations (3)
| Publication number | Priority date | Publication date | Assignee | Title |
|---|---|---|---|---|
| US20010051344A1 (en) * | 1994-06-17 | 2001-12-13 | Shalon Tidhar Dari | Methods for constructing subarrays and uses thereof |
| WO2007004057A2 (en) | 2005-07-04 | 2007-01-11 | Erasmus University Medical Center | Chromosome conformation capture-on-chip (4c) assay |
| JP2009500031A (ja) | 2005-07-04 | 2009-01-08 | エラスムス ユニバーシティ メディカル センター | 染色体コンフォメーションキャプチャ−オン−チップ(4c)アッセイ |
Non-Patent Citations (75)
Cited By (1)
| Publication number | Priority date | Publication date | Assignee | Title |
|---|---|---|---|---|
| WO2021167986A1 (en) | 2020-02-17 | 2021-08-26 | 10X Genomics, Inc. | In situ analysis of chromatin interaction |
Also Published As
| Publication number | Publication date |
|---|---|
| CA2968629C (en) | 2023-01-03 |
| CA2968629A1 (en) | 2016-06-16 |
| CN107406873A (zh) | 2017-11-28 |
| CN107406873B (zh) | 2021-07-09 |
| IL252591B (en) | 2022-01-01 |
| IL252591A0 (en) | 2017-07-31 |
| WO2016092070A1 (en) | 2016-06-16 |
| EP3230465B1 (en) | 2019-10-16 |
| DK3230465T3 (da) | 2020-01-27 |
| EP3230465A1 (en) | 2017-10-18 |
| JP2017537640A (ja) | 2017-12-21 |
| JP6837970B2 (ja) | 2021-03-03 |
| EP3031929A1 (en) | 2016-06-15 |
| US20170342462A1 (en) | 2017-11-30 |
Similar Documents
| Publication | Publication Date | Title |
|---|---|---|
| US10526639B2 (en) | Genome architecture mapping | |
| US11680253B2 (en) | Transposase-mediated imaging of the accessible genome | |
| Hansen et al. | Distinct classes of chromatin loops revealed by deletion of an RNA-binding region in CTCF | |
| US11519032B1 (en) | Transposition of native chromatin for personal epigenomics | |
| Beagrie et al. | Complex multi-enhancer contacts captured by genome architecture mapping | |
| Díaz et al. | Chromatin conformation analysis of primary patient tissue using a low input Hi-C method | |
| Zoch et al. | SPOCD1 is an essential executor of piRNA-directed de novo DNA methylation | |
| Murphy et al. | Placeholder nucleosomes underlie germline-to-embryo DNA methylation reprogramming | |
| Troll et al. | Structural variation detection by proximity ligation from formalin-fixed, paraffin-embedded tumor tissue | |
| WO2016156469A1 (en) | Genome architecture mapping on chromatin | |
| Biernacka et al. | High-resolution, ultrasensitive and quantitative DNA double-strand break labeling in eukaryotic cells using i-BLESS | |
| Marti-Marimon et al. | Major reorganization of chromosome conformation during muscle development in pig | |
| Jansz et al. | Long-range chromatin interactions on the inactive X and at Hox clusters are regulated by the non-canonical SMC protein Smchd1 | |
| Troll et al. | Structural variation detection by proximity ligation from FFPE tumor tissue | |
| Darbellay et al. | Pre-hypertrophic chondrogenic enhancer landscape of limb and axial skeleton development | |
| Cheblal | Chromatin Dynamics In Homology Directed Repair | |
| Darbellay et al. | Chondrogenic Enhancer Landscape of Limb and Axial Skeleton Development | |
| Kurihara et al. | Genomic profiling of PML bodies reveals transcriptional regulation by PML bodies through the DNMT3A exclusion | |
| Adalsteinsson | Genome sequencing and phenotypic analysis of single cells in cancer |
Legal Events
| Date | Code | Title | Description |
|---|---|---|---|
| AS | Assignment |
Owner name: CAMBRIDGE ENTERPRISE LIMITED, UNITED KINGDOM Free format text: ASSIGNMENT OF ASSIGNORS INTEREST;ASSIGNOR:EDWARDS, PAUL;REEL/FRAME:043962/0701 Effective date: 20170711 Owner name: MAX-DELBRUECK-CENTRUM FUER MOLEKULARE MEDIZIN IN D Free format text: ASSIGNMENT OF ASSIGNORS INTEREST;ASSIGNORS:POMBO, ANA;NICODEMI, MARIO;SCIALDONE, ANTONIO;AND OTHERS;SIGNING DATES FROM 20170719 TO 20170727;REEL/FRAME:043962/0688 |
|
| STPP | Information on status: patent application and granting procedure in general |
Free format text: RESPONSE TO NON-FINAL OFFICE ACTION ENTERED AND FORWARDED TO EXAMINER |
|
| STPP | Information on status: patent application and granting procedure in general |
Free format text: FINAL REJECTION MAILED |
|
| STPP | Information on status: patent application and granting procedure in general |
Free format text: RESPONSE AFTER FINAL ACTION FORWARDED TO EXAMINER |
|
| STPP | Information on status: patent application and granting procedure in general |
Free format text: NOTICE OF ALLOWANCE MAILED -- APPLICATION RECEIVED IN OFFICE OF PUBLICATIONS |
|
| STPP | Information on status: patent application and granting procedure in general |
Free format text: AWAITING TC RESP, ISSUE FEE PAYMENT RECEIVED |
|
| STPP | Information on status: patent application and granting procedure in general |
Free format text: PUBLICATIONS -- ISSUE FEE PAYMENT VERIFIED |
|
| STCF | Information on status: patent grant |
Free format text: PATENTED CASE |
|
| CC | Certificate of correction | ||
| MAFP | Maintenance fee payment |
Free format text: PAYMENT OF MAINTENANCE FEE, 4TH YR, SMALL ENTITY (ORIGINAL EVENT CODE: M2551); ENTITY STATUS OF PATENT OWNER: SMALL ENTITY Year of fee payment: 4 |