SEQUENCE LISTING
The instant application contains a Sequence Listing which has been submitted electronically in ASCII format and is hereby incorporated by reference in its entirety. Said ASCII copy, created on Apr. 6, 2018, is named Voss-0066-D01_SL.txt and is 24,408 bytes in size.
FIELD OF THE INVENTION
The present invention is in the field of clinical diagnostics. Particularly the present invention relates to outcome prognosis and risk assessment in stroke patients by determination of the level of marker peptides.
BACKGROUND OF THE INVENTION
Stroke is defined as an acute focal neurological deficit resulting from a cerebrovascular disease. The two main types of stroke are ischemic and hemorrhagic, accounting for approximately 85% and 15%, respectively (Hickey 2003. The clinical practice of neurological and neurosurgical nursing (5th ed.). Philadelphia: Lippincott, Williams & Wilkins). When an ischemic stroke occurs, the blood supply to the brain is interrupted, and brain cells are deprived of glucose and oxygen. Approximately 45% of ischemic strokes are caused by small or large artery thrombus, 20% are embolic origin, and others have an unknown cause (Hickey 2003. The clinical practice of neurological and neurosurgical nursing (5th ed.). Philadelphia: Lippincott, Williams & Wilkins).
Transient ischemic attack (TIA) (also known as “mini-stroke”) is a syndrome characterized by the sudden onset of discrete neurological symptoms that resolve completely within 24 hours. TIA may be reported by 0.5-8% of the elderly population (Bots et al., 1997. Stroke 28(4): 768-73). A patient representing with a TIA is at high risk of subsequent adverse events. The 90-day risk of stroke has been reported to be greater than 10%, with the highest risk occurring within the first 2 days (Jonston et al., 2003. Neurology 60: 1429-34).
Stroke is one of the most important vascular diseases. Stroke remains the second leading cause of death worldwide and is one of the main causes of adult disability and early invalidity in Europe (Murray and Lopez, 1997. Lancet 349: 1269-76; Murray and Lopez 1997. Lancet 349:1498-504). In the US more than 700 000 people have a stroke each year, whereof 550 000 are first strokes (Thom et al. 2006. Heart disease and stroke statistics—2006 update: A report from the American Heart Association Statistics Committee and Stroke Statistics Subcommittee. Circulation 113: 85-151). Therefore, it is an important public health problem and a burden to health care providers and to the community at large because of the amount of effort that has to be invested in the planning and provision of healthcare.
The incidence of stroke increases markedly with increasing age in our society (Modan and Wagener, 1992. Stroke 23:1230-36). Most ischemic strokes occur between the ages of 71 an 80 years while most hemorrhagic strokes between 60 and 70 years appear (Colombo et al., 1989. Rivista de Neurologia 59: 1-7).
Neuroradiological imaging methods like computer tomography (CT) or magnetic resonance tomography (MRT) are used for diagnosis of stroke. CT scanning is recommended for patients suffering from acute stroke caused by cerebral haemorrhage. This method, however, is less effective in patients suffering from an acute ischemic insult (sensitivity less than 33%). Doppler sonography and digital subtraction angiography (DSA) can additionally be used to determine the causes of acute circulatory disturbances.
Treatment of ischemic stroke is normally focussed on supporting vital functions and on rehabilitative measures. Therapies are aimed at removing the blockage by breaking the clot or by removing it mechanically, minimizing clot enlargement and preventing new clots from forming. Thrombolysis (breakdown of blood clots) can be induced by applying plasminogen activator (tPA or PLAT) within the first 3 hours after the stroke. Since some disease states like hypoglycaemia, migraine, cerebral haemorrhage and certain brain tumours have similar symptoms as acute ischemic stroke, there is a need for rapid differential diagnosis.
Therapy also needs to be adjusted according to the patients individual situation, e.g. the individual prognosis and/or the individual risk of further strokes.
Prognosis of the outcome for stroke patients after a defined interval can either be functional or related to individual survival. For functional outcome prognosis the morbidity of a patient after a defined time is determined using a score system such as the modified Rankin_Scale (mRS; Bonita and Beaglehole, 1988. Modification of Rankin Scale: Recovery of motor function after stroke. Stroke 19: 1497-1500) or the National Institutes of Health Stroke Scale (NIHSS; Adams et al., 1999. Baseline NIH Stroke Scale score strongly predicts outcome after stroke: A report of the Trial of Org 10172 in Acute Stroke Treatment (TOAST). Neurology 53: 126-31), the NIHSS currently being the gold standard. The functional outcome may also be expressed in terms of need of nursing care or with respect to activities of daily living (ADL), e.g. according to the Barthel Index and Rankin Scale (Collin et al., 1988. The Barthel ADL Index: a reliability study. International Disability Study 10: 61-3; Bonita and Beaglehole, 1988. Modification of Rankin Scale: Recovery of motor function after stroke. Stroke 19: 1497-1500). Some biomarkers have been reported to be indicative for future cardiovascular events, e.g. a further stroke. Potential stroke biomarkers that have been reported are S-100B (Serum protein 100 Beta; Stranjalis et al. 2007 Acta Neurochir (Wien) 149: 231-7; Foerch et al. 2005. Arch Neurol 62: 1130-4), NSE (neuronenspezifische Enolase; Anand and Staed 2005. Cerebrovasc Dis 20: 213-9), GFAP (glial fibrillary acidic protein; Nylen et al., 2007. Stroke 38: 1489-94), CRP (C-reactive protein; Di Napoli et al. 2001. Stroke 32: 133-8; Di Napoli et al. 2001. Stroke 32: 917-24), IL-6 (Interleukin-6; Orion et al. 2008. Eur J Neurol 15:323-8; Shenhar-Tsarfaty et al., 2007. Thromb Res 122:167-73), and Plasma-Fibrinogen (Turaj et al. 2006. J Neurol Sci 246: 13-9).
N-terminal proBNP (NT-proBNP) has been shown to be an independent variable for individual survival prognosis after an ischemic stroke (Jensen et al. 2006. Cerebrovasc Dis 22: 439-44; Sharma et al. 2006. J Stroke Cerebrovasc Dis 15: 121-7; Mäkikallio et al. 2005. Stroke 36: 1016-20; Yip et al. 2006. Circ J 70: 447-52) and after an hemorrhagic stroke (Sharma et al. 2006. J Stroke Cerebrovasc Dis 15: 121-7).
The levels of mature ANP (Estrada et al. 1994. Am J Hypertens 7: 1085-9) and ADM (Hosomi et al. 2004. J Hypertens 22: 1945-51) have been determined in samples of patients with ischemic stroke. However, no correlation of the ANP concentrations with the neurological status (Mathew's modified scale) or outcome could be shown.
Elevated ET-1 concentrations have been found in the blood of stroke patients without investigating the prognostic value of these data (Ziv et al. 1992 Stroke 23: 1014-6; Alioglu et al. 2002. Angiology 53: 77-82; Giannopoulos et al. 2008. Neurol. Res. 30(7):727-30). ET-1 levels have been found to be elevated in patients after an ischemic stroke (Estrada et al. 1994. Am J Hypertens 7: 1085-9) but no correlation with the rate of survival has been determined.
An investigation of the serum Procalcitonin (PCT) levels of patients suffering from an acute stroke (Miyakis et al. 2004. Clin Chim Acta 350: 437-9) did not reveal significant differences of the levels at the day of hospitalization and day 7. No correlation of the PCT levels with mortality or neurological outcome has been found in this study.
Human growth hormone (hGH) is a polypeptide produced by the somatotrope cells in the pituitary. It is secreted in a pulsatile fashion (10 to 20 pulses in each 24-hour cycle) and its secretion is regulated by three hypothalamic peptides, growth hormone releasing hormone (GHRH) and ghrelin, which stimulate hGH secretion, and somatostatin, which inhibits hGH secretion by back regulation (Kato et al. 2002. Regulation of human growth hormone secretion and its disorders. Internal Med 41: 7-13).
HGH is heterogenous, consisting of several molecular isoforms and fragments (Baumann G. 1991. Growth hormone heterogeneity: genes, isohormones, variants and binding proteins. Endocr Rev 12: 424-449). Four major isoforms of hGH have been identified in the human pituitary ranging in the amino acid number and include 191 aa (frequency of 87.5%), 176 aa (8.1%), 153 aa (3.3%) and 145 aa (11%) (Zhan X. et al. 2005. Proteomics analysis of growth hormone isoforms in the human pituitary. Proteomics 5: 1228-41). The 191 aa form has a molecular weight of 22 kDa and is co-secreted from the anterior pituitary gland with the 176 aa form (20 kDa isoform), lacking the amino acid residues 32 to 46 (De Palo E. et al. 2006. Growth hormone isoforms and segments/fragments: molecular structure and laboratory measurements. Clin Chim Acta 365: 67-76).
The secretion of hGH is slightly higher in women than in men, with the highest levels observed at puberty. Secretion decreases with age by around 14% per decade. Moreover secretion varies with normal physiological and pathophysiological conditions. The principal physiological regulation mechanisms of hGH secretion are neural endogenous rhythm, sleep, stress, exercise, and nutritional and metabolic signals: hGH levels are higher during slow wave sleep (typically one to two hours after falling asleep) and are increased by exercise, stress, fever, fasting and with some amino acids (leucine and arginin). HGH secretion is also stimulated by insulin-induced hypoglycaemia, L-dopa, clonidine (α2-adrenergic agonist), γ-hydroxybutyrate and β-adrenergic blocking agents, whereas oral administration of glucose and increased serum free fatty acid levels rather suppress hGH secretion. hGH secretion is also blunted in obesity and by aging. (Review in: Kato et al. 2002. Regulation of human growth hormone secretion and its disorders. Internal Med 41: 7-13).
C-reactive protein (CRP) is a plasma protein that was originally discovered by Tillett and Francis in 1930 as a substance in the serum of patients with acute inflammation that reacted with the C polysaccharide of pneumococcus. Patients with elevated basal levels of CRP have been shown to have an increased risk for diabetes, hypertension and cardiovascular disease (Pradhan et al. (2001. JAMA 286: 327-334; Dehghan. 2007, Diabetes 56: 872).
Troponin is a complex of three regulatory proteins that is integral to muscle contraction in skeletal and cardiac muscle, but not smooth muscle. Troponin has three subunits: TnC, TnI, and TnT. Individual subunits serve different functions: Troponin C (TnC) binds to calcium ions to produce a conformational change in TnI. Troponin T binds to tropomyosin, interlocking them to form a troponin-tropomyosin complex. Troponin I binds to actin in thin myofilaments to hold the troponin-tropomyosin complex in place. Certain subtypes of troponin (cardiac troponin I and T) are very sensitive and specific indicators of damage to the heart muscle (myocardium). Their level in blood samples can be used to differentiate between unstable angina and myocardial infarction (heart attack) in patients with chest pain (Antman et al. 1996. N Engl J Med; 335:1342-9).
SUMMARY OF THE INVENTION
A subject of the present invention is the provision of an improved method for prognosis of an outcome or assessing the risk of a patient having suffered a stroke or a transient ischemic attack, comprising determining the level of at least one marker peptide in a sample of said patient.
The present invention relates to a method for prognosis of an outcome or assessing the risk of a patient having suffered a stroke or a transient ischemic attack, comprising the following steps:
-
- a) providing a sample from said patient,
- b) determining the level of at least one marker peptide in said sample said marker peptide selected from the group comprising ANP, AVP, ADM, ET-1, Calcitonin, troponin, CRP and hGH or fragments thereof or its precursor or fragments thereof,
- c) correlating the level of said at least one marker peptides or fragments thereof or its precursor or fragments thereof with the prognosis of an outcome or assessing the risk for said patient.
The invention also pertains to the use of the methods of the invention for prognosis of an outcome or assessing the risk of a patient having suffered a stroke or a transient ischemic attack.
DETAILED DESCRIPTION OF THE INVENTION
The present invention relates to a method for prognosis of an outcome or assessing the risk of a patient having suffered a stroke or a transient ischemic attack, comprising the following steps:
-
- a. providing a sample from said patient,
- b. determining the level of at least one marker peptide in said sample said marker peptide selected from the group comprising ANP, AVP, ADM, ET-1, Calcitonin, troponin, CRP and hGH or fragments thereof or its precursor or fragments thereof,
- c. correlating the level of said at least one marker peptides or fragments thereof or its precursor or fragments thereof with the prognosis of an outcome or assessing the risk for said patient.
Preferred marker peptides according to the present invention are ANP, BNP, AVP, ADM, ET-1, Calcitonin, troponin, CRP (C-reactive protein) and hGH. Particularly preferred marker peptides are ANP, BNP, AVP, ADM, ET-1, Calcitonin and hGH. These peptides can also be classified into subsets according to their origin and/or place of synthesis within the body or according to the main site of action or according to functional properties: ANP, BNP and troponin (cT) are cardiovascular peptides, ET-1 and ADM are endothelial peptides, AVP (including e.g. copeptin) and hGH are pituitary peptides, whereas PCT and CRP are inflammatory peptides.
Troponin and CRP (C-reactive protein) are proteins or protein complexes, i.e. polypeptides. In the context of the present invention they are like the other peptides mentioned also referred to as marker peptides.
The term “marker peptides” in the context of the present invention thus relates to the cardiovascular, inflammatory and/or pituitary peptides of the invention.
In a preferred embodiment of the invention said sample has been taken pre-interventionally from said patient. In another preferred embodiment of the invention, said sample has been taken post-interventionally from said patient.
The terms “pre-interventionally”, “pre-interventional” and “before intervention” herein relate to the time before intervention for the treatment of the stroke or TIA has been started. By “intervention” any medical intervention used to modify a health outcome is meant. This definition includes drug administration, surgical procedures, application of devices, behavioural treatments, process-of-care changes, and the like. Preferably, the sample is taken upon admission of the patient to a hospital or before the diagnosis of stroke or TIA has been confirmed. The terms “post-interventionally”, “post-interventional” and “after intervention” relate to the time after intervention or the treatment has been started.
The levels of the markers as obtained by the methods or the use of the assays according to the present invention may be analyzed in a number of fashions well known to a person skilled in the art. For example, each assay result obtained may be compared to a “normal” value, or a value indicating a particular disease or outcome. A particular diagnosis/prognosis may depend upon the comparison of each assay result to such a value, which may be referred to as a diagnostic or prognostic “threshold”. In certain embodiments, assays for one or more diagnostic or prognostic indicators are correlated to a condition or disease by merely the presence or absence of the indicator(s) in the assay. For example, an assay can be designed so that a positive signal only occurs above a particular threshold concentration of interest, and below which concentration the assay provides no signal above background.
The sensitivity and specificity of a diagnostic and/or prognostic test depends on more than just the analytical “quality” of the test, they also depend on the definition of what constitutes an abnormal result. In practice, Receiver Operating Characteristic curves (ROC curves), are typically calculated by plotting the value of a variable versus its relative frequency in “normal” (i.e. apparently healthy) and “disease” populations. For any particular marker, a distribution of marker levels for subjects with and without a disease will likely overlap. Under such conditions, a test does not absolutely distinguish normal from disease with 100% accuracy, and the area of overlap indicates where the test cannot distinguish normal from disease. A threshold is selected, above which (or below which, depending on how a marker changes with the disease) the test is considered to be abnormal and below which the test is considered to be normal. The area under the ROC curve is a measure of the probability that the perceived measurement will allow correct identification of a condition. ROC curves can be used even when test results don't necessarily give an accurate number. As long as one can rank results, one can create a ROC curve. For example, results of a test on “disease” samples might be ranked according to degree (e.g. 1=low, 2=normal, and 3=high). This ranking can be correlated to results in the “normal” population, and a ROC curve created. These methods are well known in the art. See, e.g., Hanley et al. 1982. Radiology 143: 29-36. Preferably, a threshold is selected to provide a ROC curve area of greater than about 0.5, more preferably greater than about 0.7, still more preferably greater than about 0.8, even more preferably greater than about 0.85, and most preferably greater than about 0.9. The term “about” in this context refers to +/−5% of a given measurement.
The horizontal axis of the ROC curve represents (1-specificity), which increases with the rate of false positives. The vertical axis of the curve represents sensitivity, which increases with the rate of true positives. Thus, for a particular cut-off selected, the value of (1-specificity) may be determined, and a corresponding sensitivity may be obtained. The area under the ROC curve is a measure of the probability that the measured marker level will allow correct identification of a disease or condition. Thus, the area under the ROC curve can be used to determine the effectiveness of the test.
In certain embodiments, particular thresholds for one or more markers in a panel are not relied upon to determine if a profile of marker levels obtained from a subject are indicative of a particular diagnosis/prognosis. Rather, the present invention may utilize an evaluation of a marker panel “profile” as a unitary whole. A particular “fingerprint” pattern of changes in such a panel of markers may, in effect, act as a specific diagnostic or prognostic indicator. As discussed herein, that pattern of changes may be obtained from a single sample, or from temporal changes in one or more members of the panel (or a panel response value). A panel herein refers to a set of markers.
As described herein after, a panel response value is preferably determined by plotting ROC curves for the sensitivity (i.e. true positives) of a particular panel of markers versus 1-(specificity) (i.e. false positives) for the panel at various cut-offs. In these methods, a profile of marker measurements from a subject is considered together to provide a global probability (expressed either as a numeric score or as a percentage risk) of a diagnosis or prognosis. In such embodiments, an increase in a certain subset of markers may be sufficient to indicate a particular diagnosis/prognosis in one patient, while an increase in a different subset of markers may be sufficient to indicate the same or a different diagnosis/prognosis in another patient. Weighting factors may also be applied to one or more markers in a panel, for example, when a marker is of particularly high utility in identifying a particular diagnosis/prognosis, it may be weighted so that at a given level it alone is sufficient to signal a positive result. Likewise, a weighting factor may provide that no given level of a particular marker is sufficient to signal a positive result, but only signals a result when another marker also contributes to the analysis.
In certain embodiments, markers and/or marker panels are selected to exhibit at least about 70% sensitivity, more preferably at least about 80% sensitivity, even more preferably at least about 85% sensitivity, still more preferably at least about 90% sensitivity, and most preferably at least about 95% sensitivity, combined with at least about 70% specificity, more preferably at least about 80% specificity, even more preferably at least about 85% specificity, still more preferably at least about 90% specificity, and most preferably at least about 95% specificity. In particularly preferred embodiments, both the sensitivity and specificity are at least about 75%, more preferably at least about 80%, even more preferably at least about 85%, still more preferably at least about 90%, and most preferably at least about 95%. The term “about” in this context refers to +/−5% of a given measurement.
In other embodiments, a positive likelihood ratio, negative likelihood ratio, odds ratio, or hazard ratio is used as a measure of a test's ability to predict risk or diagnose a disease. In the case of a positive likelihood ratio, a value of 1 indicates that a positive result is equally likely among subjects in both the “diseased” and “control” groups; a value greater than 1 indicates that a positive result is more likely in the diseased group; and a value less than 1 indicates that a positive result is more likely in the control group. In the case of a negative likelihood ratio, a value of 1 indicates that a negative result is equally likely among subjects in both the “diseased” and “control” groups; a value greater than 1 indicates that a negative result is more likely in the test group; and a value less than 1 indicates that a negative result is more likely in the control group. In certain preferred embodiments, markers and/or marker panels are preferably selected to exhibit a positive or negative likelihood ratio of at least about 1.5 or more or about 0.67 or less, more preferably at least about 2 or more or about 0.5 or less, still more preferably at least about 5 or more or about 0.2 or less, even more preferably at least about 10 or more or about 0.1 or less, and most preferably at least about 20 or more or about 0.05 or less. The term “about” in this context refers to +/−5% of a given measurement.
In the case of an odds ratio, a value of 1 indicates that a positive result is equally likely among subjects in both the “diseased” and “control” groups; a value greater than 1 indicates that a positive result is more likely in the diseased group; and a value less than 1 indicates that a positive result is more likely in the control group. In certain preferred embodiments, markers and/or marker panels are preferably selected to exhibit an odds ratio of at least about 2 or more or about 0.5 or less, more preferably at least about 3 or more or about 0.33 or less, still more preferably at least about 4 or more or about 0.25 or less, even more preferably at least about 5 or more or about 0.2 or less, and most preferably at least about 10 or more or about 0.1 or less. The term “about” in this context refers to +/−5% of a given measurement.
In the case of a hazard ratio, a value of 1 indicates that the relative risk of an endpoint (e.g., death) is equal in both the “diseased” and “control” groups; a value greater than 1 indicates that the risk is greater in the diseased group; and a value less than 1 indicates that the risk is greater in the control group. In certain preferred embodiments, markers and/or marker panels are preferably selected to exhibit a hazard ratio of at least about 1.1 or more or about 0.91 or less, more preferably at least about 1.25 or more or about 0.8 or less, still more preferably at least about 1.5 or more or about 0.67 or less, even more preferably at least about 2 or more or about 0.5 or less, and most preferably at least about 2.5 or more or about 0.4 or less. The term “about” in this context refers to +/5% of a given measurement.
The skilled artisan will understand that associating a diagnostic or prognostic indicator, with a diagnosis or with a prognostic risk of a future clinical outcome is a statistical analysis. For example, a marker level of greater than X may signal that a patient is more likely to suffer from an adverse outcome than patients with a level less than or equal to X, as determined by a level of statistical significance. Additionally, a change in marker concentration from baseline levels may be reflective of patient prognosis, and the degree of change in marker level may be related to the severity of adverse events. Statistical significance is often determined by comparing two or more populations, and determining a confidence interval and/or a p value. See, e.g., Dowdy and Wearden, Statistics for Research, John Wiley & Sons, New York, 1983. Preferred confidence intervals of the invention are 90%, 95%, 97.5%, 98%, 99%, 99.5%, 99.9% and 99.99%, while preferred p values are 0.1, 0.05, 0.025, 0.02, 0.01, 0.005, 0.001, and 0.0001.
In yet other embodiments, multiple determinations of diagnostic or prognostic markers can be made, and a temporal change in the marker can be used to determine a diagnosis or prognosis. For example, a marker concentration in a subject sample may be determined at an initial time, and again at a second time from a second subject sample. In such embodiments, an increase in the marker from the initial time to the second time may be indicative of a particular diagnosis, or a particular prognosis. Likewise, a decrease in the marker from the initial time to the second time may be indicative of a particular diagnosis, or a particular prognosis.
The term “sample” as used herein refers to a sample of bodily fluid obtained for the purpose of diagnosis, prognosis, or evaluation of a subject of interest, such as a patient. Preferred test samples include blood, serum, plasma, cerebrospinal fluid, urine, saliva, sputum, and pleural effusions. In addition, one of skill in the art would realize that some test samples would be more readily analyzed following a fractionation or purification procedure, for example, separation of whole blood into serum or plasma components.
Thus, in a preferred embodiment of the invention the sample is selected from the group comprising a blood sample, a serum sample, a plasma sample, a cerebrospinal fluid sample, a saliva sample and a urine sample or an extract of any of the aforementioned samples. Preferably, the sample is a blood sample, most preferably a serum sample or a plasma sample.
The term “patient” as used herein refers to a living human or non-human organism that is receiving medical care or that should receive medical care due to a disease. This includes persons with no defined illness who are being investigated for signs of pathology. Thus, the methods and assays described herein are applicable to both human and veterinary disease.
The term “correlating,” as used herein in reference to the use of diagnostic and prognostic markers, refers to comparing the presence or amount of the marker(s) in a patient to its presence or amount in persons known to suffer from, or known to be at risk of, a given condition; or in persons known to be free of a given condition. As discussed above, a marker level in a patient sample can be compared to a level known to be associated with a specific diagnosis. The sample's marker level is said to have been correlated with a diagnosis; that is, the skilled artisan can use the marker level to determine whether the patient suffers from a specific type diagnosis, and respond accordingly. Alternatively, the sample's marker level can be compared to a marker level known to be associated with a good outcome (e.g., the absence of disease, etc.). In preferred embodiments, a panel of marker levels is correlated to a global probability or a particular outcome.
Preferably, said outcome or said risk regards survival and/or a functional outcome and/or a re-stroke or a re-transient ischemic attack.
The invention also pertains to a method for the stratification of a patient into risk groups said patient having suffered a stroke or a transient ischemic attack and said method comprising the steps as described above.
ANP in the context of the present invention relates to atrial natriuretic peptide or fragments thereof or precursors or fragments thereof. A preferred fragment of a precursor of ANP is mid-regional proANP (MR-proANP). Mid-regional proANP (MR-proANP) is defined as proANP or any fragment thereof comprising at least amino acid residues 53-90 of proANP. MR-proANP53-90 is a particularly preferred marker peptide in the context of the present invention.
AVP in the context of the present invention relates to arginine vasopressin (=vasopressin) or fragments thereof or precursors or fragments thereof. A preferred fragment of a precursor of AVP is C-terminal proAVP (CT-proAVP or Copeptin). CT-proAVP107-145 (or CT-pre-proAVP126-164) is a particularly preferred marker peptide in the context of the present invention.
ADM in the context of the present invention relates to adrenomedullin or fragments thereof or precursors or fragments thereof. A preferred fragment of a precursor of ADM is mid-regional proADM (MR-proADM). MR-proADM24-71 (or MR-preproADM45-92) is a particularly preferred marker peptide in the context of the present invention.
ET-1 in the context of the present invention relates to endothelin 1 or fragments thereof or precursors or fragments thereof. A preferred fragment of a precursor of ET-1 is C-terminal-proET1 (CT-proET1). CT-proET-1151-195 (or CT-preproET-1168-212) is a particularly preferred marker peptide in the context of the present invention.
Calcitonin in the context of the present invention also relates to fragments thereof or precursors or fragments thereof. A preferred precursor of Calcitonin is procalcitonin (PCT). PCT in the context of the present invention relates to procalcitonin comprising the amino acids 1-116, 2-116, or 3-116 or fragments thereof. Procalcitonin may comprise posttranslational modifications such as glycosylation, liposidation or derivatisation.
hGH in the context of the present invention relates to human growth hormone or fragments thereof or precursors or fragments thereof. hGH is a particularly preferred pituitary peptide in the context of the present invention.
“Fragments” of the marker peptides relate to fragments of at least 12 amino acids in length, preferably at least six amino acid residues in length.
Furthermore, the invention relates to a method for diagnosing a patient who is under suspect of having a stroke or a transient ischemic attack or who shows symptoms at least similar to stroke or a transient ischemic attack comprising
-
- a. providing a sample from said patient,
- b. determining the level of at least one marker peptide in said sample said marker peptide selected from the group comprising ANP, AVP, ADM, ET-1, Calcitonin and hGH or fragments thereof or its precursor or fragments thereof
- c. determining whether said patient is suffering from stroke or a transient ischemic attack based on the level of said at least one marker peptide.
Symptoms of stroke or similar to stroke may for example comprise hemiplegia, muscle weakness of the face, numbness and reduction in sensory or vibratory sensation. In most cases, the symptoms affect only one side of the body (unilateral). Depending on the cause of the stroke, symptoms may also comprise one or more of the following symptoms: altered smell, taste, hearing, or vision (total or partial), drooping of eyelid (ptosis) and weakness of ocular muscles, decreased reflexes (e.g. gag, swallow, pupil reactivity to light), decreased sensation and muscle weakness of the face, balance problems and nystagmus, altered breathing and heart rate, weakness in sternocleidomastoid muscle with inability to turn head to one side, weakness in tongue (inability to protrude and/or move from side to side), aphasia (inability to speak or understand language from involvement of Broca's or Wernicke's area), apraxia (altered voluntary movements), visual field defect, memory deficits (involvement of temporal lobe), hemineglect (involvement of parietal lobe), disorganized thinking, confusion, hypersexual gestures (with involvement of frontal lobe), anosognosia (persistent denial of the existence of a, usually stroke-related, deficit), trouble walking, altered movement coordination, vertigo and or disequilibrium.
Preferably, the level of said at least one marker peptide is attributed to either ischemic stroke or hemorrhagic stroke or a transient ischemic attack. The term “level” in the context of the present invention relates to the concentration (preferably expressed as weight/volume; w/v) of marker peptides in a sample taken from a patient.
As outlined above, the marker peptides of the present invention also relate to fragments thereof or precursor peptides or fragments thereof. The marker peptides also include the prohormones or pre-prohormones or fragments thereof, particularly the prohormones and fragments thereof. Preferably in the context of the present invention ANP is proANP, most preferably MR-proANP. Preferably AVP is proAVP, more preferably CT-proAVP, most preferably CT-proAVP107-145 and fragments thereof. Preferably ADM is proADM, more preferably MR-proADM, most preferably MR-proADM24-71 and fragments thereof. Preferably ET-1 is proET-1, more preferably CT-proET-1, most preferably CT-proET-1151-195 and fragments thereof. Preferably Calcitonin is PCT1-116 and fragments thereof.
In one preferred embodiment of the invention the marker peptide is selected from the group comprising ANP, AVP, ADM, ET-1 and Calcitonin.
In another preferred embodiment of the invention of the invention the marker peptide is selected from the group comprising ANP, AVP, ADM, ET-1 and hGH.
In another preferred embodiment of the invention of the invention the marker peptide is selected from the group comprising ANP, AVP, ADM and ET-1.
In another preferred embodiment of the invention of the invention the marker peptide is selected from the group comprising ANP, AVP and ADM.
In yet another preferred embodiment of the invention of the invention the marker peptide is selected from the group comprising ANP and ADM.
In yet another preferred embodiment of the invention of the invention the marker peptide is selected from the group comprising ANP, ADM, ET-1, Calcitonin and hGH.
In yet another preferred embodiment of the invention of the invention the marker peptide is selected from the group comprising ANP, ADM and ET-1.
In a particularly preferred embodiment of the invention the marker peptide is selected from the group comprising MR-proANP, C-terminal proAVP (Copeptin), MR-proADM, CT-proET-1, PCT and hGH.
In another particularly preferred embodiment the marker peptide is selected from the group comprising MR-proANP, MR-proADM and CT-proET-1.
In another preferred embodiment of the invention the marker peptide is selected from the group comprising MR-proANP, C-terminal proAVP (Copeptin), MR-proADM and CT-proET-1.
In yet another preferred embodiment of the invention the marker peptide is selected from the group comprising MR-proANP, MR-proADM, PCT and hGH.
In yet another preferred embodiment of the invention the marker peptide is selected from the group comprising MR-proANP, C-terminal proAVP (Copeptin), MR-proADM, CT-proET-1 and hGH.
In yet another preferred embodiment of the invention the marker peptide is selected from the group comprising MR-proANP, MR-proADM, CT-proET-1, PCT and hGH.
In a preferred embodiment of the methods of the invention, the marker peptide is proANP. Preferably, the level of marker peptide is determined by detecting mid-regional proANP.
In a preferred embodiment of the methods of the invention, the marker peptide is proAVP. Preferably, the level of marker peptide is determined by detecting C-terminal proAVP.
In a preferred embodiment of the methods of the invention, the marker peptide is proADM. Preferably, the level of marker peptide is determined by detecting mid-regional proADM.
In a preferred embodiment of the methods of the invention, the marker peptide is proET-1. Preferably, the level of marker peptide is determined by detecting C-terminal proET-1.
In a preferred embodiment of the methods of the invention, the marker peptide is PCT. Preferably, the level of marker peptide is determined by detecting PCT.
In a preferred embodiment of the methods of the invention, the marker peptide is hGH. Preferably, the level of marker peptide is determined by detecting hGH.
In a preferred embodiment of the invention, a combination of two or more cardiovascular marker is used. Preferably herein, the second or further cardiovascular marker is selected from the group comprising ANP, BNP, AVP, ADM, ET-1, Calcitonin and hGH.
Optionally the level of BNP or fragments thereof or a precursor or fragments thereof is additionally determined.
BNP in the context of the present invention relates to brain natriuretic peptide or fragments thereof or precursors or fragments thereof. A preferred fragment of a precursor of BNP is N-terminal proBNP (NT-proBNP). NT-proBNP is a particularly preferred marker peptide in the context of the present invention.
In a preferred embodiment of the invention, the level of more than one cardiovascular marker is determined and the result for each individual marker are differently weighted for prognosis of an outcome or assessing the risk of a patient having suffered a stroke or a transient ischemic attack. It is particularly preferred that the level of a set of two or more marker peptides is determined, most preferably the level of a set of two marker peptides is determined.
The determination of the level of more than one marker peptide in the sample leads to a higher probability as compared to a single marker for the prognosis of an outcome or assessing the risk for the patient.
A particular embodiment of the invention relates to the method for prognosis of an outcome or assessing the risk of a patient having suffered a stroke or a transient ischemic attack according to the present invention, wherein the level of at least two marker peptides is determined and wherein each marker peptide is selected from a different subset of peptides selected from the group comprising cardiac peptides, endothelial peptides, pituitary peptides and inflammatory peptides, wherein the cardiac peptides are selected from the group comprising ANP, BNP and troponin (cT), the endothelial peptides are selected from the group comprising ET-1 and ADM, the pituitary peptides are selected from the group comprising AVP and hGH and the inflammatory peptides are selected from the group comprising PCT and CRP.
In another preferred embodiment the level of two, three, four, five, six, seven, eight or nine marker peptides in the sample is determined.
Most preferably the level of a set of at least two marker peptides is determined and the set of the at least two marker peptides is selected from the group comprising the following combinations of cardiovascular peptides: ANP and AVP, ANP and ADM, ANP and ET-1, ANP and Calcitonin, ANP and hGH, ADM and ET-1, ADM and Calcitonin, ADM and hGH, ET-1 and Calcitonin, ET-1 and hGH, and Calcitonin and hGH. However, additionally to the set of two cardiovascular peptides, the level of a third or further marker peptides may be determined in some embodiments of the invention.
In one preferred embodiment the level of ANP and ADM is determined. Preferably, the level of MR-proANP and MR-proADM is determined.
In another preferred embodiment the level of ANP and ET-1 is determined. Preferably, the level of MR-proANP and CT-proET-1 is determined.
In another preferred embodiment the level of ANP and Calcitonin is determined. Preferably, the level of MR-proANP and PCT is determined.
In another preferred embodiment the level of ANP and hGH is determined. Preferably, the level of MR-proANP and hGH is determined.
In another preferred embodiment the level of ANP and BNP is determined. Preferably, the level of MR-proANP and NT-proBNP is determined.
In another preferred embodiment the level of ADM and ET-1 is determined. Preferably, the level of MR-proADM and CT-proET-1 is determined.
In another preferred embodiment the level of ADM and Calcitonin is determined. Preferably, the level of MR-proADM and PCT is determined.
In another preferred embodiment the level of ADM and hGH is determined. Preferably, the level of MR-proADM and hGH is determined.
In another preferred embodiment the level of ADM and BNP is determined. Preferably, the level of MR-proADM and NT-proBNP is determined.
In another preferred embodiment the level of ET-1 and Calcitonin is determined. Preferably, the level of CT-proET-1 and PCT is determined.
In another preferred embodiment the level of ET-1 and hGH is determined. Preferably, the level of CT-proET-1 and hGH is determined.
In another preferred embodiment the level of ET-1 and BNP is determined. Preferably, the level of CT-proET-1 and NT-proBNP is determined.
In another preferred embodiment the level of PCT and hGH is determined. Preferably, the level of PCT and hGH is determined.
In another preferred embodiment the level of PCT and BNP is determined. Preferably, the level of PCT and NT-proBNP is determined.
In another preferred embodiment the level of hGH and BNP is determined. Preferably, the level of hGH and NT-proBNP is determined.
In one particular embodiment, the level of at least one marker peptide is determined on the first day of hospitalization (day 0) and on day 1, day 2, day 3, day 4, day 5, day 6, day 7, day 8, day 9 or day 10 after hospitalization. Preferably, the level of at least one marker peptide is determined on day 0, on day 1, on day 3 and on day 5 after hospitalization. More preferably, the level of at least one marker peptide is determined on day 0 and on day 5 after hospitalization. In another preferred embodiment, the level of at least one marker peptide is determined pre-interventional and post-interventionally. More preferably, the level of at least one marker peptide is determined pre-interventional and on day 5. Whenever the level of one or more marker peptides is determined, a sample is taken from the patient.
In a particular embodiment of the invention a sample from said patient is taken on day 0, 1, 2, 3, 4, 5, 6, 7, 8, 9 and/or 10 and the level of at least one marker peptide in said sample is measured and used for the prognosis of an outcome or assessing the risk for said patient or for the determination whether said patient is suffering from stroke or a transient ischemic attack.
It is particularly preferred in the context of the present invention that the presence or amount of a marker selected from the group consisting of NOGO receptor, RNA binding protein regulatory subunit, ubiquitin fusion degradation protein 1 homolog, β-chimerin, nucleoside diphosphate kinaseA, and nitrotyrosine, or one or more markers related thereto is not determined in the sample. The term “related marker” in this context refers to one or more fragments of a particular marker that may be detected as a surrogate for the marker itself. These related markers may be, for example, “pre,” “pro,” or “prepro” forms of markers, or the “pre,” “pro,” or “prepro” fragment removed to form the mature marker.
According to a preferred embodiment, the determination is performed using a multivariate analysis considering in addition one or more covariates selected from a group comprising NIHSS, Barthel Index and mRS.
The term “outcome” herein relates for instance to the survival of the patient after a defined time, e.g. after 5 days, 4 weeks, 3 months, 1 year or re-stroke or to a functional outcome. Most preferably the outcome 3 months after the stroke or TIA is predicted.
The term “functional outcome” in the context of the present invention relates to the degree of severity of the disease, i.e. the state of health the patient after a defined time, e.g. after 5 days, 4 weeks, 3 months, or 1 year, preferably with regard to the stroke or stroke-like symptoms. Most preferably the functional outcome 3 months after the stroke or TIA is predicted.
It is preferred in the context of the present invention, that the functional outcome is determined as ranking or the degree of severity of the outcome. The functional outcome may also be expressed in terms of need of nursing care or with respect to activities of daily living (ADL), e.g. according to the Barthel Index, NIHSS and modified Rankin Scale.
Furthermore the present invention also relates to a kit for prognosis of an outcome or assessing the risk of a patient having suffered a stroke or a transient ischemic attack, the kit comprising one or more capture probes (preferably antibodies or functional fragments thereof) directed against marker peptides or fragments thereof or precursors or fragments thereof selected from the group comprising ANP, AVP, ADM, ET-1, calcitonin, troponin, CRP and hGH. The kit may optionally comprise a capture probe (preferably an antibody or functional fragment thereof) directed against BNP. The kit may additionally comprise reagents necessary for detection, such as buffers. In addition the kit may also comprise one or more standard samples, i.e. one or more samples of defined concentration of one or more of the marker peptides.
Preferably, the kit comprises a combination of at least two capture probes directed marker peptides or fragments thereof or precursors or fragments thereof, the combinations being selected from the group comprising MR-proANP and MR-proADM, MR-proANP and CT-proET-1, MR-proADM and CT-proET-1, MR-proANP and hGH, hGH and MR-proADM, hGH and CT-proET-1, MR-proANP and PCT, MR-proADM and PCT, CT-proAVP and PCT, CT-proET-1 and PCT, hGH and PCT.
The present invention also relates to the use of the methods of the invention or the kits of the invention for prognosis of an outcome or assessing the risk of a patient having suffered a stroke or a transient ischemic attack.
The invention also relates to the use of the methods of the invention for monitoring of the therapy in a patient having suffered a stroke or a transient ischemic attack.
The invention also relates to the use of the methods of the invention for differentially diagnosing ischemic stroke, hemorrhagic stroke and/or transient ischemic attack in said subject, preferably within 24 hours after the first symptoms of stroke or TIA. It is particularly preferred that the methods or the kits are used for differentiating ischemic stroke from hemorrhagic stroke or for differentiating ischemic and/or hemorrhagic stroke from transient ischemic attack. Preferred single markers in this context are ANP, particularly MR-proANP, AVP, particularly copeptin, ADM, particularly MR-proADM, ET-1, particularly CT-proET-1, PCT and hGH. Also combinations of two or more of the marker peptides of the present invention may be used in this context. Particularly preferred combinations comprise MR-proANP and MR-proADM, MR-proANP and CT-proET-1, MR-proADM and CT-proET-1, MR-proANP and hGH, hGH and MR-proADM, hGH and CT-proET-1, MR-proANP and PCT, MR-proADM and PCT, CT-proAVP and PCT, CT-proET-1 and PCT, hGH and PCT.
Determining (or measuring or detecting) the level of a marker peptide herein is performed using a detection method and/or a diagnostic assay as explained below.
As mentioned herein, an “assay” or “diagnostic assay” can be of any type applied in the field of diagnostics. Such an assay may be based on the binding of an analyte to be detected to one or more capture probes with a certain affinity. Concerning the interaction between capture molecules and target molecules or molecules of interest, the affinity constant is preferably greater than 108 M−1.
In the context of the present invention, “capture molecules” are molecules which may be used to bind target molecules or molecules of interest, i.e. analytes (i.e. in the context of the present invention the cardiovascular peptide(s)), from a sample. Capture molecules must thus be shaped adequately, both spatially and in terms of surface features, such as surface charge, hydrophobicity, hydrophilicity, presence or absence of lewis donors and/or acceptors, to specifically bind the target molecules or molecules of interest. Hereby, the binding may for instance be mediated by ionic, van-der-Waals, pi-pi, sigma-pi, hydrophobic or hydrogen bond interactions or a combination of two or more of the aforementioned interactions between the capture molecules and the target molecules or molecules of interest. In the context of the present invention, capture molecules may for instance be selected from the group comprising a nucleic acid molecule, a carbohydrate molecule, a RNA molecule, a protein, an antibody, a peptide or a glycoprotein. Preferably, the capture molecules are antibodies, including fragments thereof with sufficient affinity to a target or molecule of interest, and including recombinant antibodies or recombinant antibody fragments, as well as chemically and/or biochemically modified derivatives of said antibodies or fragments derived from the variant chain with a length of at least 12 amino acids thereof.
The preferred detection methods comprise immunoassays in various formats such as for instance radioimmunoassay (RIA), chemiluminescence- and fluorescence-immunoassays, Enzyme-linked immunoassays (ELISA), Luminex-based bead arrays, protein microarray assays, and rapid test formats such as for instance immunochromatographic strip tests.
The assays can be homogenous or heterogeneous assays, competitive and non-competitive sandwich assays. In a particularly preferred embodiment, the assay is in the form of a sandwich assay, which is a non-competitive immunoassay, wherein the molecule to be detected and/or quantified is bound to a first antibody and to a second antibody. The first antibody may be bound to a solid phase, e.g. a bead, a surface of a well or other container, a chip or a strip, and the second antibody is an antibody which is labeled, e.g. with a dye, with a radioisotope, or a reactive or catalytically active moiety. The amount of labeled antibody bound to the analyte is then measured by an appropriate method. The general composition and procedures involved with “sandwich assays” are well-established and known to the skilled person. (The Immunoassay Handbook, Ed. David Wild, Elsevier LTD, Oxford; 3rd ed. (May 2005), ISBN-13: 978-0080445267; Hultschig C et al., Curr Opin Chem Biol. 2006 February; 10(1):4-10. PMID: 16376134), incorporated herein by reference).
In a particularly preferred embodiment the assay comprises two capture molecules, preferably antibodies which are both present as dispersions in a liquid reaction mixture, wherein a first labeling component is attached to the first capture molecule, wherein said first labeling component is part of a labeling system based on fluorescence- or chemiluminescence-quenching or amplification, and a second labeling component of said marking system is attached to the second capture molecule, so that upon binding of both capture molecules to the analyte a measurable signal is generated that allows for the detection of the formed sandwich complexes in the solution comprising the sample.
Even more preferred, said labeling system comprises rare earth cryptates or rare earth chelates in combination with a fluorescence dye or chemiluminescence dye, in particular a dye of the cyanine type.
In the context of the present invention, fluorescence based assays comprise the use of dyes, which may for instance be selected from the group comprising FAM (5- or 6-carboxyfluorescein), VIC, NED, Fluorescein, Fluoresceinisothiocyanate (FITC), IRD-700/800, Cyanine dyes, auch as CY3, CY5, CY3.5, CY5.5, Cy7, Xanthen, 6-Carboxy-2′,4′,7′,4,7-hexachlorofluorescein (HEX), TET, 6-Carboxy-4′,5′-dichloro-2′,7′-dimethodyfluorescein (JOE), N,N,N′,N′-Tetramethyl-6-carboxyrhodamine (TAMRA), 6-Carboxy-X-rhodamine (ROX), 5-Carboxyrhodamine-6G (R6G5), 6-carboxyrhodamine-6G (RG6), Rhodamine, Rhodamine Green, Rhodamine Red, Rhodamine 110, BODIPY dyes, such as BODIPY TMR, Oregon Green, Coumarines such as Umbelliferone, Benzimides, such as Hoechst 33258; Phenanthridines, such as Texas Red, Yakima Yellow, Alexa Fluor, PET, Ethidiumbromide, Acridinium dyes, Carbazol dyes, Phenoxazine dyes, Porphyrine dyes, Polymethin dyes, and the like.
In the context of the present invention, chemiluminescence based assays comprise the use of dyes, based on the physical principles described for chemiluminescent materials in Kirk-Othmer, Encyclopedia of chemical technology, 4th ed., executive editor, J. I. Kroschwitz; editor, M. Howe-Grant, John Wiley & Sons, 1993, vol. 15, p. 518-562, incorporated herein by reference, including citations on pages 551-562. Preferred chemiluminescent dyes are acridiniumesters.
The levels, i.e. the concentrations, of the one or more marker peptides (or fragments thereof or precursors or fragments thereof) in the sample of the patient are attributed to the prognosis of an outcome or assessing the risk for the patient. For instance, concentrations of the marker peptide above a certain threshold value are indicative for an adverse outcome or an elevated risk for the patient. Such threshold values are preferably in the range of from about 100 to 300 pmol/l, more preferably 250 pmol/l, most preferably 188 pmol/l for MR-proANP; in the range of from about 10 to 40 pmol/l, more preferably 15 pmol/l, most preferably 20.3 pmol/l for Copeptin; in the range of from about 0.4 to 1.0 nmol/l, more preferably 0.5 nmol/l, most preferably 0.67 nmol/l for MR-proADM; in the range of from about 50 to 120 pmol/l, more preferably 75 pmol/l, most preferably 98.3 pmol/l for CT-pro-ET-1; in the range of from about 0.01 to 0.06 ng/ml, more preferably 0.015 ng/ml, most preferably 0.026 ng/ml for PCT; in the range of from about 0.25 to 1.0 ng/ml, more preferably 0.5 ng/ml, most preferably 0.34 ng/ml for hGH; in the range of from about 250 to 500 pg/ml, more preferably 450 pg/ml, most preferably 370 pg/ml for NT-proBNP.
Preferably herein a sensitive PCT assay (e.g. the PCT sensitive assay, B.R.A.H.M.S AG, Hennigsdorf, Germany) is used. Preferably herein, the PCT assay has a functional sensitivity of 0.05 ng/ml or below.
This means that in one embodiment of the methods of the invention, PCT levels are measured with high sensitivity (i.e. a sensitivity of 0.05 ng/ml, preferably 0.02 ng/ml), in the sample of the patient. Preferably in this context, the level of PCT is correlated with the survival prognosis of a patient.
In another embodiment of the invention, the risk and/or outcome for a patient is determined by relating the patient's individual level of marker peptide to certain percentiles (e.g. 97.5th percentile) of a healthy population.
Preferred threshold values for the differential diagnosis of stroke (hemorrhagic and/or ischemic) from TIA are in the range of from about 90 to about 140 pmol/l for MR-proANP, in the range of from about 9.5 to about 11.5 pmol/l for Copeptin, in the range of from about 0.5 to about 0.8 nmol/l for MR-proADM, in the range of from about 65 to about 90 pmol/l for CT-pro-ET-1, in the range of from about 0.0230 to about 0.0260 ng/ml for PCT, and in the range of from about 0.10 to about 0.3 ng/ml for hGH, wherein a value below the threshold is indicative for TIA and above the threshold indicative for stroke. Exemplary thresholds for the differential diagnosis are also given in table 25 of example 11.
Survival analysis (Cox regression and hazard ratios) and Kaplan-Meier estimators may be used for the assessment or prediction of the outcome or risk (e.g. morbidity) of a patient with a peptide level e.g. above or below a cut off. The mortality, e.g. 3, 4 or 12 months after the stroke or TIA can be assessed by hazard ratios, describing the increase of risk for patients with peptide levels above a certain cut-off value. The increase of risk of a re-stroke or re-TIA, respectively, occurring within the observation period after the stroke or TIA can for instance be determined by odds ratios and cross tables.
From the comparison of the respective levels of one or more of the marker peptides at the day of hospitalization and at a certain time after hospitalization, e.g. on day 5 after hospitalization, the outcome/risk, e.g. the survival probability after 3, 4, 12 months may be predicted using Kaplan-Meier estimators and hazard ratios for patients with a peptide level e.g. above or below a cut off.
In general, the determined values of the levels of more than one marker peptide may be used for the assessment of the outcome and the risk for the patient by counting the number of peptide levels that have values above the respective cut off. The more peptide levels are above the cut off, the higher the risk for the patient. Kaplan-Meier estimators can be used to predict mortality, odds ratios can be applied to describe the risk increase for prediction of re-stroke or re-TIA.
As mentioned herein above, the determined levels of the marker peptides may according to the present invention be expressed in terms of functional outcome, e.g. expressed as according to the Barthel Index, NIHSS or modified Rankin Scale. E.g., using box plots (peptide levels by outcome), receiver operating characteristics (ROC) analysis and odds ratios, peptide levels can be used to predict the future functional outcome.
The methods and kits according to the invention may also be used for determining whether said patient is suffering from stroke or a transient ischemic attack based on the level of said at least one cardiovascular peptide. In this context, the sample is preferably taken pre-interventionally.
Sequences
The amino acid sequence of the precursor peptide of Adrenomedulin (pre-pro-Adrenomedullin) is given in SEQ ID NO: 1. Pro-Adrenomedullin relates to amino acid residues 22 to 185 of the sequence of pre-pro-Adrenomedullin. The amino acid sequence of pro-Adrenomedullin (pro-ADM) is given in SEQ ID NO:2. The pro-ADM N-terminal 20 peptide (PAMP) relates to amino acid residues 22-41 of pre-proADM. The amino acid sequence of PAMP is given in SEQ ID NO:3. MR-pro-Adrenomedullin (MR-pro-ADM) relates to amino acid residues 45-92 of pre-pro-ADM. The amino acid sequence of MR-pro-ADM is provided in SEQ ID NO:4. The amino acid sequence of mature Adrenomedullin (ADM) is given in SEQ ID NO:5.
The amino acid sequence of ANP is given in SEQ ID NO:8. The sequence of the 153 amino acid pre-pro-ANP is shown in SEQ ID NO:6. Upon cleavage of an N-terminal signal peptide (25 amino acids) and the two C-terminal amino acids (127/128) proANP (SEQ ID NO:7) is released. ANP comprises residues 99-126 from the C-terminus of the precursor prohormone pro-ANP. This prohormone is cleaved into the mature 28 amino acid peptide ANP, also known as ANP (1-28) or α-ANP, and the amino terminal fragment ANP (1-98) (NT-proANP, SEQ ID NO:9). Mid-regional proANP (MR-proANP) is defined as NT-proANP or any fragments thereof comprising at least amino acid residues 53-90 (SEQ ID NO:10) of proANP. The C-terminal two arginine residues (positions 152 and 153 in pre-pro-ANP, SEQ ID NO:6, are not present in another allele of the gene encoding pre-pro-ANP, thus pre-pro-ANP may comprise only residues 1 to 151. This of course is also true for the respective fragments of pre-pro-ANP, particularly pro-ANP and copeptin may or may not comprise these two C-terminal arginines.
The sequence of the 164 amino acid precursor peptide of Vasopressin (pre-pro-Vasopressin) is given in SEQ ID NO:11. Pro-Vasopressin relates to the amino acid residues 29 to 164 of the sequence of pre-pro-Vasopressin. The amino acid sequence of pro-Vasopressin is given in SEQ ID NO:12. Pro-Vasopressin is cleaved into mature Vasopressin, Neurophysin II and C-terminal proVasopressin (CT-proAVP or Copeptin). Vasopressin relates to the amino acid residues 20 to 28 of pre-pro-Vasopressin. The amino acid sequence of Vasopressin is shown in SEQ ID NO:13. Coeptin relates to amino acid residues 126 to 164 of pre-pro-Vasopressin. The amino acid sequence of Copeptin is provided in SEQ ID NO:14. Neurophysin II comprises the amino acid residues 32 to 124 of pre-pro-Vasopressin and its sequence is shown in SEQ ID NO:15.
The sequence of the 212 amino acid precursor peptide of Endothelin-1 (pre-pro-Endothelin-1) is given in SEQ ID NO:16. Pro-ET-1 relates to the amino acid residues 18 to 212 of the sequence of pre-pro-ET-1. The amino acid sequence of pro-ET-1 is given in SEQ ID NO:17. Pro-ET-1 is cleaved into mature ET-1, big-ET-1 and C-terminal proET-1 (CT-proET-1). ET-1 relates to the amino acid residues 53 to 73 of pre-pro-ET-1. The amino acid sequence of ET-1 is shown in SEQ ID NO:18. CT-proET-1 relates to amino acid residues 168 to 212 of pre-pro-ET-1. The amino acid sequence of CT-proET-1 is provided in SEQ ID NO:19. Big-ET-1 comprises the amino acid residues 53 to 90 of pre-pro-ET-1 and its sequence is shown in SEQ ID NO:20.
The sequence of the 141 amino acid precursor peptide of calcitonin (pre-pro-Calcitonin) is given in SEQ ID NO:21. Procalcitonin (PCT) relates to the amino acid residues 26 to 141 of the pre-pro-Calcitonin sequence. The amino acid sequence of PCT is shown in SEQ ID NO:22. Procalcitonin is cleaved into N-terminal PCT, Calcitonin and Katacalcin. N-terminal PCT comprises the amino acids 26 to 82 and its sequence is shown in SEQ ID NO:23. Calcitonin relates to amino acid residues 85 to 116 and its sequence is given in SEQ ID NO:24. The sequence of Katacalcin, comprising amino acid residues 121-141, is provided in SEQ ID NO:25.
The sequence of the 134 amino acid precursor peptide of brain natriuretic peptide (pre-pro-BNP) is given in SEQ ID NO:26. Pro-BNP relates to amino acid residues 27 to 134 of pro-pro-BNP. The sequence of pro-BNP is shown in SEQ ID NO:27. Pro-BNP is cleaved into N-terminal pro-BNP (NT-pro-BNP) and mature BNP. NT-pro-BNP comprises the amino acid residues 27 to 102 and its sequence is shown in SEQ ID NO:28. The SEQ ID NO:29 shows the sequence of BNP comprising the amino acid residues 103 to 134 of the pre-pro-BNP peptide.
| SEQ ID NO: 1 |
| (amino acid sequence of pre-pro-ADM): |
| 1 |
MKLVSVALMY LGSLAFLGAD TARLDVASEF RKKWNKWALS |
| |
RGKRELRMSS |
| |
| 51 |
SYPTGLADVK AGPAQTLIRP QDMKGASRSP EDSSPDAARI |
| |
RVKRYRQSMN |
| |
| 101 |
NFQGLRSFGC RFGTCTVQKL AHQIYQFTDK DKDNVAPRSK |
| |
ISPQGYGRRR |
| |
| 151 |
RRSLPEAGPG RTLVSSKPQA HGAPAPPSGS APHFL |
| |
| SEQ ID NO: 2 |
| (amino acid sequence of pro-ADM): |
| 1 |
ARLDVASEFR KKWNKWALSR GKRELRMSSS YPTGLADVKA |
| |
GPAQTLIRPQ |
| |
| 51 |
DMKGASRSPE DSSPDAARIR VKRYRQSMNN FQGLRSFGCR |
| |
FGTCTVQKLA |
| |
| 101 |
HQIYQFTDKD KDNVAPRSKI SPQGYGRRRR RSLPEAGPGR |
| |
TLVSSKPQAH |
| |
| 151 |
GAPAPPSGSA PHFL |
| |
| SEQ ID NO: 3 |
| (amino acid sequence of pro-ADM N20): |
| SEQ ID NO: 4 |
| (amino acid sequence of MR-pro-ADM): |
| 1 |
ELRMSSSYPT GLADVKAGPA QTLIRPQDMK GASRSPEDSS |
| |
PDAARIRV |
| |
| SEQ ID NO: 5 |
| (amino acid sequence of ADM): |
| 1 |
YRQSMNNFQG LRSFGCRFGT CTVQKLAHQI YQFTDKDKDN |
| |
VAPRSKISPQ |
| |
| 51 |
GY |
| |
| SEQ ID NO: 6 |
| (amino acid sequence of pre-pro-ANP): |
| 1 |
MSSFSTTTVS FLLLLAFQLL GQTRANPMYN AVSNADLMDF |
| |
KNLLDHLEEK |
| |
| 51 |
MPLEDEVVPP QVLSEPNEEA GAALSPLPEV PPWTGEVSPA |
| |
QRDGGALGRG |
| |
| 101 |
PWDSSDRSAL LKSKLRALLT APRSLRRSSC FGGRMDRIGA |
| |
QSGLGCNSFR |
| |
| 151 |
YRR |
| |
| SEQ ID NO: 7 |
| (amino acid sequence of pro-ANP): |
| 1 |
NPMYNAVSNA DLMDFKNLLD HLEEKMPLED EVVPPQVLSE |
| |
PNEEAGAALS |
| |
| 51 |
PLPEVPPWTG EVSPAQRDGG ALGRGPWDSS DRSALLKSKL |
| |
RALLTAPRSL |
| |
| 101 |
RRSSCFGGRM DRIGAQSGLG CNSFRY |
| |
| SEQ ID NO: 8 |
| (amino acid sequence of ANP): |
| 1 |
SLRRSSCFGG RMDRIGAQSG LGCNSFRY |
| |
| SEQ ID NO: 9 |
| (amino acid sequence of NT-proANP): |
| 1 |
NPMYNAVSNA DLMDFKNLLD HLEEKMPLED EVVPPQVLSE |
| |
PNEEAGAALS |
| |
| 51 |
PLPEVPPWTG EVSPAQRDGG ALGRGPWDSS DRSALLKSKL |
| |
RALLTAPR |
| |
| SEQ ID NO: 10 |
| (amino acid sequence of amino acids 53-90 of |
| proANP): |
| 1 |
PEVPPWTGEV SPAQRDGGAL GRGPWDSSDR SALLKSKL |
| |
| SEQ ID NO: 11 |
| (amino acid sequence of pre-pro-AVP): |
| 1 |
MPDTMLPACF LGLLAFSSAC YFQNCPRGGK RAMSDLELRQ |
| |
CLPCGPGGKG |
| |
| 51 |
RCFGPSICCA DELGCFVGTA EALRCQEENY LPSPCQSGQK |
| |
ACGSGGRCAA |
| |
| 101 |
FGVCCNDESC VTEPECREGF HRRARASDRS NATQLDGPAG |
| |
ALLLRLVQLA |
| |
| 151 |
GAPEPFEPAQ PDAY |
| |
| SEQ ID NO: 12 |
| (amino acid sequence of pro-AVP): |
| 1 |
CYFQNCPRGG KRAMSDLELR QCLPCGPGGK GRCFGPSICC |
| |
ADELGCFVGT |
| |
| 51 |
AEALRCQEEN YLPSPCQSGQ KACGSGGRCA AFGVCCNDES |
| |
CVTEPECREG |
| |
| 101 |
FHRRARASDR SNATQLDGPA GALLLRLVQL AGAPEPFEPA |
| |
QPDAY |
| |
| SEQ ID NO: 13 |
| (amino acid sequence of AVP): |
| SEQ ID NO: 14 |
| (amino acid sequence of CT-pre-proAVP or |
| Copeptin): |
| 1 |
ASDRSNATQL DGPAGALLLR LVQLAGAPEP FEPAQPDAY |
| |
| SEQ ID NO: 15 |
| (amino acid sequence of Neurophysin II): |
| 1 |
AMSDLELRQC LPCGPGGKGR CFGPSICCAD ELGCFVGTAE |
| |
ALRCQEENYL |
| |
| 51 |
PSPCQSGQKA CGSGGRCAAF GVCCNDESCV TEPECREGFH |
| |
RRA |
| |
| SEQ ID NO: 16 |
| (amino acid sequence of pre-pro-ET-1): |
| 1 |
MDYLLMIFSL LFVACQGAPE TAVLGAELSA VGENGGEKPT |
| |
PSPPWRLRRS |
| |
| 51 |
KRCSCSSLMD KECVYFCHLD IIWVNTPEHV VPYGLGSPRS |
| |
KRALENLLPT |
| |
| 101 |
KATDRENRCQ CASQKDKKCW NFCQAGKELR AEDIMEKDWN |
| |
NHKKGKDCSK |
| |
| 151 |
LGKKCIYQQL VRGRKIRRSS EEHLRQTRSE TMRNSVKSSF |
| |
HDPKLKGKPS |
| |
| 201 |
RERYVTHNRA HW |
| |
| SEQ ID NO: 17 |
| (amino acid sequence of pro-ET-1): |
| 1 |
APETAVLGAE LSAVGENGGE KPTPSPPWRL RRSKRCSCSS |
| |
LMDKECVYFC |
| |
| 51 |
HLDIIWVNTP EHVVPYGLGS PRSKRALENL LPTKATDREN |
| |
RCQCASQKDK |
| |
| 101 |
KCWNFCQAGK ELRAEDIMEK DWNNHKKGKD CSKLGKKCIY |
| |
QQLVRGRKIR |
| |
| 151 |
RSSEEHLRQT RSETMRNSVK SSFHDPKLKG KPSRERYVTH |
| |
NRAHW |
| |
| SEQ ID NO: 18 |
| (amino acid sequence of ET-1): |
| 1 |
CSCSSLMDKE CVYFCHLDII W |
| |
| SEQ ID NO: 19 |
| (amino acid sequence of CT-pro-ET-1): |
| 1 |
RSSEEHLRQT RSETMRNSVK SSFHDPKLKG KPSRERYVTH |
| |
NRAHW |
| |
| SEQ ID NO: 20 |
| (amino acid sequence of Big-ET-1): |
| 1 |
CSCSSLMDKE CVYFCHLDII WVNTPEHVVP YGLGSPRS |
| |
| SEQ ID NO: 21 |
| (amino acid sequence of pre-pro-Calcitonin): |
| 1 |
MGFQKFSPFL ALSILVLLQA GSLHAAPFRS ALESSPADPA |
| |
TLSEDEARLL |
| |
| 51 |
LAALVQDYVQ MKASELEQEQ EREGSSLDSP RSKRCGNLST |
| |
CMLGTYTQDF |
| |
| 101 |
NKFHTFPQTA IGVGAPGKKR DMSSDLERDH RPHVSMPQNA |
| |
N |
| |
| SEQ ID NO: 22 |
| (amino acid sequence of PCT): |
| 1 |
APFRSALESS PADPATLSED EARLLLAALV QDYVQMKASE |
| |
LEQEQEREGS |
| |
| 51 |
SLDSPRSKRC GNLSTCMLGT YTQDFNKFHT FPQTAIGVGA |
| |
PGKKRDMSSD |
| |
| 101 |
LERDHRPHVS MPQNAN |
| |
| SEQ ID NO: 23 |
| (amino acid sequence of N-terminal PCT): |
| 1 |
APFRSALESS PADPATLSED EARLLLAALV QDYVQMKASE |
| |
LEQEQEREGS |
| |
| 51 |
SLDSPRS |
| |
| SEQ ID NO: 24 |
| (amino acid sequence of Calcitonin): |
| 1 |
CGNLSTCMLG TYTQDFNKFH TFPQTAIGVG AP |
| |
| SEQ ID NO: 25 |
| (amino acid sequence of Katacalcin): |
| 1 |
DMSSDLERDH RPHVSMPQNA N |
| |
| SEQ ID NO: 26 |
| (amino acid sequence of pre-pro-BNP): |
| 1 |
MDPQTAPSRA LLLLLFLHLA FLGGRSHPLG SPGSASDLET |
| |
SGLQEQRNHL |
| |
| 51 |
QGKLSELQVE QTSLEPLQES PRPTGVWKSR EVATEGIRGH |
| |
RKMVLYTLRA |
| |
| 101 |
PRSPKMVQGS GCFGRKMDRI SSSSGLGCKV LRRH |
| |
| SEQ ID NO: 27 |
| (amino acid sequence of pro-BNP): |
| 1 |
HPLGSPGSAS DLETSGLQEQ RNHLQGKLSE LQVEQTSLEP |
| |
LQESPRPTGV |
| |
| 51 |
WKSREVATEG IRGHRKMVLY TLRAPRSPKM VQGSGCFGRK |
| |
MDRISSSSGL |
| |
| 101 |
GCKVLRRH |
| |
| SEQ ID NO: 28 |
| (amino acid sequence of NT-pro-BNP): |
| 1 |
HPLGSPGSAS DLETSGLQEQ RNHLQGKLSE LQVEQTSLEP |
| |
LQESPRPTGV |
| |
| 51 |
WKSREVATEG IRGHRKMVLY TLRAPR |
| |
| SEQ ID NO: 29 |
| (amino acid sequence of BNP): |
| 1 |
SPKMVQGSGC FGRKMDRISS SSGLGCKVLR RH |
DESCRIPTION OF DRAWINGS
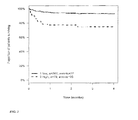
FIG. 1: Kaplan-Meier plot (proportion of patients surviving within four months) for patients with high (dashed lined) and low (solid line) levels of pre-interventionally measured MR-proANP.
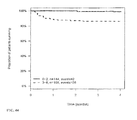
FIG. 2: Kaplan-Meier plot for patients with high (dashed lined) and low (solid line) levels of pre-interventionally measured MR-proADM.
FIG. 3: Kaplan-Meier plot for patients with high (dashed lined) and low (solid line) levels of pre-interventionally measured CT-proET-1.
FIG. 4: Kaplan-Meier plot for patients with high (dashed lined) and low (solid line) levels of pre-interventionally measured CT-proAVP.
FIG. 5: Kaplan-Meier plot for patients with high (dashed lined) and low (solid line) levels of pre-interventionally measured PCT.
FIG. 6: Kaplan-Meier plot for patients with high (dashed lined) and low (solid line) levels of pre-interventionally measured hGH.
FIG. 7: Kaplan-Meier plot for patients with high and low levels of pre-interventionally measured MR-proANP and CT-proAVP (pairwise combination of both markers). Solid line: both markers low (below defined threshold); dashed/dotted line: both markers high (above defined threshold); dashed line: first marker low, second marker high; dotted line: first marker high, second marker low.
FIG. 8: Kaplan-Meier plot for patients with high and low levels of pre-interventionally measured MR-proANP and MR-proADM (pairwise combination of both markers). Solid line: both markers low (below defined threshold); dashed/dotted line: both markers high (above defined threshold); dashed line: first marker low, second marker high; dotted line: first marker high, second marker low.
FIG. 9: Kaplan-Meier plot for patients with high and low levels of pre-interventionally measured MR-proANP and CT-proET-1 (pairwise combination of both markers). Solid line: both markers low (below defined threshold); dashed/dotted line: both markers high (above defined threshold); dashed line: first marker low, second marker high; dotted line: first marker high, second marker low.
FIG. 10: Kaplan-Meier plot for patients with high and low levels of pre-interventionally measured MR-proANP and PCT (pairwise combination of both markers). Solid line: both markers low (below defined threshold); dashed/dotted line: both markers high (above defined threshold); dashed line: first marker low, second marker high; dotted line: first marker high, second marker low.
FIG. 11: Kaplan-Meier plot for patients with high and low levels of pre-interventionally measured CT-proAVP and MR-proADM (pairwise combination of both markers). Solid line: both markers low (below defined threshold); dashed/dotted line: both markers high (above defined threshold); dashed line: first marker low, second marker high; dotted line: first marker high, second marker low.
FIG. 12: Kaplan-Meier plot for patients with high and low levels of pre-interventionally measured CT-proAVP and CT-proET-1 (pairwise combination of both markers). Solid line: both markers low (below defined threshold); dashed/dotted line: both markers high (above defined threshold); dashed line: first marker low, second marker high; dotted line: first marker high, second marker low.
FIG. 13: Kaplan-Meier plot for patients with high and low levels of pre-interventionally measured CT-proAVP and PCT (pairwise combination of both markers). Solid line: both markers low (below defined threshold); dashed/dotted line: both markers high (above defined threshold); dashed line: first marker low, second marker high; dotted line: first marker high, second marker low.
FIG. 14: Kaplan-Meier plot for patients with high and low levels of pre-interventionally measured MR-proADM and CT-proET-1 (pairwise combination of both markers). Solid line: both markers low (below defined threshold); dashed/dotted line: both markers high (above defined threshold); dashed line: first marker low, second marker high; dotted line: first marker high, second marker low.
FIG. 15: Kaplan-Meier plot for patients with high and low levels of pre-interventionally measured MR-proADM and PCT (pairwise combination of both markers). Solid line: both markers low (below defined threshold); dashed/dotted line: both markers high (above defined threshold); dashed line: first marker low, second marker high; dotted line: first marker high, second marker low.
FIG. 16: Kaplan-Meier plot for patients with high and low levels of pre-interventionally measured CT-proET-1 and PCT (pairwise combination of both markers). Solid line: both markers low (below defined threshold); dashed/dotted line: both markers high (above defined threshold); dashed line: first marker low, second marker high; dotted line: first marker high, second marker low.
FIG. 17: Kaplan-Meier plot for patients with high and low levels of pre-interventionally measured hGH and MR-proANP (pairwise combination of both markers). Solid line: both markers low (below defined threshold); dashed/dotted line: both markers high (above defined threshold); dashed line: first marker low, second marker high; dotted line: first marker high, second marker low.
FIG. 18: Kaplan-Meier plot for patients with high and low levels of pre-interventionally measured hGH and MR-proADM (pairwise combination of both markers). Solid line: both markers low (below defined threshold); dashed/dotted line: both markers high (above defined threshold); dashed line: first marker low, second marker high; dotted line: first marker high, second marker low.
FIG. 19: Kaplan-Meier plot for patients with high and low levels of pre-interventionally measured hGH and CT-proET-1 (pairwise combination of both markers). Solid line: both markers low (below defined threshold); dashed/dotted line: both markers high (above defined threshold); dashed line: first marker low, second marker high; dotted line: first marker high, second marker low.
FIG. 20: Kaplan-Meier plot for patients with high and low levels of pre-interventionally measured hGH and PCT (pairwise combination of both markers). Solid line: both markers low (below defined threshold); dashed/dotted line: both markers high (above defined threshold); dashed line: first marker low, second marker high; dotted line: first marker high, second marker low.
FIG. 21: Kaplan-Meier plot for patients with high levels of MR-proANP, MR-proADM, CT-proAVP, CT-proET-1 and/or PCT. Upper to lower curve: 0, 1, 2, 3 and 4 or more of the markers above defined threshold.
FIG. 22: Kaplan-Meier plot for patients with high levels of pre-interventionally measured MR-proANP, MR-proADM, CT-proAVP, CT-proET-1 and/or PCT. MR-proANP and CT-proAVP have been counted twice. Upper to lower curve: 0, 1, 2, 3, 4, 5 and 6 or more of the markers above defined threshold.
FIG. 23: Kaplan-Meier plot for patients with high and low levels of pre-interventionally measured MR-proANP and a modified Rankin Scale of 5 on day 5.
FIG. 24: Kaplan-Meier plot for patients with high and low levels of pre-interventionally measured MR-proANP and a Barthel Index <85% on day 5.
FIG. 25: Kaplan-Meier plot for patients with high and low levels of pre-interventionally measured PCT and a NIHSS Index <10 on day 1.
FIG. 26: Kaplan-Meier plot for patients with high and low levels of pre-interventionally measured MR-proANP and a NIHSS Index <10 on day 5.
FIG. 27: Kaplan-Meier plot for patients with high and low levels of pre-interventionally measured PCT and a NIHSS Index <10 on day 1.
FIG. 28: Kaplan-Meier plot for patients with high and low levels of MR-proANP measured pre-interventionally (day 0) and/or day 5. Solid line: level below threshold on day 0 and day 5; dashed line: level below threshold on day 0 and above threshold on day 5; dotted lined: level above threshold on day 0 and below threshold on day 5; dashed/dotted line: level above threshold on day 0 and day 5.
FIG. 29: Kaplan-Meier plot for patients with high and low levels of CT-proAVP measured pre-interventionally (day 0) and/or day 5. Solid line: level below threshold on day 0 and day 5; dashed line: level below threshold on day 0 and above threshold on day 5; dotted lined: level above threshold on day 0 and below threshold on day 5; dashed/dotted line: level above threshold on day 0 and day 5.
FIG. 30: Kaplan-Meier plot for patients with high and low levels of MR-proADM measured pre-interventionally (day 0) and/or day 5. Solid line: level below threshold on day 0 and day 5; dashed line: level below threshold on day 0 and above threshold on day 5; dotted lined: level above threshold on day 0 and below threshold on day 5; dashed/dotted line: level above threshold on day 0 and day 5.
FIG. 31: Kaplan-Meier plot for patients with high and low levels of CT-proET-1 measured pre-interventionally (day 0) and/or day 5. Solid line: level below threshold on day 0 and day 5; dashed line: level below threshold on day 0 and above threshold on day 5; dotted lined: level above threshold on day 0 and below threshold on day 5; dashed/dotted line: level above threshold on day 0 and day 5.
FIG. 32: Kaplan-Meier plot for patients with high and low levels of PCT measured pre-interventionally (day 0) and/or day 5. Solid line: level below threshold on day 0 and day 5; dashed line: level below threshold on day 0 and above threshold on day 5; dotted lined: level above threshold on day 0 and below threshold on day 5; dashed/dotted line: level above threshold on day 0 and day 5.
FIG. 33: Kaplan-Meier plot for patients with high NIHSS (>10) and low NIHSS (<10) on day 5.
FIG. 34: Kaplan-Meier plot for patients with high/low levels of MR-proANP measured on day 5.
FIG. 35: Kaplan-Meier plot for patients with high/low levels of MR-proANP and high/low NIHSS on day 5. Solid line: marker level low, NIHSS low; dashed line: marker level low, NIHSS high; dotted line: marker level high, NIHSS low, dashed/dotted line: marker level high, and NIHSS high.
FIG. 36: Kaplan-Meier plot for patients with high/low levels of CT-proAVP on day 5.
FIG. 37: Kaplan-Meier plot for patients with high/low levels of CT-proAVP and high/low NIHSS on day 5. Solid line: marker level low, NIHSS low; dashed line: marker level low, NIHSS high; dotted line: marker level high, NIHSS low, dashed/dotted line: marker level high, and NIHSS high.
FIG. 38: Kaplan-Meier plot for patients with high/low levels of CT-proET-1 on day 5.
FIG. 39: Kaplan-Meier plot for patients with high/low levels of CT-proET-1 and high/low NIHSS on day 5. Solid line: marker level low, NIHSS low; dashed line: marker level low, NIHSS high; dotted line: marker level high, NIHSS low, dashed/dotted line: marker level high, and NIHSS high.
FIG. 40: Kaplan-Meier plot for patients with Barthel Index <85% (dashed line) and >85% (solid line) on day 5.
FIG. 41: Kaplan-Meier plot for patients with high/low levels of MR-proANP and Barthel Index </>85% on day 5. Solid line: marker level low, Barthel Index >85%; dashed line: marker level low, Barthel Index <85%; dotted line: marker level high, Barthel Index >85%, dashed/dotted line: marker level high, and Barthel Index <85%.
FIG. 42: Kaplan-Meier plot for patients with high/low levels of CT-proAVP and Barthel Index </>85% on day 5. Solid line: marker level low, Barthel Index >85%; dashed line: marker level low, Barthel Index <85%; dotted line: marker level high, Barthel Index >85%, dashed/dotted line: marker level high, and Barthel Index <85%.
FIG. 43: Kaplan-Meier plot for patients with high/low levels of CT-proET-1 and Barthel Index </>85% on day 5. Solid line: marker level low, Barthel Index >85%; dashed line: marker level low, Barthel Index <85%; dotted line: marker level high, Barthel Index >85%, dashed/dotted line: marker level high, and Barthel Index <85%.
FIG. 44: Kaplan-Meier plot for patients with a modified Rankin Scale Score of 0-2 (solid line) and 3-6 (dashed line) on day 5.
FIG. 45: Kaplan-Meier plot for patients with high/low levels of MR-proANP and a modified Rankin Scale Score between 0-2 or 3-6 on day 5. Solid line: marker level low, Rankin 0-2; dashed line: marker level low, Rankin 3-6; dotted line: marker level high, Rankin 0-2, dashed/dotted line: marker level high, and Rankin 3-6.
FIG. 46: Kaplan-Meier plot for patients with high/low levels of MR-proADM and a modified Rankin Scale Score between 0-2 or 3-6 on day 5. Solid line: marker level low, Rankin 0-2; dashed line: marker level low, Rankin 3-6; dotted line: marker level high, Rankin 0-2, dashed/dotted line: marker level high, and Rankin 3-6.
FIG. 47: Kaplan-Meier plot for patients with high/low levels of CT-proAVP and a modified Rankin Scale Score between 0-2 or 3-6 on day 5. Solid line: marker level low, Rankin 0-2; dashed line: marker level low, Rankin 3-6; dotted line: marker level high, Rankin 0-2, dashed/dotted line: marker level high, and Rankin 3-6.
FIG. 48: Kaplan-Meier plot for patients with high/low levels of CT-proET-1 and a modified Rankin Scale Score between 0-2 or 3-6 on day 5. Solid line: marker level low, Rankin 0-2; dashed line: marker level low, Rankin 3-6; dotted line: marker level high, Rankin 0-2, dashed/dotted line: marker level high, and Rankin 3-6.
FIG. 49: Kaplan-Meier plot for patients with high/low levels of PCT and a modified Rankin Scale Score between 0-2 or 3-6 on day 5. Solid line: marker level low, Rankin 0-2; dashed line: marker level low, Rankin 3-6; dotted line: marker level high, Rankin 0-2, dashed/dotted line: marker level high, and Rankin 3-6.
FIG. 50: Box plot of correlation between the modified Rankin Scale determined after 3 months and the level of pre-interventionally measured CT-proAVP (A) and MR-proANP (B), respectively. Rankin 0 to 6 on x-axis from left to right.
FIG. 51: Receiver Operating characteristics (ROC) plot for pre-interventionally measured CT-pro A VP and dichotomized modified Rankin Scale after 3 months (good outcome=mRS 0-2; bad outcome=mRS 3-6). Area under the curve (AUC)=0.723.
FIG. 52: ROC plot for pre-interventionally measured MR-proANP and dichotomized modified Rankin Scale after 3 months (good outcome=mRS 0-2; bad outcome=mRS 3-6). AUC=0.703.
FIG. 53: ROC plot for pre-interventionally measured MR-proADM and dichotomized modified Rankin Scale after 3 months (good outcome=mRS 0-2; bad outcome=mRS 3-6). AUC=0.658.
FIG. 54: ROC plot for pre-interventionally measured CT-proET-1 and dichotomized modified Rankin Scale after 3 months (good outcome=mRS 0-2; bad outcome=mRS 3-6). AUC=0.608.
FIG. 55: ROC plot for pre-interventionally measured PCT and dichotomized modified Rankin Scale after 3 months (good outcome=mRS 0-2; bad outcome=mRS 3-6). AUC=0.580.
FIG. 56: ROC plot for pre-interventionally measured hGH and dichotomized modified Rankin Scale after 3 months (good outcome=mRS 0-2; bad outcome=mRS 3-6). AUC=0.581.
FIG. 57: Distribution of MR-proANP levels in patients with ischemic stroke, hemorrhagic stroke and TIA. Median values are 137.0 pmol/L, 124.0 pmol/L and 90.6 pmol/L, respectively.
FIG. 58: ROC plot for differential diagnosis of ischemic stroke and TIA using MR-proANP as single marker. AUC=0.65 (P<0.0001).
FIG. 59: ROC plot for differential diagnosis of hemorrhagic stroke and TIA using MR-proANP as single marker. AUC=0.65 (P<0.001)
FIG. 60: Distribution of CT-proAVP (copeptin) levels in patients with ischemic stroke, hemorrhagic stroke and TIA. Median values are 11.0 pmol/L, 16.6 pmol/L and 4.8 pmol/L, respectively.
FIG. 61: ROC plot for differential diagnosis of ischemic stroke and TIA using copeptin as single marker. AUC=0.71 (P<0.0001).
FIG. 62: ROC plot for differential diagnosis of hemorrhagic stroke and TIA using copeptin as single marker. AUC=0.74 (P<0.0001)
FIG. 63: Distribution of MR-proADM levels in patients with ischemic stroke, hemorrhagic stroke and TIA. Median values are 0.74 nmol/L, 0.71 nmol/L and 0.61 nmol/L, respectively.
FIG. 64: ROC plot for differential diagnosis of ischemic stroke and TIA using MR-proADM as single marker. AUC=0.61 (P<0.0001).
FIG. 65: ROC plot for differential diagnosis of hemorrhagic stroke and TIA using MR-proADM as single marker. AUC=0.59 (P=0.033)
FIG. 66: Distribution of CT-proET-1 levels in patients with ischemic stroke, hemorrhagic stroke and TIA. Median values are 72.0 pmol/L, 75.7 pmol/L and 63.3 pmol/L, respectively.
FIG. 67: ROC plot for differential diagnosis of ischemic stroke and TIA using CT-proET-1 as single marker. AUC=0.59 (P<0.001).
FIG. 68: ROC plot for differential diagnosis of hemorrhagic stroke and TIA using CT-proET-1 as single marker. AUC=0.68 (P<0.0001)
FIG. 69: Distribution of PCT levels in patients with ischemic stroke, hemorrhagic stroke and TIA. Median values are 0.018 ng/mL, 0.018 ng/mL and 0.016 ng/mL, respectively.
FIG. 70: ROC plot for differential diagnosis of ischemic stroke and TIA using PCT as single marker. AUC=0.58 (P<0.001).
FIG. 71: ROC plot for differential diagnosis of hemorrhagic stroke and TIA using PCT as single marker. AUC=0.56 (P=0.17)
FIG. 72: Distribution of hGH levels in patients with ischemic stroke, hemorrhagic stroke and TIA. Median values are 0.42 ng/mL, 0.41 ng/mL and 0.24 ng/mL, respectively.
FIG. 73: ROC plot for differential diagnosis of ischemic stroke and TIA using hGH as single marker. AUC=0.60 (P<0.001).
FIG. 74: ROC plot for differential diagnosis of hemorrhagic stroke and TIA using hGH as single marker. AUC=0.61 (P=0.013)
FIG. 75: SEQ ID NO:1 (amino acid sequence of pre-pro-ADM)
FIG. 76: SEQ ID NO:2 (amino acid sequence of pro-ADM)
FIG. 77: SEQ ID NO:3 (amino acid sequence of pro-ADM N20)
FIG. 78: SEQ ID NO:4 (amino acid sequence of MR-pro-ADM)
FIG. 79: SEQ ID NO:5 (amino acid sequence of ADM)
FIG. 80: SEQ ID NO:6 (amino acid sequence of pre-pro-ANP)
FIG. 81: SEQ ID NO:7 (amino acid sequence of pro-ANP)
FIG. 82: SEQ ID NO:8 (amino acid sequence of ANP)
FIG. 83: SEQ ID NO:9 (amino acid sequence of NT-proANP)
FIG. 84: SEQ ID NO:10 (amino acid sequence of amino acids 53-90 of proANP)
FIG. 85: SEQ ID NO:11 (amino acid sequence of pre-pro-AVP)
FIG. 86: SEQ ID NO:12 (amino acid sequence of pro-AVP)
FIG. 87: SEQ ID NO:13 (amino acid sequence of AVP)
FIG. 88: SEQ ID NO:14 (amino acid sequence of CT-pre-proAVP or Copeptin)
FIG. 89: SEQ ID NO:15 (amino acid sequence of Neurophysin II)
FIG. 90: SEQ ID NO:16 (amino acid sequence of pre-pro-ET-1)
FIG. 91: SEQ ID NO:17 (amino acid sequence of pro-ET-1)
FIG. 92: SEQ ID NO:18 (amino acid sequence of ET-1)
FIG. 93: SEQ ID NO:19 (amino acid sequence of CT-pro-ET-1)
FIG. 94: SEQ ID NO:20 (amino acid sequence of Big-ET-1)
FIG. 95: SEQ ID NO:21 (amino acid sequence of pre-pro-Calcitonin)
FIG. 96: SEQ ID NO:22 (amino acid sequence of PCT)
FIG. 97: SEQ ID NO:23 (amino acid sequence of N-terminal PCT)
FIG. 98: SEQ ID NO:24 (amino acid sequence of Calcitonin)
FIG. 99: SEQ ID NO:25 (amino acid sequence of Katacalcin)
FIG. 100: SEQ ID NO:26 (amino acid sequence of pre-pro-BNP)
FIG. 101: SEQ ID NO:27 (amino acid sequence of pro-BNP)
FIG. 102: SEQ ID NO:28 (amino acid sequence of NT-pro-BNP)
FIG. 103: SEQ ID NO:29 (amino acid sequence of BNP
EXAMPLES
Example 1: Clinical Study
Study Setting, Inclusion/Exclusion Criteria
The study was set at the emergency and neurological and neurosurgical clinic of the University Hospital of Basel. All consecutive patients who are admitted to the emergency department with an ischemic or hemorrhagic stroke or transient ischemic attack (TIA) according to the World Health Organization criteria with symptom onset within the last 3 days were included into the study. Patients without an informed consent were excluded.
Baseline Data Collection
Access to data of all eligible patients that are not included into this study is important to avoid a selection bias. Thus, baseline data and information on inclusion and exclusion criteria in all eligible patients were collected irrespective whether they are or are not included into the study. This allows the comparison of baseline data of eligible patients who consented to participate with those who did not. Baseline data collection in patients were collected by the investigators and comprised:
a) age
b) gender
c) BMI
d) Medical history items: actual history that preceded the hospitalization; ABCD score (Rothwell et al., 2005. A simple score (ABCD) to identify individuals at high early risk of stroke after transient ischaemic attack. Lancet 366: 29-36) in patients with transient ischemic attack; family history; relevant co-morbidities also assessed by the charlson index (Goldstein et al., 2004. Charlson Index comorbidity adjustment for ischemic stroke outcome studies. Stroke 35: 1941-5) (i.e. hypertension, previous stroke, previous TIA, ischemic heart disease, atrial fibrillation, diabetes mellitus, renal and liver dysfunction, congestive heart failure, dyslipidemia; comorbidities with the risk of hyponatremia (severe hypothyroidism, glucocorticoid insufficiency, neoplasm, HIV infection); smoking history (pack-years) and status (pack per day); current medication; alcohol consumption (glass and grams per day); time from onset of symptoms to admission.
e) Place of residence: i.e. independent living, defined as living at home or in an old people's home with or without support of the family circle and/or professional care (the family circle consists of the spouse and/or other important persons who live together with the patient; dependent living, defined as nursing home long-stay department, other hospital.
f) Clinical items: physical examination including neurological status, NIHSS (to assess the severity of stroke) and Glasgow Coma scale (GCS; Adams et al., 1999. Baseline NIH Stroke Scale score strongly predicts outcome after stroke: A report of the Trial of Org 10172 in Acute Stroke Treatment (TOAST). Neurology 53: 126-31), blood pressure, pulse rate, weight, volume status (including skin turgor, jugular venous distension, auscultation, if available flow sheet of fluid intake and loss), body temperature; in neurosurgical patients intracerebral pressure if performed within the routine clinical management.
g) Clinical symptoms of hyponatraemia were evaluated on admission and in case of sodium imbalance in neurological patients. In patients undergoing intracranial surgery evaluate clinical symptoms were evaluated daily. Specifically the presence of headache, anorexia, nausea, vomiting, muscle cramps and aches, seizures, confusion, apathetic or lethargic development was monitored.
h) Routine/Standard laboratory tests: routine blood sampling including: hematocrit, blood urea nitrogen, bicarbonate, total protein, albumin, uric acid serum and urine electrolytes, urine and serum osmolality, creatinine, lipids, TSH, fT4, T3, and basal cortisol. All blood sampling was done before any food intake, or smoking, if feasible. Alternatively, influencing factors were monitored.
i) Imaging: Computer tomography or MRI of the neurocranium (T1, T2, diffusion-weighted image sequence, with or without contrast), if indicated magnetic resonance angiography or conventional cerebral angiography. The time-points of contrast agent application were recorded.
Stroke patients were also classified on the basis of the vascular territory of the ischemic lesion as follows: total anterior circulation syndrome (TACS), partial anterior circulation syndrome (PACS), lacunar circulation syndrome (LACS), posterior circulation syndrome (POCS).
j) Further investigations: Stroke patients had neurosonography, echocardiography, standard 12-leaf electrocardiography and 24-hour electrocardiography and then were classified by etiology of strokes according to Trial of Org 10172 in acute Treatment (TOAST) stroke subtype classification, which differs between large artery atherosclerosis, cardioembolism, small-artery occlusion, other etiology, and undetermined etiology.
Informed Consent Statement
The study was approved by the ethics committee of Basel (Ethikkommission beider Basel). It is important to note that this is an exploratory and observational study; the only study related intervention will be the asseveration of 7.5 ml of plasma obtained during the routinely performed blood sampling. Therefore, patients were required to provide written informed consent that they agree for the use of their data for scientific purposes. In patients, in which “informed consent” was not feasible due to sequela of the acute CNS lesion (the latter a prerequisite for inclusion), patients' next to kin could sign an assent form to state the presumptive will of the patient. In case, next of kin were not readily available, a treating physician—who must not be involved in the study—had to certify that there are no objections for inclusion in the study from his point of view. Only after these informed consent procedures the patient could be included in the study.
Management of Participants Throughout the Trial
Step 1.
All eligible patients in the emergency department or the neurological ward were included into the study.
Step 2.
All baseline data were collected.
Step 3.
During hospitalization clinical items including weight, blood pressure, pulse rate, volume status and body temperature were assessed by chart review until discharge.
-
- Fluid treatment and drugs
- Potential symptoms of hyponatremia, i.e. headache, nausea, vomiting, muscle cramps and aches, anorexia, impaired consciousness, seizure.
- Routinely performed laboratory tests (chemogram, plasma glucose, serum osmolality, urine osmolality, sodium in urine, hematocrit) were sampled at the time-points upon routine blood sampling.
Step 4.
In all patients, on day 5 of the hospitalization, a clinical examination with NIHSS, Barthel Index and Rankin Scale were performed (Collin et al., 1988. The Barthel ADL Index: a reliability study, International Disability Study 10: 61-3; Bonita and Beaglehole, 1988. Modification of Rankin Scale: Recovery of motor function after stroke. Stroke 19:1497-1500).
The future place of residence (i.e. dependent vs. independent living) was assessed.
Step 6.
In patients with ischemic stroke a telephone follow-up regarding morbidity and mortality (as assessed by the Barthel Index and Rankin Scale) was obtained after 3 months. An unfavorable outcome was defined as a Barthel index <85 or modified Rankin scale of 3 to 6.
Measurement of Marker Peptide Concentrations
MR-proANP levels were measured with a chemiluminescence sandwich immunoassay with a lower detection limit of 6 pmol/L. In 325 healthy individuals the range of MR-proANP concentrations was 9.6-313 pmol/L with a median of 45 pmol/L. Concentrations differed not significantly between males and females, but significantly correlated with the age of the subjects.
MR-proADM levels were measured with a chemiluminescence sandwich immunoassay with a lower detection limit of 0.08 nmol/L. In 264 healthy individuals (117 male and 147 female) MR-proADM values followed a Gaussian distribution with mean (SD) values of 0.33 (0.07) nmol/L and a range of 0.10-0.64 nmol/L. There was no significant difference between gender, but MR-proADM concentrations significantly correlated with age.
CT-proET-1 levels were measured with a chemiluminescence sandwich immunoassay with a lower detection limit of 0.4 pmol/L. In 326 healthy individuals (150 male and 176 female) CT-proET-1 values followed a Gaussian distribution with a mean (SD) of 44.3 (10.6) pmol/L and a range of 10.5-77.4 pmol/L. Mean CT-proET-1 concentrations in males and females were not significantly different but significantly correlated with age.
CT-proAVP (Copeptin) levels were measured with a chemiluminescence sandwich immunoassay with a lower detection limit of 1.7 pmol/L. In 359 healthy individuals (153 men and 206 women), median CT-proAVP levels were 4.2 pmol/L ranging from 1.0-13.8 pmol/L. Median concentrations of CT-proAVP differed significantly between male and female. There was no correlation between CT-proAVP levels and age.
PCT levels were measured with the chemiluminescence sandwich immunoassay “PCT sensitive” (B.R.A.H.M.S, Hennigsdorf, Germany) with a lower detection limit of 7 pg/ml. In 500 healthy individuals, the median was 13.5 pg/ml (range <7 to 63 pg/ml). There were no significant differences in the range and median PCT values between males and females or among age groups.
Human growth hormone was measured with a newly developed chemiluminescence sandwich immunoassay for the specific detection of the most abundant 22 kDa hGH isoform. The median concentration of the 22 kDa hGH isoform in a cohort of 50 blood donors was 0.19 ng/ml (range 0.05-8.82 ng/ml).
The plasma levels of the marker peptides MR-proANP, MR-proADM, CT-proET-1, CT-proAVP (Copeptin), PCT and hGH have been determined in 352 patients with ischemic stroke, in 32 patients with cerebral hemorrhage and in 102 patients with TIA. Blood samples were taken at the day of hospitalization (day 0) and 1, 3 and 5 days after hospitalization.
Examples 2 to 11
Examples 2 to 11 concern the same group of patients and are based on the study of example 1. Tables 1 and 2 summarize the patients of the study and their outcome. Blood samples (EDTA treated plasma samples) were taken from a group of 501 stroke or TIA patients. The group of patients is the same as in example 1, however, the number may slightly differ, since not for all days all patients were available and not on all days enough sample volume was available for every patient to determine all markers.
Example 2: Prognosis of Survival (Death within 3 Months) with Markers Measured on Day 0
The outcome for patients with stroke or TIA within 3 (4) months after the stroke or TIA is investigated and correlated to the level of the markers MR-proANP, MR-proADM, CT-proAVP, CT-proET1 and PCT in samples of said patients. Samples have been taken on day 0 (day of hospitalization). From this correlation hazard ratios (HR) have been calculated for the given cut-off values (threshold values). The cut-off values have been determined by maximizing the sum of sensitivity and specificity as determined from time-dependent ROC analysis.
Tables 3a to 4 summarize the HR values for the different markers and their combinations. FIGS. 1 to 27 show the Kaplan-Meier plots (proportion of patients surviving within four months) for the different markers/marker combinations and in combination with Rankin/Barthels Index/NIHSS.
| TABLE 1 |
| |
| Summary of patients |
| |
definite diagnosis |
frequency |
percentage |
| |
| |
hemorrhagic stroke |
32 |
6.4 |
| |
ischemic stroke |
362 |
72.3 |
| |
TIA |
107 |
21.4 |
| |
sum |
501 |
100.0 |
| |
| TABLE 2 |
| |
| Survival of patients |
| |
dead within 3 months |
frequency |
percentage |
| |
| |
yes |
53 |
10.6 |
| |
no |
447 |
89.2 |
| |
unknown |
1 |
0.2 |
| |
sum |
501 |
100.0 |
| |
| TABLE 3a |
| |
| Hazard ratios (HR) for different markers |
| |
MR-proANP |
10.8 |
188 |
| |
CT-proAVP |
9.4 |
20.257 |
| |
MR-proADM |
4.7 |
0.666 |
| |
CT-proET-1 |
4.1 |
98.3 |
| |
PCT sens |
3.4 |
0.026 |
| |
hGH |
1.4 |
0.34 |
| |
| TABLE 3b |
| |
| Hazard ratios (HR) for different marker combinations |
| |
|
HR (both high |
| |
Marker combination |
vs both low) |
| |
| |
MR-proANP + CT-proAVP |
61.4 |
| |
MR-proANP + MR-proADM |
62.7 |
| |
MR-proANP + CT-proET-1 |
17.6 |
| |
MR-proANP + PCT sens |
25.2 |
| |
CT-proAVP + MR-proADM |
37.9 |
| |
CT-proAVP + CT-proET-1 |
13.2 |
| |
CT-proAVP + PCT sens |
25.3 |
| |
MR-proADM + CT-proET-1 |
8.7 |
| |
MR-proADM + PCT sens |
11.4 |
| |
CT-proET-1 + PCT sens |
6.8 |
| |
HGH + MR-proANP |
12.3 |
| |
HGH + MR-proADM |
5.8 |
| |
HGH + CT-proET-1 |
5.0 |
| |
HGH + PCT sens |
4.4 |
| |
| TABLE 3c |
| |
| Hazard ratios (HR) for combination of all six markers |
| |
|
HR (>3 high vs |
| |
Marker combinations |
all low) |
| |
| |
Combination of 6, model 1 |
>100 |
| |
Combination of 6, model 2 |
>100 |
| |
| TABLE 4 |
| |
| Hazard ratios (HR) of different markers |
| in combination with different scores |
| |
HR |
HR |
HR |
HR |
HR |
| |
com- |
mRS, |
Barthel, |
NIHSS, |
NIHSS, |
| Marker | plete |
day | 5 = 5 |
day 5 <85% | day | 1 >10 |
day 5 >10 |
| |
| MR-proANP |
10.8 |
22.4 |
31.1 |
7.8 |
>100 |
| CT-proAVP |
9.4 |
1.8 |
3.5 |
2.9 |
3.0 |
| MR-proADM |
4.7 |
2.3 |
1.4 |
3.0 |
3.2 |
| CT-proET-1 |
4.1 |
2.4 |
2.1 |
3.2 |
3.2 |
| PCT sens |
3.4 |
2.5 |
2.5 |
4.3 |
6.8 |
| |
Example 3: Prognosis of Survival (Death within 3 Months) with Markers Measured on Day 0 and Day 5 ( Days 0 and 5 in Combination)
| TABLE 5 |
| |
| Hazard ratios (HR) for different markers |
| |
HR |
HR (both high |
|
| Marker, day 0 and day 5 |
(day 0 only) |
vs both low) |
cut off |
| |
| MR-proANP |
10.8 |
26.5 |
188 |
| CT-proAVP |
9.4 |
24.2 |
20.257 |
| MR-proADM |
4.7 |
6.6 |
0.666 |
| CT-proET-1 |
4.1 |
8.7 |
98.3 |
| PCT sens |
3.4 |
7.8 |
0.026 |
| hGH |
1.4 |
1.4 |
0.34 |
| |
Table 5 summarizes the HR values for the different markers in samples taken on day 0 and 5. FIGS. 28 to 32 show the Kaplan-Meier plots (proportion of patients surviving within four months) for the different markers.
Example 4: Prognosis of Survival (Death within 3 Months) with Markers Measured on Day 5 and in Combination with the NIHSS
| TABLE 6 |
| |
| Hazard ratios (HR) for different markers |
| Marker, day 5 and |
HR |
HR (both high |
|
| NIHSS (>10) |
(day 5 only) |
vs both low) |
cut off |
| |
| NIHSS |
7.3 |
— |
10 |
| MR-proANP |
8.0 |
44.6 |
188 |
| CT-proAVP |
18.3 |
43.4 |
20.257 |
| MR-proADM |
2.8 |
14.6 |
0.666 |
| CT-proET-1 |
7.9 |
48.4 |
98.3 |
| PCT sens |
4.1 |
17.7 |
0.026 |
| hGH |
1.4 |
6.6 |
0.34 |
| |
Table 6 summarizes the HR values for the different markers in samples taken on day 5 and in combination with the NIHSS values for said patients. FIGS. 33 to 39 show the Kaplan-Meier plots (proportion of patients surviving within four months) for NIHSS alone and for the different markers in combination with NIHSS based on samples taken on day 5.
Example 5: Prognosis of Survival (Death within 3 Months) with Markers Measured on Day 5 and in Combination with the Barthel Index
| TABLE 7 |
| |
| Hazard ratios (HR) for different markers |
| Marker, day 5 and |
HR |
HR (both high |
|
| Barthel Index (<85%) |
(day 5 only) |
vs both low) |
cut off |
| |
| Barthel Index |
12.3 |
— |
85% |
| MR-proANP |
8.0 |
44.0 |
188 |
| CT-proAVP |
18.3 |
>100 |
20.257 |
| MR-proADM |
2.8 |
14.6 |
0.666 |
| CT-proET-1 |
7.9 |
68.5 |
98.3 |
| PCT sens |
4.1 |
24.4 |
0.026 |
| hGH |
1.4 |
7.2 |
0.34 |
| |
Table 7 summarizes the HR values for the different markers in samples taken on day 5 and in combination with Barthel Index values for said patients. FIGS. 40 to 43 show the Kaplan-Meier plots (proportion of patients surviving within four months) for Barthel Index for the different markers in combination with Barthel Index based on samples taken on day 5.
Example 6: Prognosis of Survival with Markers Measured on Day 5 and in Combination with the Modified Rankin Scale, Outcome “Dead within 3 Months”
| TABLE 8 |
| |
| Hazard ratios (HR) for different markers |
| Marker, day 5 and |
HR |
HR (both high |
|
| Rankin (>2) |
(day 5 only) |
vs both low) |
cut off |
| |
| Rankin |
10.7 |
— |
0-2 vs. 3-6 |
| MR-proANP |
8.0 |
37.1 |
188 |
| CT-proAVP |
18.3 |
>100 |
20.257 |
| MR-proADM |
2.8 |
12.9 |
0.666 |
| CT-proET-1 |
7.9 |
49.6 |
98.3 |
| PCT sens |
4.1 |
20.4 |
0.026 |
| hGH |
1.4 |
5.7 |
0.34 |
| |
Table 8 summarizes the HR values for the different markers in samples taken on day 5 and in combination with the modified Rankin Scale values for said patients. FIGS. 44 to 49 show the Kaplan-Meier plots (proportion of patients surviving within four months) for the modified Rankin Scale alone and for the different markers in combination with the modified Rankin Scale based on samples taken on day 5.
Example 7: Prognosis of “Re-Stroke/Re-TIA” (within 3 Months) with Markers Measured on Day 0
Table 9 summarizes the re-occurrence of strokes (re-stroke) and TIAs (re-TIA) in the group of patients. Tables 10 to 14 summarize the calculated HR values for the different markers and marker combinations.
| TABLE 9 |
| |
| re-stroke or re-TIA within 3 months |
| |
re-event within 3 |
|
|
| |
months |
frequency |
percentage |
| |
| |
no |
419 |
83.6 |
| |
yes |
29 |
5.8 |
| |
unknown |
53 |
10.6 |
| |
sum |
501 |
100.0 |
| |
| TABLE 10 |
| |
| Odd ratios (OR) for different markers |
| |
|
|
OR |
|
| |
Marker |
OR |
(TIA only) |
cut off |
| |
| |
MR-proANP |
3.6 |
21.7 |
323.2 |
| |
CT-proAVP |
3.0 |
>100 |
38.6 |
| |
MR-proADM |
3.7 |
4.2 |
1.18 |
| |
CT-proET-1 |
— |
7.0 |
59.2 |
| |
PCT sens |
2.9 |
3.2 |
0.057 |
| |
hGH |
— |
1.9 |
0.34 |
| |
| TABLE 11 |
| |
| Odd ratios for different marker combinations |
| |
|
OR (both high |
| |
OR (both high |
vs both low) |
| Marker (combination) |
vs both low) |
TIA only |
| |
| MR-proANP + CT-proAVP |
7.4 |
>100 |
| MR-proANP + MR-proADM |
8.1 |
>100 |
| MR-proANP + CT-proET-1 |
— |
76.0 |
| MR-proANP + PCT sens |
4.5* |
24.0* |
| CT-proAVP + MR-proADM |
10.5 |
>100 |
| CT-proAVP + CT-proET-1 |
— |
>100 |
| CT-proAVP + PCT sens |
3.5* |
>100* |
| MR-proADM + CT-proET-1 |
— |
15.2 |
| MR-proADM + PCT sens |
5.1* |
— |
| CT-proET-1 + PCT sens |
— |
18.5 |
| hGH + MR-proADM |
— |
4.9 |
| |
| *not enough patients in the group “both high” to allow for calculation of OR; however, an OR is given for “both low” vs. “high in first marker”. |
Table 13a to 13e: Calculation of Odd Ratios for all Patients (Re-Stroke and Re-TIA)
| TABLE 13a |
| |
| Calculation of OR for MR-proANP |
| |
MR-proANP |
<cut off |
360 |
20 |
380 |
| |
|
>cut off |
35 |
7 |
42 |
| |
|
sum |
395 |
27 |
422 |
| |
Odds Ratio |
3.6 |
| |
| TABLE 13b |
| |
| Calculation of OR for CT-proAVP |
| |
CT-proAVP |
<cut off |
346 |
19 |
365 |
| |
|
>cut off |
48 |
8 |
56 |
| |
|
sum |
394 |
27 |
421 |
| |
Odds Ratio |
3.0 |
| |
| TABLE 13c |
| |
| Calculation of OR for MR-proADM |
| |
MR-proADM |
<cut off |
372 |
22 |
394 |
| |
|
>cut off |
23 |
5 |
28 |
| |
|
sum |
395 |
27 |
422 |
| |
Odds Ratio |
3.7 |
| |
| TABLE 13d |
| |
| Calculation of OR for combination |
| of MR-proANP and CT-proAVP |
| MR-proANP + |
both low |
325 |
17 |
342 |
| CT-proAVP |
both high |
13 |
5 |
18 |
| |
sum |
338 |
22 |
360 |
| Odds Ratio |
7.4 |
|
|
|
| MR-proANP + |
both low |
346 |
19 |
365 |
| MR-proADM |
both high |
9 |
4 |
13 |
| |
sum |
355 |
23 |
378 |
| Odds Ratio |
8.1 |
| |
| TABLE 13e |
| |
| Calculation of OR for combination |
| of CT-proAVP and MR-proADM |
| CT-proAVP + |
both low |
331 |
18 |
349 |
| MR-proADM |
both high |
7 |
4 |
11 |
| |
sum |
338 |
22 |
360 |
| Odds Ratio |
10.5 |
| |
Table 14a to 14d: Calculation of Odd Ratios for TIA Patients (Re-Stroke and Re-TIA)
| TABLE 14a |
| |
| Calculation of OR for MR-proANP |
| |
MR-proANP |
<cut off |
87 |
8 |
95 |
| |
|
>cut off |
1 |
2 |
3 |
| |
|
sum |
88 |
10 |
98 |
| |
Odds Ratio |
21.8 |
| |
| TABLE 14b |
| |
| Calculation of OR for CT-proAVP |
| |
CT-proAVP |
<cut off |
88 |
8 |
96 |
| |
|
>cut off |
0 |
2 |
2 |
| |
|
sum |
88 |
10 |
98 |
| |
Odds Ratio |
>100 |
| |
| TABLE 14c |
| |
| Calculation of OR for MR-proADM |
| |
MR-proADM |
<cut off |
83 |
8 |
91 |
| |
|
>cut off |
5 |
2 |
7 |
| |
|
sum |
88 |
10 |
98 |
| |
Odds Ratio |
4.2 |
| |
| TABLE 14d |
| |
| Calculation of OR for CT-proET1 |
| |
CT-proET1 |
<cut off |
38 |
1 |
39 |
| |
|
>cut off |
49 |
9 |
58 |
| |
|
sum |
87 |
10 |
97 |
| |
Odds Ratio |
7.0 |
| |
| TABLE 14e |
| |
| Calculation of OR for combination |
| of MR-proANP and CT-proAVP |
| MR-proANP + |
both low |
87 |
7 |
94 |
| CT-proAVP |
both high |
0 |
1 |
1 |
| |
sum |
87 |
8 |
95 |
| Odds Ratio |
>100 |
| |
| TABLE 14f |
| |
| Calculation of OR for combination of CT-proET1 and CT-proAVP |
| |
CT-proET1 |
both low |
38 |
1 |
39 |
| |
CT-proAVP |
both high |
0 |
2 |
2 |
| |
|
sum |
38 |
3 |
41 |
| |
| TABLE 14g |
| |
| Calculation of OR for combination |
| of MR-proANP and MR-proADM |
| MR-proANP |
both low |
82 |
8 |
90 |
| MR-proADM |
both high |
0 |
2 |
2 |
| |
sum |
82 |
10 |
92 |
| Odds Ratio |
>100 |
| |
Example 8: Prognosis of “Re-Stroke/Re-TIA (within 3 Months) with Markers Measured on Day 0 and in Combination with Day 5
Tables 15 to 16d summarize the results of a ROC analysis (monitoring), particularly the odds ratios, for different markers/Marker combinations.
| TABLE 15 |
| |
| Calculation of OR for different markers |
| |
OR |
OR (both high |
|
| Marker, day 0 and day 5 |
(only day 0) |
vs both low) |
cut off |
| |
| MR-proANP |
3.6 |
5.1 |
323.2 |
| CT-proAVP |
3.0 |
8.5 |
38.6 |
| MR-proADM |
3.7 |
4.8 |
1.18 |
| CT-proET-1 |
— |
— |
59.2 |
| PCT sens |
2.9 |
4.2 |
0.057 |
| hGH |
— |
4.2 |
0.34 |
| |
Table 16a to d: Calculation of OR for single markers, day 0 and day 5:
| TABLE 16a |
| |
| Calculation of OR for MR-proANP |
| |
day 0, day 5 |
both low |
241 |
14 |
255 |
| |
|
both high |
17 |
5 |
22 |
| |
|
sum |
258 |
19 |
277 |
| |
Odds Ratio |
5.1 |
| |
| TABLE 16b |
| |
| Calculation of OR for CT-proAVP |
| |
day 0, day 5 |
both low |
220 |
13 |
233 |
| |
|
both high |
4 |
2 |
6 |
| |
|
sum |
224 |
15 |
239 |
| |
Odds Ratio |
8.5 |
| |
| TABLE 16c |
| |
| Calculation of OR for MR-proADM |
| |
day 0, day 5 |
both low |
241 |
15 |
256 |
| |
|
both high |
10 |
3 |
13 |
| |
|
sum |
251 |
18 |
269 |
| |
Odds Ratio |
4.8 |
| |
| TABLE 16d |
| |
| Calculation of OR for PCT |
| |
day 0, day 5 |
both low |
235 |
16 |
251 |
| |
|
both high |
7 |
2 |
9 |
| |
|
sum |
242 |
18 |
260 |
| |
Odds Ratio |
4.2 |
| |
Example 9: Prognosis of Functional Outcome (mRS, after 3 Months) with Markers Measured on Day 0
Table 17 summarizes the outcome for the group of patients in terms of the modified Rankin Scale (0 to 6). Table 18 lists the Kruskal-Wallis Chi2 statistic and p value for the correlation of the different markers with the modified Rankin Scale. Table 19 summarizes the outcome in two classes: Patients with a good outcome (Rankin 0-2) and patients with a bad outcome (Rankin 3-6). Tables 20a to 20dc summarize the OR on day 0 of the markers/marker combinations for patients with good or bad outcome after 3 months]. Tables 21a to 21h summarize the calculated odds ratios (OR) for the different markers/marker combinations. FIG. 50 illustrates the correlation between Rankin and level of CT-proA VP (A) and MRproANP (B), respectively, in a box plot. FIGS. 51 to 56 illustrates the ROC plots for the different markers.
| TABLE 17 |
| |
| Frequency distribution for the outcome (measured with the modified |
| Rankin Scale) of Stroke/TIA patients after 3 months |
| |
Rankin after |
|
|
| |
3 months | frequency |
percentage | |
| |
| |
0 |
155 |
30.9 |
| |
1 |
106 |
21.2 |
| |
2 |
53 |
10.6 |
| |
3 |
55 |
11.0 |
| |
4 |
56 |
11.2 |
| |
5 |
20 |
4.0 |
| |
6 |
53 |
10.6 |
| |
unknown |
3 |
0.6 |
| |
sum |
501 |
100.0 |
| |
| TABLE 18 |
| |
| Results for different markers |
| |
MR-proANP |
80.4 |
<0.0001 |
| |
CT-proAVP |
87.2 |
<0.0001 |
| |
MR-proADM |
40.5 |
<0.0001 |
| |
CT-proET-1 |
26.0 |
0.0005 |
| |
PCT sens |
22.2 |
0.0024 |
| |
| TABLE 19 |
| |
| Rankin after 3 months |
| |
Rankin after |
|
|
| |
3 months |
frequency |
percentage |
| |
| |
Rankin 0-2 |
314 |
62.7 |
| |
(“good”) |
|
|
| |
Rankin 3-6 |
184 |
36.7 |
| |
(“bad”) |
|
|
| |
unknown |
3 |
0.6 |
| |
sum |
501 |
100.0 |
| |
| TABLE 20a |
| |
| OR for different markers |
| |
MR-proANP |
4.5 |
188 |
| |
CT-proAVP |
5.1 |
20.257 |
| |
MR-proADM |
2.8 |
0.666 |
| |
CT-proET-1 |
3.6 |
98.3 |
| |
PCT sens |
2.1 |
0.026 |
| |
hGH |
1.5 |
0.34 |
| |
| TABLE 20b |
| |
| OR for different marker combinations |
| |
|
OR (both high vs |
| |
Marker (combinations) |
both low) |
| |
| |
MR-proANP + CT-proAVP |
15.6 |
| |
MR-proANP + MR-proADM |
7.3 |
| |
MR-proANP + CT-proET-1 |
7.6 |
| |
MR-proANP + PCT sens |
8.2 |
| |
CT-proAVP + MR-proADM |
9.8 |
| |
CT-proAVP + CT-proET-1 |
8.5 |
| |
CT-proAVP + PCT sens |
7.1 |
| |
MR-proADM + CT-proET-1 |
5.4 |
| |
MR-proADM + PCT sens |
4.4 |
| |
CT-proET-1 + PCT sens |
4.6 |
| |
HGH + CT-proAVP |
5.6 |
| |
HGH + MR-proADM |
4.3 |
| |
hGH + CT-proET-1 |
4.4 |
| |
hGH + PCT sens |
2.7 |
| |
hGH + MR-proANP |
6.2 |
| |
| TABLE 20c |
| |
| OR for combination of all 6 markers |
| |
|
OR (all high vs |
| |
Marker (combinations) |
all low |
| |
| |
combination of 6 |
22.0 |
| |
| TABLE 21a |
| |
| Calculation of OR for CT-proAVP |
| |
CT-proAVP |
<cut off |
246 |
85 |
331 |
| |
|
>cut off |
49 |
87 |
136 |
| |
|
sum |
295 |
172 |
467 |
| |
Odds Ratio |
5.1 |
| |
| TABLE 21b |
| |
| Calculation of OR for MR-proANP |
| |
MR-proANP |
<cut off |
232 |
77 |
309 |
| |
|
>cut off |
64 |
95 |
159 |
| |
|
sum |
296 |
172 |
468 |
| |
Odds Ratio |
4.5 |
| |
| TABLE 21c |
| |
| Calculation of OR for MR-proADM |
| |
MR-proADM |
<cut off |
175 |
59 |
234 |
| |
|
>cut off |
121 |
113 |
234 |
| |
|
sum |
296 |
172 |
468 |
| |
Odds Ratio |
2.8 |
| |
| TABLE 21d |
| |
| Calculation of OR for CT-proET-1 |
| |
CT-proET-1 |
<cut off |
263 |
121 |
384 |
| |
|
>cut off |
30 |
49 |
79 |
| |
|
sum |
293 |
170 |
463 |
| |
Odds Ratio |
3.6 |
| |
| TABLE 21e |
| |
| Calculation of OR for PCT |
| |
PCT |
<cut off |
238 |
114 |
352 |
| |
|
>cut off |
57 |
57 |
114 |
| |
|
sum |
295 |
171 |
466 |
| |
Odds Ratio |
2.1 |
| |
| TABLE 21f |
| |
| Calculation of OR for combination |
| of MR-proANP and CT-proAVP |
| |
MR-proANP + |
both low |
198 |
54 |
252 |
| |
CT-proAVP |
both high |
15 |
64 |
79 |
| |
|
sum |
213 |
118 |
331 |
| |
Odds Ratio |
15.6 |
| |
| TABLE 21g |
| |
| Calculation of OR for combination |
| of MR-proANP and MR-proADM |
| |
MR-proANP + |
both low |
151 |
39 |
190 |
| |
MR-proADM |
both high |
40 |
75 |
115 |
| |
|
sum |
191 |
114 |
305 |
| |
Odds Ratio |
7.3 |
| |
| TABLE 21h |
| |
| Calculation of OR for combination |
| of MR-proADM and CT-proAVP |
| |
MR-proADM + |
both low |
154 |
36 |
190 |
| |
CT-proAVP |
both high |
28 |
64 |
92 |
| |
|
sum |
182 |
100 |
282 |
| |
Odds Ratio |
9.8 |
| |
Example 10: Prognosis of Functional Outcome (mRS, after 3 Months) with Markers Measured on Day 0 and in Combination with Day 5
Table 22 summarizes the OR for the single markers on day 0 and in combination with day 5. Tables 23 and 24 summarize the calculated odds ratios (OR) for two different markers in correlation with Rankin values.
| TABLE 22 |
| |
| Odd ratios for different markers |
| |
OR |
OR (both high |
|
| Marker, day 0 and day 5 |
(only day 0) |
vs both low) |
cut off |
| |
| MR-proANP |
4.5 |
— |
188 |
| CT-proAVP |
5.1 |
6.5 |
20.257 |
| MR-proADM |
2.8 |
— |
0.666 |
| CT-proET-1 |
3.6 |
— |
98.3 |
| PCT sens |
2.1 |
3.3 |
0.026 |
| |
| TABLE 23 |
| |
| Calculation of OR for CT-proAVP, day 0 and day 5 |
| 0, day 5 |
both low |
151 |
54 |
205 |
| |
|
both high |
12 |
28 |
40 |
| |
|
sum |
163 |
82 |
245 |
| |
Odds Ratio |
6.5 |
| |
| TABLE 24 |
| |
| Calculation of OR for PCT, day 0 and day 5 |
| 0, day 5 |
both low |
129 |
42 |
171 |
| |
|
both high |
29 |
31 |
60 |
| |
|
sum |
158 |
73 |
231 |
| |
Odds Ratio |
3.3 |
| |
Example 11: Differential Diagnosis of TIA, Ischemic Stroke and Hemorrhagic Stroke
FIGS. 57 to 74 summarize the results for the use of MR-proANP, copeptin, MR-proADM, CT-proET-1, PCT and hGH as single markers for the differential diagnosis of TIA, ischemic stroke and hemorrhagic stroke. Marker levels have been determined as described above for day 0 and day 1. Median values have been determined for each marker and patient group (hemorrhagic stroke, ischemic stroke, TIA) and ROC curves for the differential diagnosis of hemorrhagic stroke from TIA and ischemic stroke from TIA have been created.
| TABLE 25 |
| |
| Optimal cut-off values for the differential diagnosis |
| of TIA from stroke (ischemic and hemorrhagic stroke, |
| respectively) using single markers. |
| |
|
|
Cut off TIA vs. |
Cut off TIA vs. |
| |
Marker |
|
Ischemic stroke |
hemorrhagic stroke |
| |
| |
CT-proAVP |
9.65 |
pmol/L |
11.35 |
pmol/L |
| |
CT-proET |
67.15 |
pmol/L |
66.35 |
pmol/L |
| |
hGH |
0.13 |
ng/ml |
0.13 |
ng/ml |
| |
MR-proADM |
0.67 |
nmol/L |
0.36 |
nmol/L |
| |
MR-proANP |
130.5 |
pmol/L |
96.1 |
pmol/L |
| |
PCT |
0.0235 |
ng/mL |
0.0235 |
ng/mL |
| |