RU2715548C2 - Device, method and system for graphical representation of signals depending on resolution - Google Patents
Device, method and system for graphical representation of signals depending on resolution Download PDFInfo
- Publication number
- RU2715548C2 RU2715548C2 RU2017133139A RU2017133139A RU2715548C2 RU 2715548 C2 RU2715548 C2 RU 2715548C2 RU 2017133139 A RU2017133139 A RU 2017133139A RU 2017133139 A RU2017133139 A RU 2017133139A RU 2715548 C2 RU2715548 C2 RU 2715548C2
- Authority
- RU
- Russia
- Prior art keywords
- data
- intervals
- representation
- specified
- alternative
- Prior art date
Links
Images

Classifications
-
- G—PHYSICS
- G06—COMPUTING; CALCULATING OR COUNTING
- G06T—IMAGE DATA PROCESSING OR GENERATION, IN GENERAL
- G06T11/00—2D [Two Dimensional] image generation
- G06T11/20—Drawing from basic elements, e.g. lines or circles
- G06T11/206—Drawing of charts or graphs
-
- G—PHYSICS
- G06—COMPUTING; CALCULATING OR COUNTING
- G06F—ELECTRIC DIGITAL DATA PROCESSING
- G06F3/00—Input arrangements for transferring data to be processed into a form capable of being handled by the computer; Output arrangements for transferring data from processing unit to output unit, e.g. interface arrangements
- G06F3/01—Input arrangements or combined input and output arrangements for interaction between user and computer
- G06F3/048—Interaction techniques based on graphical user interfaces [GUI]
- G06F3/0487—Interaction techniques based on graphical user interfaces [GUI] using specific features provided by the input device, e.g. functions controlled by the rotation of a mouse with dual sensing arrangements, or of the nature of the input device, e.g. tap gestures based on pressure sensed by a digitiser
-
- G—PHYSICS
- G06—COMPUTING; CALCULATING OR COUNTING
- G06T—IMAGE DATA PROCESSING OR GENERATION, IN GENERAL
- G06T11/00—2D [Two Dimensional] image generation
- G06T11/20—Drawing from basic elements, e.g. lines or circles
-
- G—PHYSICS
- G06—COMPUTING; CALCULATING OR COUNTING
- G06T—IMAGE DATA PROCESSING OR GENERATION, IN GENERAL
- G06T11/00—2D [Two Dimensional] image generation
- G06T11/60—Editing figures and text; Combining figures or text
-
- A—HUMAN NECESSITIES
- A61—MEDICAL OR VETERINARY SCIENCE; HYGIENE
- A61B—DIAGNOSIS; SURGERY; IDENTIFICATION
- A61B2576/00—Medical imaging apparatus involving image processing or analysis
- A61B2576/02—Medical imaging apparatus involving image processing or analysis specially adapted for a particular organ or body part
- A61B2576/023—Medical imaging apparatus involving image processing or analysis specially adapted for a particular organ or body part for the heart
-
- A—HUMAN NECESSITIES
- A61—MEDICAL OR VETERINARY SCIENCE; HYGIENE
- A61B—DIAGNOSIS; SURGERY; IDENTIFICATION
- A61B5/00—Measuring for diagnostic purposes; Identification of persons
- A61B5/02—Detecting, measuring or recording pulse, heart rate, blood pressure or blood flow; Combined pulse/heart-rate/blood pressure determination; Evaluating a cardiovascular condition not otherwise provided for, e.g. using combinations of techniques provided for in this group with electrocardiography or electroauscultation; Heart catheters for measuring blood pressure
- A61B5/024—Detecting, measuring or recording pulse rate or heart rate
-
- G—PHYSICS
- G06—COMPUTING; CALCULATING OR COUNTING
- G06T—IMAGE DATA PROCESSING OR GENERATION, IN GENERAL
- G06T1/00—General purpose image data processing
- G06T1/20—Processor architectures; Processor configuration, e.g. pipelining
-
- G—PHYSICS
- G16—INFORMATION AND COMMUNICATION TECHNOLOGY [ICT] SPECIALLY ADAPTED FOR SPECIFIC APPLICATION FIELDS
- G16H—HEALTHCARE INFORMATICS, i.e. INFORMATION AND COMMUNICATION TECHNOLOGY [ICT] SPECIALLY ADAPTED FOR THE HANDLING OR PROCESSING OF MEDICAL OR HEALTHCARE DATA
- G16H40/00—ICT specially adapted for the management or administration of healthcare resources or facilities; ICT specially adapted for the management or operation of medical equipment or devices
- G16H40/60—ICT specially adapted for the management or administration of healthcare resources or facilities; ICT specially adapted for the management or operation of medical equipment or devices for the operation of medical equipment or devices
- G16H40/63—ICT specially adapted for the management or administration of healthcare resources or facilities; ICT specially adapted for the management or operation of medical equipment or devices for the operation of medical equipment or devices for local operation
Landscapes
- Engineering & Computer Science (AREA)
- Theoretical Computer Science (AREA)
- Physics & Mathematics (AREA)
- General Physics & Mathematics (AREA)
- Health & Medical Sciences (AREA)
- General Engineering & Computer Science (AREA)
- Life Sciences & Earth Sciences (AREA)
- Biomedical Technology (AREA)
- Human Computer Interaction (AREA)
- Medical Informatics (AREA)
- Cardiology (AREA)
- Public Health (AREA)
- General Health & Medical Sciences (AREA)
- Veterinary Medicine (AREA)
- General Business, Economics & Management (AREA)
- Molecular Biology (AREA)
- Surgery (AREA)
- Animal Behavior & Ethology (AREA)
- Physiology (AREA)
- Pathology (AREA)
- Biophysics (AREA)
- Business, Economics & Management (AREA)
- Heart & Thoracic Surgery (AREA)
- Epidemiology (AREA)
- Primary Health Care (AREA)
- Controls And Circuits For Display Device (AREA)
- Image Processing (AREA)
- Measuring Pulse, Heart Rate, Blood Pressure Or Blood Flow (AREA)
- Measuring And Recording Apparatus For Diagnosis (AREA)
- Digital Computer Display Output (AREA)
- Apparatus For Radiation Diagnosis (AREA)
Abstract
Description
[0001] Стандартный подход к графическому изображению сигналов заключается в использовании линейной интерполяции для вычерчивания линии между точками, представляющими каждую индивидуальную выборку в сигнале. Данный подход может обеспечивать полезное и удобочитаемое изображение, когда количество выборок мало. Однако, по мере того как количество выборок увеличивается и становится значительно больше количества столбцов пикселей устройства отображения, используемого для предоставления графика пользователю, указанное изображение может стать перенасыщенным. [0001] A standard approach to plotting signals is to use linear interpolation to draw a line between points representing each individual sample in the signal. This approach can provide a useful and readable image when the number of samples is small. However, as the number of samples increases and becomes significantly larger than the number of columns of pixels of a display device used to provide a graph to a user, the image may become oversaturated.
[0002] Предложен компьютерочитаемый носитель для некратковременного хранения информации, хранящий набор инструкций, исполняемых процессором. Набор инструкций при исполнении их процессором заставляет процессор выполнять операции, включающие: [0002] A computer-readable medium for short-term storage of information is proposed that stores a set of instructions executed by a processor. A set of instructions when executed by the processor forces the processor to perform operations, including:
прием данных, содержащих множество точек данных, каждая из которых имеет значение вдоль первой оси и значение вдоль второй оси, receiving data containing many data points, each of which has a value along the first axis and a value along the second axis,
разделение данных на множество интервалов вдоль первой оси, при этом данные разделяются на основе физической характеристики устройства отображения, на котором эти данные должны быть отображены, dividing the data into multiple intervals along the first axis, the data being divided based on the physical characteristics of the display device on which this data should be displayed,
определение для одного из интервалов, необходимости использования альтернативного представления данных, иdetermination for one of the intervals, the need to use an alternative representation of the data, and
отображение графика данных, при этом displaying a data graph, while
для указанного одного из интервалов используют альтернативное представление данных, если определено, что альтернативное представление данных должно быть использовано, иfor the specified one of the intervals using an alternative data representation, if it is determined that an alternative data representation should be used, and
используют линейное построение графика для указанного одного из интервалов, если определено, что альтернативное представление данных не должно быть использовано.use linear plotting for the specified one of the intervals, if it is determined that an alternative representation of the data should not be used.
[0003] Также предложена система, имеющая интерфейс данных для приема данных, содержащих множество точек данных, каждая из которых имеет значение вдоль первой оси и значение вдоль второй оси, устройство отображения, запоминающее устройство для некратковременного хранения информации, хранящее набор инструкций, и процессор для исполнения набора инструкций. Исполнение инструкций заставляет процессор выполнять операции, включающие: [0003] Also proposed is a system having a data interface for receiving data containing a plurality of data points, each of which has a value along the first axis and a value along the second axis, a display device, a memory device for brief storage of information that stores a set of instructions, and a processor for execution of a set of instructions. Execution of instructions forces the processor to perform operations, including:
разделение данных на множество интервалов вдоль первой оси, при этом данные разделяют на основе физической характеристики устройства отображения, dividing the data into multiple intervals along the first axis, the data being divided based on the physical characteristics of the display device,
определение для одного из интервалов, необходимости использования альтернативного представления данных иdetermination for one of the intervals, the need to use an alternative representation of the data and
отображение с помощью устройства отображения графика выборки данных, при этом для указанного одного из интервалов используют альтернативное представление данных, если определено, что должно быть использовано альтернативное представление данных, и для указанного одного из интервалов используют линейное построение графика, если определено, что альтернативное представление данных не должно быть использовано.displaying with a display device a graph of a data sample, wherein for an indicated one of the intervals an alternative representation of the data is used if it is determined that an alternate representation of the data is to be used, and for the indicated one of the intervals a linear graph is used if it is determined that the alternate representation of the data should not be used.
[0004] Также предложен способ управления устройством отображения. Способ включает: [0004] A method for controlling a display device is also provided. The method includes:
прием данных, содержащих множество точек данных, каждая из которых имеет значение вдоль первой оси и значение вдоль второй оси; receiving data containing a plurality of data points, each of which has a value along the first axis and a value along the second axis;
определение необходимости отображения точек данных с использованием первого представления данных или второго представления данных, при этом определение основано на физической характеристике устройства отображения; и determining whether to display data points using a first data representation or a second data representation, the determination being based on the physical characteristic of the display device; and
отображение графика данных, при этом отображают гистограммное представление по меньшей мере некоторых точек данных, если определена необходимость использования первого представления данных, и отображают второй тип представления по меньшей мере некоторых точек данных, если определена необходимость использования второго представления данных.displaying a data graph, while displaying a histogram representation of at least some data points if the need to use the first data representation is determined, and displaying a second type of representation of at least some data points if the need to use the second data representation is determined.
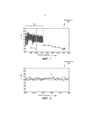
[0005] На Фигуре 1 показана выборка данных, графически построенная с использованием стандартной линейной интерполяции.[0005] Figure 1 shows a data sample graphically constructed using standard linear interpolation.
[0006] На Фигуре 2 показан увеличенный вид части выборки, представленной на Фигуре 1.[0006] Figure 2 shows an enlarged view of a portion of the sample shown in Figure 1.
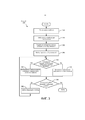
[0007] На Фигуре 3 показан пример способа, предложенного для отображения выборки данных по Фигуре 1, так, чтобы повысить удобочитаемость.[0007] Figure 3 shows an example of a method proposed for displaying a data sample of Figure 1, so as to increase readability.
[0008] На Фигуре 4 показано отображение выборки данных по Фигуре 1, сгенерированное согласно примеру способа, представленного на Фигуре 3.[0008] Figure 4 shows a display of a data sample of Figure 1 generated according to an example of the method shown in Figure 3.
[0009] На Фигуре 5 показано отображение выборки данных по Фигуре 1, сгенерированное согласно альтернативному варианту примера способа, представленного на Фигуре 3.[0009] Figure 5 shows a display of a sample of the data in Figure 1 generated according to an alternative embodiment of the example method shown in Figure 3.
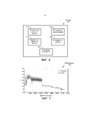
[0010] На Фигуре 6 показан пример вычислительной системы, реализующей пример способа, представленного на Фигуре 3.[0010] Figure 6 shows an example of a computing system that implements an example of the method presented in Figure 3.
[0011] На Фигуре 7 показано отображение выборки данных по Фигуре 1, сгенерированное согласно альтернативному варианту примера способа, представленного на Фигуре 3.[0011] Figure 7 shows a display of the data sample of Figure 1 generated according to an alternative embodiment of the example method shown in Figure 3.
[0012] Примеры осуществления станут понятнее из нижеследующего описания и соответствующих сопроводительных чертежей, на которых схожие элементы снабжены одинаковыми ссылочными позициями. В частности, примеры осуществления относятся к способам и системам для улучшения восприятия объема информации, передаваемой в графических отображениях посредством использования гистограмм. [0012] Examples of implementation will become clearer from the following description and the accompanying drawings in which similar elements are provided with the same reference position. In particular, exemplary embodiments relate to methods and systems for improving the perception of the amount of information transmitted in graphical displays through the use of histograms.
[0013] Сигнал может быть определен в виде функциональной зависимости величины x от времени t. Количество выборок в сигнале может быть обозначено как N. График, отображающий сигнал, обычно может отображать каждую выборку в хронологическом порядке, при этом моменты времени t выборки откладывают по оси x, а величины x выборки откладывают по оси y. Сигнал обычно может быть изображен так, что выборки соединены линией. Во многих областях применения, например при мониторинге частоты сердечных сокращений пациента, большое количество выборок (например, N>104) может быть показано на одном изображении. Например, изображение, показывающее данные за один день, отбор которых выполняли с частотой 1 Гц, содержит 8,64*104 выборок.[0013] The signal can be defined as the functional dependence of x on time t. The number of samples in the signal can be denoted by N. The graph representing the signal can usually display each sample in chronological order, while the instants of time t of the sample are plotted along the x axis, and the x values of the sample are plotted along the y axis. The signal can usually be depicted so that the samples are connected by a line. In many applications, for example when monitoring a patient’s heart rate, a large number of samples (for example, N> 104) can be shown in one image. For example, an image showing data for one day, the selection of which was performed with a frequency of 1 Hz, contains 8.64 * 104 samples.
[0014] Однако в изображении сигнала с большим количеством выборок каждый столбец пикселей на экране будет включать в себя большое количество выборок. Например, дисплей с высоким разрешением может иметь 1920 пикселей в ширину; следовательно, если на таком дисплее показаны данные за один день, отбор которых выполнялся с частотой 1 Гц, каждый столбец пикселей будет содержать 8,64*104/1920 = 45 выборок. Это приводит к загроможденному и неразборчивому изображению. На Фигуре 1 показано такое изображение 100, где частота 110 сердечных сокращений графически изображена как функция времени 120. На изображении 100 может оказаться сложным тщательно собрать полезные данные из первого участка 130 по причине большого количества точек данных. Эта сложность может еще более возрастать для дисплеев с низким разрешением, которые имеют меньше пикселей в ширину.[0014] However, in a signal image with a large number of samples, each column of pixels on the screen will include a large number of samples. For example, a high-resolution display may be 1920 pixels wide; therefore, if this display shows data for one day, the selection of which was carried out with a frequency of 1 Hz, each column of pixels will contain 8.64 * 104/1920 = 45 samples. This results in a cluttered and illegible image. Figure 1 shows such an
[0015] Один из широко распространенных технологических приемов, который может использоваться, чтобы лучше понять содержание графика сигнала, заключается в увеличении изображения на выбранном интервале времени, например интервале времени 140 на Фигуре 1. На Фигуре 2 показано изображение 200, где частота 210 сердечных сокращений графически изображена как функция времени 220, при этом интервал времени 220 соответствует интервалу времени 140 на Фигуре 1. Линейная интерполяция между различными выборками, показанными на изображении 200, становится более ясной, чем на первом участке 130 изображения 100. Это является причиной того, что интерполяция по нескольким столбцам пикселей приводит к более четкому изображению. Линейную интерполяцию вообще и линейную интерполяцию по нескольким столбцам пикселей, в общем, можно назвать "линейным построением графика". Следует отметить, что линейное построение графика может также охватывать другие типы визуализации. Однако специалистам в данной области техники понятно, что увеличенный вид изображения 200 не позволяет получить должного представления обо всем изображении 100, при этом в некоторых случаях (например, при большом количестве точек данных) невозможно выполнить интерполяцию по нескольким столбцам пикселей.[0015] One common technique that can be used to better understand the content of a signal graph is to enlarge the image over a selected time interval, such as the
[0016] Примеры осуществления предоставляют альтернативную технологию для отображения графиков сигналов высокой плотности, имеющих большое количество выборок в каждом столбце пикселей, посредством селективного использования гистограмм. Примеры осуществления будут описаны с конкретной привязкой к сигналу, показанному на Фигуре 1, однако специалистам в данной области техники понятно, что это всего лишь примеры. Следует отметить, что система, реализующая примеры осуществления, может осуществлять выбор между различными способами визуализации. Например, способ визуализации может выбираться на основе уровня полного сигнала в зависимости от уровня масштабирования. Если уровень уменьшается, что подразумевает большее количество пикселей, приходящихся на один столбец, представленная в качестве примера система может переключиться на гистограммное представление. Если уровень увеличивается, представленная в качестве примера система может переключиться на визуализацию путем интерполяции.[0016] The exemplary embodiments provide an alternative technology for displaying graphs of high density signals having a large number of samples in each column of pixels by selectively using histograms. Examples of implementation will be described with specific reference to the signal shown in Figure 1, however, specialists in the art will understand that these are just examples. It should be noted that a system that implements examples of implementation can make a choice between different visualization methods. For example, the rendering method may be selected based on the level of the full signal depending on the zoom level. If the level decreases, which implies a larger number of pixels per column, an exemplary system may switch to a histogram view. If the level increases, an example system may switch to visualization by interpolation.
[0017] На Фигуре 3 проиллюстрирован способ 300 согласно одному варианту осуществления. На этапе 310 осуществляют прием данных выборки. Эти данные могут приниматься от любого источника (например, непосредственно от оборудования для мониторинга пациентов, из архива данных и т.д.) и могут представлять собой данные в реальном масштабе времени (например, получаемые по мере проведения измерений) или полученные в любое другое время. На этапе 320 выполняют отбор, например отбор, показанный на Фигуре 1, для их отображения. Отбор может выполняться вручную (например, врач может выбирать целевой интервал времени для пациента) либо автоматически (например, дисплей у кровати пациента может автоматически выбирать непосредственно предшествующий 24-часовой интервал времени).[0017] Figure 3 illustrates a
[0018] На этапе 330 отобранные данные выборок, полученные на этапе 320, разделяются на столбцы пикселей. Как описано выше, разделение может зависеть от количества выборок, включенных в выборочную совокупность, и ширины используемого дисплея, выраженной в пикселях. Например, в продолжение рассмотрения примера отобранных с частотой 1 Гц данных за один день, показанных на дисплее, ширина которого составляет 1920 пикселей, каждый столбец пикселей будет содержать 8.64*104/1920 = 45 выборок. Следовательно, первый столбец пикселей будет содержать первые 45 выборок, второй столбец пикселей будет содержать следующие 45 выборок и т.д. Следует отметить, что это всего лишь пример, при этом выборки сигналов также могут формироваться нерегулярным способом, а это означает, что на один столбец пикселей может приходиться разное количества выборок. Нерегулярное формирование выборок может быть следствием различных фактор, например потерей данных, нерегулярной схемой формирования выборок и т.д. Столбцы пикселей могут рассматриваться в виде временных интервалов, каждый из которых содержит множество выборок.[0018] In
[0019] На этапах 340-390 каждый столбец пикселей оценивают, чтобы определить, должно ли ее изображение быть изменено для повышения удобочитаемости. На этапе 340 выбирают первый столбец пикселей. Обычно это может начинаться с левой стороны изображения, которая может соответствовать хронологически наиболее ранним выборкам, но может также использоваться любая другая начальная точка.[0019] In steps 340-390, each column of pixels is evaluated to determine if its image should be resized to improve readability. At 340, a first column of pixels is selected. Usually this can begin on the left side of the image, which can correspond chronologically to the earliest samples, but any other starting point can also be used.
[0020] На этапе 350 выбранный столбец пикселей оценивают, чтобы определить, должно ли ее изображение быть изменено. В первом варианте осуществления это определение может осуществляться исключительно на основе количества выборок, содержащихся в столбце пикселей. Если количество выборок, содержащихся в столбце, превышает некоторое пороговое значение, изображение столбца пикселей изменяется. Пороговое значение, например, может быть равно двум. Это пороговое значение может использоваться потому, что если в столбце пикселей имеются две выборки, линия, проведенная между первой и второй, покажет обе выборки в пределах столбца пикселей, но если существуют три или более выборок в столбце пикселей, каждая последующая выборка после второй не будет конкретно показана на линии, проведенной между наибольшим и наименьшим значениями выборок. Однако для отборов выборок с равномерным распределением, при которых каждый столбец пикселей включает в себя одинаковое количество выборок, определение, основанное исключительно на количестве выборок в столбце пикселей, приведет к тому, что либо все изображение будет изменено для улучшения удобочитаемости, либо изменено не будет.[0020] In
[0021] Во втором варианте осуществления определение, следует ли изменить изображение, основано как на количестве выборок в столбце пикселей, так и на диапазоне значений, входящих в столбец пикселей. В таком варианте осуществления изображение выбранного столбца пикселей изменяют, если количество выборок в столбце пикселей превышает пороговое число, как описано выше, и если диапазон значений превышает пороговый диапазон. Диапазон может определяться как абсолютное значение разности между максимальным значением, содержащимся в столбце пикселей, и минимальным значением, содержащимся в столбце пикселей. Пороговый диапазон, с которым сравнивают диапазон выбранного столбца пикселей, может быть статическим (например, для монитора частоты сердечных сокращений пороговый диапазон может всегда составлять 40 ударов в минуту) или определяться динамически (например, пороговый диапазон может составлять 20% от полного диапазона, представленного вертикальной осью).[0021] In the second embodiment, the determination of whether to change the image is based on both the number of samples in the pixel column and the range of values included in the pixel column. In such an embodiment, the image of the selected pixel column is changed if the number of samples in the pixel column exceeds the threshold number, as described above, and if the range of values exceeds the threshold range. The range can be defined as the absolute value of the difference between the maximum value contained in the pixel column and the minimum value contained in the pixel column. The threshold range against which the range of the selected column of pixels is compared can be static (for example, for a heart rate monitor, the threshold range can always be 40 beats per minute) or determined dynamically (for example, the threshold range can be 20% of the full range represented by the vertical axis).
[0022] Если на этапе 350 определяют, что изображение выбранного столбца пикселей не должно изменяться, тогда на этапе 360 выбранный столбец пикселей отображают с помощью традиционного линейного построения графика. Однако если на этапе 350 определяют, что изображение выбранного столбца пикселей должно быть изменено, тогда на этапе 370 выбранный столбец пикселей отображают с использованием альтернативной технологии, чтобы повысить удобочитаемость. Чтобы достичь этого повышения может использоваться ряд технологий.[0022] If it is determined in
[0023] В одном варианте осуществления вместо традиционного линейного построения графика может использоваться линейная гистограмма. В таком варианте осуществления генерируется гистограмма всех значений в столбце пикселей и строится вдоль столбца пикселей. На Фигуре 4 показано изображение 400, представляющее тот же набор данных, который показан на Фигуре 1, построенное с помощью линейной гистограммы для выбранных данных. На основе размера диапазонов между минимальными и максимальными значениями для каждого столбца пикселей линейные гистограммы используются для выборок вплоть до приблизительно t=33000 секунд, после чего используют линейное построение графика. В области 410 изображения 400 черная линия 420 соединяет среднее значение каждого столбца пикселей, для которого используются линейные гистограммы. Серые точки 430, сгруппированные вокруг черной линии 420, представляют различные выборки, при этом степень темноты серого цвета соответствует частоте значения в пределах выборки. Область 440 включает в себя выборки, соединенные путем линейной интерполяции, как описано выше. Специалистам в данной области техники понятно, что изображение 400, в частности содержимое области 410, предоставляет больше информации, чем изображение 100, а также, в частности, указывает, что большинство значений сосредоточено вокруг линии 420, обозначающей среднее значение, в отличие от того, что позволяет предположить изображение 100.[0023] In one embodiment, a linear histogram may be used instead of the traditional linear plotting. In such an embodiment, a histogram of all values in the pixel column is generated and plotted along the pixel column. Figure 4 shows an image 400 representing the same data set as shown in Figure 1, constructed using a linear histogram for the selected data. Based on the size of the ranges between the minimum and maximum values for each column of pixels, linear histograms are used for samples up to approximately t = 33000 seconds, after which linear plotting is used. In the
[0024] В другом варианте осуществления альтернативное изображение может принимать форму селективного изображения среднего значения и квантилей. На Фигуре 5 показано такое изображение 500. В области 510 изображение 500 содержит первую линию 520, обозначающую среднее значение выборки, вторую линию 530, обозначающую 0,25-квантиль выборки, третью линию 540, обозначающую 0,75-квантиль выборки, кластер точек 550, обозначающих минимальные значения, а также кластер точек 560, обозначающих максимальные значения. В области 570 главным образом используется линейная интерполяция, хотя порою показаны минимальные и максимальные значения. Изображение 500 может предоставить наблюдателю дополнительные детали в отношении выборки. Следует отметить, что два вышеприведенных примера альтернативных изображений носят лишь иллюстративный характер, при этом могут существовать другие альтернативные способы отображения данных.[0024] In another embodiment, the alternative image may take the form of a selective image of mean and quantiles. Figure 5 shows such an image 500. In
[0025] На этапе 380 определяют, имеются ли еще столбцы пикселей, которые требуется оценить. Если требуется оценить дополнительные столбцы пикселей, на этапе 390 выбирают следующий столбец пикселей. После этапа 390 способ 300 возвращают к этапу 350, и оценку столбцов пикселей продолжают. Если более нет столбцов пикселей, требующих оценки, построение графика завершают, и выполнение способа 300 оканчивают.[0025] At
[0026] На Фигуре 6 показана представленная в качестве примера система 600, которая может реализовать вышеописанные примеры осуществления с привязкой к способу 300. Система 600 включает в себя элемент 610 для хранения данных (например, один или более жестких дисков, твердотельных дисков или других компонентов для долгосрочного хранения данных). Элемент 610 для хранения данных может хранить код для реализации способа 300. Система 600 также включает в себя элемент 620 для обработки данных, который может включать в себя один или более микропроцессоров, способных исполнить код, например код для реализации способа 300. Система 600 также включает в себя пользовательский интерфейс 630, который может содержать один или более физических компонентов (например, клавиатуру, манипулятор типа «мышь», сенсорную панель, дисплей, сенсорный экран и т.д.), выполненных с возможностью приема данных, вводимых пользователем, и предоставления пользователю результатов (например, изображения 400). Система 600 также включает в себя интерфейс 640 данных (например, проводное или беспроводное соединение с некоторой сетью и/или с Интернетом), обеспечивающий возможность связи (например, прием данных выборки на этапе 310) с внешними источниками данных. Система 600 также включает в себя устройство 650 отображения (например, ЖК-дисплей и СИД-дисплей, ЛТР-дисплей и т.д.) Следует отметить, что в некоторых вариантах реализации устройство 650 отображения и пользовательский интерфейс 630 могут представлять собой одно объединенное устройство (например, сенсорный экран, который одновременно отображает информацию и принимает входные данные от пользователя). Следует также отметить, что устройство 650 отображения может представлять собой компонент, не входящий в состав системы 600. Иначе говоря, система 600 может обрабатывать данные, как описано в отношении способа 300, для отображения на отдельном устройстве 650 отображения. Специалистам в данной области техники понятно, что может существовать любое количество возможных вариантов реализации системы 600, при этом такие варианты реализации могут включать в себя дополнительные элементы, которые конкретно не описаны выше, при этом система 600 может быть способна выполнять дополнительные задания, помимо тех что описаны выше со ссылкой на примеры осуществления.[0026] Figure 6 shows an exemplary system 600 that can implement the above-described embodiments with reference to
[0027] В одном альтернативном варианте осуществления вместо использования столбцов пикселей в качестве основы оценки может использоваться иная ширина. Ширина может определяться на основе большего количества пикселей или участка шкалы, представленной горизонтальной осью. Иная ширина может выбираться на основе обычного расстояния наблюдения от пользователя до экрана; например, если обычное расстояние наблюдения от экрана увеличивается, может потребоваться использовать увеличенную ширину в качестве основы оценка. По альтернативному варианту, если используются более крупные маркеры выборки (например, "x" или "o"), может потребоваться использовать увеличенную ширину. На Фигуре 7 показано изображение 700, где сгенерированы гистограммы на основе увеличенных временных окон. Очевидно, что использование увеличенных временных окон приводит к сглаживанию гистограммы.[0027] In one alternative embodiment, a different width may be used instead of using columns of pixels as the basis of the estimate. The width can be determined based on a larger number of pixels or a portion of the scale represented by a horizontal axis. Other widths may be selected based on the normal viewing distance from the user to the screen; for example, if the normal viewing distance from the screen increases, you may need to use the increased width as the basis of the estimate. Alternatively, if larger sample markers are used (for example, “x” or “o”), it may be necessary to use an increased width. Figure 7 shows an image 700 where histograms are generated based on enlarged time windows. Obviously, the use of enlarged time windows leads to a smoothing of the histogram.
[0028] В другом альтернативном варианте осуществления вместо использования гистограммы для областей графика, в которых требуется альтернативное изображение, может использоваться более совершенный способ оценки распределения. Это может быть, например, ядерная оценка плотности или параметрическая оценка функции распределения. В качестве альтернативы для непериодических сигналов (например, сигналов электрокардиограммы или фотоплетизмографических сигналов) плотные области выборки могут обобщаться с использованием графика среднего сигнала за один период, который может также содержать обозначение изменения сигнала. Для построения такого 2-D итогового графика может потребоваться больший интервал времени наличия данных высокой плотности (например, данных, для которых требуется альтернативное изображение).[0028] In another alternative embodiment, instead of using a histogram for areas of the graph in which an alternative image is required, a more advanced distribution estimation method may be used. This may be, for example, a nuclear density estimate or a parametric distribution function estimate. Alternatively, for non-periodic signals (for example, electrocardiogram signals or photoplethysmographic signals), dense sample areas can be generalized using a graph of the average signal over a single period, which may also contain a signal change designation. To construct such a 2-D summary graph, a longer time interval for the presence of high density data (for example, data for which an alternative image is required) may be required.
[0029] В еще одном варианте осуществления альтернативное изображение может использоваться для изображения 2-D диаграмм рассеяния. В данном примере каждый пиксель может представлять собой гистограмму или единственный пиксель. Для обозначения гистограммы может использоваться другой цвет, чтобы различить эти два представления. Например, если пиксель представляет гистограмму точек данных, этот пиксель может изображаться в синем цвете, а если пиксель представляет единственную точку данных на диаграмме рассеяния, пиксель может изображаться красным.[0029] In yet another embodiment, an alternate image can be used to image 2-D scatterplots. In this example, each pixel may be a histogram or a single pixel. A different color can be used to indicate the histogram to distinguish between the two views. For example, if a pixel represents a histogram of data points, that pixel may be displayed in blue, and if a pixel represents a single data point in a scatter plot, the pixel may be displayed in red.
[0030] Примеры осуществления, описанные выше, имеют конкретную привязку к отображению временных рядов, при этом график содержит значения выборки, отложенные вдоль y-оси, в моменты времени, отложенные вдоль x-оси. Однако специалистам в данной области техники понятно, что временные ряды представляют собой лишь один тип данных, а также что примеры осуществления равным образом применимы к отображению выборки данных любого типа в формате (x, y).[0030] The embodiments described above are specifically associated with the display of time series, wherein the graph contains sample values plotted along the y-axis at time points plotted along the x-axis. However, it will be understood by those skilled in the art that time series are only one type of data, and also that the implementation examples are equally applicable to displaying a sample of data of any type in the format (x, y).
[0031] Поскольку график с использованием стандартной линейной интерполяции становится трудночитаемым для таких выборок с плотной упаковкой, как описано выше со ссылкой на Фигуру 1, селективное использование гистограммы, как показано на Фигуре 4, позволяет наблюдателю получить больше информации, чем при таком стандартном графике. Кроме того, селективное использование гистограммы дает преимущество над графиком, который использует исключительно гистограмму для всех данных, поскольку для «неплотных» выборок данных линейная интерполяция визуально помогает наблюдателю правильно интерпретировать сигнал.[0031] Because a graph using standard linear interpolation becomes difficult to read for such dense-packed samples as described above with reference to Figure 1, the selective use of a histogram as shown in Figure 4 allows the observer to obtain more information than with such a standard graph. In addition, the selective use of a histogram gives an advantage over a graph that uses only a histogram for all data, since for “loose” data samples, linear interpolation visually helps the observer correctly interpret the signal.
[0032] Специалисты в данной области техники поймут, что вышеописанные примеры осуществления могут быть реализованы с помощью любых средств, в том числе модуля программного обеспечения, сочетания аппаратного обеспечения и программного обеспечения и т.д. Пример способа 300, например, может быть реализован в программе, хранящейся на некратковременном носителе и содержащей строки кода, которые, будучи скомпилированными, могут исполняться процессором.[0032] Those skilled in the art will understand that the above described embodiments may be implemented using any means, including a software module, a combination of hardware and software, etc. An example of a
[0033] Специалистам в данной области техники понятно, что в примеры осуществления могут быть внесены различные изменения без отступления от существа и объема изобретения. Таким образом, предполагается, что настоящее изобретение охватывает модификации и изменения данного изобретения, если они подпадают под объем притязаний прилагаемой формулы изобретения и ее эквивалентов.[0033] Those skilled in the art will appreciate that various changes may be made to the embodiments without departing from the spirit and scope of the invention. Thus, it is intended that the present invention covers the modifications and variations of this invention if they come within the scope of the appended claims and their equivalents.
Claims (37)
Applications Claiming Priority (3)
| Application Number | Priority Date | Filing Date | Title |
|---|---|---|---|
| US201562120398P | 2015-02-25 | 2015-02-25 | |
| US62/120,398 | 2015-02-25 | ||
| PCT/IB2016/050892 WO2016135597A1 (en) | 2015-02-25 | 2016-02-19 | Apparatus, method and system for resolution dependent graphical representation of signals |
Publications (3)
| Publication Number | Publication Date |
|---|---|
| RU2017133139A RU2017133139A (en) | 2019-03-25 |
| RU2017133139A3 RU2017133139A3 (en) | 2019-09-09 |
| RU2715548C2 true RU2715548C2 (en) | 2020-02-28 |
Family
ID=55640785
Family Applications (1)
| Application Number | Title | Priority Date | Filing Date |
|---|---|---|---|
| RU2017133139A RU2715548C2 (en) | 2015-02-25 | 2016-02-19 | Device, method and system for graphical representation of signals depending on resolution |
Country Status (7)
| Country | Link |
|---|---|
| US (1) | US10580175B2 (en) |
| EP (1) | EP3261522A1 (en) |
| JP (1) | JP6670320B2 (en) |
| CN (1) | CN107257976B (en) |
| BR (1) | BR112017017972A2 (en) |
| RU (1) | RU2715548C2 (en) |
| WO (1) | WO2016135597A1 (en) |
Families Citing this family (2)
| Publication number | Priority date | Publication date | Assignee | Title |
|---|---|---|---|---|
| GB2549073B (en) * | 2016-03-24 | 2020-02-26 | Imagination Tech Ltd | Generating sparse sample histograms |
| US20190051025A1 (en) * | 2017-08-08 | 2019-02-14 | Thermo Finnigan Llc | Data reduction and display without quality loss |
Citations (6)
| Publication number | Priority date | Publication date | Assignee | Title |
|---|---|---|---|---|
| US20020070937A1 (en) * | 1998-06-02 | 2002-06-13 | Bertram Randal Lee | Method and system for graphically displaying trend and range data for a variety of systems |
| US20110109632A1 (en) * | 2009-11-10 | 2011-05-12 | Alexandre Gorev | Rule based visualization mechanism |
| US20120157806A1 (en) * | 2010-12-20 | 2012-06-21 | Roche Diagnostics Operations, Inc. | Representation of large, variable size data sets on small displays |
| US20130019196A1 (en) * | 2011-07-14 | 2013-01-17 | Apple Inc. | Representing Ranges of Image Data at Multiple Resolutions |
| RU2476932C1 (en) * | 2012-03-30 | 2013-02-27 | Федеральное государственное бюджетное учреждение науки Вычислительный центр им. А.А. Дородницына Российской академии наук | Automated system of biomedical microimage analysis for detection and characterisation of fixed class informative objects against inhomogeneous background |
| WO2014203088A1 (en) * | 2013-06-21 | 2014-12-24 | Yokogawa Electric Corporation | A device for displaying a trend related to a process variable |
Family Cites Families (24)
| Publication number | Priority date | Publication date | Assignee | Title |
|---|---|---|---|---|
| JPH04352939A (en) * | 1991-05-30 | 1992-12-08 | Sharp Corp | Portable electrocardiograph |
| US5608861A (en) * | 1994-02-14 | 1997-03-04 | Carecentric Solutions, Inc. | Systems and methods for dynamically modifying the visualization of received data |
| DE19524092C2 (en) | 1995-07-01 | 1997-08-07 | Hewlett Packard Gmbh | Method and device for compressing and displaying digital data, in particular the heart rate of cardiotocographs |
| JP3767718B2 (en) * | 1997-10-06 | 2006-04-19 | 横河電機株式会社 | Trend graph display device |
| JP2000074746A (en) * | 1998-09-02 | 2000-03-14 | Nishitomo:Kk | Clinical thermometer |
| JP2001118014A (en) * | 1999-10-18 | 2001-04-27 | Hitachi Ltd | Diagnosis and treatment assistant system |
| JP2003149007A (en) * | 2001-11-12 | 2003-05-21 | Omron Corp | Biometric apparatus |
| US20060142948A1 (en) * | 2004-12-23 | 2006-06-29 | Minor James M | Multiple-channel bias removal methods with little dependence on population size |
| WO2007046272A1 (en) * | 2005-10-19 | 2007-04-26 | Hitachi Medical Corporation | Ultrasonograph for creating elastic image |
| US7756676B1 (en) * | 2005-11-14 | 2010-07-13 | Hewlett-Packard Development Company, L.P. | Detecting data change based on adjusted data values |
| US20080036767A1 (en) | 2006-08-10 | 2008-02-14 | Business Objects, S.A. | Apparatus and method for selecting visualizations of multidimensional data |
| US20100016215A1 (en) | 2007-06-29 | 2010-01-21 | Avi Biopharma, Inc. | Compound and method for treating myotonic dystrophy |
| US8677235B2 (en) | 2008-05-13 | 2014-03-18 | Microsoft Corporation | Ranking visualization types based upon fitness for visualizing a data set |
| US8866816B2 (en) * | 2008-06-20 | 2014-10-21 | New Bis Safe Luxco S.A R.L | Dimension reducing visual representation method |
| US8284200B2 (en) * | 2009-01-29 | 2012-10-09 | Agilent Technologies, Inc. | Systems and methods for focus plus context viewing of dense, ordered line graphs |
| US9606520B2 (en) * | 2009-06-22 | 2017-03-28 | Johnson Controls Technology Company | Automated fault detection and diagnostics in a building management system |
| WO2012140264A2 (en) | 2011-04-15 | 2012-10-18 | Fluofarma | System and method to visualize and analyze data from image-based cellular assays or high content screening |
| US9299173B2 (en) * | 2011-06-07 | 2016-03-29 | International Business Machines Corporation | Automatic selection of different visualizations for the organization of multivariate data |
| JP2013045862A (en) * | 2011-08-24 | 2013-03-04 | Hitachi Kokusai Electric Inc | Substrate processing system |
| US8688388B2 (en) * | 2011-10-11 | 2014-04-01 | Sequenom, Inc. | Methods and processes for non-invasive assessment of genetic variations |
| US20130142381A1 (en) * | 2011-12-02 | 2013-06-06 | Field Tested Software Llc | Real time spectroscopy processing and analysis system |
| US9449408B2 (en) * | 2013-07-25 | 2016-09-20 | Sas Institute Inc. | Visualizing high-cardinality data |
| US9996444B2 (en) * | 2014-06-25 | 2018-06-12 | Vmware, Inc. | Automated methods and systems for calculating hard thresholds |
| US10102652B2 (en) * | 2014-09-25 | 2018-10-16 | Business Objects Software Ltd. | Binning to prevent overplotting for data visualization |
-
2016
- 2016-02-19 RU RU2017133139A patent/RU2715548C2/en not_active IP Right Cessation
- 2016-02-19 EP EP16712501.2A patent/EP3261522A1/en not_active Withdrawn
- 2016-02-19 US US15/550,414 patent/US10580175B2/en not_active Expired - Fee Related
- 2016-02-19 WO PCT/IB2016/050892 patent/WO2016135597A1/en active Application Filing
- 2016-02-19 JP JP2017542463A patent/JP6670320B2/en not_active Expired - Fee Related
- 2016-02-19 BR BR112017017972A patent/BR112017017972A2/en not_active Application Discontinuation
- 2016-02-19 CN CN201680011604.3A patent/CN107257976B/en not_active Expired - Fee Related
Patent Citations (6)
| Publication number | Priority date | Publication date | Assignee | Title |
|---|---|---|---|---|
| US20020070937A1 (en) * | 1998-06-02 | 2002-06-13 | Bertram Randal Lee | Method and system for graphically displaying trend and range data for a variety of systems |
| US20110109632A1 (en) * | 2009-11-10 | 2011-05-12 | Alexandre Gorev | Rule based visualization mechanism |
| US20120157806A1 (en) * | 2010-12-20 | 2012-06-21 | Roche Diagnostics Operations, Inc. | Representation of large, variable size data sets on small displays |
| US20130019196A1 (en) * | 2011-07-14 | 2013-01-17 | Apple Inc. | Representing Ranges of Image Data at Multiple Resolutions |
| RU2476932C1 (en) * | 2012-03-30 | 2013-02-27 | Федеральное государственное бюджетное учреждение науки Вычислительный центр им. А.А. Дородницына Российской академии наук | Automated system of biomedical microimage analysis for detection and characterisation of fixed class informative objects against inhomogeneous background |
| WO2014203088A1 (en) * | 2013-06-21 | 2014-12-24 | Yokogawa Electric Corporation | A device for displaying a trend related to a process variable |
Also Published As
| Publication number | Publication date |
|---|---|
| CN107257976A (en) | 2017-10-17 |
| RU2017133139A3 (en) | 2019-09-09 |
| RU2017133139A (en) | 2019-03-25 |
| BR112017017972A2 (en) | 2018-04-10 |
| EP3261522A1 (en) | 2018-01-03 |
| JP2018506355A (en) | 2018-03-08 |
| WO2016135597A1 (en) | 2016-09-01 |
| US10580175B2 (en) | 2020-03-03 |
| CN107257976B (en) | 2021-06-15 |
| US20180033169A1 (en) | 2018-02-01 |
| JP6670320B2 (en) | 2020-03-18 |
Similar Documents
| Publication | Publication Date | Title |
|---|---|---|
| US8730234B2 (en) | Image display apparatus and image display method | |
| US9686159B2 (en) | Visual representations of status | |
| US20140320539A1 (en) | Semantic zoom-in or drill-down in a visualization having cells with scale enlargement and cell position adjustment | |
| US8736613B2 (en) | Simplified graphical analysis of multiple data series | |
| RU2715548C2 (en) | Device, method and system for graphical representation of signals depending on resolution | |
| US10936472B2 (en) | Screen recording preparation method for evaluating software usability | |
| CN110619672B (en) | Figure edge line selecting method, machine readable storage medium and data processing equipment | |
| US9171387B2 (en) | Data visualization system | |
| CN105653151B (en) | Digital pathological section Zoom method and device | |
| CN113662555A (en) | Drawing method, analysis method, drawing device, mobile terminal and storage medium | |
| JP2020126580A (en) | Medical information processor and medical information display system | |
| EP4068305A1 (en) | Method for displaying on a screen of a computerized apparatus a temporal trend of a state of health of a patient and computerized apparatus | |
| US11733843B2 (en) | Information processing apparatus, information processing method, and storage medium | |
| EP2808809A2 (en) | Method and apparatus for interactive review of a dataset | |
| CN117971092A (en) | Highlighting method, device, equipment and medium for image selected area | |
| US9474462B2 (en) | Systems and methods for dynamic adjustable spatial granularity for EEG display | |
| US20160093073A1 (en) | Binning to prevent overplotting for data visualization | |
| Ebelin et al. | Estimates of Temporal Edge Detection Filters in Human Vision | |
| Schulz et al. | Visual data cleansing of eye tracking data | |
| Zhu et al. | Edge-preserving regularized filter with visual perception outlier measurement | |
| EP2838033A1 (en) | Method and apparatus for interactive review of a dataset | |
| CN114724520A (en) | Self-adaptive brightness adjustment method for gray-scale medical image | |
| EP2808872A1 (en) | Method and apparatus for interactive review of multiple datasets | |
| EP2840573A1 (en) | Method and apparatus for interactive review of multiple Datasets | |
| WO2012003366A1 (en) | Systems and methods for dynamic adiustable spatial granularity for eeg display |
Legal Events
| Date | Code | Title | Description |
|---|---|---|---|
| MM4A | The patent is invalid due to non-payment of fees |
Effective date: 20210220 |