RU2590265C2 - Systems and methods for assessment of moments of penetration of fluid in locations of production wells - Google Patents
Systems and methods for assessment of moments of penetration of fluid in locations of production wells Download PDFInfo
- Publication number
- RU2590265C2 RU2590265C2 RU2014130786/03A RU2014130786A RU2590265C2 RU 2590265 C2 RU2590265 C2 RU 2590265C2 RU 2014130786/03 A RU2014130786/03 A RU 2014130786/03A RU 2014130786 A RU2014130786 A RU 2014130786A RU 2590265 C2 RU2590265 C2 RU 2590265C2
- Authority
- RU
- Russia
- Prior art keywords
- streamline
- shortest
- fastest
- fluid
- network
- Prior art date
Links
- 239000012530 fluid Substances 0.000 title claims abstract description 76
- 238000004519 manufacturing process Methods 0.000 title claims abstract description 50
- 238000000034 method Methods 0.000 title claims abstract description 42
- 230000035515 penetration Effects 0.000 title abstract 4
- 238000004088 simulation Methods 0.000 claims abstract description 24
- 238000009826 distribution Methods 0.000 claims abstract description 20
- 230000009545 invasion Effects 0.000 claims abstract description 13
- 238000002347 injection Methods 0.000 claims description 26
- 239000007924 injection Substances 0.000 claims description 26
- 238000003860 storage Methods 0.000 claims description 16
- 230000035699 permeability Effects 0.000 claims description 8
- 238000004364 calculation method Methods 0.000 abstract description 6
- 230000000694 effects Effects 0.000 abstract description 4
- 238000011156 evaluation Methods 0.000 abstract description 2
- 238000005065 mining Methods 0.000 abstract 1
- 239000000126 substance Substances 0.000 abstract 1
- XLYOFNOQVPJJNP-UHFFFAOYSA-N water Substances O XLYOFNOQVPJJNP-UHFFFAOYSA-N 0.000 description 15
- 238000004422 calculation algorithm Methods 0.000 description 8
- 239000004576 sand Substances 0.000 description 8
- 238000012545 processing Methods 0.000 description 6
- 230000004044 response Effects 0.000 description 6
- 208000035126 Facies Diseases 0.000 description 5
- 230000006978 adaptation Effects 0.000 description 3
- 238000005516 engineering process Methods 0.000 description 3
- 230000003287 optical effect Effects 0.000 description 3
- 230000008901 benefit Effects 0.000 description 2
- 230000005540 biological transmission Effects 0.000 description 2
- 230000015572 biosynthetic process Effects 0.000 description 2
- 238000010586 diagram Methods 0.000 description 2
- 238000005755 formation reaction Methods 0.000 description 2
- 230000002452 interceptive effect Effects 0.000 description 2
- 230000002093 peripheral effect Effects 0.000 description 2
- 239000007787 solid Substances 0.000 description 2
- 230000003068 static effect Effects 0.000 description 2
- 241000184339 Nemophila maculata Species 0.000 description 1
- 239000008186 active pharmaceutical agent Substances 0.000 description 1
- 238000013459 approach Methods 0.000 description 1
- 239000004927 clay Substances 0.000 description 1
- 238000004891 communication Methods 0.000 description 1
- 238000011161 development Methods 0.000 description 1
- 230000018109 developmental process Effects 0.000 description 1
- 238000006073 displacement reaction Methods 0.000 description 1
- 230000009977 dual effect Effects 0.000 description 1
- 230000006870 function Effects 0.000 description 1
- 230000010354 integration Effects 0.000 description 1
- 230000033001 locomotion Effects 0.000 description 1
- 230000005055 memory storage Effects 0.000 description 1
- 239000002184 metal Substances 0.000 description 1
- 238000012986 modification Methods 0.000 description 1
- 230000004048 modification Effects 0.000 description 1
- 238000010606 normalization Methods 0.000 description 1
- 239000013307 optical fiber Substances 0.000 description 1
- 238000007639 printing Methods 0.000 description 1
- 238000011084 recovery Methods 0.000 description 1
- 238000005070 sampling Methods 0.000 description 1
- 238000010845 search algorithm Methods 0.000 description 1
- 239000004065 semiconductor Substances 0.000 description 1
- 230000035945 sensitivity Effects 0.000 description 1
- 239000000243 solution Substances 0.000 description 1
- 230000009897 systematic effect Effects 0.000 description 1
- 238000012546 transfer Methods 0.000 description 1
- 230000009466 transformation Effects 0.000 description 1
- 238000009827 uniform distribution Methods 0.000 description 1
- 239000013598 vector Substances 0.000 description 1
Images
Classifications
-
- E—FIXED CONSTRUCTIONS
- E21—EARTH DRILLING; MINING
- E21B—EARTH DRILLING, e.g. DEEP DRILLING; OBTAINING OIL, GAS, WATER, SOLUBLE OR MELTABLE MATERIALS OR A SLURRY OF MINERALS FROM WELLS
- E21B47/00—Survey of boreholes or wells
- E21B47/10—Locating fluid leaks, intrusions or movements
-
- E—FIXED CONSTRUCTIONS
- E21—EARTH DRILLING; MINING
- E21B—EARTH DRILLING, e.g. DEEP DRILLING; OBTAINING OIL, GAS, WATER, SOLUBLE OR MELTABLE MATERIALS OR A SLURRY OF MINERALS FROM WELLS
- E21B43/00—Methods or apparatus for obtaining oil, gas, water, soluble or meltable materials or a slurry of minerals from wells
- E21B43/16—Enhanced recovery methods for obtaining hydrocarbons
- E21B43/20—Displacing by water
-
- E—FIXED CONSTRUCTIONS
- E21—EARTH DRILLING; MINING
- E21B—EARTH DRILLING, e.g. DEEP DRILLING; OBTAINING OIL, GAS, WATER, SOLUBLE OR MELTABLE MATERIALS OR A SLURRY OF MINERALS FROM WELLS
- E21B49/00—Testing the nature of borehole walls; Formation testing; Methods or apparatus for obtaining samples of soil or well fluids, specially adapted to earth drilling or wells
-
- Y—GENERAL TAGGING OF NEW TECHNOLOGICAL DEVELOPMENTS; GENERAL TAGGING OF CROSS-SECTIONAL TECHNOLOGIES SPANNING OVER SEVERAL SECTIONS OF THE IPC; TECHNICAL SUBJECTS COVERED BY FORMER USPC CROSS-REFERENCE ART COLLECTIONS [XRACs] AND DIGESTS
- Y02—TECHNOLOGIES OR APPLICATIONS FOR MITIGATION OR ADAPTATION AGAINST CLIMATE CHANGE
- Y02A—TECHNOLOGIES FOR ADAPTATION TO CLIMATE CHANGE
- Y02A10/00—TECHNOLOGIES FOR ADAPTATION TO CLIMATE CHANGE at coastal zones; at river basins
- Y02A10/40—Controlling or monitoring, e.g. of flood or hurricane; Forecasting, e.g. risk assessment or mapping
Abstract
Description
ПЕРЕКРЕСТНАЯ ССЫЛКА НА РОДСТВЕННЫЕ ЗАЯВКИCROSS REFERENCE TO RELATED APPLICATIONS
Нет.No.
ЗАЯВЛЕНИЕ ОТНОСИТЕЛЬНО ИССЛЕДОВАНИЯ, ФИНАНСИРУЕМОГО ИЗ ФЕДЕРАЛЬНОГО БЮДЖЕТАSTATEMENT REGARDING THE STUDY FINANCED FROM THE FEDERAL BUDGET
Неприменимо.Not applicable.
ОБЛАСТЬ ТЕХНИКИ, К КОТОРОЙ ОТНОСИТСЯ ИЗОБРЕТЕНИЕFIELD OF THE INVENTION
Настоящее изобретение в целом относится к оценке моментов прорыва флюида в местонахождении добывающей скважины. Более конкретно, данное изобретение относится к оценке моментов прорыва флюида в местонахождении добывающей скважины на основании моделирования распространения флюида.The present invention generally relates to estimating fluid breakthroughs at a production well location. More specifically, the present invention relates to estimating fluid breakthroughs at a production well location based on fluid distribution modeling.
УРОВЕНЬ ТЕХНИКИ ИЗОБРЕТЕНИЯBACKGROUND OF THE INVENTION
Разные системы и способы известны для оценки момента прорыва флюида в местонахождении добывающей скважины, включая в себя адаптацию модели (HM). Адаптация Модели (HM) является систематической процедурой изменения имитационной модели пласта для воспроизведения динамического отклика месторождения. В приложениях HM и адаптации модели месторождения к данным по добыче основными задачами являются: a) интеграция данных по добыче в модели месторождения; b) гибкость, рентабельность и вычислительная эффективность и c) полная загрузка динамических данных.Various systems and methods are known for estimating the moment of fluid breakthrough at the location of a producing well, including model adaptation (HM). Model Adaptation (HM) is a systematic procedure for changing the reservoir simulation model to reproduce the dynamic response of the field. In HM applications and adapting a field model to production data, the main tasks are: a) integration of production data in the field model; b) flexibility, cost-effectiveness and computational efficiency; and c) full load of dynamic data.
В последние десятилетие технология HM имела резкое развитие и получила значительное признание и расширение от традиционного (то есть ручного, детерминированного) подхода, главным образом основанного на стратиграфических способах, к новым разработкам, подобным вероятностному моделированию, HM на основе метода трубок тока, основанным на чувствительности/градиенте и экспериментальной модели.In the last decade, HM technology has been rapidly developed and has received significant recognition and expansion from the traditional (i.e., manual, deterministic) approach, mainly based on stratigraphic methods, to new developments like probabilistic modeling, HM based on the sensitivity tube method based on current / gradient and experimental model.
Схема работы HM в значительной мере рассматривает минимизацию несовпадения между измеренным и смоделированным динамическим откликом флюида (например, нефти или воды) в отдельной добывающей скважине как одну из инверсионных основных целей. В исследованиях по увеличению нефтеотдачи пласта (EOR) посредством закачки воды, к примеру, несоответствие отклика представляет собой дифференциальные или интегральные кривые обводненности с двумя основными характеристиками: 1) момент прорыва флюида и 2) направленность и форма отклика. В то время как обе характеристики представляют собой важные переменные в процессе минимизации несоответствия, момент прорыва флюида является тем, что раскрывает наибольшее влияние на экономику производительности. Более того, интервал (то есть временные рамки) прорыва флюида всегда обременены неуверенностью, что делает усилия по оценке с наиболее возможной достоверностью еще более значимыми. Фактически, целесообразно в HM динамических данных скважины рассматривать момент прорыва как эффект первого порядка, колебания в кривой направленность/форма как эффект второго порядка, поскольку они в основном отражаются на условиях эксплуатации.The HM workflow largely considers minimizing the mismatch between the measured and simulated dynamic response of the fluid (e.g., oil or water) in a separate production well as one of the inverse main goals. In studies of enhanced oil recovery (EOR) through water injection, for example, the response mismatch is a differential or integrated water cut curve with two main characteristics: 1) the moment of fluid breakthrough and 2) the direction and shape of the response. While both characteristics are important variables in minimizing discrepancies, the moment of fluid breakthrough is what reveals the greatest impact on productivity economies. Moreover, the interval (that is, the time frame) of the fluid breakthrough is always burdened with uncertainty, which makes the assessment effort with the highest possible confidence even more significant. In fact, it is advisable to consider the moment of breakthrough as a first-order effect in HM dynamic well data, and fluctuations in the directional / shape curve as a second-order effect, since they mainly affect the operating conditions.
Несмотря на прогресс в технологии HM, это по-прежнему несомненно наиболее времязатратный аспект построения модели/имитационного моделирования, и схема работы HM сталкивается со многими проблемами, которые включают в себя:Despite advances in HM technology, this is still undoubtedly the most time-consuming aspect of model building / simulation, and the HM flowchart faces many challenges that include:
i) нелинейные результаты между откликом производства и характеристиками пласта;i) non-linear results between production response and reservoir characteristics;
ii) неоднозначные решения, которые требуют определение некоторого вида ″однозначности″;ii) ambiguous decisions that require a definition of some kind of ″ uniqueness ″;
iii) относительное влияние ключевых параметров может не быть очевидным;iii) the relative effects of key parameters may not be apparent;
iv) условия не ограничены, а неопределенности и в переменных редко известны; иiv) conditions are not limited, and uncertainties in variables are rarely known; and
v) данные по добыче могут быть ошибочно и изначально искажены.v) production data may be erroneously and initially distorted.
СУЩНОСТЬ ИЗОБРЕТЕНИЯSUMMARY OF THE INVENTION
Настоящее изобретение таким образом отвечает вышеприведенным потребностям и преодолевает один или больше недостатков в предшествующем уровне техники, предоставляя системы и способы для оценки моментов прорыва флюида в местонахождении добывающей скважины на основании моделирования распространения флюида.The present invention thus meets the above needs and overcomes one or more of the drawbacks of the prior art by providing systems and methods for estimating fluid breakthroughs at a production well location based on fluid distribution modeling.
В одном варианте осуществления настоящее изобретение включает в себя способ для оценки момента прорыва флюида в добывающей скважине, на основании данных моделирования распространения флюида, содержащий: i) идентификацию данных отслеживания линий тока; ii) вычисление среднего времени в пути в каждой ячейке сети на основании данных отслеживания линий тока; iii) идентификацию кратчайшей или быстрейшей линии тока для данной добывающей скважины, используя среднее время в пути линии тока в каждой ячейке сети; iv) вычисление среднего времени пролета для кратчайшей или быстрейшей линии тока через каждую пройденную ячейку сети, используя процессор вычислительной машины, и v) оценку момента прорыва флюида в добывающей скважине, используя данные моделирования распространения флюида и среднее время пролета для кратчайшей или быстрейшей линии тока.In one embodiment, the present invention includes a method for estimating a fluid breakthrough in a production well based on fluid distribution simulation data, comprising: i) identifying flow line tracking data; ii) calculating the average travel time in each cell of the network based on streamline tracking data; iii) the identification of the shortest or fastest streamline for a given production well, using the average travel time of the streamline in each cell of the network; iv) calculating the average transit time for the shortest or fastest flow line through each cell passed through the network using a computer processor, and v) estimate the moment of fluid breakthrough in the production well using fluid propagation simulation data and the average transit time for the shortest or fastest flow line.
В другом варианте осуществления, настоящее изобретение включает в себя энергонезависимое устройство хранения программ, материально несущее исполняемые компьютером команды для оценки момента прорыва флюида в добывающей скважине. Команды исполняются для выполнения: i) идентификации данных отслеживания линий тока; ii) вычисления среднего времени в пути в каждой ячейке сети на основании данных отслеживания линий тока; iii) идентификацию кратчайшей или быстрейшей линии тока для данной добывающей скважины, используя среднее время в пути линии тока в каждой ячейке сети; iv) вычисление среднего времени пролета для кратчайшей или быстрейшей линии тока через каждую пройденную ячейку сети, используя [процессор вычислительной машины]; и v) оценки момента прорыва флюида в добывающей скважине, используя данные моделирования распространения флюида и среднее время пролета для кратчайшей или быстрейшей линии тока.In another embodiment, the present invention includes a non-volatile program storage device materially carrying computer-executable instructions for estimating a breakthrough moment in a production well. Commands are executed to: i) identify streamline tracking data; ii) calculating the average travel time in each cell of the network based on streamline tracking data; iii) the identification of the shortest or fastest streamline for a given production well, using the average travel time of the streamline in each cell of the network; iv) calculating the average flight time for the shortest or fastest streamline through each cell passed through the network using [computer processor]; and v) estimating the moment of fluid breakthrough in the producing well using fluid propagation simulation data and average transit time for the shortest or fastest flow line.
Дополнительные аспекты, преимущества и варианты осуществления данного изобретения станут очевидны специалистам в данной области техники из нижеследующего описания различных вариантов осуществления и сопутствующих чертежей.Additional aspects, advantages, and embodiments of the present invention will become apparent to those skilled in the art from the following description of various embodiments and the accompanying drawings.
КРАТКОЕ ОПИСАНИЕ ЧЕРТЕЖЕЙBRIEF DESCRIPTION OF THE DRAWINGS
Настоящее изобретение описано ниже со ссылкой на прилагаемые чертежи, на которых схожие элементы обозначены схожими номерами позиций и на которых:The present invention is described below with reference to the accompanying drawings, in which like elements are denoted by like reference numerals and in which:
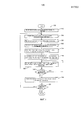
Фиг. 1 является блок-схемой, иллюстрирующей некоторый вариант осуществления способа для реализации настоящего изобретения.FIG. 1 is a flowchart illustrating an embodiment of a method for implementing the present invention.
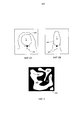
Фиг. 2A иллюстрирует скорость и направление распространения флюида через широкий песчаный карман.FIG. 2A illustrates the speed and direction of fluid propagation through a wide sand pocket.
Фиг. 2B - скорость и направление распространения флюида через узкий песчаный карман.FIG. 2B is the velocity and direction of fluid propagation through a narrow sand pocket.
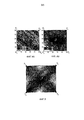
Фиг. 3 иллюстрирует пример распространения флюида через песчаную фракцию фациальной модели во время начального этапа моделирования.FIG. Figure 3 illustrates an example of fluid propagation through the sand fraction of a facies model during the initial modeling phase.
Фиг. 4A иллюстрирует синтезированную 2D модель проницаемости с 2500 ячейками сети (50×50) и пятиточечной сеткой скважин (1 нагнетательная скважина (I) и 4 добывающих скважины (P1-P4)).FIG. 4A illustrates a synthesized
Фиг. 4B иллюстрирует моделирование распространения флюида через 2D модель проницаемости с Фиг. 4A от нагнетательной скважины (I) относительно числа итераций (2500), которым было запущено моделирование.FIG. 4B illustrates a simulation of fluid propagation through the 2D permeability model of FIG. 4A from the injection well (I) with respect to the number of iterations (2500) that the simulation was launched.
Фиг. 5 иллюстрирует возможное распределение линий тока в пятиточечной сетке скважин на Фиг. 4B.FIG. 5 illustrates a possible distribution of streamlines in a five-point grid of wells in FIG. 4B.
Фиг. 6 иллюстрирует время в пути линии тока вдоль ее длин дуги в заданной ячейке сети (i, j, k) 2D модели проницаемости.FIG. 6 illustrates the travel time of a streamline along its arc lengths in a given network cell (i, j, k) of a 2D permeability model.
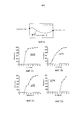
Фиг. 7A иллюстрирует наблюдаемую (измеренную) кривую обводненности для добывающей скважины P1 на FIG. 4A.FIG. 7A illustrates the observed (measured) water cut curve for a production well P 1 in FIG. 4A.
Фиг. 7B иллюстрирует наблюдаемую (измеренную) кривую обводненности для добывающей скважины P2 на FIG. 4A.FIG. 7B illustrates the observed (measured) water cut curve for a production well P 2 in FIG. 4A.
Фиг. 7C иллюстрирует наблюдаемую (измеренную) кривую обводненности для добывающей скважины P3 на FIG. 4A.FIG. 7C illustrates the observed (measured) water cut curve for the production well P 3 in FIG. 4A.
Фиг. 7D иллюстрирует наблюдаемую (измеренную) кривую обводненности для добывающей скважины P4 на FIG. 4A.FIG. 7D illustrates the observed (measured) water cut curve for a production well P 4 in FIG. 4A.
Фиг. 8 является функциональной схемой, иллюстрирующей некоторый вариант осуществления системы для реализации настоящего изобретения.FIG. 8 is a functional diagram illustrating an embodiment of a system for implementing the present invention.
ПОДРОБНОЕ ОПИСАНИЕ ПРЕДПОЧТИТЕЛЬНЫХ ВАРИАНТОВ ОСУЩЕСТВЛЕНИЯDETAILED DESCRIPTION OF THE PREFERRED EMBODIMENTS
Объект патентования настоящего изобретения описан с конкретностью, однако само описание не предназначено ограничивать объем изобретения. Объект патентования, таким образом, может также быть осуществлен другими путями, включая в себя другие этапы или сочетания этапов, сходных с теми, что описаны в данном документе, в сочетании с другими современными или перспективными технологиями. Кроме того, хотя термин ″этап″ может быть использован в данном документе для описания разных элементов примененных способов, данный термин не должен быть интерпретирован как подразумевающий любой конкретный порядок среди или между разными этапами, раскрываемыми в данном документе, за исключением случаев, когда иное явно ограничено данным описанием по отношению к тому или иному порядку. В то время как настоящее изобретение может быть применено в нефтяной и газовой индустрии, оно не ограничивается этим и может также быть применено в других индустриях для достижения схожих результатов.The subject matter of the invention is described with specificity, however the description itself is not intended to limit the scope of the invention. Thus, the patented subject matter can also be implemented in other ways, including other steps or combinations of steps similar to those described in this document, in combination with other modern or promising technologies. In addition, although the term ″ step ″ can be used in this document to describe the various elements of the applied methods, this term should not be interpreted as implying any specific order among or between the various steps disclosed in this document, unless otherwise expressly limited to this description in relation to a particular order. While the present invention can be applied in the oil and gas industry, it is not limited to this and can also be applied in other industries to achieve similar results.
Настоящее изобретение включает в себя системы и способы для оценки моментов прорыва флюида в местоположениях добывающих скважин на основании моделирования распространения флюида. Настоящее изобретение включает в себя моделирование распространения флюида, являющегося обычно статическим и представляющего момент(ы) вторжения для флюида, закачанного в нагнетательную скважину(ы) для достижения добывающей скважины(-). Моделирование дает иметь возможность полное рассмотрение фациального моделирования, которое сохраняет контроль над литологической целостностью геологических моделей посредством прямого ограничения моделирования при фациальном распространении. Моделирование также сохраняет стохастичность распространения фронта флюида. Несмотря на статичную природу данного моделирования стохастическая выборка движения фронта флюида выполняется посредством использования равномерного распределения.The present invention includes systems and methods for estimating fluid breakthroughs at production well locations based on fluid propagation modeling. The present invention includes modeling a fluid distribution that is typically static and representing an invasion moment (s) for a fluid injected into an injection well (s) to reach a production well (-). Modeling makes it possible to fully consider facies modeling, which retains control over the lithological integrity of geological models by directly restricting modeling during facies distribution. The simulation also preserves the stochasticity of the propagation of the fluid front. Despite the static nature of this simulation, stochastic sampling of fluid front motion is performed using uniform distribution.
Настоящее изобретение преобразует момент(ы) вторжения флюида (заданные моделированием в единицах повторений) в интервал физического времени (заданный, например, в днях, неделях, месяцах…), являющийся совместимым с историей эксплуатации скважины. Таким образом, настоящее изобретение предоставляет новые возможности для быстрой оценки ценных характеристик производительности скважины быстрым и рентабельным способом. К примеру, быстрая и точная оценка момент(ов) прорыва флюида, относящаяся к отдельной модели месторождения, может быть достигнута до начала полной инверсии. Подобная оценка предоставит ценную информацию операторам скважины относительно динамики клапанов скважины, в особенности в EOR проектах с нагнетанием воды/газа в которых управление производством нефти и воды/газа открывает существенный экономический эффект.The present invention converts the fluid invasion moment (s) (specified by simulations in repetition units) into a physical time interval (specified, for example, in days, weeks, months ...) that is compatible with the well’s history of operation. Thus, the present invention provides new opportunities for quickly evaluating valuable characteristics of well productivity in a quick and cost-effective manner. For example, a quick and accurate estimate of fluid breakthrough moment (s) pertaining to a particular field model can be achieved before a complete inversion begins. Such an assessment will provide valuable information to well operators regarding the dynamics of well valves, especially in EOR water / gas injection projects in which managing oil and water / gas production offers significant economic benefits.
С целью достижения быстрой оценки момента(ов) прорыва флюида (TBT), настоящее изобретение использует сочетание отслеживания линии тока и соответствующего времени пролета (″TOF″) по ходу моделирования. Таким образом, настоящее позволяет быструю аппроксимацию моментов прорыва флюида, выполняя запуск моделирования и одно повторение отслеживания линии тока в процессе автоматизированной адаптации модели (″AHM″), учитывающей линии тока, для модели месторождения.In order to achieve rapid evaluation points (s) fluid breakthrough (T BT), the present invention uses a combination of tracking the current line and the corresponding time of flight ( "TOF") during the simulation. Thus, the present allows a quick approximation of fluid breakthrough times by running simulations and one repetition of tracking the streamline in an automated model adaptation (″ AHM ″) that takes into account streamlines for the field model.
ОПИСАНИЕ СПОСОБАDESCRIPTION OF THE METHOD
Со ссылкой на Фиг. 1, блок-схема иллюстрирует некоторый вариант осуществления способа 100 для реализации настоящего изобретения.With reference to FIG. 1, a flowchart illustrates an embodiment of a
На этапе 102 осуществляется моделирование распространения флюида (″FPS″). Одна техника для выполнения FPS основывается на алгоритме в пакете программного обеспечения RGeoS, разработанного D. Renard. Данный алгоритм FPS моделирует распространение нескольких флюидов, известных в нагнетательных и/или добывающих скважинах, которые предусмотрены фациальной информацией, известной в узлах регулярной сети, и стремится позволить флюиду, встреченному в скважинах (например, в нагнетательной скважине) расти или расширятся пространственно. Скорость и направление роста зависит от размера песчаных карманов, которые могут быть заполнены. На Фиг. 2, к примеру, действительная скорость и направление распространения флюида через широкий песчаный карман (Фиг. 2A) и узкий песчаный карман (Фиг. 2B) показаны. Чем больше карманы 206, 208, там быстрее рост. Векторы скорости 202, 204 используются в алгоритме FPS. Данный алгоритм разработан для выполнения некоторого моделирования числовой переменной, используя технику моделирования Eden. Данная техника предоставляет более быстрое альтернативное решение для программы моделирования потока многофазного флюида. Данная техника объединяет пример двойной среды ″черное и белое″, где белое изображает песок, а черное изображает глину с одной или несколькими нагнетательными скважинами и одной или несколькими добывающими скважинами, как показано на Фиг. 3. В этом примере, показаны местоположения песчаных фаций 302, 304, 306 и двух нагнетательных скважин 307, 308.At
Теперь, со ссылкой на Фиг. 4A, синтезированная 2D модель проницаемости показана с 2500 ячейками сети (50×50) и пятиточечной сеткой скважин (1 нагнетательная скважина (I) и 4 добывающих скважины (P1-P4)). Данный алгоритм FPS был использован в 2500 повторениях, поскольку одна ячейка данной модели заполняется за одно повторение. На Фиг. 4B моделирование распространения флюида через 2D модель распространения на Фиг. 4A от нагнетательной скважины (I) показано относительно числа повторений (2500), которым было запущено данное моделирование. На Фиг. 5 показано одно возможное распространение линий тока в пятиточечной сетке скважин на Фиг. 4B.Now, with reference to FIG. 4A, a synthesized 2D permeability model is shown with 2,500 grid cells (50 × 50) and a five-point grid of wells (1 injection well (I) and 4 production wells (P 1 -P 4 )). This FPS algorithm was used in 2500 repetitions, since one cell of this model is filled in one repetition. In FIG. 4B modeling fluid distribution through the 2D distribution model of FIG. 4A from the injection well (I) is shown relative to the number of repetitions (2500) by which this simulation was run. In FIG. 5 shows one possible distribution of streamlines in a five-point grid of wells in FIG. 4B.
С целью реализации алгоритма FPS в качестве быстрой доверенной оценки момента прорыва флюида в инверсии AHM в кривых обводнения, преобразования момента(ов) вторжения флюида в интервал физического времени(-) должен быть рассмотрен со следующими основными допущениями:In order to implement the FPS algorithm as a fast trusted estimate of the moment of fluid breakthrough in the AHM inversion in the water flooding curves, the transformation of the fluid invasion moment (s) into the physical time interval (-) should be considered with the following basic assumptions:
i) TOF линии тока представляет собой ключевой фактор нормализации;i) TOF streamlines are a key factor in normalization;
ii) отслеживание TOF от добывающей скважины(-) представляет собой дренируемый скважиной объем; иii) tracking TOF from the production well (-) is the volume of the well drained; and
iii) отслеживание флюида от нагнетательной скважины дает оценку рабочего объема.iii) tracking fluid from the injection well provides an estimate of the displacement.
Для оценки момента прорыва флюида в добывающей скважине предполагается, что следующие расчеты завершены для данной модели месторождения, используя любую технику, хорошо известную в данной области техники, для отслеживания линий тока по результатам прямого моделирования давления и скорости флюида: a) расчет момента вторжения флюида (то есть этап 102); и b) первое повторение отслеживания линии тока и расчета TOF (то есть этап 106). Эти расчеты дадут a) момент вторжения флюида от алгоритма FPS, заданного числом повторений моделирования (принимая 1 повторение на ячейку сети); и b) общее число линий тока, проходящих через любую ячейку сети модели месторождения с координатами (i, j, k).To estimate the moment of fluid breakthrough in the production well, it is assumed that the following calculations are completed for this model of the field using any technique well known in the art to track flow lines from direct modeling of pressure and fluid velocity: a) calculation of the moment of fluid invasion ( that is, step 102); and b) a first repetition of streamline tracking and TOF calculation (i.e., step 106). These calculations will give a) the moment of invasion of the fluid from the FPS algorithm, given the number of repetitions of the simulation (taking 1 repetition per network cell); and b) the total number of streamlines passing through any cell in the field model network with coordinates (i, j, k).
На этапе 104 идентифицируют результаты данных FPS из этапа 102, которые включают в себя момент вторжения флюида, заданный числом повторений моделирования, необходимым флюиду для достижения любой добывающей скважины (Pm) от нагнетающей скважины через одну или несколько ячеек сети, представляющих модель свойств пласта.In
На этапе 106 идентифицируют данные отслеживания линий тока, используя любую хорошо известную технику, которые включают в себя число сегментов линий тока, пересекающих каждую ячейку сети (NSLN), время пробега (![]()
![]()
![]()
![]()
![]()
![]()

где ![]()
![]()
![]()
![]()
![]()
![]()
На этапе 108 среднее время пробега линии тока в каждой ячейке сети (![]()
![]()

где (NSLN) является числом сегментов линий тока, пересекающих каждую ячейку сети из этапа 106, а ![]()
![]()
На этапе 114 кратчайшую/быстрейшую линию тока идентифицируют для каждой добывающей скважины (Pm), используя среднее время пробега линии тока в каждой ячейке сети из этапа 108 и любой хорошо известный алгоритм поиска. Кратчайшая/быстрейшая линия тока является линией тока с наименьшей суммой средних времен пробега линий тока (![]()
![]()
На этапе 116 общее число всех ячеек сети (![]()
![]()
На этапе 118 среднее TOF (<TOF>min) для кратчайшей/быстрейшей линии тока, идентифицированной на этапе 114, вычисляют по каждой пересекающей ячейку сети, используя наименьшую сумму средних времен пробега линий тока (![]()
![]()
![]()
![]()

где индекс (u) представляет собой число пробегов по всем индексам ячеек сети, пересекаемых кратчайшей/быстрейшей линией тока. Различие между ″быстрейшей″ и ″медленнейшей″ линией тока от распределения линий тока, относящихся к каждой добывающей скважине (Pm), соответствует отличию между однородным и неоднородным пространственным распределением свойств пласта, таких как, к примеру, пустоты. Разница между распределением линий тока на Фиг. 5 показывает, что добывающие скважины P2 и P3 соединены с нагнетательной скважиной (I) через явно разные геологические формации, чем добывающие скважины P1 и P4, что может быть сопоставленным с подстилающей структурой пустот.where index (u) is the number of runs on all indexes of the network cells intersected by the shortest / fastest current line. The difference between the “fastest” and “slowest” current lines from the distribution of streamlines related to each production well (P m ) corresponds to the difference between a uniform and non-uniform spatial distribution of formation properties, such as, for example, voids. The difference between the distribution of streamlines in FIG. 5 shows that the producing wells P 2 and P 3 are connected to the injection well (I) through clearly different geological formations than the producing wells P 1 and P 4 , which can be compared with the underlying structure of the voids.
На этапе 120 способ 100 определяет все ли ячейки сети, пересекаемые кратчайшей/быстрейшей линией тока, были рассмотрены. Если все пересекаемые ячейки сети не были рассмотрены, то тогда способ 100 возвращается к этапу 118. Если все пересекаемые ячейки сети были рассмотрены, то тогда способ 100 переходит к этапу 124. В качестве варианта, этапы со 118 по 120 могут быть выполнены единовременно для каждой пересекаемой ячейки сети.At
На этапе 124 оценку момента прорыва флюида для каждой добывающей скважины (Pm) вычисляют, объединяя данные отслеживания линий тока из этапа 106 с данными FPS из этапа 104, что может быть вычислено, используя следующее уравнение:At

где (Nxyz) и (Np) представляют собой общий размер модели свойств пласта и общее число добывающих скважин, соответственно, (<TOF>min) представляет собой среднее TOF для кратчайшей/быстрейшей линии тока, вычисленное на этапе 118, (![]()
![]()
![]()
![]()
На этапе 126 способ 100 определяет, все ли добывающие скважины были рассмотрены. Если не все добывающие скважины (Pm) были рассмотрены, то тогда способ 100 возвращается к этапу 104. Если все добывающие скважины (Pm) были рассмотрены, то тогда способ 100 завершается. В качестве варианта, этапы с 104 по 126 могут быть выполнены единовременно для каждой добывающей скважины (Pm).At
ПРИМЕРEXAMPLE
Со ссылкой на синтезированную 2D модель проницаемости на Фиг. 4A, наблюдаемые (измеренные) кривые обводнения для конфигурации модели на FIG 4A даны на Фиг. 7A, 7B, 7C и 7D для каждой из четырех добывающих скважин (P1, P2, P3 и P4).With reference to the synthesized 2D permeability model in FIG. 4A, the observed (measured) watering curves for the model configuration in FIG 4A are given in FIG. 7A, 7B, 7C and 7D for each of the four production wells (P 1 , P 2 , P 3 and P 4 ).
Точки данных дата/время по оси x на Фиг. 7A-7D, соответствующие физическим датам, относящимся к плану нагнетания воды (точки данных прорыва воды), представлены ниже в Таблице 1.Date / time data points along the x axis in FIG. 7A-7D corresponding to physical dates related to the water injection plan (water breakthrough data points) are presented below in Table 1.
Наблюдаемые моменты прорыва воды, выведенные из Фиг. 4A, даны ниже в Таблице 2. Более того, Таблица 2 перечисляет моменты вторжения воды, вычисленные посредством алгоритма FPS, моменты прорыва воды (TB7), вычисленные с использованием способа, предложенного на Фиг. 1 и погрешность, соответствующую результату, полученному посредством способа, предложенного на Фиг. 1.The observed moments of water breakthrough derived from FIG. 4A are given in Table 2 below. Moreover, Table 2 lists the water intrusion moments calculated by the FPS algorithm, the water breakthrough moments (T B7 ) calculated using the method proposed in FIG. 1 and the error corresponding to the result obtained by the method proposed in FIG. one.
Результаты показывают, что способ, предложенный на Фиг. 1, способен быстро предсказать момент прорыва флюида с погрешностью менее чем 10% для данной пятиточечной сетки скважин. Достигнутая погрешность может быть разной (больше/меньше), когда распространение флюида применено через область со значительно большей геологической сложностью, и динамическая модель объединяет значительно больше число добывающих скважин.The results show that the method proposed in FIG. 1, is able to quickly predict the moment of fluid breakthrough with an error of less than 10% for a given five-point grid of wells. The error achieved can be different (more / less) when the fluid distribution is applied through an area with significantly greater geological complexity, and the dynamic model combines a significantly larger number of production wells.
ОПИСАНИЕ СИСТЕМЫSYSTEM DESCRIPTION
Настоящее изобретение может быть реализовано через исполняемые компьютером последовательности команд, такие как программные модули, обычно называемые программными приложениями или прикладными программами, исполняемыми компьютером. Программное обеспечение может включать в себя, для примера, подпрограммы, программы, объекты, компоненты, структуры данных и так далее, которые выполняют отдельные задачи или реализуют отдельные абстрактные виды данных. Интерактивная среда DecisionSpace®, которая является коммерческим программным обеспечением, поставляемым Landmark Graphics Corporation, может быть использована как приложение интерфейса для реализации настоящего изобретения. Данное программное обеспечение может также взаимодействовать с другими сегментами кода для запуска различных задач в ответ на данные, принятые в сочетании с источником принятых данных. Программное обеспечение может быть сохранено и/или перенесено на любом виде запоминающих устройств, таких как CD-ROM, накопитель на магнитных дисках, запоминающее устройство на ЦМД и полупроводниковое запоминающее устройство (например, различные виды ПЗУ или ОЗУ). Кроме того, данное программное обеспечение и его результаты могут быть переданы по различным средам передачи, таким как оптоволокно, металлический провод, и/или через любую из множества сетей передачи данных, таких как Интернет.The present invention may be implemented through computer-executable sequences of instructions, such as program modules, commonly referred to as software applications or computer-executable applications. The software may include, for example, routines, programs, objects, components, data structures, and so on, which perform separate tasks or implement separate abstract types of data. The DecisionSpace® interactive environment, which is commercial software provided by Landmark Graphics Corporation, can be used as an interface application for implementing the present invention. This software can also interact with other code segments to run various tasks in response to data received in combination with a source of received data. The software can be stored and / or transferred to any type of storage device, such as a CD-ROM, a magnetic disk drive, a memory device on a DEM and a semiconductor memory device (for example, various types of ROM or RAM). In addition, this software and its results can be transmitted over various transmission media, such as optical fiber, metal wire, and / or through any of a variety of data transmission networks, such as the Internet.
Более того, специалисты в данной области техники оценят, что данное изобретение может быть применено со множеством конфигураций вычислительных устройств, включая ручные устройства, мультипроцессорные системы, микропроцессорная или программируемая бытовая электроника, мини-ЭВМ, основные ЭВМ, и тому подобное. Любое число вычислительных устройств и компьютерных сетей являются подходящими для использования с настоящим изобретением. Данное изобретение может быть применено в средах распределенных вычислений, где задачи выполняются дистанционно обрабатывающими устройствами, которые объединены через сеть связи. В среде распределенных вычислений программные модули могут быть расположены как на локальных, так и на удаленных запоминающих устройствах ЭВМ, включая накопительные запоминающие устройства. Настоящее изобретение может, таким образом, быть реализовано с использованием различного аппаратного обеспечения, программного обеспечения или их сочетания, в вычислительном устройстве или другой системе обработки.Moreover, those skilled in the art will appreciate that this invention can be applied with a variety of computing device configurations, including hand-held devices, multiprocessor systems, microprocessor or programmable consumer electronics, minicomputers, mainframes, and the like. Any number of computing devices and computer networks are suitable for use with the present invention. The present invention can be applied in distributed computing environments where tasks are performed by remote processing devices that are linked through a communications network. In a distributed computing environment, program modules can be located on both local and remote computer storage devices, including memory storage devices. The present invention may thus be implemented using various hardware, software, or a combination thereof, in a computing device or other processing system.
Со ссылкой на Фиг. 8, функциональная схема иллюстрирует некоторый вариант осуществления системы для реализации настоящего изобретения на компьютере. Система включает в себя вычислительный блок, иногда названный вычислительной системой, который содержит запоминающее устройство, прикладные программы, клиентский интерфейс, видеоинтерфейс, и обрабатывающий модуль. Вычислительный блок является только некоторым примером подходящей вычислительной среды и не предназначен предлагать какие-либо ограничения относительно объема использования или функциональных возможностей данного изобретения.With reference to FIG. 8, a functional diagram illustrates an embodiment of a system for implementing the present invention on a computer. The system includes a computing unit, sometimes called a computing system, that comprises a storage device, application programs, a client interface, a video interface, and a processing module. The computing unit is just some example of a suitable computing environment and is not intended to offer any limitations regarding the scope of use or functionality of the present invention.
Запоминающее устройство, в первую очередь, хранит прикладные программы, которые также могут быть описаны как программные модули, содержащие команды, исполняемые компьютером, выполняемые вычислительным блоком для реализации настоящего изобретения, описанного в настоящем документе и показанном на Фиг. 2. Запоминающее устройство таким образом, содержит модуль оценки момента прорыва флюида, который обеспечивает способ, показанный и описанный со ссылкой на Фиг. 1, и объединяет функциональные возможности из оставшихся прикладных программ, показанных на Фиг. 8. Модуль оценки момента прорыва флюида, к примеру, может быть использован для исполнения многих из функций, описанных со ссылкой на способ 100 на Фиг. 1. Интерактивная среда Decision Space® может быть использована, к примеру, в качестве интерфейсного приложения для реализации модуля оценки момента прорыва флюида и использовать результаты способа 100 на Фиг. 1.The storage device primarily stores application programs, which can also be described as program modules containing computer-executable instructions executed by a computing unit for implementing the present invention described herein and shown in FIG. 2. The storage device thus comprises a fluid breakthrough moment estimation module that provides the method shown and described with reference to FIG. 1, and combines the functionality of the remaining applications shown in FIG. 8. The fluid breakthrough moment estimation module, for example, can be used to perform many of the functions described with reference to
Хотя вычислительный блок показан как имеющий обобщенное запоминающее устройство, вычислительный блок обычно включает в себя различные машиночитаемые носители. В качестве примера, а не ограничения, машиночитаемый носитель может содержать запоминающее устройство ЭВМ. Запоминающее устройство ЭВМ может включать в себя запоминающее устройство ЭВМ в виде энергозависимого и/или энергонезависимого запоминающего устройства, такого как постоянное запоминающее устройство (ПЗУ) и оперативное запоминающее устройство (ОЗУ). Базовая система ввода/вывода (BIOS), содержащая базовые подпрограммы, которые помогают передавать информацию между элементами в вычислительном блоке, например, во время запуска, обычно содержится в ПЗУ. ОЗУ обычно содержит данные и/или программные модули, которые немедленно доступны и/или в настоящий момент обрабатываются обрабатывающим модулем. В качестве примера, а не ограничения, вычислительный блок включает в операционную систему прикладные программы, другие программные модули и данные программ.Although the computing unit is shown as having a generalized storage device, the computing unit typically includes various computer-readable media. By way of example, and not limitation, a computer-readable medium may comprise a computer storage device. A computer storage device may include a computer storage device in the form of a volatile and / or non-volatile storage device, such as read-only memory (ROM) and random access memory (RAM). A basic input / output system (BIOS), containing basic routines that help transfer information between elements in a computing unit, for example, during startup, is usually contained in ROM. RAM typically contains data and / or program modules that are immediately available and / or currently being processed by the processing module. By way of example, and not limitation, the computing unit includes application programs, other program modules, and program data in the operating system.
Компоненты, показанные в запоминающем устройстве, могут также быть включены в другую съемную/несъемную энергозависимую/энергонезависимую среду компьютерного хранения или они могут быть реализованы в вычислительном блоке через прикладной программный интерфейс (″API″) или облачные вычисления, которые могут располагаться на отдельном вычислительном блоке, подключенном к вычислительному блоку через вычислительное устройство или сеть передачи данных. Только для примера, накопитель на жестком диске может читать с или записывать на несъемный энергонезависимый магнитный носитель, накопитель на магнитных дисках может читать с или записывать на съемный, энергонезависимый магнитный диск, а накопитель на оптических дисках может читать с или записывать на съемный, энергонезависимый оптический диск, такой как CD-ROM или другой оптический носитель. Другие съемные/несъемные, энергозависимые/энергонезависимые среды компьютерного хранения, которые могут быть использованы в примерной операционной среде, могут включать в себя, но не ограничиваться этим, кассеты с магнитной лентой, карты флэш-памяти, универсальные цифровые диски, цифровые видеоленты, твердотельные ОЗУ, твердотельные ПЗУ и так далее. Устройства и сопутствующие им среды компьютерного хранения, рассмотренные выше, обеспечивают хранение машиночитаемых команд, структур данных, программных модулей и других данных для вычислительного блока.The components shown in the storage device may also be included in another removable / non-removable volatile / non-volatile computer storage medium or they may be implemented in a computing unit via an application programming interface (″ API ″) or cloud computing that may reside on a separate computing unit connected to the computing unit through a computing device or data network. By way of example only, a hard disk drive can read from or write to a non-removable non-volatile magnetic medium, a magnetic disk drive can read from or write to a removable, non-volatile magnetic disk, and an optical drive can read from or write to a removable, non-volatile optical a disc, such as a CD-ROM or other optical media. Other removable / non-removable, volatile / non-volatile computer storage media that may be used in an exemplary operating environment may include, but are not limited to, magnetic tapes, flash memory cards, universal digital disks, digital video tapes, solid state RAM , solid state ROMs and so on. The devices and associated computer storage media discussed above provide storage of machine-readable instructions, data structures, program modules and other data for the computing unit.
Пользователь может вводить команды и информацию в вычислительный блок через пользовательский интерфейс, который может быть устройствами ввода, такими как клавиатура и позиционирующее устройство, обычно называемый ″мышь″, шаровой указатель или сенсорная панель. Устройства ввода могут включать в себя микрофон, рычажный указатель, антенну спутниковой связи, сканер и тому подобное. Эти и другие устройства ввода часто подключают к обрабатывающему модулю через системную шину, но они могут быть подключены через другой интерфейс и шинные структуры, такие как порт параллельного ввода-вывода или универсальная последовательная шина (USB).The user can enter commands and information into the computing unit through a user interface, which can be input devices, such as a keyboard and a positioning device, usually called a “mouse,” a ball pointer, or a touchpad. Input devices may include a microphone, a lever indicator, a satellite dish, a scanner, and the like. These and other input devices are often connected to the processing module via the system bus, but they can be connected via another interface and bus structures, such as a parallel I / O port or universal serial bus (USB).
Монитор или другой вид устройства отображения может быть подключен к системной шине через интерфейс, такой как видеоинтерфейс. Графический интерфейс пользователя (″GUI″) может также быть использован с видеоинтерфейсом для приема команд от пользовательского интерфейса и передачи команд в обрабатывающий модуль. Дополнительно к монитору, компьютеры могут также включать в себя другие периферийные устройства вывода, такие как акустическая система и печатающее устройство, которые могут быть подключены через интерфейс выходных периферийных устройств.A monitor or other type of display device may be connected to the system bus via an interface, such as a video interface. A graphical user interface (″ GUI ″) can also be used with a video interface to receive commands from the user interface and send commands to the processing module. In addition to the monitor, computers can also include other peripheral output devices, such as a speaker system and a printing device, which can be connected through the interface of the output peripheral devices.
Несмотря на то, что многие другие внутренние компоненты вычислительного блока не показаны, специалисты в данной области техники признают, что подобные компоненты и их схема соединений являются хорошо известными.Although many other internal components of the computing unit are not shown, those skilled in the art will recognize that such components and their wiring are well known.
Хотя настоящее изобретение было описано применительно к настоящим предпочтительным вариантам осуществления, специалисты в данной области техники поймут, что это не предназначено для ограничения данного изобретения этими вариантами осуществления. Из этого следует, что предполагается, что различные альтернативные варианты осуществления и модификации могут быть сделаны к раскрытым вариантам осуществления, не покидая сущность и объем данного изобретения, определенные прилагаемой формулой изобретения и ее эквивалентами.Although the present invention has been described with reference to the present preferred embodiments, those skilled in the art will understand that this is not intended to limit the present invention to these embodiments. It follows that it is contemplated that various alternative embodiments and modifications may be made to the disclosed embodiments without departing from the spirit and scope of the invention as defined by the appended claims and their equivalents.
Claims (20)
идентификацию данных отслеживания линии тока;
вычисление среднего времени пробега линии тока в каждой ячейке сети на основании данных отслеживания линии тока;
идентификацию кратчайшей или быстрейшей линии тока для добывающей скважины, используя среднее время пробега линии тока в каждой ячейке сети;
вычисление среднего времени пролета для кратчайшей или быстрейшей линии тока через каждую пересекаемую ячейку сети, используя процессор вычислительной машины; и
оценку момента прорыва флюида в добывающей скважине, используя данные моделирования распространения флюида и среднее время пролета для кратчайшей или быстрейшей линии тока.1. A method for estimating the moment of fluid breakthrough in a production well based on fluid distribution modeling data, comprising:
identification of current line tracking data;
calculating the average travel time of the streamline in each cell of the network based on the tracking data of the streamline;
identification of the shortest or fastest streamline for the producing well using the average travel time of the streamline in each cell of the network;
calculating the average flight time for the shortest or fastest streamline through each intersected network cell using a computer processor; and
Estimation of the moment of fluid breakthrough in the production well, using fluid distribution simulation data and the average transit time for the shortest or fastest flow line.
где NSLN является числом сегментов линий тока, пересекающих каждую ячейку сети, а
where N SLN is the number of streamline segments intersecting each network cell, and

где
Where
где Nxyz и Np представляют собой общий размер модели свойств пласта и общее число добывающих скважин соответственно, <TOF>min представляет собой среднее время пролета для кратчайшей или быстрейшей линии тока,
where N xyz and N p are the total size of the reservoir model and the total number of production wells, respectively, <TOF> min is the average transit time for the shortest or fastest flow line,
идентификации данных отслеживания линии тока;
вычисления среднего времени пробега линии тока в каждой ячейке сети на основании данных отслеживания линии тока;
идентификации кратчайшей или быстрейшей линии тока для добывающей скважины, используя среднее время пробега линии тока в каждой ячейке сети;
вычисления среднего времени пролета для кратчайшей или быстрейшей линии тока через каждую пересекаемую ячейку сети; и
оценки момента прорыва флюида в добывающей скважине, используя данные моделирования распространения флюида и среднее время пролета для кратчайшей или быстрейшей линии тока.11. A permanent storage device materially carrying computer-executable instructions for estimating a fluid breakthrough moment in a production well based on fluid distribution simulation data; instructions are executed to implement:
identification of current line tracking data;
calculating the average travel time of the streamline in each cell of the network based on the tracking data of the streamline;
identification of the shortest or fastest streamline for the producing well using the average travel time of the streamline in each cell of the network;
calculating the average flight time for the shortest or fastest streamline through each intersected network cell; and
Estimates of fluid breakthrough in a production well using fluid propagation simulation data and average transit time for the shortest or fastest streamlines.
где NSLN является числом сегментов линий тока, пересекающих каждую ячейку сети, а
where N SLN is the number of streamline segments intersecting each network cell, and
где
Where
где Nxyz и Np представляют собой общий размер модели свойств пласта и общее число добывающих скважин соответственно, <TOF>min представляет собой среднее время пролета для кратчайшей или быстрейшей линии тока,
where N xyz and N p are the total size of the reservoir model and the total number of production wells, respectively, <TOF> min is the average transit time for the shortest or fastest flow line,
Applications Claiming Priority (1)
| Application Number | Priority Date | Filing Date | Title |
|---|---|---|---|
| PCT/US2012/024656 WO2013119248A2 (en) | 2012-02-10 | 2012-02-10 | Systems and methods for estimating fluid breakthrough times at producing well locations |
Publications (2)
| Publication Number | Publication Date |
|---|---|
| RU2014130786A RU2014130786A (en) | 2016-04-10 |
| RU2590265C2 true RU2590265C2 (en) | 2016-07-10 |
Family
ID=48948146
Family Applications (1)
| Application Number | Title | Priority Date | Filing Date |
|---|---|---|---|
| RU2014130786/03A RU2590265C2 (en) | 2012-02-10 | 2012-02-10 | Systems and methods for assessment of moments of penetration of fluid in locations of production wells |
Country Status (10)
| Country | Link |
|---|---|
| US (1) | US20150039276A1 (en) |
| EP (1) | EP2795528A4 (en) |
| CN (1) | CN104067290A (en) |
| AR (1) | AR089973A1 (en) |
| AU (1) | AU2012369161B2 (en) |
| BR (1) | BR112014017652A8 (en) |
| CA (1) | CA2863156A1 (en) |
| MX (1) | MX2014008897A (en) |
| RU (1) | RU2590265C2 (en) |
| WO (1) | WO2013119248A2 (en) |
Families Citing this family (12)
| Publication number | Priority date | Publication date | Assignee | Title |
|---|---|---|---|---|
| SG11201605133WA (en) * | 2014-01-24 | 2016-07-28 | Landmark Graphics Corp | Optimized acidizing of a production well near aquifer |
| US10191182B2 (en) | 2015-12-01 | 2019-01-29 | Saudi Arabian Oil Company | Accuracy of water break-through time prediction |
| EP3574291B1 (en) | 2017-01-26 | 2023-12-06 | Dassault Systemes Simulia Corp. | Multi-phase flow visualizations based on fluid occupation time |
| US11714040B2 (en) | 2018-01-10 | 2023-08-01 | Dassault Systemes Simulia Corp. | Determining fluid flow characteristics of porous mediums |
| US10519768B2 (en) * | 2018-02-21 | 2019-12-31 | Saudi Arabian Oil Company | Systems and methods for operating hydrocarbon wells to inhibit breakthrough based on reservoir saturation |
| US11530598B2 (en) | 2018-08-21 | 2022-12-20 | Dassault Systemes Simulia Corp. | Determination of oil removed by gas via miscible displacement in reservoir rock |
| CN109902329B (en) * | 2018-09-21 | 2023-06-02 | 长江大学 | Auxiliary history fitting method, system, storage medium and equipment for oil reservoir simulation |
| US10983233B2 (en) | 2019-03-12 | 2021-04-20 | Saudi Arabian Oil Company | Method for dynamic calibration and simultaneous closed-loop inversion of simulation models of fractured reservoirs |
| US20220228466A1 (en) * | 2019-05-28 | 2022-07-21 | Schlumberger Technology Corporation | Streamline based creation of completion design |
| US11847391B2 (en) | 2020-06-29 | 2023-12-19 | Dassault Systemes Simulia Corp. | Computer system for simulating physical processes using surface algorithm |
| US11907625B2 (en) | 2020-12-29 | 2024-02-20 | Dassault Systemes Americas Corp. | Computer simulation of multi-phase and multi-component fluid flows including physics of under-resolved porous structures |
| CN117722164B (en) * | 2024-02-18 | 2024-04-16 | 西南石油大学 | Uniform water invasion control method for water-bearing gas reservoir |
Citations (4)
| Publication number | Priority date | Publication date | Assignee | Title |
|---|---|---|---|---|
| RU2172402C1 (en) * | 2000-01-11 | 2001-08-20 | НГДУ "Иркеннефть" ОАО "Татнефть" | Method of control over oil deposit development |
| US20080167849A1 (en) * | 2004-06-07 | 2008-07-10 | Brigham Young University | Reservoir Simulation |
| US20100312535A1 (en) * | 2009-06-08 | 2010-12-09 | Chevron U.S.A. Inc. | Upscaling of flow and transport parameters for simulation of fluid flow in subsurface reservoirs |
| US20110290479A1 (en) * | 2010-05-26 | 2011-12-01 | Chevron U.S.A. Inc. | System and method for enhancing oil recovery from a subterranean reservoir |
Family Cites Families (4)
| Publication number | Priority date | Publication date | Assignee | Title |
|---|---|---|---|---|
| FR2842321B1 (en) * | 2002-07-11 | 2008-12-05 | Inst Francais Du Petrole | METHOD FOR CONSTRAINING A FIELD OF HETEROGENEOUS PERMEABILITY REPRESENTING A UNDERGROUND RESERVOIR BY DYNAMIC DATA |
| EP1611508A4 (en) * | 2003-03-26 | 2006-07-26 | Exxonmobil Upstream Res Co | Performance prediction method for hydrocarbon recovery processes |
| MX2010006240A (en) * | 2007-12-07 | 2010-06-30 | Landmark Graphics Corp | Systems and methods for utilizing cell based flow simulation results to calculate streamline trajectories. |
| US8775142B2 (en) * | 2010-05-14 | 2014-07-08 | Conocophillips Company | Stochastic downscaling algorithm and applications to geological model downscaling |
-
2012
- 2012-02-10 RU RU2014130786/03A patent/RU2590265C2/en not_active IP Right Cessation
- 2012-02-10 US US14/377,800 patent/US20150039276A1/en not_active Abandoned
- 2012-02-10 CN CN201280068076.7A patent/CN104067290A/en active Pending
- 2012-02-10 MX MX2014008897A patent/MX2014008897A/en active IP Right Grant
- 2012-02-10 AU AU2012369161A patent/AU2012369161B2/en not_active Ceased
- 2012-02-10 EP EP12868041.0A patent/EP2795528A4/en not_active Withdrawn
- 2012-02-10 CA CA2863156A patent/CA2863156A1/en not_active Abandoned
- 2012-02-10 WO PCT/US2012/024656 patent/WO2013119248A2/en active Application Filing
- 2012-02-10 BR BR112014017652A patent/BR112014017652A8/en not_active IP Right Cessation
-
2013
- 2013-02-08 AR ARP130100432A patent/AR089973A1/en unknown
Patent Citations (4)
| Publication number | Priority date | Publication date | Assignee | Title |
|---|---|---|---|---|
| RU2172402C1 (en) * | 2000-01-11 | 2001-08-20 | НГДУ "Иркеннефть" ОАО "Татнефть" | Method of control over oil deposit development |
| US20080167849A1 (en) * | 2004-06-07 | 2008-07-10 | Brigham Young University | Reservoir Simulation |
| US20100312535A1 (en) * | 2009-06-08 | 2010-12-09 | Chevron U.S.A. Inc. | Upscaling of flow and transport parameters for simulation of fluid flow in subsurface reservoirs |
| US20110290479A1 (en) * | 2010-05-26 | 2011-12-01 | Chevron U.S.A. Inc. | System and method for enhancing oil recovery from a subterranean reservoir |
Non-Patent Citations (1)
| Title |
|---|
| Marco R. Thiele, Strimline Simulation, Streamsim Tecnologies, Inc., 8 International Forum on Reservoir Simulation, Stresa/Lago Maggiore, Italy, 20-24 июня 2005. * |
Also Published As
| Publication number | Publication date |
|---|---|
| EP2795528A4 (en) | 2016-06-29 |
| RU2014130786A (en) | 2016-04-10 |
| WO2013119248A3 (en) | 2014-04-17 |
| MX2014008897A (en) | 2014-09-22 |
| BR112014017652A2 (en) | 2017-06-20 |
| CA2863156A1 (en) | 2013-08-15 |
| WO2013119248A2 (en) | 2013-08-15 |
| AU2012369161A1 (en) | 2014-07-24 |
| AR089973A1 (en) | 2014-10-01 |
| BR112014017652A8 (en) | 2017-07-11 |
| EP2795528A2 (en) | 2014-10-29 |
| US20150039276A1 (en) | 2015-02-05 |
| CN104067290A (en) | 2014-09-24 |
| AU2012369161B2 (en) | 2015-05-28 |
Similar Documents
| Publication | Publication Date | Title |
|---|---|---|
| RU2590265C2 (en) | Systems and methods for assessment of moments of penetration of fluid in locations of production wells | |
| EP2929136B1 (en) | Method to assess the impact of existing fractures and faults for reservoir management | |
| US8504341B2 (en) | Methods, systems, and computer readable media for fast updating of oil and gas field production models with physical and proxy simulators | |
| EP2973429B1 (en) | Basin-to-reservoir modeling | |
| CN105122153A (en) | Methods and systems for reservoir history matching for improved estimation of reservoir performance | |
| US10445446B2 (en) | Discretization scheme for simulating proppant transport in dynamic fracture networks | |
| US9810045B2 (en) | Connection conditions for modeling fluid transport in a well system environment | |
| US10352146B2 (en) | Formation fracture flow monitoring | |
| Brown et al. | Using Data-Driven Technologies to Accelerate the Field Development Planning Process for Mature Field Rejuvenation | |
| EP3987478B1 (en) | Field development planning based on deep reinforcement learning | |
| RU2681778C2 (en) | Method and tool for the selection of operating parameters of wells at the mature oil fields flooding stage | |
| AU2011299495A1 (en) | System and method for simultaneous visualization of fluid flow within well completions and a reservoir | |
| US10997326B2 (en) | Time-to-finish simulation forecaster | |
| US10533403B2 (en) | Slug flow initiation in fluid flow models | |
| He et al. | IOR pilot evaluation in a brown-field fractured reservoir using data analytics of reservoir simulation results | |
| US11401786B2 (en) | Systems and methods for hydrocarbon reservoir well connectivity graph optimization, simulation and development | |
| EP3513033B1 (en) | Integrated hydrocarbon fluid distribution modeling | |
| Biswas et al. | An integrated geological-reservoir engineering technique for increasing confidence in field development planning for a reservoir under primary depletion | |
| EP3323092B1 (en) | Ensemble based decision making | |
| Nishonov et al. | Integrated Optimization as a Way to Increase the Project Value on the Example of the Achimov Deposits Development Evaluation | |
| Abdelkhalik et al. | Dynamic penalty function evolution algorithms for history matching of oil and gas reservoir models | |
| Turkarslan | Optimizing Development Strategies to Increase Reserves in Unconventional Gas Reservoirs |
Legal Events
| Date | Code | Title | Description |
|---|---|---|---|
| MM4A | The patent is invalid due to non-payment of fees |
Effective date: 20170211 |