JP7588976B2 - Mapping atrial fibrillation using fragmentation index - Google Patents
Mapping atrial fibrillation using fragmentation index Download PDFInfo
- Publication number
- JP7588976B2 JP7588976B2 JP2020121139A JP2020121139A JP7588976B2 JP 7588976 B2 JP7588976 B2 JP 7588976B2 JP 2020121139 A JP2020121139 A JP 2020121139A JP 2020121139 A JP2020121139 A JP 2020121139A JP 7588976 B2 JP7588976 B2 JP 7588976B2
- Authority
- JP
- Japan
- Prior art keywords
- processor
- peaks
- region
- additional
- heart
- Prior art date
- Legal status (The legal status is an assumption and is not a legal conclusion. Google has not performed a legal analysis and makes no representation as to the accuracy of the status listed.)
- Active
Links
Images


Classifications
-
- A—HUMAN NECESSITIES
- A61—MEDICAL OR VETERINARY SCIENCE; HYGIENE
- A61B—DIAGNOSIS; SURGERY; IDENTIFICATION
- A61B5/00—Measuring for diagnostic purposes; Identification of persons
- A61B5/24—Detecting, measuring or recording bioelectric or biomagnetic signals of the body or parts thereof
- A61B5/316—Modalities, i.e. specific diagnostic methods
- A61B5/318—Heart-related electrical modalities, e.g. electrocardiography [ECG]
- A61B5/346—Analysis of electrocardiograms
- A61B5/349—Detecting specific parameters of the electrocardiograph cycle
- A61B5/361—Detecting fibrillation
-
- A—HUMAN NECESSITIES
- A61—MEDICAL OR VETERINARY SCIENCE; HYGIENE
- A61B—DIAGNOSIS; SURGERY; IDENTIFICATION
- A61B5/00—Measuring for diagnostic purposes; Identification of persons
- A61B5/24—Detecting, measuring or recording bioelectric or biomagnetic signals of the body or parts thereof
- A61B5/316—Modalities, i.e. specific diagnostic methods
- A61B5/318—Heart-related electrical modalities, e.g. electrocardiography [ECG]
- A61B5/339—Displays specially adapted therefor
- A61B5/343—Potential distribution indication
-
- A—HUMAN NECESSITIES
- A61—MEDICAL OR VETERINARY SCIENCE; HYGIENE
- A61B—DIAGNOSIS; SURGERY; IDENTIFICATION
- A61B5/00—Measuring for diagnostic purposes; Identification of persons
- A61B5/24—Detecting, measuring or recording bioelectric or biomagnetic signals of the body or parts thereof
- A61B5/316—Modalities, i.e. specific diagnostic methods
- A61B5/318—Heart-related electrical modalities, e.g. electrocardiography [ECG]
- A61B5/367—Electrophysiological study [EPS], e.g. electrical activation mapping or electro-anatomical mapping
Landscapes
- Health & Medical Sciences (AREA)
- Life Sciences & Earth Sciences (AREA)
- Cardiology (AREA)
- Biomedical Technology (AREA)
- Medical Informatics (AREA)
- Biophysics (AREA)
- Pathology (AREA)
- Engineering & Computer Science (AREA)
- Veterinary Medicine (AREA)
- Heart & Thoracic Surgery (AREA)
- Physics & Mathematics (AREA)
- Molecular Biology (AREA)
- Surgery (AREA)
- Animal Behavior & Ethology (AREA)
- General Health & Medical Sciences (AREA)
- Public Health (AREA)
- Physiology (AREA)
- Measurement And Recording Of Electrical Phenomena And Electrical Characteristics Of The Living Body (AREA)
- Medicines Containing Plant Substances (AREA)
Description
本発明は、概して、電気生理学的マッピングに関し、特に、フラグメンテーション指数を使用して心房細動をマッピングする方法及びシステムに関する。 The present invention relates generally to electrophysiological mapping, and more particularly to a method and system for mapping atrial fibrillation using a fragmentation index.
心房細動は、心房に発生する不規則な心臓リズムである。心房細動をマッピングするための様々な技術が、当技術分野において知られている。 Atrial fibrillation is an irregular heart rhythm that originates in the atria. Various techniques for mapping atrial fibrillation are known in the art.
例えば、米国特許出願公開第2017/0367601号には、心房細動の持続に関わり得る患者の心臓の領域を識別する方法が記載されている。この方法は不整脈の基準サイクルを考慮に入れており、心臓の各領域を別々に分析する局所的な方法と、心臓の複数の領域を一緒に分析する領域的な方法という2つの変形方法を有している。 For example, U.S. Patent Application Publication No. 2017/0367601 describes a method for identifying regions of a patient's heart that may be involved in sustaining atrial fibrillation. The method takes into account arrhythmia reference cycles and has two variants: a local method, in which each region of the heart is analyzed separately, and a regional method, in which multiple regions of the heart are analyzed together.
米国特許出願公開第2015/0359430号には、身体構造の画像のための医療画像処理方法が記載されており、この方法は、解剖学的データを受信して患者の身体の領域の解剖学的画像を再構成することであって、当該領域が、標的組織に隣接している又はそこから離間している少なくとも1つの内部身体部分の一部を含む、ことと、患者の身体の領域の少なくとも上記の部分を撮像する機能撮像モダリティから機能データを受信することと、上記の解剖学的画像を処理して、上記の少なくとも1つの内部身体部分の壁の外側のゾーンに対応する少なくとも1つの画像マスクを生成することと、少なくとも1つの生成された画像マスクを、上記の標的組織を表す機能画像の再構成を導く機能データと相関させることと、再構成された機能画像を提供することと、を含んでいる。 US Patent Application Publication No. 2015/0359430 describes a medical image processing method for imaging of body structures, the method including receiving anatomical data to reconstruct an anatomical image of a region of a patient's body, the region including a portion of at least one internal body part adjacent to or spaced apart from a target tissue, receiving functional data from a functional imaging modality imaging at least the portion of the region of the patient's body, processing the anatomical image to generate at least one image mask corresponding to an outer zone of a wall of the at least one internal body part, correlating the at least one generated image mask with the functional data guiding the reconstruction of a functional image representative of the target tissue, and providing a reconstructed functional image.
米国特許出願公開第2012/0078129号には、組織内の1つ又は2つ以上の低電圧構造の位置の画像を表示する方法が記載されている。この方法は、組織の一部分に対応する電気マッピングデータを受信することと、電気マッピングデータを使用して画像を生成することと、を含んでいる。電圧範囲の上限及び下限に隣接する2つの終点を有する少なくとも1つの電圧範囲内の電気マッピング値は、少なくとも1つの電圧範囲外の電気マッピング値と区別可能である。2つの終点は、組織の1つ又は2つ以上の低電圧構造を組織の他の部分と区別するように選択される。 U.S. Patent Application Publication No. 2012/0078129 describes a method for displaying an image of the location of one or more low voltage structures in tissue. The method includes receiving electrical mapping data corresponding to a portion of the tissue and generating an image using the electrical mapping data. Electrical mapping values within at least one voltage range having two endpoints adjacent upper and lower limits of the voltage range are distinguishable from electrical mapping values outside the at least one voltage range. The two endpoints are selected to distinguish the one or more low voltage structures of the tissue from other portions of the tissue.
本明細書に記載される本発明の一実施形態は、心臓内の心房細動(atrial fibrillation、AF)をマッピングする方法を提供し、この方法は、心臓内の所定の位置で取得された、AFを示す電位図(electrogram、EGM)信号を受信することを含む。2つ又は3つ以上の一次ピークがEGM信号において識別され、サイクル長(cycle length、CL)が隣接する一次ピーク間で計算される。1つ又は2つ以上の二次ピークが、CL内でEGM信号において識別される。CL当たりの二次ピークの数を示す局所フラグメンテーション指数(fragmentation index、FI)が計算される。局所FIは、心臓の少なくとも一部のマップ上で可視化される。 One embodiment of the present invention described herein provides a method of mapping atrial fibrillation (AF) in a heart, the method including receiving an electrogram (EGM) signal indicative of AF acquired at a predetermined location in the heart. Two or more primary peaks are identified in the EGM signal and a cycle length (CL) is calculated between adjacent primary peaks. One or more secondary peaks are identified in the EGM signal within a CL. A regional fragmentation index (FI) indicative of the number of secondary peaks per CL is calculated. The regional FI is visualized on a map of at least a portion of the heart.
いくつかの実施形態では、心臓が、領域を有し、当該領域が、(i)当該領域の既定の場所から所定の距離に位置する所定の位置と、(ii)追加のFIを有し、かつ既定の場所から追加の距離に位置する少なくとも追加の位置と、を含み、本方法は、所定の距離及び追加の距離に基づいて、また局所FI及び追加のFIに基づいて、当該領域の領域FIを計算及び可視化することを含む。他の実施形態では、既定の場所が、領域の幾何学的重心(center of gravity、COG)を含み、領域FIを計算及び可視化することが、所定の距離及び追加の距離に基づいて、少なくとも局所FI及び追加のFIの加重平均を計算することを含む。更に他の実施形態では、1つ又は2つ以上の二次ピークを識別することが、既定の閾値に基づいて、2つ又は3つ以上の隣接する二次ピークを統合することを含む。 In some embodiments, the heart has a region, the region includes (i) a predetermined location located a predetermined distance from a predetermined location of the region, and (ii) at least an additional location having an additional FI and located at the additional distance from the predetermined location, and the method includes calculating and visualizing a regional FI of the region based on the predetermined distance and the additional distance and based on the local FI and the additional FI. In other embodiments, the predetermined location includes a geometric center of gravity (COG) of the region, and calculating and visualizing the regional FI includes calculating a weighted average of at least the local FI and the additional FI based on the predetermined distance and the additional distance. In yet other embodiments, identifying one or more secondary peaks includes merging two or more adjacent secondary peaks based on a predetermined threshold.
一実施形態では、本方法は、CL内に関心ウィンドウ(window of interest、WOI)を定義することと、WOI内の1つ又は2つ以上の二次ピークを識別することと、を含む。別の実施形態では、EGM信号が複数のCLを含み、局所FIを計算することが、複数のCLに基づいて平均CLを計算することと、平均CL当たりの二次ピークの平均数を計算することと、を含む。 In one embodiment, the method includes defining a window of interest (WOI) within the CL and identifying one or more secondary peaks within the WOI. In another embodiment, the EGM signal includes a plurality of CLs, and calculating the local FI includes calculating an average CL based on the plurality of CLs and calculating an average number of secondary peaks per average CL.
本発明の実施形態によれば、心臓における心房細動(AF)をマッピングするシステムが更に提供され、このシステムは、プロセッサとディスプレイとを含む。プロセッサは、(a)心臓内の所定の位置で取得された、AFを示す電位図(EGM)信号を受信し、(b)EGM信号において、2つ又は3つ以上の一次ピークを識別し、隣接する一次ピーク間のサイクル長(CL)を計算し、(c)EGM信号において、CLの持続時間内の1つ又は2つ以上の二次ピークを識別し、(d)CL当たりの二次ピークの数を示す局所フラグメンテーション指数(FI)を計算する、ように構成されている。ディスプレイは、心臓の少なくとも一部のマップ上に局所FIを表示するように構成されている。 According to an embodiment of the present invention, there is further provided a system for mapping atrial fibrillation (AF) in a heart, the system including a processor and a display. The processor is configured to (a) receive an electrogram (EGM) signal indicative of AF acquired at a predetermined location in the heart, (b) identify two or more primary peaks in the EGM signal and calculate a cycle length (CL) between adjacent primary peaks, (c) identify one or more secondary peaks in the EGM signal within a duration of a CL, and (d) calculate a regional fragmentation index (FI) indicative of the number of secondary peaks per CL. The display is configured to display the regional FI on a map of at least a portion of the heart.
本発明は、以下の「発明を実施するための形態」を図面と併せて考慮することで、より完全に理解されよう。
概論
医療処置によっては、心臓組織上の異なるそれぞれの部位に複数の電極を配置することによる電位図(EGM)信号の測定に基づくものもある。心臓処置によっては、医師はEGM信号を使用して、心周期の間、患者の心臓組織を通る電気活性化の波面の伝播を特徴付ける場合がある。EGM信号のそれぞれについて、医師は、信号が取得された部位を波面が通過した場合に相当する電気的活性化点の識別を試みることができる。
Introduction Some medical procedures are based on the measurement of electrogram (EGM) signals by placing multiple electrodes at different respective sites on the cardiac tissue. In some cardiac procedures, a physician may use the EGM signals to characterize the propagation of a wavefront of electrical activation through the patient's cardiac tissue during the cardiac cycle. For each EGM signal, a physician may attempt to identify the point of electrical activation that corresponds to when the wavefront passes through the site where the signal was obtained.
心房細動(AF)やその他の不整脈の場合、EGM信号の不規則性及び/又は変動性のために、経験豊富な医師であっても、このような活性化点を識別することが困難な場合がある。通常の電位図は、電気的活性化を明確に示す規則的間隔の鋭い一次ピークを通常は含んでいる。対照的に、不規則なEGMは、多種多様な異なる形態を示すこともあり、通常は規則的な電気的活性化を示さない二次ピークの多数のバーストを含むこともある。 In the case of atrial fibrillation (AF) and other arrhythmias, the irregularity and/or variability of the EGM signal can make it difficult for even experienced physicians to identify such activation points. A normal electrogram usually contains sharp, regularly spaced primary peaks that clearly indicate electrical activation. In contrast, an irregular EGM can exhibit a wide variety of different morphologies and can contain multiple bursts of secondary peaks that do not usually indicate regular electrical activation.
以下に記載される本発明の実施形態は、局所及び領域フラグメンテーション指数(FI)を計算し、患者の心臓のマップ上でFIを可視化することにより、AFをマッピングする方法及びシステムを提供する。いくつかの実施形態では、患者心臓内のAFをマッピングするシステムは、プロセッサ及びディスプレイを含む。 Embodiments of the invention described below provide methods and systems for mapping AF by calculating local and regional fragmentation indices (FI) and visualizing the FI on a map of the patient's heart. In some embodiments, a system for mapping AF in a patient's heart includes a processor and a display.
いくつかの実施形態では、プロセッサは、患者の心臓に挿入されたカテーテルから、AFを表し、心臓内の所定の位置で取得されたEGM信号を受信するように構成される。プロセッサは、EGM信号において、本明細書でアノテーションとも呼ばれる2つ又は3つ以上の一次活性化ピークを識別し、隣接するアノテーション間のサイクル長(CL)を計算するように更に構成される。プロセッサは、限定されることはないが、30msより小さい標準偏差を有する120ms(本明細書では短いAFCLと称される)~250ms(本明細書では長いAFCLと称される)のサイクル長などの、規則的な心房細動のサイクル長(atrial fibrillation cycle length、AFCL)を識別するための既定の基準を保持するように更に構成される。 In some embodiments, the processor is configured to receive, from a catheter inserted into the patient's heart, an EGM signal representative of AF and acquired at a predetermined location within the heart. The processor is further configured to identify two or more primary activation peaks, also referred to herein as annotations, in the EGM signal and calculate a cycle length (CL) between adjacent annotations. The processor is further configured to maintain a predefined criterion for identifying a regular atrial fibrillation cycle length (AFCL), such as, but not limited to, a cycle length between 120 ms (referred to herein as short AFCL) and 250 ms (referred to herein as long AFCL) with a standard deviation of less than 30 ms.
いくつかの実施形態では、プロセッサは、AFCL内に関心ウィンドウ(WOI)を定義し、本明細書ではフラグメンテーションピークとも称される1つ又は2つ以上の二次活性化ピークをWOI内で識別するように構成されている。プロセッサは、所定の位置で、WOI当たりのフラグメンテーションピークの平均数を示す局所フラグメンテーション指数(FI)を計算する。 In some embodiments, the processor is configured to define a window of interest (WOI) within the AFCL and identify one or more secondary activation peaks, also referred to herein as fragmentation peaks, within the WOI. The processor calculates a local fragmentation index (FI) at a given location that indicates the average number of fragmentation peaks per WOI.
いくつかの実施形態では、プロセッサは、既定の閾値及び基準に基づいて、2つ又は3つ以上の隣接するフラグメンテーションピークを統合するように構成される。いくつかの実施形態では、EGM信号は、複数のAFCLを含み、プロセッサは、複数のAFCLに基づいて平均AFCLを計算し、平均AFCL当たりのフラグメンテーションピークの平均数を計算するように構成される。いくつかの実施形態では、ディスプレイは、心臓の少なくとも一部のマップ上に計算及び視覚化された局所FIを表示するように構成される。 In some embodiments, the processor is configured to integrate two or more adjacent fragmentation peaks based on predefined thresholds and criteria. In some embodiments, the EGM signal includes a plurality of AFCLs, and the processor is configured to calculate an average AFCL based on the plurality of AFCLs and to calculate an average number of fragmentation peaks per average AFCL. In some embodiments, the display is configured to display the calculated and visualized regional FI on a map of at least a portion of the heart.
いくつかの実施形態では、患者の心臓の領域は所定の位置を含み、この位置は、領域の幾何学的重心(COG)から所定の距離に位置する。領域は、COGから各距離に位置する複数の位置を更に含む。このような実施形態では、プロセッサは、カテーテルを使用して、追加の各位置で追加のEGM信号を取得し、追加の各位置に対して、各追加のFIを計算するように構成される。 In some embodiments, the region of the patient's heart includes a predetermined location, the location being a predetermined distance from a geometric center of gravity (COG) of the region. The region further includes a plurality of locations located at respective distances from the COG. In such embodiments, the processor is configured to acquire additional EGM signals at each additional location using the catheter and calculate a respective additional FI for each additional location.
いくつかの実施形態では、プロセッサは、所定の距離及び追加の距離に基づいて、また局所FI及び追加のFIに基づいて、領域の領域FIを計算するように構成される。プロセッサは、領域FI及びAFCLの可視化をディスプレイに出力するように更に構成されている。ディスプレイは、少なくとも前述の領域を示す心臓のマップ上に計算及び視覚化された領域FIを表示し、領域FI上に重ね合わせた短いAFCL及び長いAFCLを表示するように構成される。このような実施形態では、プロセッサは、心臓マップ上に、短いAFCL及び大きな領域FIを有する領域などの重要な領域を表示するように構成される。 In some embodiments, the processor is configured to calculate an area FI of the region based on the predetermined distance and the additional distance and based on the local FI and the additional FI. The processor is further configured to output a visualization of the area FI and the AFCL to a display. The display is configured to display the calculated and visualized area FI on a map of the heart showing at least said area, and to display the short AFCL and the long AFCL superimposed on the area FI. In such embodiments, the processor is configured to display areas of interest, such as areas with short AFCL and large area FI, on the cardiac map.
開示される技術により、不規則な活性化を有することが疑われる領域の検出及び表示の機能が医師に提供される。医師は、患者の心臓の不整脈を低減するために、1つ又は2つ以上の疑わしい領域を切除することができる。 The disclosed technology provides a physician with the ability to detect and display areas suspected of having irregular activation. The physician can then ablate one or more of the suspicious areas to reduce arrhythmias in the patient's heart.
システムの説明
図1は本発明の一実施形態による、電位図(EGM)信号22をアノテーション付けするシステム21の描写図である。図1に示すように、電気生理学的(electrophysiological、EP)処置の間、医師27はカテーテル29を挿入し、カテーテル29の遠位端31を患者25の心臓23内の所望の位置に誘導する。
SYSTEM DESCRIPTION Figure 1 is a pictorial diagram of a
いくつかの実施形態では、医師27が、心臓23の、本明細書において組織とも呼ばれる内側心外膜面に沿ってカテーテル29の遠位端31を移動させると、心臓の組織と接触している、カテーテル29の遠位端31に配置された1つ又は2つ以上の電極(図示せず)が、組織によって生成されたEGM信号22を感知する。このような信号は、例えば、心臓23で心房細動(AF)又はその他の不整脈が生じている間に感知され得る。なお、場合によっては、不整脈は、処置の一環として医師によって誘発され得る。
In some embodiments, as the
いくつかの実施形態では、図2及び図3で詳しく後述するように、システム21のプロセッサ28は、ソケット又はポートなどの電気的インターフェース35を介して、遠位端31からEGM信号22を受信し、これらのEGM信号を処理する。いくつかの実施形態では、EGM信号の処理に応答して、プロセッサ28は、出力を生成するように構成されており、これには、通常、システム21のディスプレイ26上に表示される視覚的な出力が含まれる。
In some embodiments, as described in more detail below in Figures 2 and 3, the
いくつかの実施形態では、プロセッサ28は、EGM信号22の少なくとも1つのピークをアノテーション付けして、EGM信号の活性化点を示し、またアノテーション付けされた信号をディスプレイ26に表示するように構成されている。信号にアノテーション付けする際、プロセッサ28は、例えば、各興奮点上にマーカ24を配置することができる。本発明の文脈及び特許請求の範囲において、マーカ24によって示されるアノテーション付けされた信号は、本明細書では「一次ピーク」又は「アノテーション付けされた活性化信号」とも称される。
In some embodiments, the
いくつかの実施形態では、遠位端31の電極は、円形、線形、又はマルチスプライン構成などの適切な構成で配置されてもよい。通常、各EGM信号22は両極性信号であってもよく、この場合信号は遠位端31における各電極対の間の電圧を表すことになる。他の実施形態では、取得されたEGM信号のうち少なくとも1つは単極性信号であってもよく、この場合EGM信号は電極の1つと患者25に外部から結合された基準電極との間の電圧を表すことになる。
In some embodiments, the electrodes at the
いくつかの実施形態では、プロセッサ28は、単一の1つのプロセッサ、あるいは協動的にネットワーク化又はクラスタ化されたプロセッサ群を備えていてもよい。いくつかの実施形態では、本明細書に記載されているように、プロセッサ28の機能は、例えば、1つ又は複数の特定用途向け集積回路(Application-Specific Integrated circuits、ASIC)又はフィールドプログラマブルゲートアレイ(Field-Programmable Gate Arrays、FPGA)を使用して、ハードウェア内で単独で実施されてもよい。他の実施形態では、プロセッサ28の機能は、少なくとも部分的にソフトウェア内で実施されてもよい。例えば、いくつかの実施形態では、プロセッサ28は、少なくとも中央演算処理装置(central processing unit、CPU)及びランダムアクセスメモリ(random access memory、RAM)を含むプログラムされたデジタルコンピューティングデバイスを備えていてもよい。いくつかの実施形態では、システム21は、適切な種類の不揮発性メモリデバイスを含んでいてもよい。
In some embodiments,
他の実施形態において、プロセッサ28は汎用プロセッサを含んでいてもよく、これは本明細書で説明される機能を実行するようにソフトウェアでプログラムされている。ソフトウェアは、例えば、ネットワークを介して電子形式でプロセッサにダウンロードされてもよく、又は、ソフトウェアは、代替的に若しくは付加的に、磁気的、光学的、又は電子的メモリなどの非一時的な有形媒体上に提供及び/又は記憶されてもよい。
In other embodiments, the
システム21のこの特定の構成は、本発明の実施形態で対処する特定の問題を説明し、またこのようなシステムの性能の向上においてこれらの実施形態の適用を明示するため、例として示される。しかしながら、本発明の実施形態は、この特定の種類の例示的なシステムに限定されるわけでは決してなく、本明細書に記載される原理は、不整脈をマッピングする他の種類のシステム、及び何れかのヒトの臓器から取得される適切な信号にアノテーション付けする及びそれらを分析する他の種類のシステムに同様に適用され得る。
This particular configuration of
識別された一次及び二次ピークに基づく局所フラグメンテーション指数及びサイクル長の計算
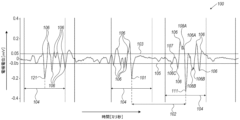
図2は、本発明の一実施形態による、EGM信号100における活性化点の識別を示す概略図である。EGM信号100は、例えば、上記の図1のEGM信号22に置き換えてもよい。
Calculation of Local Fragmentation Index and Cycle Length Based on Identified Primary and Secondary Peaks Figure 2 is a schematic diagram illustrating the identification of activation points in an
いくつかの実施形態では、EGM信号100は、遠位端31の1つ又は2つ以上の電極を使用して心臓23内の所定の位置で取得され、ミリボルト(mV)単位で経時的に測定されるコンプレックス細分化EGM信号を含む。いくつかの実施形態では、プロセッサ28は、信号がまたがる合計期間を連続するより短い期間に分割するように構成され、連続するより短い期間の各々は既定の長さであるか、又は例えば、100ミリ秒(ms)~200msの長さ範囲内にあるか、又は他の適切な期間である。
In some embodiments, the EGM signal 100 includes a complex fragmented EGM signal acquired at a predetermined location within the
いくつかの実施形態では、プロセッサ28は、各期間に対して、期間内の最大振幅の点(又は「ピーク」)を含む一組の候補活性化点を選択するよう構成されているが、但し、図2において上下のノイズ閾値線103及び105によって示されるように、最大振幅は、期間の閾値よりも大きく、また既定のノイズ閾値(例えば0.05mV)よりも大きいことを条件とする。なお、線103はEGM信号100の中心線より0.05mV上に位置し、線105はEGM信号100の中心線より0.05mV下に位置していることに留意されたい。続いて、プロセッサ28は、一組の候補活性化点から、互いに既定の時間間隔(例えば、80ms)内にある活性化点の任意の対のうちの一方を除去するように構成される。次いで、組内に残っている点は、アノテーション付けされた活性化信号、本実施例では一次ピーク101、111、及び121であると仮定される。
In some embodiments, the
いくつかの実施形態では、プロセッサ28は、隣接するアノテーション付けされた活性化信号間の心房細動サイクル長(AFCL)、図2の例では、一次ピーク101と111の間のAFCL102を計算するように構成されている。いくつかの実施形態では、プロセッサ28は、AFに対して規則的であると考えられるAFCLの範囲を定義するのに使用される2つの閾値を保持してもよい。例えば、EGM信号100は、合計期間2500msにわたって取得され、17個の候補一次ピークを有しているので、16個の計算されたAFCL有することができる。各隣接する一次ピークは、120ms(本明細書では短いAFCLと称する)~250ms(本明細書では長いAFCLと称する)の間でAFCLを区切ってもよく、EGM信号100の計算した16個のAFCLに対して30msよりも小さい標準偏差(standard deviation、SD)を有してもよい。
In some embodiments, the
いくつかの実施形態では、プロセッサ28は、計算したAFCLに基づいて平均AFCLを計算し、平均AFCLに対する2つの閾値及びSDに対する閾値を保持するように構成される。上記の実施例によれば、プロセッサ28は、平均AFCLの低い値及び高い値に対してそれぞれ120ms及び250msの閾値を保持し、AFCLのSDに対して30msの追加の閾値を保持してもよい。
In some embodiments,
いくつかの実施形態では、プロセッサ28は、AFCLよりも小さい幅を有し及び/又は幅102の持続時間内にある関心ウィンドウ(WOI)104を定義するように構成されている。図2の実施例では、WOI104の中心は、一次ピーク101、111及び121の各時間と揃っており、AFCL長の時間軸+/-40%に沿って延びている。換言すれば、WOI104は、AFCL102の全長の80%の長さを有する。他の実施形態では、プロセッサ28は、AFCL102に対するWOI104の長さ(又は時間間隔)を定義するため、80%以外の他の適切な閾値を保持してもよい。
In some embodiments, the
いくつかの実施形態では、プロセッサ28は、WOI104内で、本明細書では二次ピークとも称される一組の候補フラグメンテーションピークを識別するように構成されている。プロセッサ28は、既定の閾値及び基準を使用して候補ピークの一部をフィルタリングし、フラグメンテーションピークの最終的な組を取得するように更に構成される。
In some embodiments, the
図2の例では、プロセッサ28は、候補ピーク106、106A、106B、106C、107、108A及び108Bを識別する。一実施形態では、プロセッサ28は、0.05mVノイズ閾値を下回る(すなわち、線103と105との間の)候補ピーク107をフィルタリングして除去する。なお、プロセッサ28はピーク106Cをフィルタリングして除去することはなく、このピークはノイズ閾値よりもわずかに大きい絶対値を有している。一実施形態では、プロセッサ28は、0.05mVより大きい全てのピーク、すなわち線103の上に位置する全てのピークが、ピークの前に経時的に上昇傾向にあり、ピークの後に経時的に下降傾向にあるかどうかをチェックする。同様に、プロセッサ28は、-0.05mVより小さい全てのピーク、すなわち線105より下に位置する全てのピークが、ピークの前に経時的に下降傾向にあり、ピークの後に経時的に上昇傾向にあるかどうかをチェックする。
In the example of FIG. 2, the
いくつかの実施形態では、プロセッサ28は、候補ピークの組から、互いに既定の時間間隔(例えば、20ms)内にあり、同じ符号(正又は負)を有する候補ピークの少なくとも1つの何れかのグループを除去し、除去された1つ又は2つ以上のピークをグループの中から最大のピークにまとめるように構成されている。図2の実施例では、ピーク106A及び108Aは、20msの既定の時間間隔内にあり、ピーク108Aはピーク106Aよりも大きい。したがって、プロセッサ28はピーク106Aを除去し、換言すればピーク106Aをピーク108Aに統合する。同様に、ピーク106B及び108Bは、20msの既定の時間間隔内にあり、ピーク108Bは、ピーク106Bよりも大きい絶対電極電位値を有する。したがって、プロセッサ28はピーク106Bをピーク108Bに統合する。続いて、プロセッサ28は、二次ピークの最終リストを生成し、図2の実施例では、最終リストは上記の閾値及び基準に基づいて選択されたピーク106、106C、108A及び108Bを含んでいる。なお、一次及び二次ピークに対してそれぞれ既定された80ms及び20msの時間間隔、AFCLに対する120ms~250msの既定の時間間隔、及び+/-0.05mVの既定のノイズ閾値は全て、例として提供されていることに留意されたい。他の実施形態では、プロセッサ28は、上記の時間間隔及び/又はノイズ閾値の何れかに対して、他の好適な1つ又は2つ以上の閾値を保持してもよい。
In some embodiments, the
いくつかの実施形態では、プロセッサ28は、心臓23の所定の位置で取得されたEGM信号100に対して、AFCL当たりの二次ピークの平均数を示す局所フラグメンテーション指数(FI)を計算するように構成される。
In some embodiments, the
いくつかの実施形態では、プロセッサ28は、以下によって与えられる等式(1)を用いて局所FIを計算するように構成される。
In some embodiments, the
![]()
SPは、実際のWOI内でカウントされた二次ピークの累積数である。
![]()
SP is the cumulative number of secondary peaks counted within the actual WOI.
PPは、実際のWOI内でカウントされた一次ピークの累積数である。 PP is the cumulative number of primary peaks counted within the actual WOI.
AWOIは、EGM信号100内の全ての実際のWOIの累積実持続時間である。
AWOI is the cumulative actual duration of all actual WOIs in the
NWOIは、EGM信号100内の全ての公称WOIの累積公称持続時間である。
NWOI is the cumulative nominal duration of all nominal WOIs in the
例えば、EGM信号100の合計持続時間は2500msであり、全てのWOI(NWOI)の累積公称持続時間は、合計時間の80%であるため、2000msの値を有する。EGM信号100内の全てのWOI(AWOI)の累積実持続時間は、1984msである。AWOI中、上述した閾値及びフィルタリング基準を適用した後に、一次ピークの数17及び二次ピークの数40が残った。 For example, the total duration of the EGM signal 100 is 2500 ms, and the cumulative nominal duration of all WOIs (NWOIs) is 80% of the total duration, and therefore has a value of 2000 ms. The cumulative actual duration of all WOIs (AWOIs) in the EGM signal 100 is 1984 ms. During the AWOIs, after applying the threshold and filtering criteria described above, the number of primary peaks was 17 and the number of secondary peaks was 40.
この実施例では、プロセッサ28は、式(1)を使用して局所FIを計算し、式(2)に示すように局所FIを出力する。
In this embodiment, the
![]()
![]()
いくつかの実施形態では、プロセッサ28は、心臓23の少なくとも一部のマップ上で、局所FI及び計算した平均AFCLをディスプレイ26に出力するように構成される。なお、局所FIは、2つのアノテーション付けされた活性化信号間のAFCL当たりのフラグメンテーションピークの平均数を示しており、図2には一次ピーク101、111及び121として示されていることに留意されたい。なお、EGM信号100の一部の区間は、ノイズ閾値内の信号、例えば、一次ピーク101及び121のWOI104間の区間を含んでいてもよく、これは線103と105との間に電極電位値を有していることに留意されたい。いくつかの実施形態では、プロセッサ28は、任意の適切な基準及び/又は既定の若しくは学習済みパラメータを使用して、そのような区間をAFCL及び局所FIの計算から除外することができる。
In some embodiments, the
他の実施形態では、プロセッサ28は、WOIを除外し、隣接する一次ピーク間のAFCL全体に沿って二次ピークの候補組を識別するように構成される。このような実施形態では、計算された局所FIは、一次ピークの総数で除算された、識別済みの二次ピークの総数のみを含んでいてもよい。
In other embodiments, the
局所フラグメンテーション指数を計算することによって、心房細動をマッピングする方法
図3は、本発明の一実施形態による、心臓23におけるAFをマッピングする方法を模式的に示すフローチャートである。当該方法は、EGM信号取得ステップ200で開始され、心臓23の組織内の所定の位置に配置された1つ又は2つ以上の電極を有する遠位端31を用いてEGM信号100を取得する。いくつかの実施形態では、プロセッサ28は、AFを示すEGM信号100を受信し、EGM信号100内で、一次ピーク101、111及び121などのアノテーション付けされた活性化信号を識別する。
3 is a flow chart that illustrates a schematic of a method for mapping AF in the
サイクル長計算ステップ202において、プロセッサ28は、隣接する一次ピークの何れかの対の間のAFCLを計算する。いくつかの実施形態では、プロセッサ28は、計算されたAFCLの平均AFCLを計算する。
In the cycle
WOI定義ステップ204では、プロセッサ28は、WOI104などのWOIを定義し、これは通常は計算されたAFCLの一部、例えば、AFCL長の70%又は80%の長さを有している。いくつかの実施形態では、プロセッサ28は、前述の平均AFCL長に基づいてWOIを計算する。他の実施形態では、プロセッサ28は、各区間のAFCL長の既定の部分を使用して、EGM信号100の各区間についてWOIを計算する。更に又はあるいは、プロセッサ28は、2つの各AFCLの間に位置するWOIを定義するための2つの隣接するAFCLの平均長さを計算してもよいし、WOIを定義するための他の適切な方法を使用してもよい。
In the
フラグメンテーションピーク識別ステップ206では、プロセッサ28は、上記の図2に示すピーク106、106A、106B、106C、107、108A及び108Bなどの候補フラグメンテーションピークの組を識別する。いくつかの実施形態では、プロセッサ28は、上記の図2に示すノイズ閾値線103と105との間に位置するノイズ閾値内にあるピーク107など、候補フラグメンテーションピークの少なくとも一部をフィルタリングして除去してもよい。
In fragmentation
フラグメンテーションピーク統合ステップ208では、プロセッサは、互いに既定の時間間隔(例えば、20ms)内にあり、同じ符号(正又は負)を有する2つ又は3つ以上の二次ピークを含むピークのグループを識別する。例えば、ピーク106A及び108Aのグループ、並びにピーク106B及び108Bの別のグループである。いくつかの実施形態では、プロセッサ28は、ピークのグループ内で、最大の絶対電極電位値を有するピークを選択し、二次ピークの組から他のピークを除去してもよい。上記の図2に示すように、ピーク108A及び108Bは、最大の絶対電極電位値を有しているので、各ピーク106A及び106Bが除去されている。
In the fragmentation
局所フラグメンテーション指数(FI)計算ステップ210では、プロセッサは、式(1)を用いて局所FIを計算するが、これは上記の図2に記載されている。プロセッサ28は、上記のステップ206及び208に記載されたフィルタリング及び統合処理後に識別及び検証された一次及び二次ピークの総数、並びに一次及び二次ピークを識別するために使用される総実及び公称WOI持続時間を式(1)に適用する。いくつかの実施形態では、計算された局所FIは、AFCL持続時間当たりの二次ピークの平均数を示す。上記式(2)に示す例では、局所FIの計算値は、2.334に等しく、これは平均AFCL持続時間当たりの二次ピークの平均数を示している。
In a local fragmentation index (FI) calculation step 210, the processor calculates the local FI using equation (1), which is described above in FIG. 2. The
他の実施形態では、プロセッサ28は、局所FIを計算するための任意の他の適切な式を適用することができる。例えば、EGM信号100内で計算された全てのAFCLの中央値を使用する。
In other embodiments, the
マップ表示ステップ212では、プロセッサは、心臓23の少なくとも一部の可視化マップをディスプレイ26に出力するよう構成されており、マップはEGM信号100及び計算されたFIを取得するのに使用される少なくとも所定の点と、1つ又は2つ以上のAFCLとを含んでいる。
In a
いくつかの実施形態では、ディスプレイ26は、プロセッサ28から受信した心臓23のマップ上に局所FIを表示する。いくつかの実施形態では、ディスプレイ26は、カラーコーディング又は任意の他の適切な可視化技術を使用して、局所FIの可視化を表示するように構成されている。例えば、プロセッサ28及び/又はディスプレイ26は、暖色、例えば、赤色を、FIの小さい値に割り当て、冷色、例えば、青色を、FIの大きい値に割り当てることができる。上記の図2に記載されるように、ディスプレイ26はまた、心臓マップ上及び表示された局所FI上に重ねられた1つ又は2つ以上のAFCLを表示してもよい。マップの例示的な実施形態は、以下の図5に示されている。
In some embodiments, the
局所フラグメンテーション指数の計算及び可視化
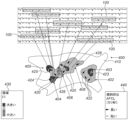
図4は、本発明の一実施形態による、領域フラグメンテーション指数(FI)が複数の局所FIに基づいて計算される、心臓23の領域300の概略描写図である。いくつかの実施形態では、領域300は、領域300のCOG333と呼ばれる、幾何学的重心(COG)から3mm、1mm、2mm、4mm、及び5mmの各距離に位置する点302、304、306、308、及び310を含んでいる。
4 is a schematic depiction of a
いくつかの実施形態では、カテーテル29の遠位端31は、点302、304、306、308及び310のそれぞれからの1つ又は2つ以上のEGM信号を取得し、プロセッサ28は、例えば、上記の図2及び図3で開示された技術を使用して、領域300の点のそれぞれについての局所FIを計算する。図4の例では、点302、304、306及び308の局所FIについて計算された値は、それぞれ10、5、7及び10である。
In some embodiments, the
いくつかの実施形態では、プロセッサ28は、平均化重みを導出するためのCOG333からの各距離を使用して、点302、304、306、308及び310の局所FIの加重平均を計算することによって、領域300の領域FIを計算するように構成されている。所定の点について、各局所FIは、所定の点とCOG333との間の距離の逆値に比例する重み値によって重み付けされる。例えば、COG333から1mmに位置する点304は、COG333から5mmに位置する点310と比較して、より大きな重み(例えば、1)を有しているので、5倍小さい重み(例えば、1/5)を有する。
In some embodiments, the
いくつかの実施形態では、プロセッサ28は加重和を計算し、加重和を重みの和によって正規化することによって加重平均を計算する。上記に提供された例示的な値に基づき、点302、304、306、308及び310の重みはそれぞれ0.33、1、0.5、0.25及び0.2になり、正規化係数は重みの和2.283になる。
In some embodiments,
いくつかの実施形態では、プロセッサ28は、点302、304、306、308及び310について正規化された重みを計算し、0.146、0.438、0.219、0.109及び0.087の各値を出力し、次いで、各点について、各局所FIを各正規化された重みで乗算し、合計する。
In some embodiments, the
上記の例示的な値に基づいて、プロセッサ28は、各点について、点302、304、306、308及び310の局所FIを各正規化された重みで乗算し、重み付き局所FIの各値1.46、2.19、1.53、1.09、及び0.35を出力する。
Based on the above example values,
いくつかの実施形態では、重み付き局所FIの合計を計算した後、プロセッサ28は、6.628の値を有する領域FIを出力する。続いて、プロセッサ28は、計算済みの領域FI及び領域300の計算済みのAFCLをディスプレイ26に出力する。
In some embodiments, after calculating the sum of the weighted local FIs, the
心臓マップ上の局所フラグメンテーション指数及びサイクル長の可視化
図5は、本発明の実施形態による、心臓23の領域410のマップ400の概略描写図である。いくつかの実施形態では、マップ400は、プロセッサ28によって識別され、規則的AF活動のある位置としてディスプレイ26によって表示される位置420を含む。
5 is a schematic, pictorial illustration of a
いくつかの実施形態では、プロセッサ28は、例えば、領域410の各位置420において、遠位端31によって取得された複数のEGM信号100を分析する。図2及び図3において上述したように、プロセッサ28は、一次ピークを識別し、CLを計算し、CL内で、120ms~250msのCL持続時間を有するAFCLを識別する。図2及び図3において更に説明したように、プロセッサ28は、WOIを定義し、各WOI内のフラグメンテーションピークを識別する。識別及び検証されたフラグメンテーションピークに基づいて(既定の閾値及び/又は基準を満たさない候補フラグメンテーションピークをフィルタリングして除去した後に)、プロセッサ28は、図2及び図3で上述したように、各位置420について局所FIを計算した。
In some embodiments, the
続いて、プロセッサ28は、上記の図4において説明した技術を使用して、領域410の各部分について領域FIを計算し、計算済みのAFCL及び/又は1つ又は2つ以上の領域FIを含む視覚マップをディスプレイ26に出力する。いくつかの実施形態では、ディスプレイ26は、カラーコーディングを使用したグラデーションマップなど、任意の適切な種類のディスプレイを使用して出力マップを表示するように構成されている。
図5の実施例では、ディスプレイ26に表示される領域410のマップ400は、各輪郭402、403、404、405、406、408を有する複数の部分から構成されており、各輪郭は計算済みの領域FIを有する。いくつかの実施形態では、マップ400は、凡例430を含んでおり、これにより可視化された地域FI値に対して任意の適切な種類のコード化を行うことができる。例えば、輪郭403、404及び405は、領域FIの「大きい」値を有し、輪郭402及び408は領域FIの中央値を有し、輪郭406は、領域FIの「小さい」値を有する。本例では、用語「局所FIの大きい値」は、3~7の標準的な値を指し、用語「局所FIの小さい値」は、7より小さい標準的な値を指す。
In the example of FIG. 5, the
いくつかの実施形態では、マップ400は、AFCLマーカ422、423、424、425、426及び428を更に含んでおり、これらは各輪郭402、403、404、405、406及び408によって表される部分において、(例えば、上記の図2に記載の技術を使用して)プロセッサ28によって計算される。一実施形態では、マップ400は、平均AFCLマーカの可視化された値に対して別の一連のコード化を行う汎例440を含んでいる。この例示的な実施形態では、120msは「短い」AFCL値を表し、250msは「長い」AFCL値を表す。
In some embodiments, the
いくつかの実施形態では、局所FIは、規則的AFCL当たりのフラグメンテーションピーク(本明細書では二次ピークとも呼ばれる)の平均数を示す。更に、短い規則的AFCLは、2つのアノテーション付けされた活性化信号(本明細書では一次ピークとも呼ばれる)間の短い持続時間を示す。場合によっては、例えば輪郭403及びAFCLマーカ423にそれぞれ示されるように、領域FIの大きな値と1つ又は2つ以上の短い規則的AFCLとの組み合わせは、領域410においてAF活性の高い部分を示すことがある。
In some embodiments, the local FI indicates the average number of fragmentation peaks (also referred to herein as secondary peaks) per regular AFCL. Furthermore, a short regular AFCL indicates a short duration between two annotated activation signals (also referred to herein as primary peaks). In some cases, a combination of a large value of the regional FI and one or more short regular AFCLs may indicate a high portion of AF activity in the
いくつかの実施形態では、プロセッサ28は、例えば、上記の図1に示されるEP処置の間に医師27の注意を引くように、ディスプレイ26上で、例えば、高い領域FIと短い規則的AFCLとの目立った組み合わせを強調表示することができる。このような実施形態では、プロセッサ28は、心臓23の特定の部分又は領域で識別されたあらゆる目立つAF活動を警告するように、領域FI及び規則的AFCL、並びにそれらの組み合わせに対する閾値の任意の組を保持してもよい。
In some embodiments, the
代わりとなる実施形態では、プロセッサ28は、他の適切な種類のマーカを追加してマップ400上で可視してもよいし、図5のマップ400上に示されたAFCL又は領域FIのうちの少なくとも1つを減らしてもよい。
In alternative embodiments, the
マップ400のこの特定の構成は、本発明の実施形態によって対処される特定の問題を説明し、システム21のような不整脈を分析するシステムの性能の向上においてこれらの実施形態の適用を実証するために、例として示されている。しかしながら、本発明の実施形態は、この特定の種類の例示的なマッピング及び可視化構成に限定されるものではなく、本明細書に記載される原理は、何れかの医療システムの他の種類の可視化に同様に適用することができる。
This particular configuration of
本明細書に記載された実施形態は、主に不整脈、特に心房細動に対処するが、本明細書に記載された方法及びシステムは、持続性心房細動、又はヒトの心臓における任意の他の種類の不整脈など、他の用途でも使用することができる。 Although the embodiments described herein primarily address arrhythmias, and in particular atrial fibrillation, the methods and systems described herein may also be used in other applications, such as persistent atrial fibrillation, or any other type of arrhythmia in the human heart.
したがって、上記に述べた実施形態は、例として挙げたものであり、本発明は、上記に具体的に示し説明したものに限定されないことが理解されよう。むしろ本発明の範囲は、上述の様々な特徴の組み合わせ及びその部分的組み合わせの両方、並びに上述の説明を読むことで当業者には想到されるであろう、従来技術において開示されていないそれらの変形例及び修正例を含むものである。参照により本特許出願に援用される文献は、これらの援用文献において、いずれかの用語が本明細書において明示的又は暗示的になされた定義と矛盾して定義されている場合には、本明細書における定義のみを考慮するものとする点を除き、本出願の一部と見なすものとする。 It will therefore be understood that the above-described embodiments are given by way of example, and that the present invention is not limited to what has been specifically shown and described above. Rather, the scope of the present invention includes both combinations and subcombinations of the various features described above, as well as variations and modifications thereof not disclosed in the prior art that would occur to one skilled in the art upon reading the above description. Documents incorporated by reference into this patent application are to be considered as part of this application, except that if any term is defined in such incorporated document in a manner that is inconsistent with the definition expressly or impliedly given herein, then only the definition in this specification shall be considered.
〔実施の態様〕
(1) 心臓の心房細動(AF)をマッピングする方法であって、
前記心臓内の所定の位置で取得された、前記AFを示す電位図(EGM)信号を受信することと、
前記EGM信号において、2つ又は3つ以上の一次ピークを識別し、隣接する一次ピーク間のサイクル長(CL)を計算することと、
前記EGM信号において、前記CL内の1つ又は2つ以上の二次ピークを識別することと、
CL当たりの前記二次ピークの数を示す局所フラグメンテーション指数(local fragmentation index)(FI)を計算することと、
前記心臓の少なくとも一部のマップ上で前記局所FIを可視化することと、を含む方法。
(2) 前記心臓が、領域を有し、前記領域が、(i)前記領域の既定の場所から所定の距離に位置する前記所定の位置と、(ii)追加のFIを有し、かつ前記既定の場所から追加の距離に位置する少なくとも追加の位置と、を含み、前記所定の距離及び前記追加の距離に基づいて、また前記局所FI及び前記追加のFIに基づいて、前記領域の領域FIを計算及び可視化することを含む、実施態様1に記載の方法。
(3) 前記既定の場所が、前記領域の幾何学的重心(COG)を含み、前記領域FIを計算及び可視化することが、前記所定の距離及び前記追加の距離に基づいて、少なくとも前記局所FI及び前記追加のFIの加重平均を計算することを含む、実施態様2に記載の方法。
(4) 前記1つ又は2つ以上の二次ピークを識別することが、既定の閾値に基づいて、2つ又は3つ以上の隣接する二次ピークを統合することを含む、実施態様1に記載の方法。
(5) 前記CL内に関心ウィンドウ(WOI)を定義することと、前記WOI内の前記1つ又は2つ以上の二次ピークを識別することと、を含む、実施態様1に記載の方法。
[Embodiment]
(1) A method for mapping atrial fibrillation (AF) of a heart, comprising:
receiving an electrogram (EGM) signal acquired at a predetermined location within the heart, the electrogram (EGM) signal being indicative of the AF;
identifying two or more primary peaks in the EGM signal and calculating a cycle length (CL) between adjacent primary peaks;
identifying, in the EGM signal, one or more secondary peaks within the CL;
Calculating a local fragmentation index (FI) indicative of the number of said secondary peaks per CL;
and visualizing the regional FI on a map of at least a portion of the heart.
(2) The method of
3. The method of
4. The method of
5. The method of
(6) 前記EGM信号が複数のCLを含み、前記局所FIを計算することが、前記複数のCLに基づいて平均CLを計算することと、前記平均CL当たりの前記二次ピークの平均数を計算することと、を含む、実施態様1に記載の方法。
(7) 心臓の心房細動(AF)をマッピングするシステムであって、
(a)前記心臓内の所定の位置で取得された、前記AFを示す電位図(EGM)信号を受信し、(b)前記EGM信号において、2つ又は3つ以上の一次ピークを識別し、隣接する一次ピーク間のサイクル長(CL)を計算し、(c)前記EGM信号において、前記CLの持続時間内の1つ又は2つ以上の二次ピークを識別し、(d)CL当たりの前記二次ピークの数を示す局所フラグメンテーション指数(FI)を計算する、ように構成されたプロセッサと、
前記心臓の少なくとも一部のマップ上に前記局所FIを表示するように構成されたディスプレイと、を含む、システム。
(8) 前記心臓が、領域を有し、前記領域が、(i)前記領域の既定の場所から所定の距離に位置する前記所定の位置と、(ii)追加のFIを有し、かつ前記既定の場所から追加の距離に位置する少なくとも追加の位置と、を含み、前記プロセッサが、前記所定の距離及び前記追加の距離に基づいて、かつ前記局所FI及び前記追加のFIに基づいて、前記領域の領域FIを計算及び可視化するように構成されている、実施態様7に記載のシステム。
(9) 前記既定の場所が、前記領域の幾何学的重心(COG)を含み、前記プロセッサが、前記所定の距離及び前記追加の距離に基づいて少なくとも前記局所FI及び前記追加のFIの加重平均を計算することによって、前記領域FIを計算及び可視化するように構成されている、実施態様8に記載のシステム。
(10) 前記プロセッサが、既定の閾値に基づいて、2つ又は3つ以上の隣接する二次ピークを統合するように構成されている、実施態様7に記載のシステム。
6. The method of
(7) A system for mapping atrial fibrillation (AF) of a heart, comprising:
a processor configured to: (a) receive an electrogram (EGM) signal indicative of the AF acquired at a predetermined location within the heart; (b) identify two or more primary peaks in the EGM signal and calculate a cycle length (CL) between adjacent primary peaks; (c) identify one or more secondary peaks in the EGM signal within a duration of the CL; and (d) calculate a local fragmentation index (FI) indicative of the number of the secondary peaks per CL;
a display configured to display the regional FI on a map of at least a portion of the heart.
(8) The system of claim 7, wherein the heart has a region, the region including (i) the predetermined location located at a predetermined distance from a predetermined location of the region, and (ii) at least an additional location having an additional FI and located at the additional distance from the predetermined location, and wherein the processor is configured to calculate and visualize a regional FI of the region based on the predetermined distance and the additional distance, and based on the local FI and the additional FI.
9. The system of claim 8, wherein the predetermined location includes a geometric center of gravity (COG) of the region, and the processor is configured to calculate and visualize the region FI by calculating a weighted average of at least the local FI and the additional FI based on the predetermined distance and the additional distance.
10. The system of claim 7, wherein the processor is configured to integrate two or more adjacent secondary peaks based on a predetermined threshold.
(11) 前記プロセッサが、前記CLの持続時間内に関心ウィンドウ(WOI)を定義し、前記WOI内の前記1つ又は2つ以上の二次ピークを識別するように構成されている、実施態様7に記載のシステム。
(12) 前記EGM信号が複数のCLを含み、前記プロセッサが、前記複数のCLに基づいて平均CLを計算し、前記平均CL当たりの前記二次ピークの平均数を計算するように構成されている、実施態様7に記載のシステム。
11. The system of claim 7, wherein the processor is configured to define a window of interest (WOI) within a duration of the CL and identify the one or more secondary peaks within the WOI.
12. The system of claim 7, wherein the EGM signal includes a plurality of CLs, and the processor is configured to calculate an average CL based on the plurality of CLs, and to calculate an average number of the secondary peaks per average CL.
Claims (12)
前記プロセッサが、前記心臓内の所定の位置で取得された、前記AFを示す電位図(EGM)信号を受信することと、
前記プロセッサが、前記EGM信号において、2つ又は3つ以上の一次ピークを識別し、前記プロセッサが、隣接する一次ピーク間のサイクル長(CL)を計算することと、
前記プロセッサが、前記EGM信号において、前記CL内においてノイズ閾値よりも大きい絶対値を有する1つ又は2つ以上の二次ピークを識別することと、
前記プロセッサが、前記隣接する一次ピーク間のCL当たりの前記二次ピークの平均数を示す局所フラグメンテーション指数(FI)を計算することと、
前記プロセッサが、前記心臓の少なくとも一部のマップ上で前記局所FIを可視化することと、を含むシステムの作動方法。 1. A method of operating a system for mapping atrial fibrillation (AF) of a heart, comprising :
receiving , by the processor, an electrogram (EGM) signal acquired at a predetermined location within the heart, indicative of the AF;
the processor identifying two or more primary peaks in the EGM signal, the processor calculating a cycle length (CL) between adjacent primary peaks;
the processor identifying in the EGM signal one or more secondary peaks having an absolute value within the CL greater than a noise threshold ;
the processor calculating a local fragmentation index (FI) indicative of the average number of the secondary peaks per CL between the adjacent primary peaks ;
The method of operating the system includes the processor visualizing the regional FI on a map of at least a portion of the heart.
(a)前記心臓内の所定の位置で取得された、前記AFを示す電位図(EGM)信号を受信し、(b)前記EGM信号において、2つ又は3つ以上の一次ピークを識別し、隣接する一次ピーク間のサイクル長(CL)を計算し、(c)前記EGM信号において、前記CLの持続時間内においてノイズ閾値よりも大きい絶対値を有する1つ又は2つ以上の二次ピークを識別し、(d)前記隣接する一次ピーク間のCL当たりの前記二次ピークの平均数を示す局所フラグメンテーション指数(FI)を計算する、ように構成されたプロセッサと、
前記心臓の少なくとも一部のマップ上に前記局所FIを表示するように構成されたディスプレイと、を含む、システム。 1. A system for mapping atrial fibrillation (AF) of a heart, comprising:
a processor configured to: (a) receive an electrogram (EGM) signal indicative of the AF acquired at a predetermined location within the heart; (b) identify two or more primary peaks in the EGM signal and calculate a cycle length (CL) between adjacent primary peaks; (c) identify one or more secondary peaks in the EGM signal having an absolute value greater than a noise threshold within a duration of the CL; and (d) calculate a local fragmentation index (FI) indicative of the average number of the secondary peaks per CL between adjacent primary peaks ;
a display configured to display the regional FI on a map of at least a portion of the heart.
Applications Claiming Priority (2)
| Application Number | Priority Date | Filing Date | Title |
|---|---|---|---|
| US16/512,588 | 2019-07-16 | ||
| US16/512,588 US10905349B1 (en) | 2019-07-16 | 2019-07-16 | Mapping atrial fibrillation using fragmentation index |
Publications (2)
| Publication Number | Publication Date |
|---|---|
| JP2021016788A JP2021016788A (en) | 2021-02-15 |
| JP7588976B2 true JP7588976B2 (en) | 2024-11-25 |
Family
ID=71620241
Family Applications (1)
| Application Number | Title | Priority Date | Filing Date |
|---|---|---|---|
| JP2020121139A Active JP7588976B2 (en) | 2019-07-16 | 2020-07-15 | Mapping atrial fibrillation using fragmentation index |
Country Status (5)
| Country | Link |
|---|---|
| US (1) | US10905349B1 (en) |
| EP (1) | EP3766416B1 (en) |
| JP (1) | JP7588976B2 (en) |
| CN (1) | CN112315486B (en) |
| IL (1) | IL275666B2 (en) |
Families Citing this family (1)
| Publication number | Priority date | Publication date | Assignee | Title |
|---|---|---|---|---|
| EP4473910A1 (en) * | 2023-06-06 | 2024-12-11 | CathVision ApS | Method for analyzing an electrogram |
Citations (4)
| Publication number | Priority date | Publication date | Assignee | Title |
|---|---|---|---|---|
| JP2009537252A (en) | 2006-05-17 | 2009-10-29 | セント・ジュード・メディカル・エイトリアル・フィブリレーション・ディヴィジョン・インコーポレーテッド | System and method for mapping complex fragmented electrical activity diagram information |
| US20150080752A1 (en) | 2013-09-16 | 2015-03-19 | Biotronik Se & Co. Kg | Device for automatic mapping of complex fractionated atrial electrogram |
| JP2015171548A (en) | 2008-11-10 | 2015-10-01 | カーディオインサイト テクノロジーズ インコーポレイテッド | Visualization of electrophysiology data |
| JP2018149271A (en) | 2017-01-25 | 2018-09-27 | バイオセンス・ウエブスター・(イスラエル)・リミテッドBiosense Webster (Israel), Ltd. | Methods and systems for eliminating various heart diseases by analyzing intracardiac signals, providing detailed maps, and determining potential ablation points |
Family Cites Families (16)
| Publication number | Priority date | Publication date | Assignee | Title |
|---|---|---|---|---|
| US20050288599A1 (en) * | 2004-05-17 | 2005-12-29 | C.R. Bard, Inc. | High density atrial fibrillation cycle length (AFCL) detection and mapping system |
| US7792584B2 (en) * | 2006-04-25 | 2010-09-07 | Medtronic, Inc. | System and method for characterization of atrial wall using digital signal processing |
| US8359092B2 (en) | 2007-11-29 | 2013-01-22 | Biosense Webster, Inc. | Determining locations of ganglia and plexi in the heart using complex fractionated atrial electrogram |
| WO2012047563A1 (en) | 2010-09-27 | 2012-04-12 | Bailin Steven J | Method for determining the location of regions in tissue relevant to electrical propagation |
| US8626278B2 (en) * | 2010-10-08 | 2014-01-07 | Euljoon Park | Method and system for discriminating and monitoring atrial arrhythmia based on cardiogenic impedance |
| WO2012139116A2 (en) * | 2011-04-07 | 2012-10-11 | The Johns Hopkins University | Non-invasive methods and systems for producing cardiac electrogram characteristic maps for use with catheter ablation of ventricular tachycardia |
| US9314205B2 (en) * | 2011-04-28 | 2016-04-19 | Medtronic, Inc. | Measurement of cardiac cycle length and pressure metrics from pulmonary arterial pressure |
| WO2014115151A1 (en) | 2013-01-24 | 2014-07-31 | Tylerton International Holdings Inc. | Body structure imaging |
| US9554718B2 (en) * | 2014-01-29 | 2017-01-31 | Biosense Webster (Israel) Ltd. | Double bipolar configuration for atrial fibrillation annotation |
| ES2975607T3 (en) * | 2014-03-31 | 2024-07-10 | Univ Health Network | Focal source identification procedure |
| US10154794B2 (en) * | 2014-04-25 | 2018-12-18 | Medtronic, Inc. | Implantable cardioverter-defibrillator (ICD) tachyarrhythmia detection modifications responsive to detected pacing |
| EP3166483B1 (en) * | 2014-10-15 | 2018-08-01 | St. Jude Medical, Cardiology Division, Inc. | Method and system for generating integrated substrate maps for cardiac arrhythmias |
| FR3030217B1 (en) | 2014-12-23 | 2021-09-03 | Clement Bars | HIGH DENSITY REGIONAL MAPPING OF ATRIAL FIBRILLATION SUBSTRATE |
| EP3451918B1 (en) * | 2016-05-03 | 2020-09-23 | CardioInsight Technologies, Inc. | Detection and analysis of electrograms |
| US10744334B2 (en) * | 2016-10-18 | 2020-08-18 | Cardiac Pacemakers, Inc. | Systems and methods for arrhythmia detection |
| US10888379B2 (en) * | 2017-01-25 | 2021-01-12 | Biosense Webster (Israel) Ltd. | Analyzing and mapping ECG signals and determining ablation points to eliminate brugada syndrome |
-
2019
- 2019-07-16 US US16/512,588 patent/US10905349B1/en active Active
-
2020
- 2020-06-25 IL IL275666A patent/IL275666B2/en unknown
- 2020-07-15 EP EP20185867.7A patent/EP3766416B1/en active Active
- 2020-07-15 JP JP2020121139A patent/JP7588976B2/en active Active
- 2020-07-16 CN CN202010688951.8A patent/CN112315486B/en active Active
Patent Citations (4)
| Publication number | Priority date | Publication date | Assignee | Title |
|---|---|---|---|---|
| JP2009537252A (en) | 2006-05-17 | 2009-10-29 | セント・ジュード・メディカル・エイトリアル・フィブリレーション・ディヴィジョン・インコーポレーテッド | System and method for mapping complex fragmented electrical activity diagram information |
| JP2015171548A (en) | 2008-11-10 | 2015-10-01 | カーディオインサイト テクノロジーズ インコーポレイテッド | Visualization of electrophysiology data |
| US20150080752A1 (en) | 2013-09-16 | 2015-03-19 | Biotronik Se & Co. Kg | Device for automatic mapping of complex fractionated atrial electrogram |
| JP2018149271A (en) | 2017-01-25 | 2018-09-27 | バイオセンス・ウエブスター・(イスラエル)・リミテッドBiosense Webster (Israel), Ltd. | Methods and systems for eliminating various heart diseases by analyzing intracardiac signals, providing detailed maps, and determining potential ablation points |
Also Published As
| Publication number | Publication date |
|---|---|
| US10905349B1 (en) | 2021-02-02 |
| EP3766416C0 (en) | 2025-04-02 |
| JP2021016788A (en) | 2021-02-15 |
| EP3766416A1 (en) | 2021-01-20 |
| IL275666B2 (en) | 2023-07-01 |
| US20210015383A1 (en) | 2021-01-21 |
| IL275666A (en) | 2021-01-31 |
| CN112315486A (en) | 2021-02-05 |
| IL275666B1 (en) | 2023-03-01 |
| EP3766416B1 (en) | 2025-04-02 |
| CN112315486B (en) | 2026-01-13 |
Similar Documents
| Publication | Publication Date | Title |
|---|---|---|
| JP7109881B2 (en) | Detect local sources in regions of interest | |
| US10004413B2 (en) | Signal analysis related to treatment sites | |
| US10117594B2 (en) | Analysis and detection for arrhythmia drivers | |
| CN106963481B (en) | Identifying focal sources during atrial fibrillation | |
| CN108269609B (en) | Distance visualization on electroanatomical maps | |
| EP2945531A2 (en) | Focal point identification and mapping | |
| CN112057039A (en) | Visually distinguish primary and secondary activations on electrophysiological maps | |
| EP4026497A1 (en) | Incorporating a confidence level into an electrophysiological (ep) map | |
| JP7588976B2 (en) | Mapping atrial fibrillation using fragmentation index | |
| KR20190133114A (en) | Identifying activations in an atrial fibrillation electrogram | |
| EP3614913B1 (en) | Connectivity analysis for arrhythmia drivers | |
| JP7135071B2 (en) | Three-dimensional image segmentation method for generating a model of the myocardial wall for the detection of at least one unique compartment of the electrical circulation | |
| EP4079217A1 (en) | Improved electrophysiological (ep) map coloration by considering outliers | |
| JP2021094381A (en) | Detection of ventricular activity using unipolar and bipolar signals |
Legal Events
| Date | Code | Title | Description |
|---|---|---|---|
| A621 | Written request for application examination |
Free format text: JAPANESE INTERMEDIATE CODE: A621 Effective date: 20230714 |
|
| A131 | Notification of reasons for refusal |
Free format text: JAPANESE INTERMEDIATE CODE: A131 Effective date: 20240326 |
|
| A977 | Report on retrieval |
Free format text: JAPANESE INTERMEDIATE CODE: A971007 Effective date: 20240329 |
|
| A601 | Written request for extension of time |
Free format text: JAPANESE INTERMEDIATE CODE: A601 Effective date: 20240626 |
|
| A601 | Written request for extension of time |
Free format text: JAPANESE INTERMEDIATE CODE: A601 Effective date: 20240826 |
|
| A521 | Request for written amendment filed |
Free format text: JAPANESE INTERMEDIATE CODE: A523 Effective date: 20240926 |
|
| TRDD | Decision of grant or rejection written | ||
| A01 | Written decision to grant a patent or to grant a registration (utility model) |
Free format text: JAPANESE INTERMEDIATE CODE: A01 Effective date: 20241015 |
|
| A61 | First payment of annual fees (during grant procedure) |
Free format text: JAPANESE INTERMEDIATE CODE: A61 Effective date: 20241113 |
|
| R150 | Certificate of patent or registration of utility model |
Ref document number: 7588976 Country of ref document: JP Free format text: JAPANESE INTERMEDIATE CODE: R150 |