JP7586856B2 - Electron spectrometer and analysis method - Google Patents
Electron spectrometer and analysis method Download PDFInfo
- Publication number
- JP7586856B2 JP7586856B2 JP2022097319A JP2022097319A JP7586856B2 JP 7586856 B2 JP7586856 B2 JP 7586856B2 JP 2022097319 A JP2022097319 A JP 2022097319A JP 2022097319 A JP2022097319 A JP 2022097319A JP 7586856 B2 JP7586856 B2 JP 7586856B2
- Authority
- JP
- Japan
- Prior art keywords
- energy
- measurement
- spectrometer
- spectra
- electron
- Prior art date
- Legal status (The legal status is an assumption and is not a legal conclusion. Google has not performed a legal analysis and makes no representation as to the accuracy of the status listed.)
- Active
Links
Images


Classifications
-
- H—ELECTRICITY
- H01—ELECTRIC ELEMENTS
- H01J—ELECTRIC DISCHARGE TUBES OR DISCHARGE LAMPS
- H01J49/00—Particle spectrometers or separator tubes
- H01J49/44—Energy spectrometers, e.g. alpha-, beta-spectrometers
- H01J49/46—Static spectrometers
- H01J49/48—Static spectrometers using electrostatic analysers, e.g. cylindrical sector, Wien filter
- H01J49/484—Static spectrometers using electrostatic analysers, e.g. cylindrical sector, Wien filter with spherical mirrors
-
- H—ELECTRICITY
- H01—ELECTRIC ELEMENTS
- H01J—ELECTRIC DISCHARGE TUBES OR DISCHARGE LAMPS
- H01J37/00—Discharge tubes with provision for introducing objects or material to be exposed to the discharge, e.g. for the purpose of examination or processing thereof
- H01J37/02—Details
- H01J37/244—Detectors; Associated components or circuits therefor
-
- G—PHYSICS
- G01—MEASURING; TESTING
- G01N—INVESTIGATING OR ANALYSING MATERIALS BY DETERMINING THEIR CHEMICAL OR PHYSICAL PROPERTIES
- G01N23/00—Investigating or analysing materials by the use of wave or particle radiation, e.g. X-rays or neutrons, not covered by groups G01N3/00 – G01N17/00, G01N21/00 or G01N22/00
- G01N23/22—Investigating or analysing materials by the use of wave or particle radiation, e.g. X-rays or neutrons, not covered by groups G01N3/00 – G01N17/00, G01N21/00 or G01N22/00 by measuring secondary emission from the material
- G01N23/227—Measuring photoelectric effect, e.g. photoelectron emission microscopy [PEEM]
- G01N23/2273—Measuring photoelectron spectrum, e.g. electron spectroscopy for chemical analysis [ESCA] or X-ray photoelectron spectroscopy [XPS]
-
- G—PHYSICS
- G01—MEASURING; TESTING
- G01N—INVESTIGATING OR ANALYSING MATERIALS BY DETERMINING THEIR CHEMICAL OR PHYSICAL PROPERTIES
- G01N23/00—Investigating or analysing materials by the use of wave or particle radiation, e.g. X-rays or neutrons, not covered by groups G01N3/00 – G01N17/00, G01N21/00 or G01N22/00
- G01N23/22—Investigating or analysing materials by the use of wave or particle radiation, e.g. X-rays or neutrons, not covered by groups G01N3/00 – G01N17/00, G01N21/00 or G01N22/00 by measuring secondary emission from the material
- G01N23/227—Measuring photoelectric effect, e.g. photoelectron emission microscopy [PEEM]
- G01N23/2276—Measuring photoelectric effect, e.g. photoelectron emission microscopy [PEEM] using the Auger effect, e.g. Auger electron spectroscopy [AES]
-
- H—ELECTRICITY
- H01—ELECTRIC ELEMENTS
- H01J—ELECTRIC DISCHARGE TUBES OR DISCHARGE LAMPS
- H01J37/00—Discharge tubes with provision for introducing objects or material to be exposed to the discharge, e.g. for the purpose of examination or processing thereof
- H01J37/02—Details
- H01J37/04—Arrangements of electrodes and associated parts for generating or controlling the discharge, e.g. electron-optical arrangement or ion-optical arrangement
- H01J37/05—Electron or ion-optical arrangements for separating electrons or ions according to their energy or mass
-
- H—ELECTRICITY
- H01—ELECTRIC ELEMENTS
- H01J—ELECTRIC DISCHARGE TUBES OR DISCHARGE LAMPS
- H01J37/00—Discharge tubes with provision for introducing objects or material to be exposed to the discharge, e.g. for the purpose of examination or processing thereof
- H01J37/26—Electron or ion microscopes; Electron or ion diffraction tubes
- H01J37/28—Electron or ion microscopes; Electron or ion diffraction tubes with scanning beams
-
- H—ELECTRICITY
- H01—ELECTRIC ELEMENTS
- H01J—ELECTRIC DISCHARGE TUBES OR DISCHARGE LAMPS
- H01J49/00—Particle spectrometers or separator tubes
- H01J49/0027—Methods for using particle spectrometers
-
- H—ELECTRICITY
- H01—ELECTRIC ELEMENTS
- H01J—ELECTRIC DISCHARGE TUBES OR DISCHARGE LAMPS
- H01J49/00—Particle spectrometers or separator tubes
- H01J49/02—Details
- H01J49/025—Detectors specially adapted to particle spectrometers
-
- H—ELECTRICITY
- H01—ELECTRIC ELEMENTS
- H01J—ELECTRIC DISCHARGE TUBES OR DISCHARGE LAMPS
- H01J2237/00—Discharge tubes exposing object to beam, e.g. for analysis treatment, etching, imaging
- H01J2237/244—Detection characterized by the detecting means
- H01J2237/24485—Energy spectrometers
-
- H—ELECTRICITY
- H01—ELECTRIC ELEMENTS
- H01J—ELECTRIC DISCHARGE TUBES OR DISCHARGE LAMPS
- H01J2237/00—Discharge tubes exposing object to beam, e.g. for analysis treatment, etching, imaging
- H01J2237/25—Tubes for localised analysis using electron or ion beams
- H01J2237/2505—Tubes for localised analysis using electron or ion beams characterised by their application
- H01J2237/2511—Auger spectrometers
Landscapes
- Chemical & Material Sciences (AREA)
- Analytical Chemistry (AREA)
- Physics & Mathematics (AREA)
- Spectroscopy & Molecular Physics (AREA)
- Health & Medical Sciences (AREA)
- Life Sciences & Earth Sciences (AREA)
- Biochemistry (AREA)
- General Health & Medical Sciences (AREA)
- General Physics & Mathematics (AREA)
- Immunology (AREA)
- Pathology (AREA)
- Analysing Materials By The Use Of Radiation (AREA)
Description
本発明は、電子分光装置および分析方法に関する。 The present invention relates to an electron spectrometer and an analysis method.
X線光電子分光装置やオージェ電子分光装置などの電子分光装置では、分光器で電子をエネルギー分光することによって、特定のエネルギーを持つ電子のみを検出することができる。測定エネルギーの選択は、分光器が備える電子レンズを制御することによって行われる。測定エネルギーを掃引させながら測定を繰り返すことで、エネルギースペクトルを収集できる。 Electron spectroscopy instruments, such as X-ray photoelectron spectroscopy instruments and Auger electron spectroscopy instruments, can detect only electrons with a specific energy by separating electrons into energy groups using a spectrometer. The measurement energy is selected by controlling the electron lens equipped in the spectrometer. An energy spectrum can be collected by repeating measurements while sweeping the measurement energy.
電子分光装置に搭載される検出器として、特許文献1には、分光器でエネルギー分光された電子のエネルギー分散方向に複数のチャンネルトロンが配列された検出器が開示されている。このような電子分光装置では、一般的に、スペクトルを収集する場合、分光器で分光された電子を、特定の1つのチャンネルトロンで検出する。
As a detector to be mounted on an electron spectrometer,
上記のように、特定の1つのチャンネルトロンで電子を検出する場合、スペクトルを収集するためには、測定エネルギーを掃引させながら繰り返し何度も測定を行わなければならないため、スペクトルの収集に時間がかかってしまう。 As mentioned above, when detecting electrons with one particular channeltron, in order to collect a spectrum, measurements must be taken repeatedly while sweeping the measurement energy, which takes a long time to collect the spectrum.
本発明に係る電子分光装置の一態様は、
試料から放出された電子をエネルギー分光する分光器と、
前記分光器でエネルギー分光された電子のエネルギー分散方向に並んで配置された複数の検出部を備えた検出器と、
処理部と、
を含み、
前記処理部は、
前記分光器において第1エネルギーステップでエネルギーを掃引し、前記分光器でエネルギー分光された電子を前記複数の検出部で検出して得られた、複数の第1スペクトルを取得する処理と、
前記複数の第1スペクトルの各々において、測定点を補完する処理と、
測定点が補完された前記複数の第1スペクトルを積算または平均して、前記第1エネルギーステップよりも小さい第2エネルギーステップの第2スペクトルを生成する処理と、
を行い、
前記処理部は、前記分光器において前記第1エネルギーステップでエネルギーを掃引して、前記検出部ごとに前記第1エネルギーステップの前記第1スペクトルを取得し、
前記処理部は、前記複数の第1スペクトルの各々の測定エネルギーが一致しないように、前記第1エネルギーステップを設定する。
One aspect of the electron spectroscopy apparatus according to the present invention is
a spectrometer for energy-spectroscopically analyzing electrons emitted from the sample;
a detector including a plurality of detection units arranged side by side in an energy dispersion direction of the electrons energy-split by the spectrometer;
A processing section;
Including,
The processing unit includes:
a process of acquiring a plurality of first spectra obtained by sweeping energy in a first energy step in the spectrometer and detecting the electrons energy-spectroscopically separated by the spectrometer with the plurality of detection units;
A process of complementing a measurement point in each of the plurality of first spectra;
a process of integrating or averaging the plurality of first spectra with the interpolated measurement points to generate a second spectrum having a second energy step smaller than the first energy step;
Do the following:
the processing unit sweeps the energy in the spectrometer at the first energy step to obtain the first spectrum at the first energy step for each of the detection units;
The processing unit sets the first energy step such that the measured energies of the plurality of first spectra do not coincide with each other .
このような電子分光装置では、例えば特定の1つの検出部で電子を検出する場合と比べて、測定回数を低減できる。したがって、このような電子分光装置では、スペクトルを収集するための測定時間を短くできる。 In such an electron spectrometer, the number of measurements can be reduced compared to, for example, a case where electrons are detected using one specific detection unit. Therefore, in such an electron spectrometer, the measurement time required to collect a spectrum can be shortened.
本発明に係る分析方法の一態様は、
試料から放出された電子をエネルギー分光する分光器と、
前記分光器でエネルギー分光された電子のエネルギー分散方向に並んで配置された複数の検出部を備えた検出器と、
を含む、電子分光装置を用いた分析方法であって、
前記分光器において第1エネルギーステップでエネルギーを掃引し、前記分光器でエネルギー分光された電子を前記複数の検出部で検出して、複数の第1スペクトルを取得する工程と、
前記複数の第1スペクトルの各々において、測定点を補完する工程と、
測定点が補完された前記複数の第1スペクトルを積算または平均して、前記第1エネルギーステップよりも小さい第2エネルギーステップの第2スペクトルを生成する工程と、
を含み、
前記複数の第1スペクトルを取得する工程では、
前記分光器において前記第1エネルギーステップでエネルギーを掃引して、前記検出部ごとに前記第1エネルギーステップの前記第1スペクトルを取得し、
前記複数の第1スペクトルの各々の測定エネルギーが一致しないように、前記第1エネルギーステップを設定する。
One aspect of the analysis method according to the present invention is to
a spectrometer for energy-spectroscopically analyzing electrons emitted from the sample;
a detector including a plurality of detection units arranged side by side in an energy dispersion direction of the electrons energy-split by the spectrometer;
An analysis method using an electron spectrometer, comprising:
a step of sweeping energy in a first energy step in the spectrometer, and detecting electrons energy-spectroscopically separated by the spectrometer with the plurality of detection units to obtain a plurality of first spectra;
complementing measurement points in each of the plurality of first spectra;
integrating or averaging the plurality of first spectra with the interpolated measurement points to generate a second spectrum having a second energy step smaller than the first energy step;
Including ,
In the step of acquiring a plurality of first spectra,
sweeping energy in the spectrometer at the first energy step to obtain the first spectrum at the first energy step for each of the detection units;
The first energy step is set so that the measured energies of the plurality of first spectra do not coincide with each other .
このような分析方法では、例えば特定の1つの検出部で電子を検出する場合と比べて、測定回数を低減できる。したがって、このような分析方法では、スペクトルを収集するための測定時間を短くできる。 In this type of analysis method, the number of measurements can be reduced compared to, for example, detecting electrons with one specific detection unit. Therefore, in this type of analysis method, the measurement time required to collect a spectrum can be shortened.
以下、本発明の好適な実施形態について図面を用いて詳細に説明する。なお、以下に説明する実施形態は、特許請求の範囲に記載された本発明の内容を不当に限定するものではない。また、以下で説明される構成の全てが本発明の必須構成要件であるとは限らない。 Below, preferred embodiments of the present invention are described in detail with reference to the drawings. Note that the embodiments described below do not unduly limit the content of the present invention described in the claims. Furthermore, not all of the configurations described below are necessarily essential components of the present invention.
また、以下では、本発明に係る電子分光装置として、オージェ電子分光装置を例に挙げて説明するが、本発明に係る電子分光装置はこれに限定されない。例えば、本発明に係る電子分光装置は、X線光電子分光装置であってもよい。 In the following, an Auger electron spectroscopy device will be described as an example of the electron spectroscopy device according to the present invention, but the electron spectroscopy device according to the present invention is not limited to this. For example, the electron spectroscopy device according to the present invention may be an X-ray photoelectron spectroscopy device.
1. 電子分光装置
まず、本発明の一実施形態に係る電子分光装置について図面を参照しながら説明する。図1は、本発明の一実施形態に係る電子分光装置100の構成を示す図である。
1. Electron Spectroscopy Apparatus First, an electron spectroscopic apparatus according to an embodiment of the present invention will be described with reference to the drawings. Fig. 1 is a diagram showing the configuration of an electron
電子分光装置100は、オージェ電子分光法により試料の分析を行う装置である。オージェ電子分光法とは、電子線等により励起されて試料から放出されるオージェ電子のエネルギーを測定することによって、元素分析を行う手法である。
The
電子分光装置100は、図1に示すように、電子線照射装置10と、試料ステージ20と、分光器30と、検出器40と、照射制御装置50と、分光器制御装置52と、計数演算装置54と、処理部60と、を含む。
As shown in FIG. 1, the
電子線照射装置10は、電子線を試料Sに照射する。電子線照射装置10は、電子銃12と、電子レンズ14と、偏向器16と、を含む。
The electron
電子銃12は、電子線を放出する。電子レンズ14は、電子銃12から放出された電子線を集束させる。偏向器16は、電子レンズ14で集束された電子線を偏向させる。偏向器16によって、所望の位置に電子線を照射できる。また、偏向器16によって、電子線で試料Sを走査できる。
The
試料ステージ20は、試料Sを保持し、試料Sを移動させることができる。試料ステージ20は、例えば、試料Sを傾斜する機構(ゴニオメーター)を備えていてもよい。試料ステージ20によって試料Sを位置決めできる。
The
分光器30は、電子線が試料Sに照射されることによって試料Sから発生するオージェ電子をエネルギー分光する。分光器30は、インプットレンズ32と、静電半球型アナライザー34と、を含む。
The
インプットレンズ32は、入射した電子を集光して静電半球型アナライザー34に導く。インプットレンズ32は、電子を減速させることによってエネルギー分解能を可変にする。インプットレンズ32は、例えば、複数の静電レンズ33で構成されている。
The
静電半球型アナライザー34は、内半球電極35aと、外半球電極35bと、を有している。静電半球型アナライザー34では、内半球電極35aと外半球電極35bとの間に電圧を印加することで、印加した電圧に応じたエネルギー範囲の電子を取り出すことがで
きる。
The electrostatic
検出器40は、分光器30でエネルギー分光された電子を検出する。
The
図2は、検出器40を模式的に示す図である。検出器40は、複数のチャンネルトロン42(検出部の一例)を有している。図2に示す例では、検出器40は、7個のチャンネルトロン42を有している。ここでは、検出器40が7個のチャンネルトロン42を有する場合について説明するが、チャンネルトロン42の数は、2以上であれば特に限定されない。チャンネルトロン42は、電子を検出し、増幅した信号を出力する検出器である。
Figure 2 is a schematic diagram of a
7個のチャンネルトロン42は、静電半球型アナライザー34の出射面、すなわち、エネルギー分散面において、エネルギー分散方向Aに並んでいる。そのため、7個のチャンネルトロン42は、互いに異なるエネルギーの電子を検出できる。したがって、検出器40では、異なるエネルギーの電子を同時に検出できる。
The seven channeltrons 42 are lined up in the energy dispersion direction A on the exit surface, i.e., the energy dispersion surface, of the electrostatic
図3は、検出器40の機能を説明するための図である。
Figure 3 is a diagram to explain the function of
図3に示すように、7個のチャンネルトロン42には、-3ch~+3chのチャンネル番号が割り当てられている。具体的には、静電半球型アナライザー34の内半球電極35aと外半球電極35b間の中心を通る電子を検出するチャンネルトロン42が、0chである。また、0chのチャンネルトロン42から、内半球電極35a側に向かって順に、-1chのチャンネルトロン42、-2chのチャンネルトロン42、-3chのチャンネルトロン42が配置されている。また、0chのチャンネルトロン42から、外半球電極35b側に向かって順に、+1chのチャンネルトロン42、+2chのチャンネルトロン42、+3chのチャンネルトロン42が配置されている。
As shown in FIG. 3, the seven
7個のチャンネルトロン42は、隣り合うチャンネル間の測定エネルギー差Dが同じになるように配列されている。そのため、例えば、0chのチャンネルトロン42における測定エネルギーをE0に設定した場合、-3chの測定エネルギーはE0-3Dであり、-2chの測定エネルギーはE0-2Dであり、-1chの測定エネルギーはE0-Dであり、+1chの測定エネルギーはE0+Dであり、+2chの測定エネルギーはE0+2Dであり、+3chの測定エネルギーはE0+3Dである。
The seven
なお、上記では、検出器40が7個のチャンネルトロン42からなる場合について説明したが、検出器40の構成はこれに限定されない。例えば、検出器40として、マイクロチャンネルプレート、マルチアノード、CMOSカメラなどを用いてもよい。これらを用いる場合には、複数の画素をまとめて1つの画素とすることで、疑似的に所望の数のチャンネルを設けてもよい。
In the above, the
照射制御装置50は、電子線照射装置10を制御する。照射制御装置50は、例えば、処理部60からの制御信号に基づいて、電子線が試料S上の所定の位置に照射されるように、電子線照射装置10を制御する。
The
分光器制御装置52は、分光器30を制御する。分光器制御装置52は、処理部60からの制御信号に基づいて、インプットレンズ32における電子の減速率や、内半球電極35aと外半球電極35bとの間に印加される電圧を制御する。
The
計数演算装置54は、各チャンネルトロン42で検出された電子を計数する。計数演算装置54は、各チャンネルトロン42で検出された電子の計数結果、すなわち電子の検出結果を処理部60に送る。処理部60は、各チャンネルトロン42で計数された電子の数
の情報を取得する。そのため、処理部60は、各チャンネルトロン42ごとにエネルギースペクトル(以下、単に「スペクトル」ともいう)を取得できる。すなわち、処理部60は、同時に、チャンネルトロン42の数に応じたスペクトルを取得できる。
The
処理部60は、計数演算装置54から送られた検出器40における電子の検出結果に基づいて、オージェ電子分光スペクトルを生成する処理や、照射制御装置50および分光器制御装置52を制御する処理等の処理を行う。なお、処理部60の処理の詳細については後述する。
The
処理部60は、例えば、CPU(Central Processing Unit)やFPGA(Field Programmable Gate Array)等の処理回路と、半導体メモリ等の記憶回路と、を含む。処理部60では、処理回路で記憶回路に記憶されたプログラムを実行することにより、各種計算処理、各種制御処理を行う。
The
2. スペクトルの収集
2.1. エネルギー分解能の指定
電子分光装置100では、分光器30で測定エネルギーを掃引させながら測定を繰り返すことで、エネルギースペクトルを収集できる。以下、電子分光装置100におけるスペクトルの収集方法について説明する。
2. Spectral Collection 2.1. Designation of Energy Resolution In the
まず、ユーザーが測定条件を設定する。ユーザーは、電子分光装置100の設定部(ユーザーインターフェイス等)を操作して、測定条件を設定する。処理部60は、設定された測定条件を受け付ける。設定された測定条件が処理部60の処理に反映される。
First, the user sets the measurement conditions. The user operates the setting unit (user interface, etc.) of the
測定条件は、モードの選択、開始エネルギー、終了エネルギー、およびエネルギー分解能を含む。モードは、CAE(Constant Analyzer Energy)モードとCRR(Constant Retarding Ratio)モードから選択される。モードの詳細については後述する。開始エネルギーは、測定を開始する測定エネルギーであり、終了エネルギーは、測定を終了する測定エネルギーである。すなわち、測定では、開始エネルギーから終了エネルギーまでの範囲のスペクトルを得ることができる。エネルギー分解能は、スペクトルの分解能であり、例えば、スペクトルに現れるピークの半値幅(半値全幅)で示される。例えば、試料を構成する元素を知るための元素分析であればエネルギー分解能を低く設定し、化学状態分析を行う場合にはエネルギー分解能を高く設定する。 The measurement conditions include the selection of the mode, the start energy, the end energy, and the energy resolution. The mode is selected from the CAE (Constant Analyzer Energy) mode and the CRR (Constant Retarding Ratio) mode. Details of the modes will be described later. The start energy is the measurement energy at which the measurement starts, and the end energy is the measurement energy at which the measurement ends. In other words, the measurement can obtain a spectrum ranging from the start energy to the end energy. The energy resolution is the resolution of the spectrum, and is indicated, for example, by the half-width (full width at half maximum) of the peak that appears in the spectrum. For example, the energy resolution is set low for elemental analysis to know the elements that make up the sample, and set high for chemical state analysis.
2.2. 測定時のエネルギーステップΔE1の設定
処理部60は、エネルギー分解能に基づいて、測定時のエネルギーステップΔE1を設定する。電子分光装置100では、エネルギーステップΔE1でエネルギーを掃引して測定を行う。例えば、図3に示す例では、1回目の測定において0chの測定エネルギーがE0の場合、2回目の測定では0chの測定エネルギーはE0+ΔE1となり、3回目の測定では0chの測定エネルギーはE0+2ΔE1となる。したがって、各チャンネルトロン42ごとに得られるスペクトルの測定点の間隔は、エネルギーステップΔE1となる。
2.2. Setting of Energy Step ΔE1 during Measurement The
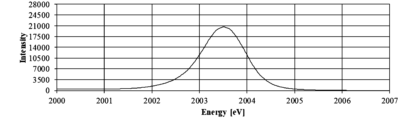
図4は、エネルギーステップΔE1とエネルギー分解能の関係を説明するためのグラフである。 FIG. 4 is a graph for explaining the relationship between the energy step ΔE1 and the energy resolution.
エネルギー分解能は、例えば、半値全幅FWHMで表すことができる。図4に示すグラフにおいて、2000eV付近でのエネルギー分解能は、FWHM=12eVである。図4に示す最大値1.0の波形に対して、エネルギーステップΔE1が十分に小さければ、測定結果として最大値1.0の波形が得られる。しかしながら、例えば、エネルギーステ
ップΔE1が6eVの場合、測定結果として最大値1.0の波形が得られるとは限らない。
The energy resolution can be expressed, for example, by the full width at half maximum (FWHM). In the graph shown in Fig. 4, the energy resolution at around 2000 eV is FWHM = 12 eV. If the energy step ΔE 1 is sufficiently small for the waveform with a maximum value of 1.0 shown in Fig. 4, a waveform with a maximum value of 1.0 is obtained as the measurement result. However, for example, if the energy step ΔE 1 is 6 eV, a waveform with a maximum value of 1.0 is not necessarily obtained as the measurement result.
例えば、エネルギーステップΔE1=6eVの場合に、測定エネルギーとして以下の2つのパターンが得られたものとする。 For example, when the energy step ΔE 1 =6 eV, it is assumed that the following two patterns are obtained as the measurement energy.
パターン1:1970,1976,1982,1988,1994,2000,2006.2012,2018,2024,2030
パターン2:1973,1979,1985,1991,1947,2003,2009.2015,2021,2027,2033
Pattern 1: 1970, 1976, 1982, 1988, 1994, 2000, 2006, 2012, 2018, 2024, 2030
Pattern 2: 1973, 1979, 1985, 1991, 1947, 2003, 2009, 2015, 2021, 2027, 2033
パターン1の場合、測定結果として、最大値1.0、FWHM=12eVの波形が得られる。また、パターン2の場合、測定結果として、最大値0.8、FWHM=12eVの波形が得られる。なお、測定されていない点については、線形補完して、最大値およびFWHMを求めた。
In the case of
このように、エネルギーステップΔE1が同じであっても、測定エネルギーと、ピーク位置の関係によって、スペクトルの歪み具合がかわる。上記のように、エネルギーステップΔE1がFWHMの半分では、最大値が20%も変わるため、エネルギーステップΔE1を小さくしなければならない。 In this way, even if the energy step ΔE 1 is the same, the degree of distortion of the spectrum changes depending on the relationship between the measurement energy and the peak position. As described above, when the energy step ΔE 1 is half the FWHM, the maximum value changes by 20%, so the energy step ΔE 1 must be made small.
ここで、チャンネル間の測定エネルギー差Dは、エネルギー分解能に比例する。そのため、エネルギー分解能からエネルギーステップΔE1を算出することと、チャンネル間の測定エネルギー差DからエネルギーステップΔE1を算出することは、本質的に同じである。したがって、ここでは、チャンネル間の測定エネルギー差DからエネルギーステップΔE1を算出する場合について説明する。 Here, the measured energy difference D between channels is proportional to the energy resolution. Therefore, calculating the energy step ΔE1 from the energy resolution is essentially the same as calculating the energy step ΔE1 from the measured energy difference D between channels. Therefore, here, the case of calculating the energy step ΔE1 from the measured energy difference D between channels will be described.
図5および図6は、7個のチャンネルトロンの測定エネルギーを示すグラフである。図5および図6において、低エネルギー側から高エネルギー側に向かって、-3ch、-2ch、-1ch、0ch、+1ch、+2ch、+3chの順で並んでいる。 Figures 5 and 6 are graphs showing the measured energies of seven channeltrons. In Figures 5 and 6, the order from low energy to high energy is -3ch, -2ch, -1ch, 0ch, +1ch, +2ch, and +3ch.
なお、図5は、エネルギーステップΔE1がチャンネル間の測定エネルギー差Dに等しい場合(ΔE1=D)である。図6は、エネルギーステップΔE1がチャンネル間の測定エネルギー差Dの1/2である場合(ΔE1=D/2)である。 5 shows the case where the energy step ΔE1 is equal to the measured energy difference D between the channels ( ΔE1 =D), while Fig. 6 shows the case where the energy step ΔE1 is 1/2 of the measured energy difference D between the channels ( ΔE1 =D/2).
エネルギーステップΔE1は、チャンネル間の測定エネルギー差Dを用いて次式で表される。 The energy step ΔE 1 is expressed by the following equation using the measured energy difference D between the channels:
ΔE1=max(β,α・c・(Ep+γ・Em))
α=d・(1+0.5・d・c・γ)
β:エネルギーステップΔE1の下限
α:エネルギーステップΔE1の比例係数
c・(Ep+γ・Em):チャンネル間の測定エネルギー差D
c:分光器を通過する電子のエネルギーとチャンネル間の測定エネルギー差Dの比
Ep:CAEモードでのパスエネルギー(分光器を通過する電子のエネルギー)
γ:CRRモードでのインプットレンズの減速率
Em:測定エネルギー
d:チャンネル間の測定エネルギー差DとエネルギーステップΔE1の比
ΔE 1 = max (β, α・c・(E p +γ・E m ))
α=d・(1+0.5・d・c・γ)
β: Lower limit of energy step ΔE 1 α: Proportional coefficient of energy step ΔE 1 c·(E p + γ·E m ): Measurement energy difference D between channels
c: Ratio of the energy of the electron passing through the spectrometer to the measured energy difference D between the channels. E p : Pass energy in CAE mode (energy of the electron passing through the spectrometer).
γ: Deceleration rate of the input lens in CRR mode E m : Measurement energy d: Ratio of measurement energy difference D between channels and energy step ΔE 1
なお、γは、CRRモードでのインプットレンズの減速率であり、例えば、インプット
レンズ通過後に電子のエネルギーが1/2になった場合、γ=1/2となる。また、例えば、図5に示すΔE1=Dの場合、比dはd=1となり、図6に示すΔE1=D/2の場合、比dはd=1/2となる。
In addition, γ is the deceleration rate of the input lens in the CRR mode, and for example, when the energy of the electrons becomes 1/2 after passing through the input lens, γ = 1/2. For example, when ΔE 1 = D shown in Fig. 5, the ratio d is d = 1, and when ΔE 1 = D/2 shown in Fig. 6, the ratio d is d = 1/2.
電子分光装置100では、CAEモードとCRRモードで測定可能である。
The
CAEモードでは、試料Sから放出された電子のエネルギーに関わらず、電子が分光器30を通過するときのエネルギーが一定、すなわち、パスエネルギーが一定になる。CAEモードでは、内半球電極35aと外半球電極35bの間に印加する電位差を一定の値に保ち、インプットレンズ32の印加電圧を掃引する。CAEモードでは、エネルギー分解能はすべての測定エネルギー範囲で一定である。
In the CAE mode, the energy of the electrons passing through the
これに対して、CRRモードでは、測定する電子の運動エネルギーに応じて一定の比率で電子を減速する。CRRモードでは、内半球電極35aと外半球電極35bの間に印加する電位差をインプットレンズ32の印加電圧とともに掃引し、電子を一定の減速比で分光する。CRRモードでは、エネルギー分解能が測定エネルギーに比例する。
In contrast, in CRR mode, electrons are decelerated at a constant ratio according to the kinetic energy of the electrons being measured. In CRR mode, the potential difference applied between the
CAEモードでは、γ=0である。したがって、CAEモードでは、エネルギーステップΔE1は次式(1)で表される。 In the CAE mode, γ = 0. Therefore, in the CAE mode, the energy step ΔE 1 is expressed by the following equation (1).
ΔE1=max(β,α・c・Ep) ・・・(1)
α=d
ΔE 1 = max (β, α・c・E p ) (1)
α=d
CAEモードでは、βは固定値であり、α・c・Epも固定値である。そのため、エネルギーステップΔE1は固定される。 In the CAE mode, β is a fixed value, and α·c· Ep is also a fixed value, so the energy step ΔE1 is fixed.
CRRモードでは、Ep=0である。したがって、CRRモードでは、エネルギーステップΔE1は次式で表される。 In the CRR mode, E p = 0. Therefore, in the CRR mode, the energy step ΔE 1 is expressed by the following equation:
ΔE1=max(β,α・c・γ・Em) ・・・(2)
α=d・(1+0.5・d・c・γ)
ΔE 1 = max (β, α・c・γ・E m ) ... (2)
α=d・(1+0.5・d・c・γ)
CRRモードでは、βは固定値、α・c・γ・Emは、測定エネルギーに比例する。そのため、エネルギーステップΔE1は次式(3)で表される。 In the CRR mode, β is a fixed value, and α, c, γ, and E m are proportional to the measured energy. Therefore, the energy step ΔE 1 is expressed by the following equation (3).
ΔE1=f(Em) ・・・(3)
f(Em)=max(αEm,β) ・・・(4)
ただし、式(4)のαはα=α・c・γであり、この式の右辺のαは式(2)のαである。
ΔE 1 =f(E m )...(3)
f(E m )=max(αE m , β)...(4)
However, α in equation (4) is α=α·c·γ, and α on the right side of this equation is α in equation (2).
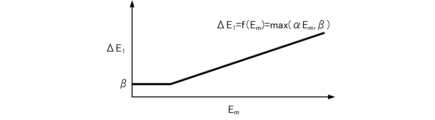
図7は、ΔE1=f(Em)、ただし、f(Em)=αEmの場合を示すグラフである。図8は、ΔE1=f(Em)、ただし、f(Em)=max(αEm,β)の場合を示すグラフである。 Fig. 7 is a graph showing the case where ΔE 1 =f(E m ), where f(E m )=αE m Fig. 8 is a graph showing the case where ΔE 1 =f(E m ), where f(E m )=max(αE m , β).
図7に示すように、f(Em)=αEmとした場合、すなわち、エネルギーステップΔE1をαとEmの積とした場合、測定エネルギーEmが小さい場合にはエネルギーステップΔE1も小さくなり、測定エネルギーEmが大きい場合にはエネルギーステップΔE1も大きくなる。したがって、測定エネルギーEmがゼロに近い値のときに、エネルギーステップΔE1が非常に小さくなってしまう。 7, when f(E m )=αE m , that is, when the energy step ΔE 1 is the product of α and E m , if the measured energy E m is small, the energy step ΔE 1 is also small, and if the measured energy E m is large, the energy step ΔE 1 is also large. Therefore, when the measured energy E m is close to zero, the energy step ΔE 1 becomes very small.
したがって、図8に示すように、f(Em)=max(αEm,β)とし、エネルギーステップΔE1はαとEmの積であるが、αとEmの積がβよりも小さい場合には、ΔE1=βとする。これにより、測定エネルギーEmがゼロに近い値のときに、エネルギーステップΔE1が非常に小さくなってしまうという問題を解決できる。 8, f(E m )=max(αE m , β) is set, and the energy step ΔE 1 is the product of α and E m , but if the product of α and E m is smaller than β, ΔE 1 = β is set. This solves the problem that the energy step ΔE 1 becomes very small when the measured energy E m is close to zero.
CRRモードでは、測定エネルギーEmとエネルギー分解能が比例する。そのため、測定エネルギーEmとチャンネル間の測定エネルギー差Dも比例する。したがって、比dを設定したときに、チャンネル間の測定エネルギー差Dの補正項(1+0.5・d・c・γ)を用いてαを算出する。 In the CRR mode, the measurement energy E m is proportional to the energy resolution. Therefore, the measurement energy E m is also proportional to the measurement energy difference D between channels. Therefore, when the ratio d is set, α is calculated using the correction term (1 + 0.5 d c γ) of the measurement energy difference D between channels.
2.3. ΔE1を算出するためのテーブル
上記のΔE1を示す式において、c、Ep、γ、Emは、値が決まっている。これに対して、β、α、dについては、値を設定しなければならない。ここで、αは、式α=d・(1+0.5・d・c・γ)から算出できるため、ΔE1を算出するために確定すべきパラメーターは、β、dとなる。
2.3. Table for calculating ΔE1 In the above formula showing ΔE1 , the values of c, E p , γ, and E m are fixed. In contrast, values must be set for β, α, and d. Here, α can be calculated from the formula α=d·(1+0.5·d·c·γ), so the parameters to be determined for calculating ΔE1 are β and d.
例えば、テーブルを準備しておくことで、β、dを決定する。図9は、βおよびdのテーブルの一例を示す図である。図9では、CRRモードにてγ=0.2、定性分析を行う場合のテーブルを示している。 For example, β and d are determined by preparing a table. Figure 9 shows an example of a table of β and d. Figure 9 shows a table for performing qualitative analysis in CRR mode with γ = 0.2.
図9に示すテーブルでは、スペクトルのピーク強度の変化が5%程度になるようにβの値およびdの値を設定している。定量分析を行う場合には、βとdを小さくしてピーク強度の変化がSN比と同程度以下になるようにβの値およびdの値を設定することが望ましい。このように、測定目的に応じてβの値およびdの値を変えることで、測定目的に応じたエネルギーステップΔE1で測定ができる。 In the table shown in Fig. 9, the values of β and d are set so that the change in the peak intensity of the spectrum is about 5%. When performing quantitative analysis, it is desirable to set the values of β and d small so that the change in peak intensity is equal to or less than the S/N ratio. In this way, by changing the values of β and d according to the purpose of measurement, it is possible to perform measurement with an energy step ΔE 1 according to the purpose of measurement.
βおよびdを設定するテーブルは、測定目的、エネルギー分解能、測定モード(CAEモード、CRRモード)に応じて、複数準備する。処理部60は、測定目的、エネルギー分解能、測定モードに応じてテーブルを参照し、βおよびdの値を設定し、エネルギーステップΔE1を算出する。
A plurality of tables for setting β and d are prepared according to the measurement purpose, energy resolution, and measurement mode (CAE mode, CRR mode). The
2.3. 測定
電子分光装置100では、電子銃12から放出された電子線は、電子レンズ14によって集束されて試料S上に照射される。電子線が照射された試料Sからは、オージェ電子、二次電子等が放出される。
2.3. Measurement In the
試料Sから放出されたオージェ電子は、インプットレンズ32に入射し、静電レンズ33により減速され、静電半球型アナライザー34に入射する。入射したオージェ電子は、静電半球型アナライザー34でエネルギー分光され、静電半球型アナライザー34のエネルギー分散面においてエネルギー分散方向Aにエネルギー(運動エネルギー)に応じて分散される。
The Auger electrons emitted from the sample S enter the
エネルギーに応じて分散されたオージェ電子は、エネルギー分散方向Aに並んだ7個のチャンネルトロン42で検出される。7個のチャンネルトロン42で検出された電子は、チャンネルトロン42ごとに計数演算装置54で計数され、その計数結果が処理部60に送られる。
The Auger electrons dispersed according to energy are detected by seven
スペクトルを収集する場合には、分光器30においてエネルギーステップΔE1でエネルギーを掃引しながら、分光された電子を7個のチャンネルトロン42で検出することを繰り返す。
When collecting a spectrum, the energy is swept in the
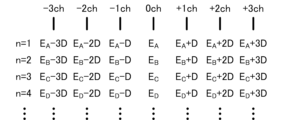
図10は、検出器40の各チャンネルトロン42の測定エネルギーを示す図である。
Figure 10 shows the measured energy of each
例えば、1回目の測定n=1では、0chでエネルギーEAの電子が検出され、-1chでエネルギーEA-Dの電子が検出され、-2chでエネルギーEA-2Dの電子が検出され、-3chでエネルギーEA-3Dの電子が検出され、+1chでエネルギーEA+Dの電子が検出され、+2chでエネルギーEA+2Dの電子が検出され、+3chでエネルギーEA+3Dの電子が検出される。2回目の測定n=2では、0chでエネルギーEBの電子が検出され、-1chでエネルギーEB-Dの電子が検出され、-2chでエネルギーEB-2Dの電子が検出され、-3chでエネルギーEB-3Dの電子が検出され、+1chでエネルギーEB+Dの電子が検出され、+2chでエネルギーEB+2Dの電子が検出され、+3chでエネルギーEB+3Dの電子が検出される。ここで、エネルギーEBとエネルギーEAの差は、エネルギーステップΔE1である。すなわち、EB=EA+ΔE1である。また、3回目の測定n=3において0chで検出されるエネルギーECは、EC=EB+ΔE1=EA+Δ2E1である。また、4回目の測定n=4において0chで検出されるエネルギーEDは、ED=EC+ΔE1=EA+Δ3E1である。 For example, in a first measurement n=1, an electron with energy E A is detected in 0ch, an electron with energy E A -D is detected in -1ch, an electron with energy E A -2D is detected in -2ch, an electron with energy E A -3D is detected in -3ch, an electron with energy E A +D is detected in +1ch, an electron with energy E A +2D is detected in +2ch, and an electron with energy E A +3D is detected in +3ch. In a second measurement n=2, an electron with energy E B is detected in 0ch, an electron with energy E B -D is detected in -1ch, an electron with energy E B -2D is detected in -2ch, an electron with energy E B -3D is detected in -3ch, an electron with energy E B +D is detected in +1ch, an electron with energy E B +2D is detected in +2ch, and an electron with energy E B +3D is detected in +3ch. Here, the difference between energy EB and energy EA is the energy step ΔE1 . That is, EB = EA + ΔE1 . Furthermore, the energy E C detected at 0ch in the third measurement n=3 is E C = EB + ΔE1 = EA + Δ2E1 . Furthermore, the energy E D detected at 0ch in the fourth measurement n=4 is E D = EC + ΔE1 = EA + Δ3E1 .
このようにして、分光器30においてエネルギーステップΔE1でエネルギーを掃引しながら繰り返し測定を行い、チャンネルごとにスペクトルを収集する。電子分光装置100では、7個のチャンネルに対応して7個のスペクトルを得ることができる。
In this manner, the measurement is repeated while sweeping the energy in the energy step ΔE 1 in the
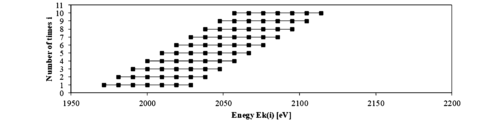
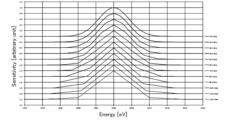
図11は、7個のスペクトルを示す図である。図11は、チャンネルごとに、測定エネルギーと測定強度をプロットしたものである。 Figure 11 shows seven spectra. Figure 11 plots the measured energy and measured intensity for each channel.
電子分光装置100では、エネルギーステップΔE1で測定エネルギーを掃引しているため、各スペクトルは、離散的なデータとなる。1つのスペクトルのエネルギーステップ、すなわち、隣り合う測定点間の測定エネルギー差は、ΔE1である。なお、ここでは、CAEモードの例について説明したが、CRRモードではチャンネル間の測定エネルギー差DおよびエネルギーステップΔE1は、測定エネルギーに依存する。
In the
2.4. エネルギーステップΔE2の設定
電子分光装置100では、測定時のエネルギーステップΔE1とは別に、スペクトル生成時のエネルギーステップΔE2を設定する。これにより、測定時およびスペクトル生成時のそれぞれにおいて、最適なエネルギーステップを設定できる。
2.4 Setting of Energy Step ΔE2 In the
電子分光装置100では、エネルギーステップΔE2は、エネルギーステップΔE1よりも小さく設定する(ΔE2<ΔE1)。例えば、エネルギーステップΔE2は、エネルギーステップΔE1の1/10以上1/2以下程度にする。すなわち、エネルギーステップΔE2は、(1/10)×ΔE1≦ΔE2≦(1/2)×ΔE1を満たす値とする。エネルギーステップΔE2をこのような範囲に設定することで、補完誤差とデータ量のバランスをとることができる。
In the
また、CRRモードでは、エネルギーステップΔE1は、測定エネルギーに応じて変化するが、CRRモードで測定された場合でも、エネルギーステップΔE2は、測定エネルギーによらず一定とすることもできる。 Furthermore, in the CRR mode, the energy step ΔE 1 changes depending on the measurement energy, but even when the measurement is performed in the CRR mode, the energy step ΔE 2 can be constant regardless of the measurement energy.
2.5. 補完
図12は、7個のスペクトルの各々において、測定点を補完する処理を説明するための図である。
2.5 Interpolation FIG. 12 is a diagram for explaining the process of interpolating the measurement points in each of the seven spectra.
7個のスペクトルの各々において、実際に測定された測定点間の測定点を計算により補完する。図12に示す例では、実際に測定された測定点間を直線でつないで線形補完している。なお、測定点を補完する手法は特に限定されず、スプライン補完など線形補完以外の手法を用いて測定点を補完してもよい。線形補完することによって、各スペクトルのエネルギーステップを、エネルギーステップΔE1からエネルギーステップΔE2とすることができる。図12に示す各スペクトルは、線形補完により測定点間を連続させたため、エネルギーステップΔE2=0である。 In each of the seven spectra, the measurement points between the actually measured measurement points are interpolated by calculation. In the example shown in FIG. 12, the measurement points between the actually measured measurement points are connected by straight lines for linear interpolation. The method for interpolating the measurement points is not particularly limited, and the measurement points may be interpolated using a method other than linear interpolation, such as spline interpolation. By performing linear interpolation, the energy step of each spectrum can be changed from energy step ΔE 1 to energy step ΔE 2. Since the measurement points of each spectrum shown in FIG. 12 are made continuous by linear interpolation, the energy step ΔE 2 =0.
2.6. 積算
図13は、測定点が線形補完された7個のスペクトルを積算した結果を示すグラフである。
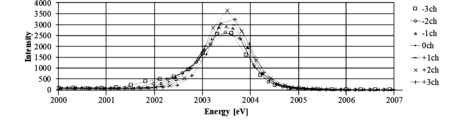
2.6. Integration Figure 13 is a graph showing the results of integrating seven spectra whose measurement points have been linearly interpolated.
図13に示すように、測定点が線形補完された7個のスペクトルを積算することで、1つのスペクトル(マルチスペクトル)を生成できる。 As shown in Figure 13, one spectrum (multispectrum) can be generated by accumulating seven spectra with linearly interpolated measurement points.
図11に示すように、チャンネルトロン42には、検出感度のばらつきがある。図13に示すように、測定点が線形補完された7個のスペクトルを積算することによって、検出感度のばらつきの影響を低減できる。したがって、電子分光装置100では、各チャンネルトロン42の検出感度のばらつきを補正しなくてもよい。
As shown in FIG. 11, the
上記では、測定点間を線形補完して連続させて、エネルギーステップΔE2=0とした場合について説明したが、エネルギーステップΔE2=0が計算できれば、エネルギーステップΔE2がいかなる値であっても、同様の手法でマルチスペクトルを生成できる。例えば、図13に示すスペクトルからエネルギーステップΔE2に応じて測定点を抽出して、設定されたエネルギーステップΔE2のマルチスペクトルを生成してもよい。また、例えば、測定点が補完された7個のスペクトルの各々において、エネルギーステップΔE2となるように測定点を抽出した後に、測定点が抽出された7個のスペクトルを積算して、エネルギーステップΔE2のマルチスペクトルを生成してもよい。 In the above, a case has been described in which the measurement points are linearly complemented to make them continuous and the energy step ΔE 2 =0 is set, but as long as the energy step ΔE 2 =0 can be calculated, a multispectrum can be generated by a similar method regardless of the value of the energy step ΔE 2. For example, measurement points may be extracted from the spectrum shown in Fig. 13 according to the energy step ΔE 2 to generate a multispectrum with the set energy step ΔE 2. Also, for example, in each of the seven spectra with complemented measurement points, measurement points may be extracted so as to have an energy step ΔE 2 , and then the seven spectra with extracted measurement points may be integrated to generate a multispectrum with the energy step ΔE 2 .
なお、ここでは、測定点が補完された7個のスペクトルを積算して1つのマルチスペクトルを生成する場合について説明したが、測定点が補完された7個のスペクトルを平均して1つのマルチスペクトルを生成してもよい。 Note that, although the case where seven spectra with complemented measurement points are accumulated to generate one multispectrum has been described here, one multispectrum may also be generated by averaging seven spectra with complemented measurement points.
2.7. 補完計算と比d
図12に示す7個のスペクトルを積算する際に、各スペクトルの測定エネルギーが一致しないことが望ましい。
2.7. Complementary calculation and ratio
When accumulating the seven spectra shown in FIG. 12, it is desirable that the measured energies of the spectra do not coincide.
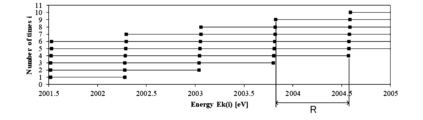
図14は、7個のスペクトルの測定エネルギーが一致しない場合を示す図である。図15は、各スペクトルの測定エネルギーが一致している場合を示す図である。 Figure 14 shows a case where the measured energies of the seven spectra do not match. Figure 15 shows a case where the measured energies of each spectrum match.
図15に示すように、各スペクトルの測定エネルギーが一致している場合、実際に測定された測定点がなく補完された測定点のみのエネルギー範囲Rが広い。 As shown in Figure 15, when the measured energy of each spectrum is the same, the energy range R is wide, with no actual measured measurement points and only supplemented measurement points.
これに対して、図14に示すように、各スペクトルの測定エネルギーが一致していない場合、実際に測定された測定点がばらけるため、補完された測定点のみのエネルギー範囲Rを狭くできる。 In contrast, as shown in Figure 14, when the measured energies of each spectrum do not match, the actual measured measurement points will vary, so the energy range R of only the interpolated measurement points can be narrowed.
ここで、補完された測定点の強度のSN比は、実際に測定された測定点のSN比とは異なる。図16は、実際に測定された測定点のSN比と補完された測定点のSN比を説明す
るための図である。
Here, the S/N ratio of the intensity at the interpolated measurement point is different from the S/N ratio at the actually measured measurement point. Fig. 16 is a diagram for explaining the S/N ratio at the actually measured measurement point and the S/N ratio at the interpolated measurement point.
実際に測定された測定点における強度I1がポアソン分布に従う場合、強度I1のSN比はI11/2である。同様に、強度I2のSN比はI21/2である。線形補完によりI3を計算すると、α=(E3-E1)/(E2-E1)として、I3=(1-α)I1+αI2である。したがって、強度I3のSN比は、以下のように表される。 When the actually measured intensity I1 at the measurement point follows a Poisson distribution, the SNR of the intensity I1 is I1 1/2 . Similarly, the SNR of the intensity I2 is I2 1/2 . When I3 is calculated by linear interpolation, I3 = (1 - α)I1 + αI2, where α = (E3 - E1) / (E2 - E1). Therefore, the SNR of the intensity I3 is expressed as follows.

内挿では、0≦α≦1であり、補完された測定点の強度値のSN比は、ポアソン分布に従う場合の強度値のSN比以上となる。このように、補完することによってSN比が変わるため、この影響が特定の測定エネルギーに集中しないように、エネルギーステップΔE1を設定する。 In the interpolation, 0≦α≦1, and the S/N ratio of the intensity value of the interpolated measurement point is equal to or greater than the S/N ratio of the intensity value when it follows the Poisson distribution. In this way, the S/N ratio changes due to the interpolation, so the energy step ΔE 1 is set so that the effect is not concentrated at a specific measurement energy.
ここで、比dを変更すると、エネルギーステップΔE1が変わる。したがって、比dを、各スペクトルの測定エネルギーができるだけ一致しないように設定する。例えば、比dを1よりも小さい値とする。比d=1の場合、すなわち、図15に示すように、エネルギーステップΔE1とチャンネル間の測定エネルギー差Dが等しい場合、各スペクトルの測定エネルギーが一致してしまう。これに対して、比dを1よりも小さい値とすることによって、比dが1の場合と比べて、一致する測定エネルギーの数を減らすことができ、補完された測定点のみのエネルギー範囲Rを狭くできる。 Here, when the ratio d is changed, the energy step ΔE1 changes. Therefore, the ratio d is set so that the measured energies of the spectra do not match as much as possible. For example, the ratio d is set to a value smaller than 1. When the ratio d=1, that is, when the energy step ΔE1 and the measured energy difference D between the channels are equal as shown in FIG. 15, the measured energies of the spectra match. On the other hand, by setting the ratio d to a value smaller than 1, the number of matching measured energies can be reduced compared to when the ratio d is 1, and the energy range R of only the interpolated measurement points can be narrowed.
また、例えば、チャンネルトロン42の数をNCとした場合、比dをd=NC/(NC+1)と設定する。これにより、各スペクトルの測定エネルギーを一致させないことができる。なお、比dは、上記に限定されず、比dを、d=NC/(NC+NN)などとしてもよい。ただし、NNは、NCの1以外の約数の倍数ではない自然数である。
Furthermore, for example, if the number of
3. 処理
図17は、処理部60の処理の一例を示すフローチャートである。
3. Processing FIG. 17 is a flowchart showing an example of processing by the
処理部60は、まず、測定条件を設定する(S100)。
The
処理部60は、ユーザーによる、モードの選択、開始エネルギー、終了エネルギー、およびエネルギー分解能の指定を受け付ける。
The
処理部60は、指定されたエネルギー分解能に基づいて、エネルギーステップΔE1を設定する。例えば、処理部60は、測定モードおよびエネルギー分解能ごとに準備された、βとdのテーブルから、指定された測定モードおよびエネルギー分解能に対応するβとdの値を取得する。処理部60は、CAEモードでは、上述した式(1)からエネルギーステップΔE1を算出し、CRRモードでは、上述した式(3)からエネルギーステップΔE1を算出する。
The
なお、上述したように、エネルギーステップΔE1は、各スペクトルの測定エネルギーが一致しないように設定されることが好ましい。 As described above, it is preferable that the energy step ΔE 1 is set so that the measured energies of the spectra do not coincide with each other.
次に、処理部60は、分光器30においてエネルギーステップΔE1でエネルギーを掃
引し、分光器30でエネルギー分光された電子を7個のチャンネルトロン42で検出して得られた7個のスペクトルを取得する(S102)。処理部60は、分光器制御装置52を介して分光器30に、処理S100で設定したエネルギーステップΔE1でエネルギーを掃引させ、チャンネルトロン42ごとに計数された電子の計数結果を、計数演算装置54から取得する。これにより、図11に示すように、7個のスペクトルを取得できる。
Next, the
次に、処理部60は、エネルギーステップΔE2を設定する(S104)。処理部60は、エネルギーステップΔE2をエネルギーステップΔE1よりも小さく設定する(ΔE2<ΔE1)。処理部60は、例えば、生成されたスペクトルの表示や、スペクトルの解析に最適なエネルギーステップにエネルギーステップΔE2を設定する。
Next, the
次に、処理部60は、7個のスペクトルの各々において、補完計算を行うことによって測定点を補完する(S106)。処理部60は、例えば、線形補完により測定点を補完する。これにより、図12に示すように、7個のスペクトルの各々において、測定点を補完することができる。
Next, the
次に、処理部60は、測定点が補完された7個のスペクトルを積算して、1つのスペクトル(マルチスペクトル)を生成する(S108)。これにより、図13に示すように、マルチスペクトルを生成できる。
Next, the
処理部60は、生成されたマルチスペクトルを表示部に表示させ、処理を終了する。なお、処理部60は、生成されたマルチスペクトルを微分して微分スペクトルを生成し、生成した微分スペクトルを表示部に表示させてもよい。
The
4. エネルギーステップΔE1について
測定時のエネルギーステップΔE1が大きくなるほど、測定時間を短くでき、ノイズを小さくできる。しかしながら、測定時のエネルギーステップΔE1が大きくなるほど、スペクトルのピークが歪む。このように、ノイズとスペクトルのピークの歪みがトレードオフの関係にある。
4. Regarding the energy step ΔE1 The larger the energy step ΔE1 during measurement, the shorter the measurement time and the smaller the noise. However, the larger the energy step ΔE1 during measurement, the more the spectrum peak is distorted. Thus, there is a trade-off between noise and distortion of the spectrum peak.
以下では、エネルギーステップΔE1とエネルギーステップΔE2の比を変化させたときの、ノイズおよびスペクトルのピークの歪みについて説明する。ここでは、チャンネルトロンの数を7として説明する。 In the following, the noise and distortion of the spectrum peak when the ratio between the energy step ΔE 1 and the energy step ΔE 2 is changed will be described. Here, the number of channeltrons is set to 7.
(1)エネルギーステップとノイズの関係について
オージェ電子分光法では、バックグラウンドの影響を低減するために、微分されたスペクトルが用いられる。
(1) Relationship between energy step and noise In Auger electron spectroscopy, a differentiated spectrum is used to reduce the influence of background.
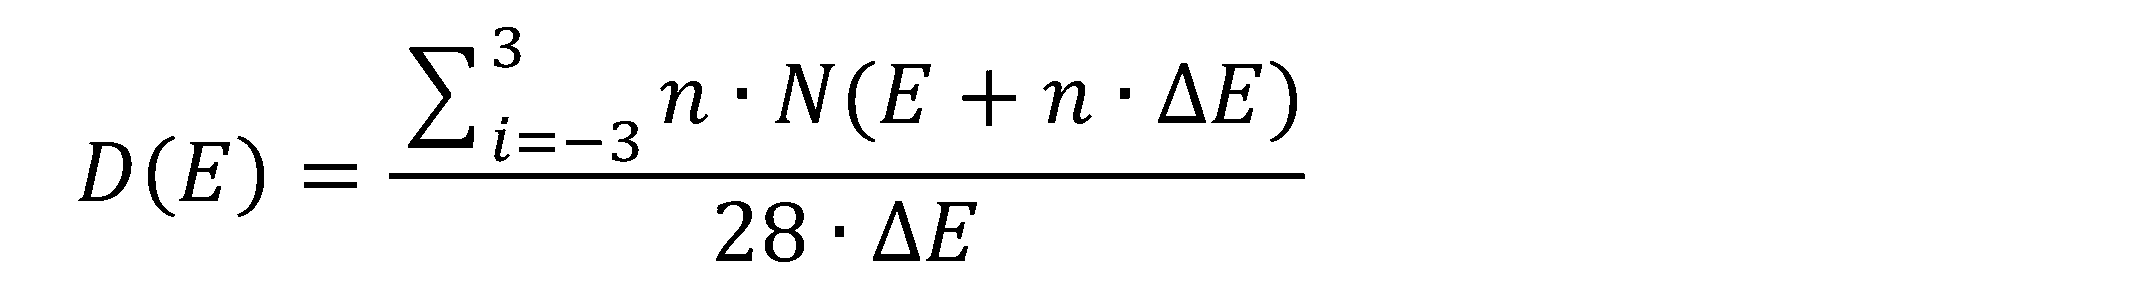
nを自然数としたとき、(2n+1)点による微分は次式で表される。 When n is a natural number, the differentiation over (2n+1) points is expressed by the following formula.

ただし、N(E)はエネルギーEでの電子の強度、D(E)はエネルギーEでの電子の強度の微分、ΔEはエネルギーステップである。n=3とすると7点微分となり、次式が得られる。 where N(E) is the electron intensity at energy E, D(E) is the derivative of the electron intensity at energy E, and ΔE is the energy step. If n=3, it becomes a 7-point derivative, and the following equation is obtained.
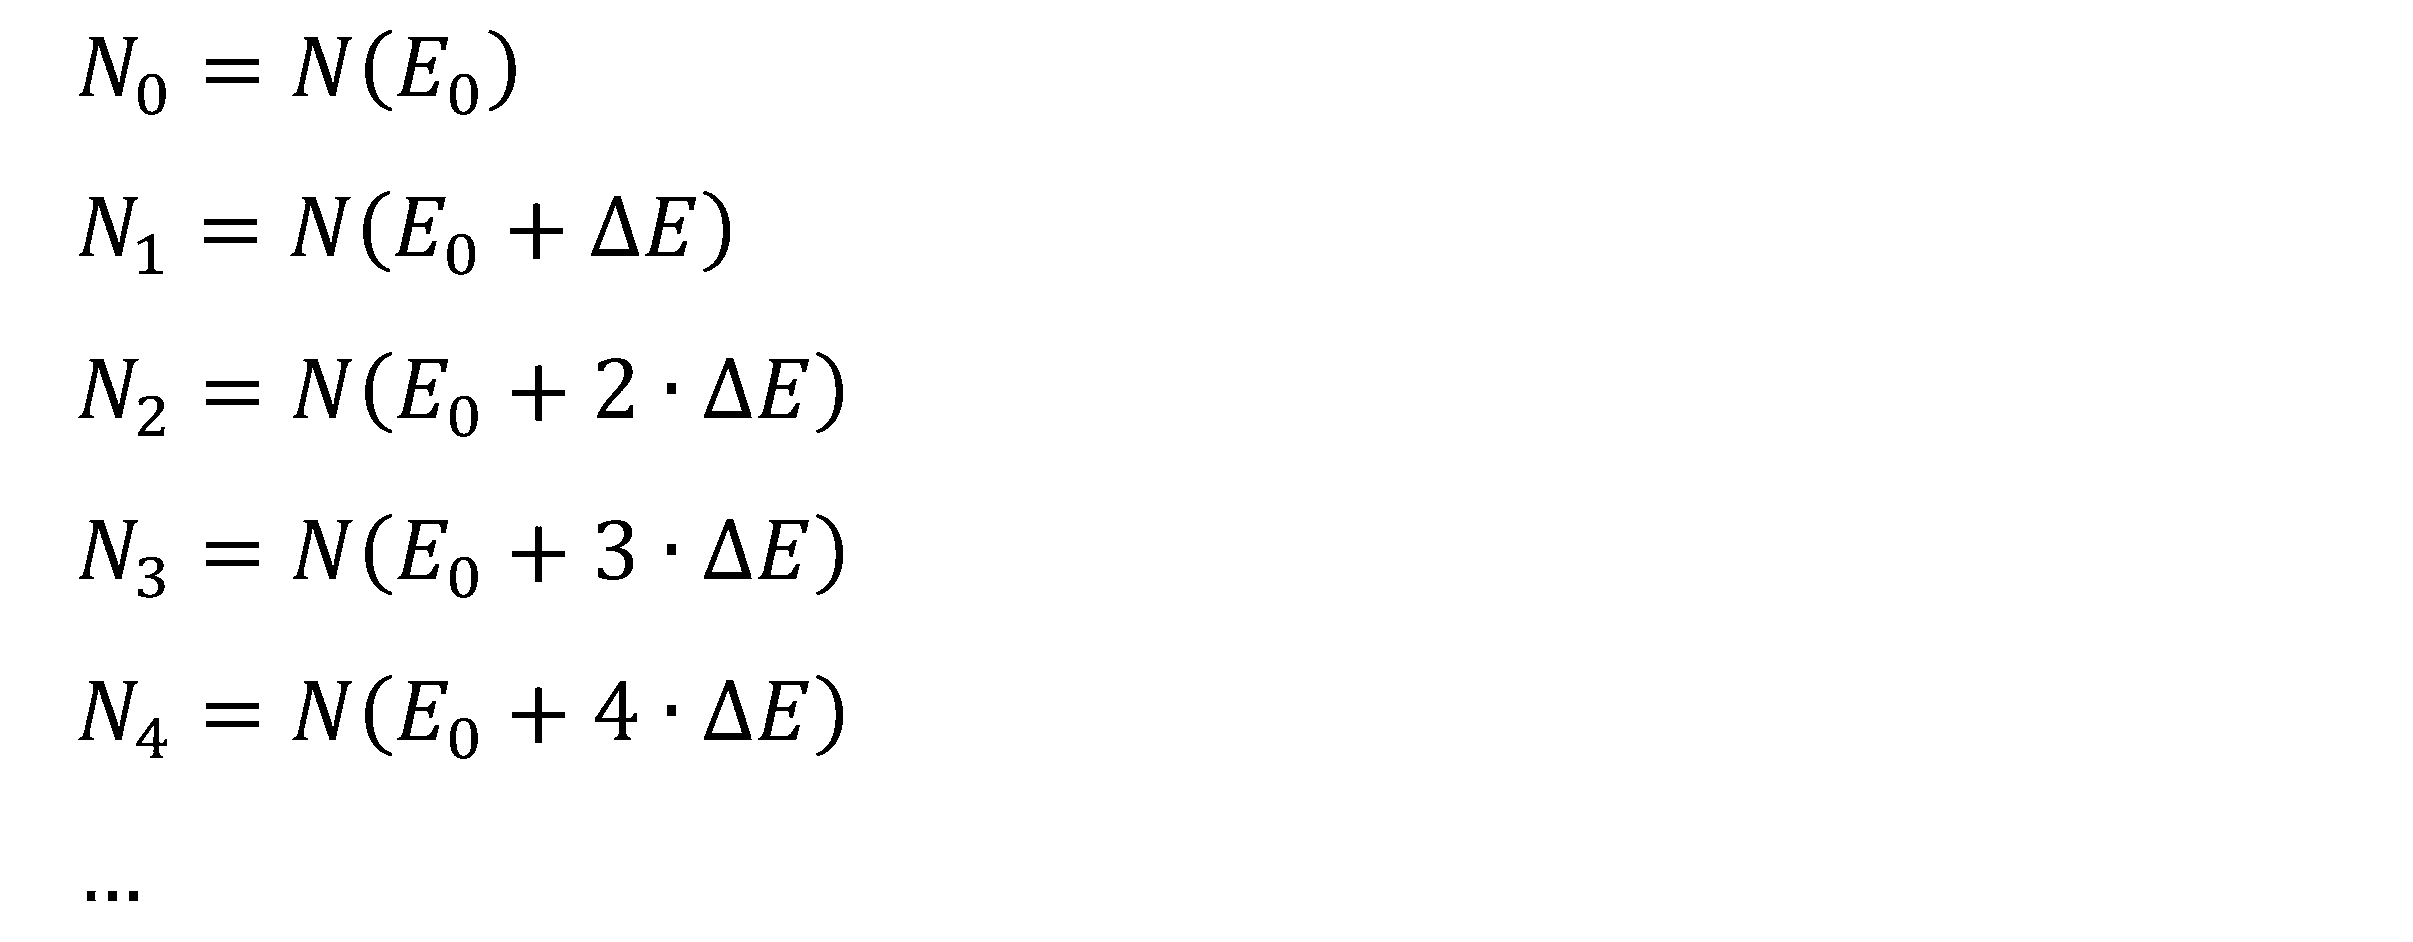
測定の開始エネルギーをE0とすると、電子の強度は、以下のようになる。 If the starting energy of the measurement is E 0 , the electron intensity is given by:
![]()
![]()
これを、以下のように表す。 This is expressed as follows:
微分も同様に表す。 Differentials are expressed in the same way.

任意の整数mにて、Nmの7点微分は次式で表される。 For any integer m, the seven-point differential of Nm is expressed by the following equation.

スペクトル強度は、ポアソン分布に従うため、Nmのノイズレベルσmは以下のように表される。 Since the spectral intensity follows a Poisson distribution, the noise level σ m of N m is expressed as follows:

Nmは信号成分Smとノイズ成分σmの和で表される。 Nm is expressed as the sum of a signal component Sm and a noise component σm .
![]()
![]()
そのため、Nmの7点微分は以下のようになる。 Therefore, the seven-point differential of Nm is:

だたし、DsmはDmの信号成分、DσmはDmのノイズ成分である。 However, Dsm is the signal component of Dm , and Dσm is the noise component of Dm .
以下では、Sm-3~Sm+3の強度はほぼ等しいと仮定する。σm-3~σm+3を確率変数としてみた場合、σm-3~σm+3の分散は、ほぼ等しいとみなすことができる。 In the following, it is assumed that the intensities of S m-3 to S m+3 are approximately equal. When σ m-3 to σ m+3 are regarded as random variables, the variances of σ m-3 to σ m+3 can be considered to be approximately equal.
以下では、スペクトル測定時のエネルギーステップΔE1を測定ステップと呼び、Savitzky-Golay法による微分計算時のエネルギーステップΔE(ΔE2)を微分ステップと呼ぶ。 Hereinafter, the energy step ΔE 1 during spectrum measurement will be referred to as a measurement step, and the energy step ΔE (ΔE 2 ) during differential calculation according to the Savitzky-Golay method will be referred to as a differential step.
まず、ΔE1/ΔE2=1、すなわち、測定ステップと微分ステップが等しい場合のノイズレベルを求める。 First, the noise level when ΔE 1 /ΔE 2 =1, that is, when the measurement step and the differentiation step are equal, is found.
各測定エネルギーでのノイズ成分は独立(確率変数が独立)である。そのため、強度Nmのノイズ成分σmは以下のようになる。 The noise components at each measured energy are independent (random variables are independent), so the noise component σ m of intensity N m is given by

上記式からエネルギーステップΔEが大きいほどノイズレベルが小さくなることがわかる。ただし、微分計算するためのエネルギー幅はΔEに比例するため、微分計算時のエネルギー幅とノイズレベルにはトレードオフの関係がある。 From the above formula, we can see that the larger the energy step ΔE, the smaller the noise level. However, since the energy width for differential calculation is proportional to ΔE, there is a trade-off between the energy width during differential calculation and the noise level.
次に、ΔE1/ΔE2=2、すなわち、測定ステップが微分ステップの2倍のときのノイズレベルを求める。 Next, the noise level when ΔE 1 /ΔE 2 =2, that is, the measurement step is twice the differential step, is calculated.
測定ステップが微分ステップの2倍になる場合、測定ステップを2・ΔEとし、微分ステップをΔEとすればよい。 If the measurement step is twice the differential step, then the measurement step should be 2·ΔE and the differential step should be ΔE.
Savitzky-Golay法による微分計算を行うため、測定ステップ2・ΔEのスペクトルを直線補完によりステップ変換を行う。
To perform differential calculations using the Savitzky-Golay method, a step conversion is performed on the spectrum of
これに対して、直線補完は以下のようになる。 In contrast, linear interpolation looks like this:

このときのDσmはmが偶数のときと奇数のときで異なる。 In this case, D σm differs depending on whether m is an even number or an odd number.
mが偶数(m modulo2=0)のときは、Dσmは次式のようになる。 When m is an even number (m modulo 2=0), D σm is expressed by the following equation.
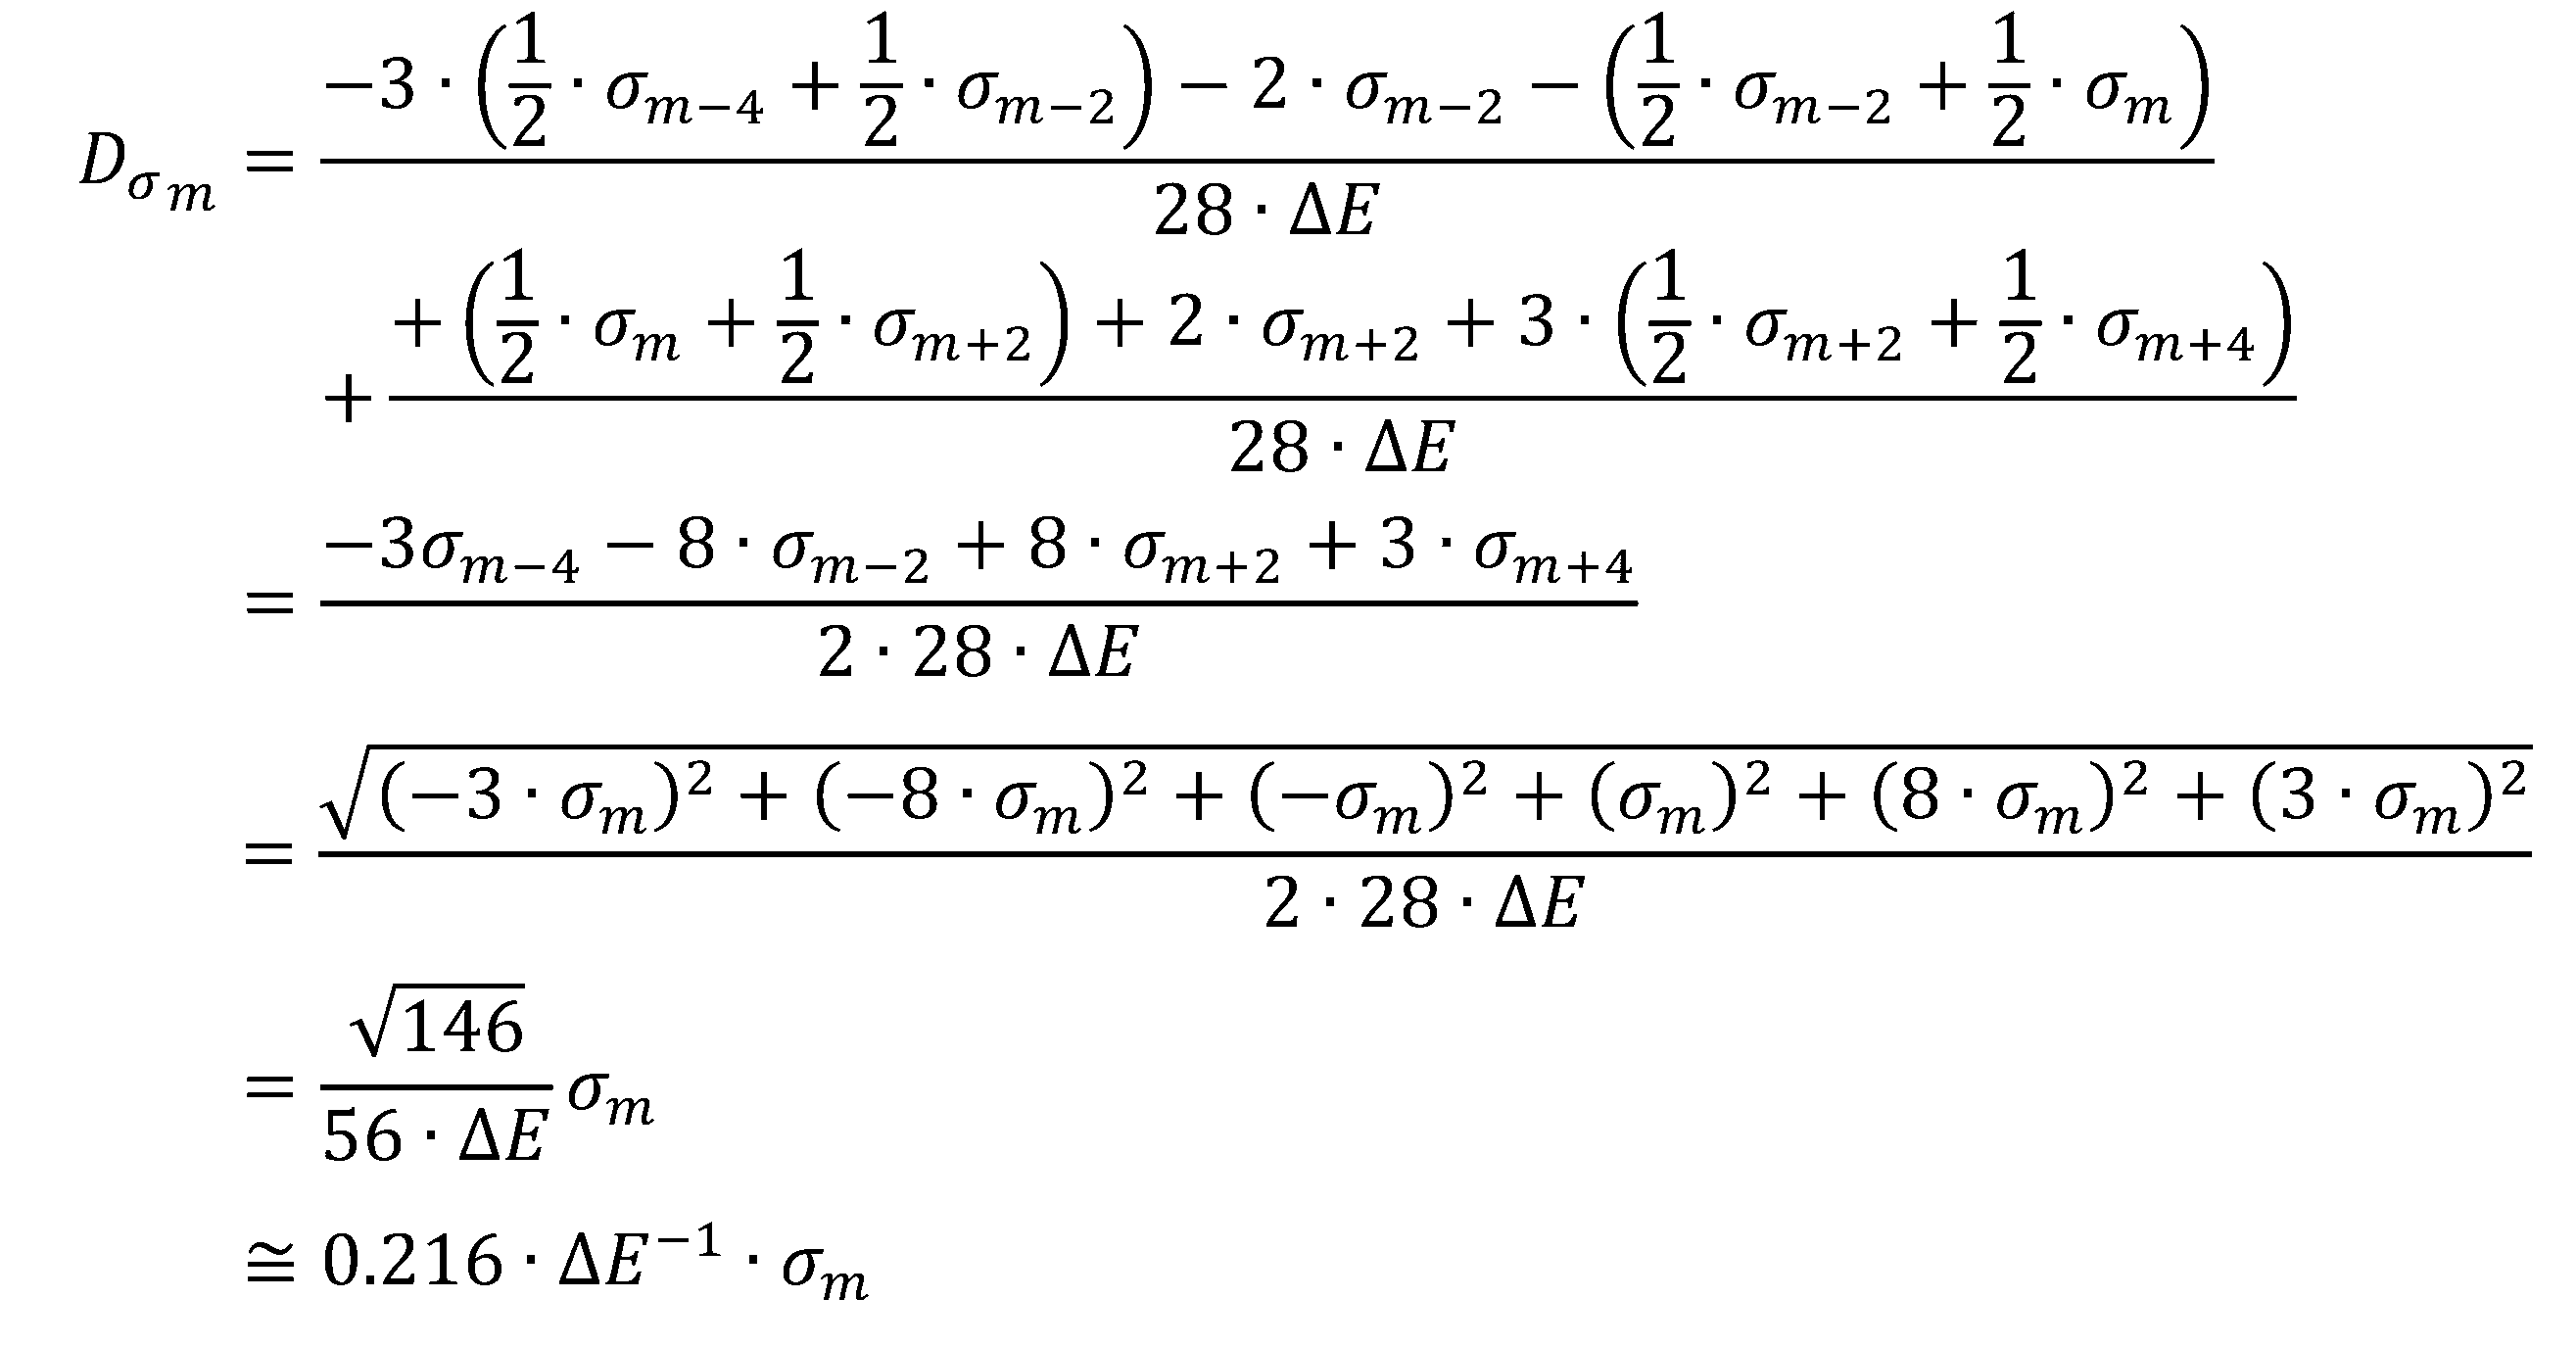
mが奇数(m modulo2=1)のときは、Dσmは次式のようになる。 When m is an odd number (m modulo 2=1), D σm is expressed by the following equation.

自然数Mに対してΔE1/ΔE2=M、すなわち、測定ステップが微分ステップのM倍のとき、ノイズレベルの計算結果のみを以下に示す。 When ΔE 1 /ΔE 2 =M for a natural number M, that is, when the measurement step is M times the differentiation step, only the calculation results of the noise level are shown below.
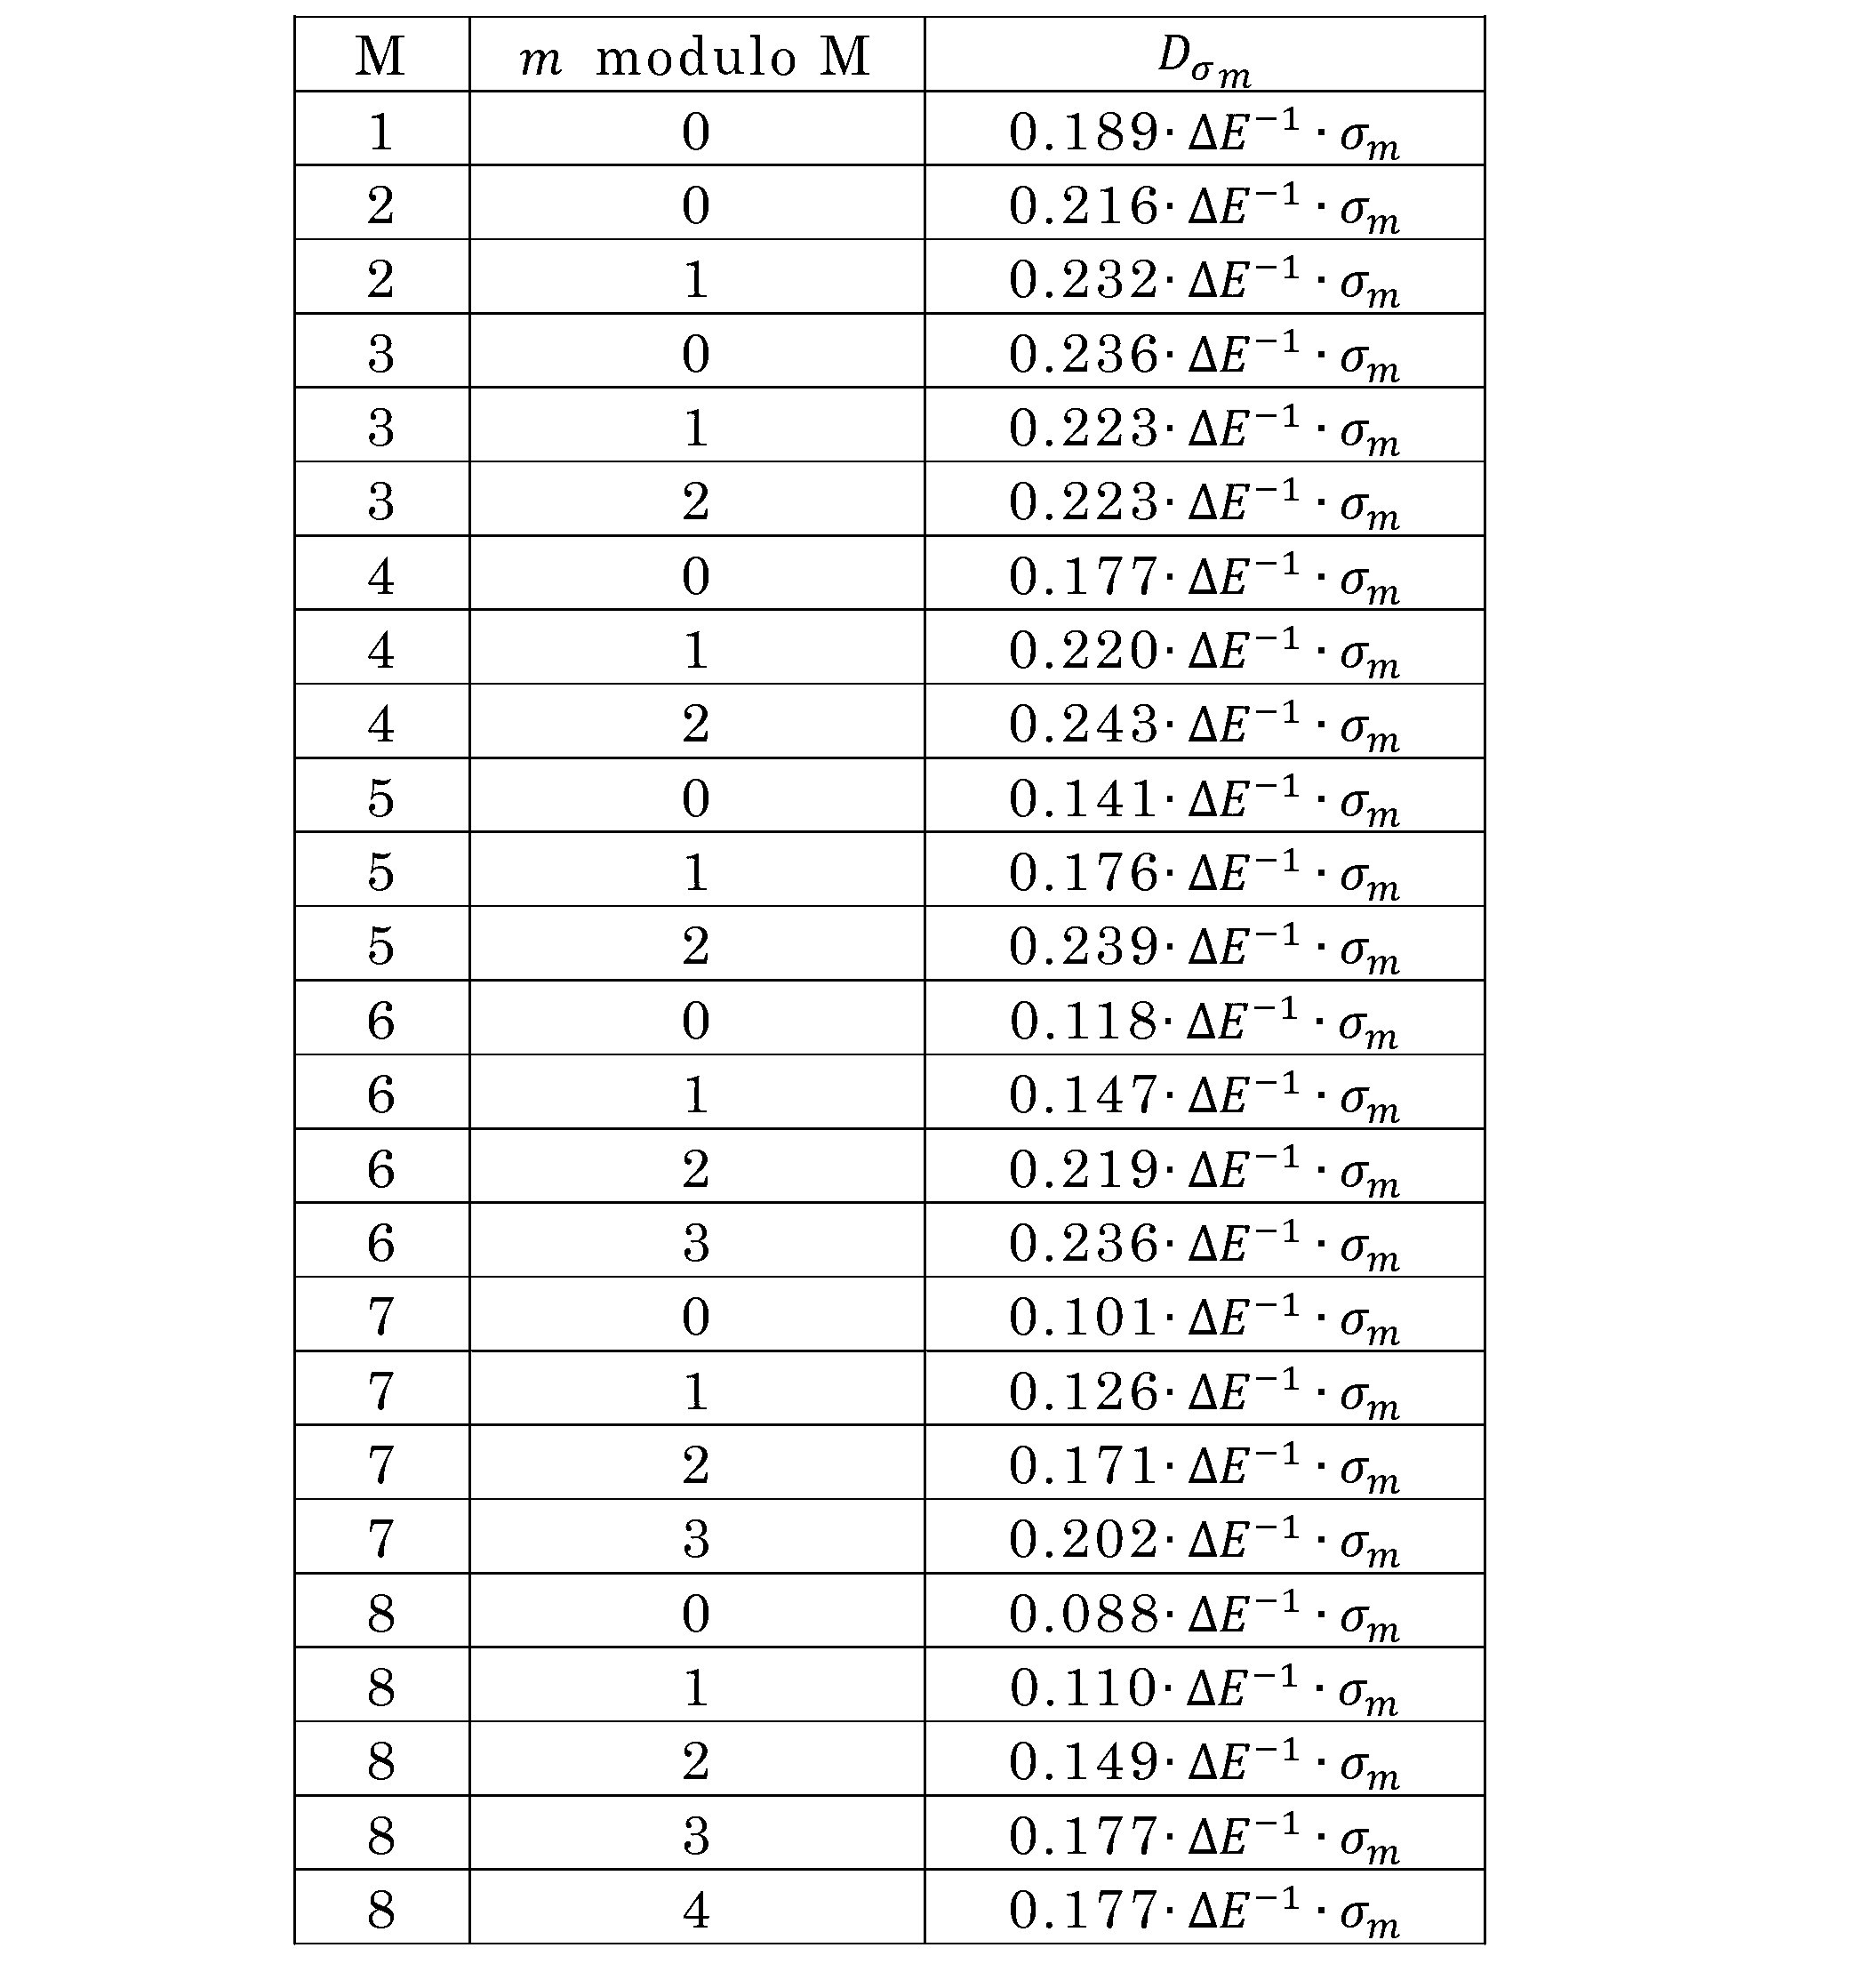
図18は、測定ステップが微分ステップのM倍のときのノイズレベルの計算結果を表すグラフである。なお、図18に示すグラフでは、ノイズレベルをM=1でのDσmを1として規格化している。 18 is a graph showing the calculation results of the noise level when the measurement step is M times the differential step. Note that in the graph shown in FIG. 18, the noise level is normalized with D σm being 1 when M=1.
上記のノイズレベルの計算結果を示す表およびグラフでは、測定ステップが異なるため、測定時間も異なる。測定ステップが大きくなるほど、各測定エネルギーでの測定時間を長くすることで、M=1での測定時間と同じ測定時間になるように規格化する。 In the table and graph showing the noise level calculation results above, the measurement steps are different, so the measurement times are also different. The larger the measurement step, the longer the measurement time at each measurement energy is, and the measurement time is normalized to be the same as the measurement time at M=1.
測定ステップがM倍のとき、測定時間もM倍となり、スペクトル強度もM倍となる。そのため、SN比はM1/2倍向上する。 When the measurement steps are M times, the measurement time also becomes M times and the spectrum intensity also becomes M times, so the S/N ratio is improved by M 1/2 times.
図19は、M=1での測定時間で規格化したDσmを示すグラフである。図19に示すグラフから測定ステップを大きくするとノイズ成分が小さくなることがわかる。例えば、測定ステップを4倍にすると、ノイズ成分は約1/2になる。 Fig. 19 is a graph showing D σm normalized by the measurement time when M = 1. It can be seen from the graph shown in Fig. 19 that the noise component decreases when the measurement step is increased. For example, when the measurement step is increased by four times, the noise component becomes about 1/2.
測定ステップと微分ステップが異なる場合、N(E)の内挿を行ってから微分計算を行った。ここでは、測定時のエネルギーと微分時のエネルギーを0以上ΔE以下でシフトさせる。 When the measurement step and the differentiation step are different, N(E) is interpolated before the differentiation calculation. Here, the energy at the time of measurement and the energy at the time of differentiation are shifted by 0 or more and ΔE or less.
測定時のエネルギーE0、E0+ΔE、E0+2・ΔE、・・・における電子のカウン
ト数N0、N1、N2、・・・は、以下のように表される。
The electron count numbers N 0 , N 1 , N 2 , . . . at energies E 0 , E 0 + ΔE, E 0 + 2·ΔE, .

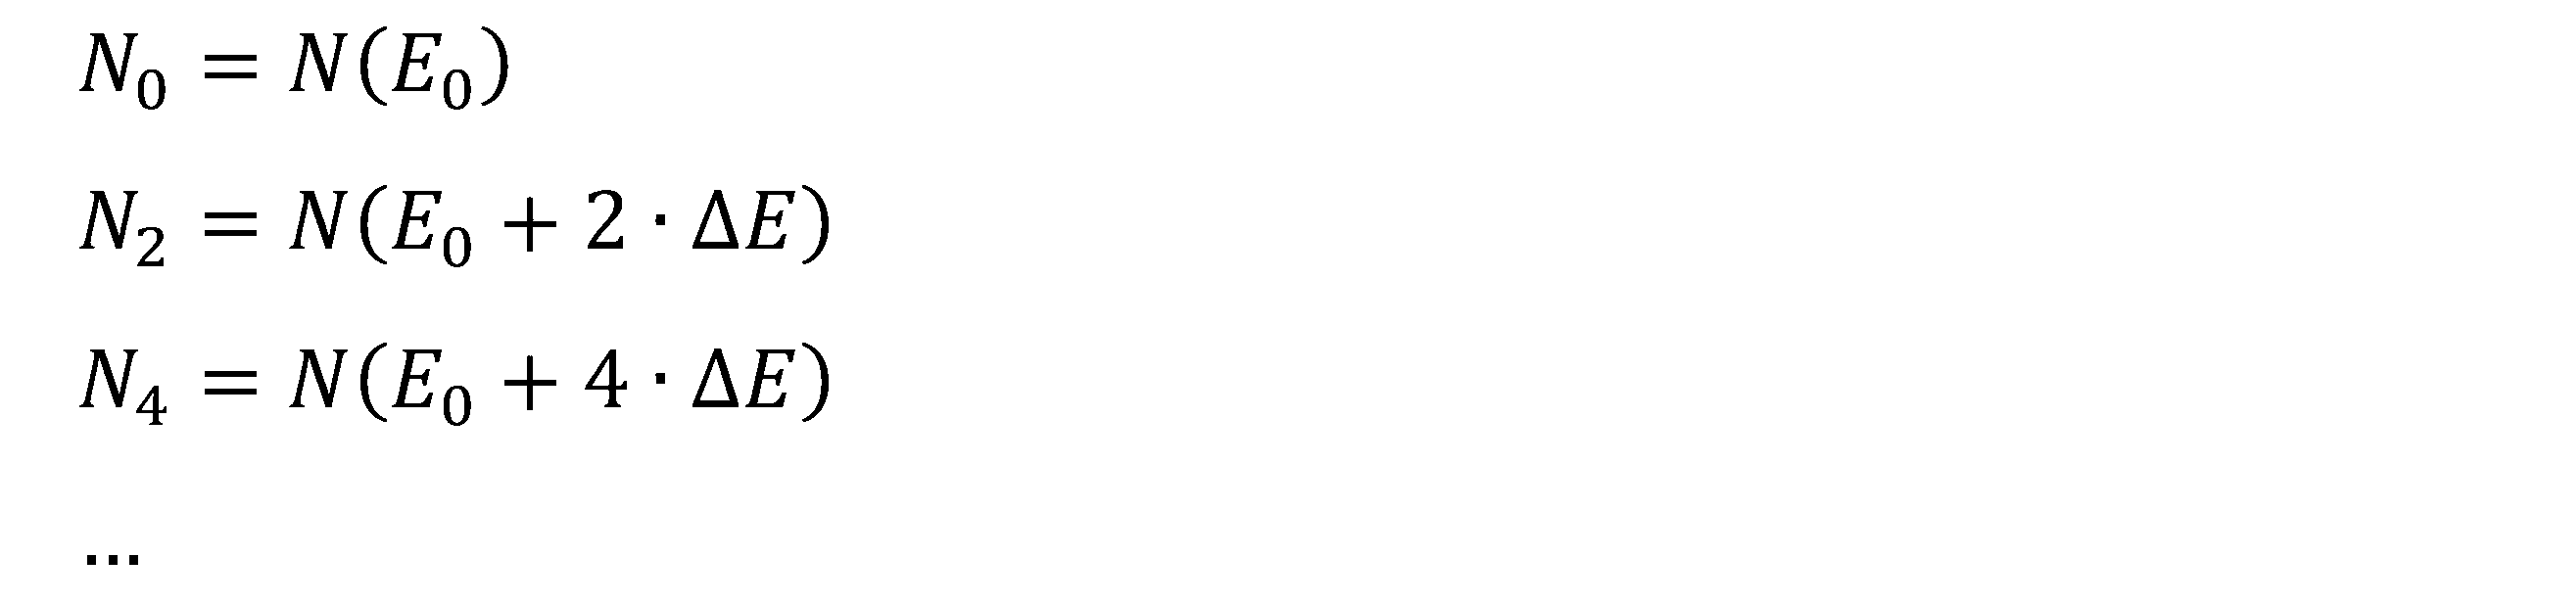
微分時のエネルギーを(1/2)・ΔEだけシフトした場合、以下のように内挿する。 If the energy during differentiation is shifted by (1/2)·ΔE, the interpolation is done as follows:

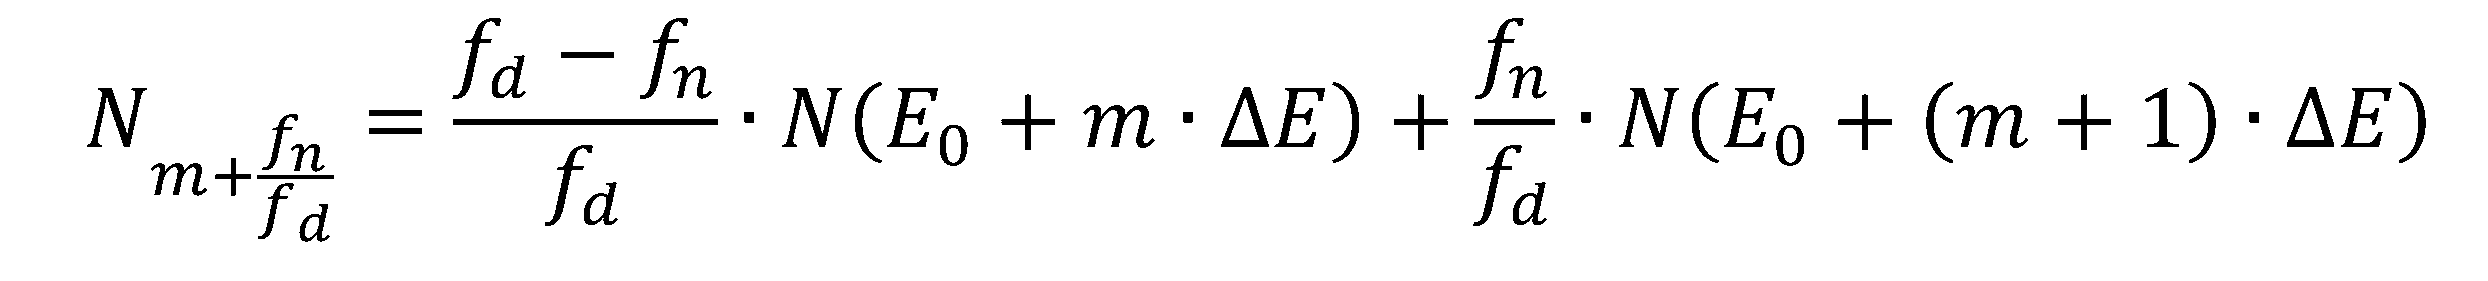
また、エネルギーを(fn/fd)・ΔEだけシフトした場合、以下の計算式で内挿する。 Moreover, when the energy is shifted by (f n /f d )·ΔE, the following calculation formula is used for interpolation.
測定時のエネルギーをシフトすると、隣り合ったエネルギーステップでノイズ成分の独立成分と従属成分が変化する。よって、微分時のDσmも変化する。 When the energy during measurement is shifted, the independent and dependent components of the noise components change between adjacent energy steps, and therefore Dσm during differentiation also changes.
図20は、M=1での測定時間で規格化したDσmである。ただし、微分時のエネルギ
ーを(1/2)・ΔEだけシフトしてからDσmを計算した。
Fig. 20 shows D σm normalized by the measurement time when M = 1. However, D σm was calculated after shifting the energy at the time of differentiation by (1/2)·ΔE.
図21は、微分時のエネルギーシフトがゼロ、および(1/2)・ΔEの場合を比較したグラフである。なお、各項目の左側の棒がシフトがゼロの場合であり、右側の棒がシフトが(1/2)・ΔEの場合である。 Figure 21 is a graph comparing cases where the energy shift during differentiation is zero and (1/2)·ΔE. Note that the left bar for each item is the case where the shift is zero, and the right bar is the case where the shift is (1/2)·ΔE.
微分時のエネルギーをシフトするか否かに関わらす、Mを大きくするほどノイズレベルが小さくなることがわかる。また、微分時のエネルギーをシフトしてから内挿した場合であっても、ノイズレベルの変動量は数十パーセントであり、ノイズレベルが2倍以上変化しない。 It can be seen that the noise level decreases as M increases, regardless of whether the energy during differentiation is shifted or not. Furthermore, even when the energy during differentiation is shifted before interpolation, the noise level fluctuates by only a few tens of percent, and the noise level does not change by more than a factor of two.
この特徴はシフトがゼロの場合、およびシフトが(1/2)・ΔEの場合だけでなく、0以上ΔE以下のいかなるシフトでも同様と考えられる。 This characteristic is believed to be true not only when the shift is zero or when the shift is (1/2)·ΔE, but also for any shift between 0 and ΔE.
電子分光装置で取得したスペクトルは、多チャンネルの信号を積算して1つのスペクトルとする。ただし、多チャンネルの検出器で同時に取得できる電子のエネルギーは異なるため、各チャンネルの信号のエネルギー変換を行う。エネルギー変換後の信号強度は内挿によって計算する。 The spectrum obtained by the electron spectrometer is created by accumulating the signals from multiple channels to create a single spectrum. However, because the electron energies that can be simultaneously obtained by multi-channel detectors differ, energy conversion is performed on the signals from each channel. The signal intensity after energy conversion is calculated by interpolation.
ここで、Dσmに対して、Mごとに剰計(m modulo M)の平均を計算する。さらに、Dσmに対して、Mごとにシフトがゼロの場合、および(1/2)・ΔEの場合の平均を計算する。 Here, for D σm , we calculate the average of the modulo sum (m modulo M) for each M. Furthermore, for D σm , we calculate the average for the zero shift and for (½)·ΔE for each M.
図22は、Dσmを平均した結果を示すグラフである。図22に示すグラフでは、測定ステップが微分ステップの整数倍のときのノイズレベルの概算を示している。図22に示すグラフから、測定ステップを大きくしたときのノイズレベルの変化を見積もることができる。 Fig. 22 is a graph showing the results of averaging Dσm . The graph shown in Fig. 22 shows an estimate of the noise level when the measurement step is an integer multiple of the differentiation step. From the graph shown in Fig. 22, it is possible to estimate the change in the noise level when the measurement step is increased.
測定ステップと微分ステップが異なる場合であってもスペクトル生成時のノイズレベルの概算は見積り済みである。見積もった結果からは、測定ステップが大きくなるほど、ノイズレベルが小さくなることがわかる。 The noise level during spectrum generation has been roughly estimated even when the measurement step and differentiation step are different. The estimated results show that the larger the measurement step, the smaller the noise level.
(2)エネルギーステップとスペクトルの歪みについて
次に、測定ステップとスペクトルのピークの歪みの関係について説明する。
(2) Energy Step and Spectral Distortion Next, the relationship between the measurement step and the distortion of the spectral peak will be described.
図23は、分解能関数を示す図である。図23に示す分解能関数は、2000eVにピークがあり、ΔE(半値全幅)が12eVである。なお、ここでは、便宜上、分解能関数をガウス分布で図示している。 Figure 23 shows the resolution function. The resolution function shown in Figure 23 has a peak at 2000 eV and a ΔE (full width at half maximum) of 12 eV. For convenience, the resolution function is shown here as a Gaussian distribution.
2000eV付近にてピークの最大強度の半分の強度を検知するためには、測定ステップを12eV(ΔE)以下にする必要がある。ただし、オージェ電子ピークの定性分析では、ピーク形状の情報も利用するため、測定ステップは、ΔEよりも極めて小さくする必要がある。 In order to detect half the maximum intensity of the peak at around 2000 eV, the measurement step must be 12 eV (ΔE) or less. However, since qualitative analysis of Auger electron peaks also uses information on the peak shape, the measurement step must be much smaller than ΔE.
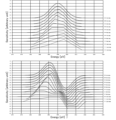
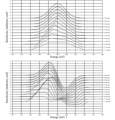
図24は、測定ステップを変化させたときの分解能関数を示す図である。測定していないエネルギーについては内挿している。図24では、測定ステップをΔE=1eVから12eVまで1eVずつ変化させたときの分解能関数を図示している。図25は、測定ステップを変化させたときの分解能関数を7点微分した結果を示すグラフである。 Figure 24 shows the resolution function when the measurement step is changed. Interpolation is performed for energies that are not measured. Figure 24 shows the resolution function when the measurement step is changed in 1 eV increments from ΔE = 1 eV to 12 eV. Figure 25 is a graph showing the results of seven-point differentiation of the resolution function when the measurement step is changed.
図26は、図24に示す分解能関数の測定開始エネルギーを+2eVずらしたときの分
解能関数およびその微分結果を示すグラフである。図27は、図24に示す分解能関数の測定開始エネルギーを+4eVずらしたときの分解能関数およびその微分結果を示すグラフである。図28は、図24に示す分解能関数の測定開始エネルギーを+6eVずらしたときの分解能関数およびその微分結果を示すグラフである。
Fig. 26 is a graph showing the resolution function and its differential result when the measurement start energy of the resolution function shown in Fig. 24 is shifted by +2 eV. Fig. 27 is a graph showing the resolution function and its differential result when the measurement start energy of the resolution function shown in Fig. 24 is shifted by +4 eV. Fig. 28 is a graph showing the resolution function and its differential result when the measurement start energy of the resolution function shown in Fig. 24 is shifted by +6 eV.
図25~図28に示すように、測定ステップが大きくなると、微分波形が歪んでいることがわかる。特に測定ステップが微分計算時のエネルギー幅を超えると、図示の例では6eVを超えると、微分波形の歪みが大きくなっている。測定開始エネルギーを変化させると、分解能関数の微分波形も変化する。 As shown in Figures 25 to 28, it can be seen that the differential waveform becomes distorted as the measurement step becomes larger. In particular, when the measurement step exceeds the energy width during differential calculation, in the illustrated example, when it exceeds 6 eV, the distortion of the differential waveform becomes large. When the measurement start energy is changed, the differential waveform of the resolution function also changes.
図29は、7個のスペクトルを積算した結果を示している。図29に示すように、7個のスペクトルを積算することで、波形がなめらかに連続する。ただし、測定ステップが大きくなるほど波形は歪む。 Figure 29 shows the results of accumulating seven spectra. As shown in Figure 29, accumulating seven spectra results in a smooth continuous waveform. However, the larger the measurement step, the more distorted the waveform becomes.
図24~図29に示す結果から、図23に示す分解能関数に対しては、測定ステップが4eV以下でピークの波形が歪まないことがわかる。 From the results shown in Figures 24 to 29, it can be seen that for the resolution function shown in Figure 23, the peak waveform is not distorted when the measurement step is 4 eV or less.
5. 効果
電子分光装置100では、処理部60は、分光器30において第1エネルギーステップΔE1(測定ステップ)でエネルギーを掃引し、分光器30でエネルギー分光された電子を複数のチャンネルトロン42で検出して得られた、複数の第1スペクトルを取得する処理と、複数の第1スペクトルの各々において測定点を補完する処理と、測定点が補完された複数の第1スペクトルに基づいて、第1エネルギーステップΔE1よりも小さい第2エネルギーステップΔE2の第2スペクトル(マルチスペクトル)を生成する処理と、を行う。そのため、電子分光装置100では、例えば、特定の1つのチャンネルトロンで電子を検出する場合と比べて、測定回数を低減できる。したがって、電子分光装置100では、スペクトルを収集するための測定時間を短くできる。
5. Effects In the
電子分光装置100では、スペクトル生成時のエネルギーステップΔE2は、測定時のエネルギーステップΔE1と異なる。そのため、電子分光装置100では、測定時およびスペクトル生成時のそれぞれにおいて、最適なエネルギーステップを設定できる。したがて、電子分光装置100では、スペクトルの測定に最適なエネルギーステップと、生成されたスペクトルを表示する際や、スペクトルの解析に最適なエネルギーステップが異なる場合であっても、それぞれに最適なエネルギーステップを設定できる。
In the
電子分光装置100では、処理部60は、測定点が補完された複数の第1スペクトルを積算または平均して、第2スペクトルを生成する。このように、測定点が補完された第1スペクトルを積算または平均することによって、検出感度のばらつきの影響を低減できる。したがって、電子分光装置100では、各チャンネルトロン42の検出感度を補正しなくてもよい。
In the
電子分光装置100では、処理部60は、エネルギー分解能の指定を受け付ける処理と、エネルギー分解能に基づいてエネルギーステップΔE1を設定する処理と、を行う。そのため、電子分光装置100では、ユーザーがエネルギーステップΔE1を設定しなくてもよい。
In the
電子分光装置100では、処理部60は、エネルギー分解能に基づいて隣り合うチャンネルトロン42間の測定エネルギー差とエネルギーステップΔE1の比dを設定し、比dに基づいてエネルギーステップΔE1を設定する。比dに基づいてエネルギーステップΔE1を設定することによって、容易にエネルギーステップΔE1を設定できる。
In the
電子分光装置100では、処理部60は、複数の第1スペクトルの各々の測定エネルギーが一致しないようにエネルギーステップΔE1を設定する。これにより、図14および図15に示す補完された測定点のみのエネルギー範囲Rを狭くできる。
In the
例えば、電子分光装置100では、処理部60は、比dを1よりも小さい値に設定する。比dを1よりも小さい値とすることによって、比dが1の場合と比べて、複数の第1スペクトルの各々において、一致する測定エネルギーの数を減らすことができる。これにより、図14および図15に示す補完された測定点のみのエネルギー範囲Rを狭くできる。
For example, in the
電子分光装置100を用いた分析方法は、分光器30において第1エネルギーステップΔE1でエネルギーを掃引し、分光器30でエネルギー分光された電子を複数のチャンネルトロン42で検出して、複数の第1スペクトルを取得する工程と、複数の第1スペクトルの各々において測定点を補完する工程と、測定点が補完された複数の第1スペクトルに基づいて、エネルギーステップΔE1よりも小さい第2エネルギーステップΔE2の第2スペクトルを生成する工程と、を含む。このような分析方法では、例えば、特定の1つのチャンネルトロンで電子を検出する場合と比べて、測定回数を低減できる。したがって、電子分光装置100を用いた分析方法では、スペクトルを収集するための測定時間を短くできる。
The analysis method using the
なお、上述した実施形態では、電子分光装置としてオージェ電子分光装置を説明したが、試料に照射する一次プローブは電子に限定されず、試料から電子を放出させるものであればよい。例えば、一次プローブをX線としてもよい。すなわち、本発明に係る電子分光装置は、X線光電子分光装置であってもよい。 In the above-described embodiment, an Auger electron spectroscopy device has been described as an electron spectroscopy device, but the primary probe irradiated to the sample is not limited to electrons, and may be anything that causes electrons to be emitted from the sample. For example, the primary probe may be an X-ray. In other words, the electron spectroscopy device according to the present invention may be an X-ray photoelectron spectroscopy device.
本発明は、上述した実施形態に限定されるものではなく、さらに種々の変形が可能である。例えば、本発明は、実施形態で説明した構成と実質的に同一の構成を含む。実質的に同一の構成とは、例えば、機能、方法、及び結果が同一の構成、あるいは目的及び効果が同一の構成である。また、本発明は、実施形態で説明した構成の本質的でない部分を置き換えた構成を含む。また、本発明は、実施形態で説明した構成と同一の作用効果を奏する構成又は同一の目的を達成することができる構成を含む。また、本発明は、実施形態で説明した構成に公知技術を付加した構成を含む。 The present invention is not limited to the above-described embodiments, and various modifications are possible. For example, the present invention includes configurations that are substantially the same as the configurations described in the embodiments. Substantially the same configurations are, for example, configurations that have the same functions, methods, and results, or configurations that have the same purpose and effect. The present invention also includes configurations in which non-essential parts of the configurations described in the embodiments are replaced. The present invention also includes configurations that have the same effects as the configurations described in the embodiments, or that can achieve the same purpose. The present invention also includes configurations in which publicly known technology is added to the configurations described in the embodiments.
10…電子線照射装置、12…電子銃、14…電子レンズ、16…偏向器、20…試料ステージ、30…分光器、32…インプットレンズ、33…静電レンズ、34…静電半球型アナライザー、35a…内半球電極、35b…外半球電極、40…検出器、42…チャンネルトロン、50…照射制御装置、52…分光器制御装置、54…計数演算装置、60…処理部、100…電子分光装置 10...electron beam irradiation device, 12...electron gun, 14...electron lens, 16...deflector, 20...sample stage, 30...spectroscope, 32...input lens, 33...electrostatic lens, 34...electrostatic hemispherical analyzer, 35a...inner hemispherical electrode, 35b...outer hemispherical electrode, 40...detector, 42...channeltron, 50...irradiation control device, 52...spectroscope control device, 54...counting calculation device, 60...processing unit, 100...electron spectrometer
Claims (5)
前記分光器でエネルギー分光された電子のエネルギー分散方向に並んで配置された複数の検出部を備えた検出器と、
処理部と、
を含み、
前記処理部は、
前記分光器において第1エネルギーステップでエネルギーを掃引し、前記分光器でエネルギー分光された電子を前記複数の検出部で検出して得られた、複数の第1スペクトルを取得する処理と、
前記複数の第1スペクトルの各々において、測定点を補完する処理と、
測定点が補完された前記複数の第1スペクトルを積算または平均して、前記第1エネルギーステップよりも小さい第2エネルギーステップの第2スペクトルを生成する処理と、
を行い、
前記処理部は、前記分光器において前記第1エネルギーステップでエネルギーを掃引して、前記検出部ごとに前記第1エネルギーステップの前記第1スペクトルを取得し、
前記処理部は、前記複数の第1スペクトルの各々の測定エネルギーが一致しないように、前記第1エネルギーステップを設定する、電子分光装置。 a spectrometer for energy-spectroscopically analyzing electrons emitted from the sample;
a detector including a plurality of detection units arranged side by side in an energy dispersion direction of the electrons energy-split by the spectrometer;
A processing section;
Including,
The processing unit includes:
a process of acquiring a plurality of first spectra obtained by sweeping energy in a first energy step in the spectrometer and detecting the electrons energy-spectroscopically separated by the spectrometer with the plurality of detection units;
A process of complementing a measurement point in each of the plurality of first spectra;
a process of integrating or averaging the plurality of first spectra with the interpolated measurement points to generate a second spectrum having a second energy step smaller than the first energy step;
Do the following:
the processing unit sweeps the energy in the spectrometer at the first energy step to obtain the first spectrum at the first energy step for each of the detection units;
The processing unit sets the first energy step so that measurement energies of the plurality of first spectra do not coincide with each other .
前記処理部は、
エネルギー分解能の指定を受け付ける処理と、
前記エネルギー分解能に基づいて、前記第1エネルギーステップを設定する処理と、
を行う、電子分光装置。 In claim 1 ,
The processing unit includes:
A process of receiving a designation of an energy resolution;
setting the first energy step based on the energy resolution;
An electron spectroscopy device that performs this function.
前記処理部は、
前記エネルギー分解能に基づいて隣り合う前記検出部間の測定エネルギー差と前記第1エネルギーステップの比を設定し、
前記比に基づいて、前記第1エネルギーステップを設定する、電子分光装置。 In claim 2 ,
The processing unit includes:
setting a ratio between a measurement energy difference between adjacent detection units and the first energy step based on the energy resolution;
The electron spectrometer sets the first energy step based on the ratio.
前記処理部は、前記比を1よりも小さい値に設定する、電子分光装置。 In claim 3 ,
The processing unit sets the ratio to a value smaller than 1.
前記分光器でエネルギー分光された電子のエネルギー分散方向に並んで配置された複数の検出部を備えた検出器と、
を含む、電子分光装置を用いた分析方法であって、
前記分光器において第1エネルギーステップでエネルギーを掃引し、前記分光器でエネルギー分光された電子を前記複数の検出部で検出して、複数の第1スペクトルを取得する工程と、
前記複数の第1スペクトルの各々において、測定点を補完する工程と、
測定点が補完された前記複数の第1スペクトルを積算または平均して、前記第1エネルギーステップよりも小さい第2エネルギーステップの第2スペクトルを生成する工程と、
を含み、
前記複数の第1スペクトルを取得する工程では、
前記分光器において前記第1エネルギーステップでエネルギーを掃引して、前記検出部ごとに前記第1エネルギーステップの前記第1スペクトルを取得し、
前記複数の第1スペクトルの各々の測定エネルギーが一致しないように、前記第1エネルギーステップを設定する、分析方法。 a spectrometer for energy-spectroscopically analyzing electrons emitted from the sample;
a detector including a plurality of detection units arranged side by side in an energy dispersion direction of the electrons energy-split by the spectrometer;
An analysis method using an electron spectrometer, comprising:
a step of sweeping energy in a first energy step in the spectrometer, and detecting electrons energy-spectroscopically separated by the spectrometer with the plurality of detection units to obtain a plurality of first spectra;
complementing measurement points in each of the plurality of first spectra;
integrating or averaging the plurality of first spectra with the interpolated measurement points to generate a second spectrum having a second energy step smaller than the first energy step;
Including ,
In the step of acquiring a plurality of first spectra,
sweeping energy in the spectrometer at the first energy step to obtain the first spectrum at the first energy step for each of the detection units;
An analysis method , comprising: setting the first energy step so that the measured energies of the plurality of first spectra do not coincide with each other.
Priority Applications (3)
| Application Number | Priority Date | Filing Date | Title |
|---|---|---|---|
| JP2022097319A JP7586856B2 (en) | 2022-06-16 | 2022-06-16 | Electron spectrometer and analysis method |
| EP23174747.8A EP4293704A1 (en) | 2022-06-16 | 2023-05-23 | Electron spectrometer and analytical method |
| US18/210,169 US20230411113A1 (en) | 2022-06-16 | 2023-06-15 | Electron Spectrometer and Analytical Method |
Applications Claiming Priority (1)
| Application Number | Priority Date | Filing Date | Title |
|---|---|---|---|
| JP2022097319A JP7586856B2 (en) | 2022-06-16 | 2022-06-16 | Electron spectrometer and analysis method |
Publications (2)
| Publication Number | Publication Date |
|---|---|
| JP2023183677A JP2023183677A (en) | 2023-12-28 |
| JP7586856B2 true JP7586856B2 (en) | 2024-11-19 |
Family
ID=86497475
Family Applications (1)
| Application Number | Title | Priority Date | Filing Date |
|---|---|---|---|
| JP2022097319A Active JP7586856B2 (en) | 2022-06-16 | 2022-06-16 | Electron spectrometer and analysis method |
Country Status (3)
| Country | Link |
|---|---|
| US (1) | US20230411113A1 (en) |
| EP (1) | EP4293704A1 (en) |
| JP (1) | JP7586856B2 (en) |
Citations (3)
| Publication number | Priority date | Publication date | Assignee | Title |
|---|---|---|---|---|
| JP2002323463A (en) | 2001-04-26 | 2002-11-08 | Shimadzu Corp | Electron beam analyzer |
| JP2002340827A (en) | 2001-05-11 | 2002-11-27 | Jeol Ltd | Electron spectrometer |
| JP2017204425A (en) | 2016-05-13 | 2017-11-16 | 日本電子株式会社 | Electron spectroscopic device and measuring method |
Family Cites Families (5)
| Publication number | Priority date | Publication date | Assignee | Title |
|---|---|---|---|---|
| US4476386A (en) * | 1980-06-11 | 1984-10-09 | Commonwealth Scientific And Industrial Research Organization | Method and apparatus for material analysis |
| GB8612099D0 (en) * | 1986-05-19 | 1986-06-25 | Vg Instr Group | Spectrometer |
| JP3143279B2 (en) * | 1993-09-03 | 2001-03-07 | 日本電子株式会社 | Electron energy analyzer |
| JP2001312994A (en) | 2000-04-26 | 2001-11-09 | Jeol Ltd | Electron spectrometer |
| US7569816B1 (en) * | 2007-01-15 | 2009-08-04 | Raymond Browning | Electron spectrometer |
-
2022
- 2022-06-16 JP JP2022097319A patent/JP7586856B2/en active Active
-
2023
- 2023-05-23 EP EP23174747.8A patent/EP4293704A1/en active Pending
- 2023-06-15 US US18/210,169 patent/US20230411113A1/en active Pending
Patent Citations (3)
| Publication number | Priority date | Publication date | Assignee | Title |
|---|---|---|---|---|
| JP2002323463A (en) | 2001-04-26 | 2002-11-08 | Shimadzu Corp | Electron beam analyzer |
| JP2002340827A (en) | 2001-05-11 | 2002-11-27 | Jeol Ltd | Electron spectrometer |
| JP2017204425A (en) | 2016-05-13 | 2017-11-16 | 日本電子株式会社 | Electron spectroscopic device and measuring method |
Also Published As
| Publication number | Publication date |
|---|---|
| US20230411113A1 (en) | 2023-12-21 |
| JP2023183677A (en) | 2023-12-28 |
| EP4293704A1 (en) | 2023-12-20 |
Similar Documents
| Publication | Publication Date | Title |
|---|---|---|
| CN102084229B (en) | Method and system for spectral data analysis | |
| JP5517584B2 (en) | electronic microscope | |
| US8027811B2 (en) | Processing of spectrometer pile-up events | |
| EP2653891A1 (en) | Method for analyzing an EDS signal | |
| WO2000041206A1 (en) | Element mapping device, scanning transmission electron microscope, and element mapping method | |
| JP2009250867A (en) | X-ray analyzer with energy dispersive x-ray spectrometer | |
| JP2011038939A (en) | Spectrum classification method and apparatus of energy-dispersive x-ray spectroscope | |
| JP6677571B2 (en) | Electron spectrometer and measuring method | |
| JP7586856B2 (en) | Electron spectrometer and analysis method | |
| EP3633361B1 (en) | Method of generating elemental map and surface analyzer | |
| JP2020051900A (en) | X-ray analysis signal processor | |
| US11698336B2 (en) | Analysis method and analysis apparatus | |
| JP7075601B2 (en) | Analytical method and analytical equipment | |
| CN101101269A (en) | Energy-dispersive radiation detection system and method for measuring the content of target elements | |
| US12429442B2 (en) | Scanning electron microscope and map display method for absorption edge structure | |
| JP6808693B2 (en) | X-ray analyzer and counting rate correction method | |
| JP2004265879A (en) | Element mapping apparatus, scanning transmission electron microscope, and element mapping method | |
| Uchida et al. | New Spectrum Imaging Method for Solid Surfaces with Secondary Electrons acquired over Wide Energy Range (> 1000 eV) | |
| WO2023026598A1 (en) | X-ray analysis device and wave height value prediction program | |
| Oliveira et al. | Energy weighting in a 2D-MHSP X-ray single photon detector | |
| WO2022162975A1 (en) | X-ray fluorescence analysis device | |
| Chatterjee | Electron Microprobe Analysis Course 12.141 | |
| Statham | Measuring performance of energy-dispersive X-ray systems | |
| JP7126928B2 (en) | Surface analysis device and surface analysis method | |
| EP4700378A1 (en) | Electron count and energy enhanced diffraction analysis |
Legal Events
| Date | Code | Title | Description |
|---|---|---|---|
| A621 | Written request for application examination |
Free format text: JAPANESE INTERMEDIATE CODE: A621 Effective date: 20230831 |
|
| A977 | Report on retrieval |
Free format text: JAPANESE INTERMEDIATE CODE: A971007 Effective date: 20240523 |
|
| A131 | Notification of reasons for refusal |
Free format text: JAPANESE INTERMEDIATE CODE: A131 Effective date: 20240604 |
|
| A521 | Request for written amendment filed |
Free format text: JAPANESE INTERMEDIATE CODE: A523 Effective date: 20240719 |
|
| TRDD | Decision of grant or rejection written | ||
| A01 | Written decision to grant a patent or to grant a registration (utility model) |
Free format text: JAPANESE INTERMEDIATE CODE: A01 Effective date: 20241029 |
|
| A61 | First payment of annual fees (during grant procedure) |
Free format text: JAPANESE INTERMEDIATE CODE: A61 Effective date: 20241107 |
|
| R150 | Certificate of patent or registration of utility model |
Ref document number: 7586856 Country of ref document: JP Free format text: JAPANESE INTERMEDIATE CODE: R150 |