JP7320137B2 - Automatic analyzer and automatic analysis method - Google Patents
Automatic analyzer and automatic analysis method Download PDFInfo
- Publication number
- JP7320137B2 JP7320137B2 JP2022538661A JP2022538661A JP7320137B2 JP 7320137 B2 JP7320137 B2 JP 7320137B2 JP 2022538661 A JP2022538661 A JP 2022538661A JP 2022538661 A JP2022538661 A JP 2022538661A JP 7320137 B2 JP7320137 B2 JP 7320137B2
- Authority
- JP
- Japan
- Prior art keywords
- reaction
- process data
- reaction process
- absorbance
- variation
- Prior art date
- Legal status (The legal status is an assumption and is not a legal conclusion. Google has not performed a legal analysis and makes no representation as to the accuracy of the status listed.)
- Active
Links
Images


Classifications
-
- G—PHYSICS
- G01—MEASURING; TESTING
- G01N—INVESTIGATING OR ANALYSING MATERIALS BY DETERMINING THEIR CHEMICAL OR PHYSICAL PROPERTIES
- G01N35/00—Automatic analysis not limited to methods or materials provided for in any single one of groups G01N1/00 - G01N33/00; Handling materials therefor
Description
本発明は、自動分析装置および自動分析方法に関し、例えば、検体と試薬との反応液に対する吸光度に基づいて、検体に含まれる特定成分の濃度を測定する自動分析装置および自動分析方法に適用して有効な技術に関する。 TECHNICAL FIELD The present invention relates to an automatic analyzer and an automatic analysis method, for example, applied to an automatic analyzer and an automatic analysis method for measuring the concentration of a specific component contained in a specimen based on the absorbance of a reaction liquid between the specimen and a reagent. Regarding effective technology.
特開2006-337125号公報(特許文献1)には、本反応における反応過程データに対して近似関数を導入して、光度計のノイズなどに起因する反応過程データの乱れの影響を除去することにより、予測値の計算や乖離が大きい吸光度があった場合に測定者に警告する技術が記載されている。 Japanese Patent Application Laid-Open No. 2006-337125 (Patent Document 1) introduces an approximation function to the reaction process data in this reaction to remove the influence of disturbance of the reaction process data caused by noise of the photometer. describes a technique for calculating a predicted value and warning the measurer when there is an absorbance with a large divergence.
特開2010-271095号公報(特許文献2)には、本反応におけるレート分析法の項目に対して複数の測定点のデータを使用して近似式を選択することにより、検体が適切に測定できているかということと、自動分析装置を構成する撹拌機構が正常に機能しているかということを評価可能な技術が記載されている。 Japanese Patent Application Laid-Open No. 2010-271095 (Patent Document 2) discloses that the specimen can be measured appropriately by selecting an approximation formula using data of a plurality of measurement points for the item of the rate analysis method in this reaction. This document describes a technique that can evaluate whether or not the sample is being tested and whether or not the stirring mechanism that constitutes the automatic analyzer is functioning normally.
特開2015-197370号公報(特許文献3)には、血液凝固反応に基づく異常な反応過程曲線を正確に検出および分類することができる技術が記載されている。 Japanese Patent Application Laid-Open No. 2015-197370 (Patent Document 3) describes a technique capable of accurately detecting and classifying abnormal reaction process curves based on blood coagulation reactions.
自動分析装置は、血液や尿等の検体に含まれる特定成分の濃度の測定に用いられる。より具体的には、検体と各成分に対応する試薬を反応させた反応液に対して測定された吸光度が、予め作成された検量線を用いて特定成分の濃度に換算される。 Automatic analyzers are used to measure the concentration of specific components contained in specimens such as blood and urine. More specifically, the absorbance measured with respect to the reaction liquid obtained by reacting the specimen with the reagent corresponding to each component is converted to the concentration of the specific component using a calibration curve prepared in advance.
ここで、検量線は、特定成分の濃度が既知である標準液と試薬を反応させた反応液の吸光度の測定を含むキャリブレーションの実行により作成される。 Here, the calibration curve is created by performing calibration including measurement of absorbance of a reaction solution in which a standard solution having a known concentration of a specific component and a reagent are reacted.
分析性能を左右する要因としては、自動分析装置を構成する機構である患者から採取した検体のサンプリング機構、試薬分注機構、撹拌機構、光学系、恒温槽などを挙げることができる。また、分析性能を左右する自動分析装置以外の要因としては、試薬、コントロール検体の液性、患者検体に含まれる成分などを挙げることができる。 Factors that influence analysis performance include a sampling mechanism for samples collected from patients, a reagent dispensing mechanism, a stirring mechanism, an optical system, and a constant temperature bath, which are constituent mechanisms of the automatic analyzer. Factors other than the automatic analyzer that affect the analytical performance include reagents, liquid properties of control specimens, components contained in patient specimens, and the like.
測定者は、自動分析装置や試薬等の状態を確認するためにキャリブレーション後に精度管理試料を測定してから、検体に含まれる成分を測定する。測定者は、検体の測定の間に精度管理試料を繰り返し測定して、検体の測定結果が妥当であるか確認している。 The measurer measures the quality control sample after calibration in order to check the state of the automatic analyzer, reagents, etc., and then measures the components contained in the sample. During the sample measurement, the measurer repeatedly measures the quality control sample to confirm whether the sample measurement result is valid.
試料と試薬との反応中に、吸光度が複数回測定され、時系列データとして記録される。この時系列データは反応過程データとも呼ばれている。 During the reaction between the sample and the reagent, the absorbance is measured multiple times and recorded as time series data. This time-series data is also called reaction process data.
反応過程データに異常がないかをデータチェックする方法があり、そのチェック方法は、レート法とエンドポイント法の2種類に分類することができる。 There is a data check method for whether or not there is an abnormality in the reaction process data, and the check method can be classified into two types, the rate method and the endpoint method.
レート法は、主に、検体に含まれる酵素成分の活性を測定するときに使用される。生化学項目の試薬には十分な気質が含まれているため、検体と試薬の反応が正常に行われていれば、一般に反応は時間変化に対して、吸光度が一定量ずつ直線的に変化する。 A rate method is mainly used when measuring the activity of an enzyme component contained in a specimen. Reagents for biochemical items contain sufficient temperament, so if the reaction between the specimen and the reagent is carried out normally, the reaction will generally change linearly by a constant amount of absorbance with respect to time change. .
レート法における測定時の従来のデータ異常を検知する方法には、リニアリティチェックとABSリミットがある。リニアリティチェックは、レート法の分析項目において,吸光度変化の直線性をチェックする。一定の測光範囲の前半と後半の吸光度変化量の差を求め、その差が指定したリニアリティチェック値を超えていた場合に直線ではないと判断する。また、測定する試料の濃度または酵素活性値が異常に高く、試薬の測定可能範囲を超えた場合には試薬中の基質または補酵素が測光時間前に全て消費されて、急激に吸光度値が変化して正しい測定値が得られない。このため、吸光度の上限または下限の反応吸光限界値(ABSリミット)を設定してデータの異常を検知する。 Conventional methods for detecting data anomalies during measurement in the rate method include a linearity check and an ABS limit. The linearity check checks the linearity of absorbance change in the analysis items of the rate method. The difference between the amount of change in absorbance in the first half and the second half of a given photometric range is obtained, and if the difference exceeds the specified linearity check value, it is determined that the line is not straight. Also, if the concentration of the sample to be measured or the enzyme activity value is abnormally high and exceeds the measurable range of the reagent, the substrate or coenzyme in the reagent will be completely consumed before the photometric time, resulting in a sudden change in the absorbance value. correct measurements are not obtained. For this reason, a reaction absorbance limit value (ABS limit), which is the upper limit or the lower limit of absorbance, is set to detect data anomalies.
エンドポイント法は、主に試料に含まれる蛋白質や脂質などの成分の濃度を測定する。試料中の成分と試薬が反応して生成される物質は時間と共に一定量に漸近する。このため、計測値も時間と共に一定値に漸近する。 The endpoint method mainly measures the concentration of components such as proteins and lipids contained in samples. The substance produced by the reaction between the components in the sample and the reagent approaches a constant amount with time. Therefore, the measured value also asymptotically approaches a constant value with time.
エンドポイント法における測定時の従来のデータ異常を検知する方法には、プロゾーンチェックがある。IgA(免疫グロブリンA)やCRP(C反応性蛋白)などの免疫比濁法を用いた試薬では、試薬組成分の塩濃度の影響により蛋白質が沈殿物として析出してしまう場合がある。この沈殿物によって反応過程データが揺らぐ場合があり、実際には反応時間の後半部分に現れる場合が多い。濃度演算に用いる測光ポイント部に、この揺らぎが起きた場合には正確に測定値を得ることができない。これをチェックする方法として、抗体再添加法と反応速度比法があり、いずれもパラメータで指定した限界値を超えるとアラームを出すという方法がある。 A prozone check is a conventional method for detecting abnormal data during measurement in the endpoint method. In reagents using immunoturbidimetry, such as IgA (immunoglobulin A) and CRP (C-reactive protein), the protein may precipitate as a precipitate due to the salt concentration of the reagent composition. Reaction process data may fluctuate due to this precipitate, and in fact it often appears in the latter half of the reaction time. Accurate measurement values cannot be obtained if this fluctuation occurs in the photometric point portion used for density calculation. Methods for checking this include the antibody re-addition method and the reaction rate ratio method, both of which issue an alarm when the limit value specified by the parameter is exceeded.
生化学分析の多くの項目は、特定成分の濃度を検出するための本反応と、妨害成分を除去する前処理反応で構成されることが多い。具体的には、検体と第1の試薬とを反応させる前処理反応を実施した後、検体と第1の試薬以外の第2試薬、第3の試薬とを反応させる本反応が実施される。ここで、例えば、本反応で使用される第1の試薬以外の第2試薬、第3の試薬は、検体に含まれる特定成分と反応させる試薬である。 Many items of biochemical analysis are often composed of a main reaction for detecting the concentration of a specific component and a pretreatment reaction for removing interfering components. Specifically, after performing a pretreatment reaction for reacting the specimen with the first reagent, the main reaction is performed for reacting the specimen with a second reagent other than the first reagent and a third reagent. Here, for example, the second reagent other than the first reagent and the third reagent used in this reaction are reagents to be reacted with specific components contained in the specimen.
例えば、検体と試薬との反応液に対する吸光度に基づいて検体に含まれる特定成分の濃度を測定する場合、本反応における反応過程データに基づいて取得された吸光度と前処理反応における反応過程データに基づいて取得された吸光度の差分を取ることにより、特定成分の濃度が測定される。 For example, when measuring the concentration of a specific component contained in a specimen based on the absorbance of the reaction solution of the specimen and reagent, the absorbance obtained based on the reaction process data in the main reaction and the reaction process data in the pretreatment reaction The concentration of the specific component is measured by taking the difference between the absorbances obtained by
ここで、個々の検体の測定結果の基となる反応過程データは、検体に含まれる成分により、意図せず変動することがある。この反応過程データの変動は、検体の測定結果に影響を及ぼす可能性がある。また、自動分析装置を構成する分注系、光学系、撹拌、洗浄等の不良によっても反応過程データが変動することがある。 Here, the reaction process data on which the measurement results of individual specimens are based may unintentionally fluctuate depending on the components contained in the specimen. Fluctuations in this reaction process data may affect the measurement results of the specimen. In addition, reaction process data may fluctuate due to defects in the pipetting system, optical system, stirring, washing, etc. that constitute the automatic analyzer.
これらの反応過程データの変動をチェックするためには、日常検査業務の中で、自動分析装置の使用者である検査技師が、膨大な反応過程データを目視でチェックすることが求められるが、実施することは困難である。その中でも、測定結果が基準範囲付近のデータでは反応の異常を見逃す可能性が高くなり、妥当な測定結果を得ることが困難である。したがって、反応過程データの変動を検出する技術が必要である。 In order to check for fluctuations in these reaction process data, laboratory technicians, who are users of automated analyzers, are required to visually check the vast amount of reaction process data in routine laboratory work. It is difficult to In particular, when the measurement results are in the vicinity of the reference range, there is a high possibility of overlooking reaction abnormalities, making it difficult to obtain appropriate measurement results. Therefore, there is a need for techniques to detect variations in reaction process data.
この点に関し、上述した特許文献1や特許文献2に代表される従来の反応過程近似法を使用した技術では、特定成分の濃度を検出するための本反応を活用している。これらの技術では、本反応での反応過程データの異常を検出することは可能であるが、前処理反応で発生している反応過程データの異常については検出することはできない。すなわち、従来技術では、妨害成分の除去を目的とする前処理反応における反応過程データの変動が特定成分の濃度の測定に影響を及ぼすことが考慮されていない。これに対し、本反応における反応過程データに基づいて取得された吸光度と前処理反応における反応過程データに基づいて取得された吸光度の差分を取ることにより特定成分の濃度が測定されることから、本発明者は、前処理反応における反応過程データの異常変動が特定成分の濃度の測定に悪影響を及ぼす場合があることを新規に見出した。
In this regard, the techniques using the conventional reaction process approximation method represented by the above-mentioned
本発明の目的は、妨害成分を除去する前処理反応における反応過程データの異常変動を検出することができる技術を提供することにある。
その他の課題と新規な特徴は、本明細書の記述および添付図面から明らかになるであろう。An object of the present invention is to provide a technique capable of detecting abnormal fluctuations in reaction process data in a pretreatment reaction for removing interfering components.
Other problems and novel features will become apparent from the description of the specification and the accompanying drawings.
一実施の形態における自動分析装置は、検体と試薬との反応液に対する吸光度に基づいて、検体に含まれる特定成分の濃度を測定するように構成される。ここで、検体と試薬との反応は、検体と第1試薬とを反応させる前処理反応と、検体と第1の試薬以外の試薬とを反応させる本反応とを含む。そして、自動分析装置は、前処理反応において吸光度を時系列で測定することにより反応過程データを取得するように構成された反応過程データ取得部と、吸光度に関する条件を設定するように構成された条件設定部と、条件設定部で設定された条件に基づいて、前処理反応で取得された反応過程データの変動が本反応における特定成分の濃度の測定に影響を及ぼす変動であるか否かを判断するように構成された異常変動判断部と、異常変動判断部で判断された判断結果を出力するように構成された出力部と、を備える。 An automatic analyzer in one embodiment is configured to measure the concentration of a specific component contained in a specimen based on the absorbance of a reaction liquid between the specimen and a reagent. Here, the reaction between the specimen and the reagent includes a pretreatment reaction for reacting the specimen and the first reagent, and a main reaction for reacting the specimen with a reagent other than the first reagent. The automatic analyzer includes a reaction process data acquisition unit configured to acquire reaction process data by measuring absorbance in time series in the pretreatment reaction, and a condition configured to set conditions related to absorbance. Based on the conditions set by the setting part and the condition setting part, it is determined whether or not the variation in the reaction process data acquired in the pretreatment reaction is a variation that affects the measurement of the concentration of the specific component in the main reaction. and an output unit configured to output the determination result determined by the abnormal variation determination unit.
また、一実施の形態における自動分析方法は、検体と試薬との反応液に対する吸光度に基づいて、検体に含まれる特定成分の濃度を測定する方法である。ここで、検体と試薬との反応は、検体と第1試薬とを反応させる前処理反応と、検体と第1の試薬以外の試薬とを反応させる本反応とを含む。そして、自動分析方法は、前処理反応において吸光度を時系列で測定することにより反応過程データを取得する反応過程データ取得工程と、吸光度に関する条件を設定する条件設定工程と、条件設定工程で設定された条件に基づいて、前処理反応で取得された反応過程データの変動が本反応における特定成分の濃度の測定に影響を及ぼす変動であるか否かを判断する異常変動判断工程と、異常変動判断工程で判断された判断結果を出力する出力工程と、を備える。 Further, an automatic analysis method according to one embodiment is a method of measuring the concentration of a specific component contained in a specimen based on the absorbance of a reaction liquid between the specimen and a reagent. Here, the reaction between the specimen and the reagent includes a pretreatment reaction for reacting the specimen and the first reagent, and a main reaction for reacting the specimen with a reagent other than the first reagent. The automatic analysis method includes a reaction process data acquisition step of acquiring reaction process data by measuring absorbance in time series in the pretreatment reaction, a condition setting step of setting conditions related to absorbance, and a condition setting step. an abnormal change determination step of determining whether or not the change in the reaction process data obtained in the pretreatment reaction is a change that affects the measurement of the concentration of the specific component in the main reaction, based on the conditions obtained; and an output step of outputting a determination result determined in the step.
一実施の形態によれば、妨害成分を除去する前処理反応における反応過程データの異常変動を検出することができる。 According to one embodiment, abnormal fluctuations in reaction process data in a pretreatment reaction for removing interfering components can be detected.
実施の形態を説明するための全図において、同一の部材には原則として同一の符号を付し、その繰り返しの説明は省略する。なお、図面をわかりやすくするために平面図であってもハッチングを付す場合がある。 In principle, the same members are denoted by the same reference numerals in all the drawings for describing the embodiments, and repeated description thereof will be omitted. In order to make the drawing easier to understand, even a plan view may be hatched.
<本発明者が見出した新規な知見>
まず、本発明者が見出した新規な第1知見とは、反応過程データの変動には、(a)前処理反応における吸光度の変化(反応過程データの変動)が、本反応の反応に影響を及ぼして、特定成分の濃度の測定に影響する変動と、(b)前処理反応における吸光度は変動するが、本反応における特定成分の濃度の測定には影響を与えない変動の2種類があるということである。この第1知見に基づくと、前処理反応における反応過程データの異常変動を検出するためには、「(a)による反応過程データの変動」と「(b)による反応過程データの変動」とを区別して、「(a)による反応過程データの変動」だけを反応過程データの異常変動として検出する工夫が必要とされることがわかる。<New knowledge discovered by the inventor>
First, the first novel findings found by the present inventors are that (a) the change in absorbance in the pretreatment reaction (variation in reaction process data) does not affect the reaction in this reaction; and (b) the absorbance in the pretreatment reaction fluctuates, but does not affect the measurement of the concentration of the specific component in this reaction. That is. Based on this first finding, in order to detect abnormal fluctuations in the reaction process data in the pretreatment reaction, "variation in the reaction process data by (a)" and "variation in the reaction process data by (b)" must be combined. It can be seen that it is necessary to devise a way to distinguish and detect only "changes in the reaction process data due to (a)" as abnormal changes in the reaction process data.
なお、以降の記載では、「(a)前処理反応における吸光度の変化が、本反応の反応に影響を及ぼして、特定成分の濃度の測定に影響する変動」を単に「影響変動」と呼び、「(b)前処理反応における吸光度は変動するが、本反応における特定成分の濃度の測定には影響を与えない変動」を単に「非影響変動」と呼ぶことにする。 In the following description, "(a) the change in absorbance in the pretreatment reaction affects the reaction of this reaction and affects the measurement of the concentration of the specific component" is simply referred to as "influence change". "(b) Variation that varies the absorbance in the pretreatment reaction but does not affect the measurement of the concentration of the specific component in the reaction" is simply referred to as "non-influencing variation".
続いて、本発明者が見出した新規な第2知見とは、以下に示す知見である。吸光度の変動は、自動分析装置に起因する光学系が原因の場合、ランダムに変動する。例えば、反応液中の気泡や洗浄液の滴下なども大きく吸光度が変動する要因となる。この吸光度の変動は、一般的に「突発的な誤差」として分類することができる。一方、検体中に含まれる夾雑物は、試薬成分と反応しているため、異常な反応であるが、一定方向に吸光度が上昇/低下するなどの特徴的な変化をする。これは一般的に「系統的な誤差」と分類することができる。第1試薬を添加した後の前処理反応の段階でのノイズ発生時(反応過程データの変動)の対処方法は、「突発的な誤差」と「系統的な誤差」では項目やその誤差の程度で大きく異なる。各項目の前処理反応の段階での影響を定量的に、かつ、特徴を抽出して対処することが重要となる。この第2知見に基づくと、前処理反応における反応過程データの変動を「突発的な誤差」と「系統的な誤差」に区別することができれば、反応過程データの変動が検体自体に起因する変動であるのか、あるいは、自動分析装置に起因する変動であるのかを区別することができることになる。 Next, the novel second knowledge discovered by the present inventor is the knowledge shown below. Absorbance fluctuations randomly fluctuate due to the optical system of the automatic analyzer. For example, air bubbles in the reaction liquid and dripping of the cleaning liquid are factors that greatly fluctuate the absorbance. This absorbance variation can generally be classified as a "random error." Contaminants contained in the sample, on the other hand, react with the reagent components, and thus are abnormal reactions, but exhibit characteristic changes such as an increase/decrease in absorbance in a certain direction. This can generally be classified as "systematic error". How to deal with noise (fluctuations in reaction process data) during the pretreatment reaction stage after adding the first reagent significantly different. It is important to deal with the effects of each item in the pretreatment reaction stage quantitatively and by extracting features. Based on this second finding, if the fluctuations in the reaction process data in the pretreatment reaction can be distinguished into "spontaneous errors" and "systematic errors", the fluctuations in the reaction process data can be attributed to the sample itself. It is possible to distinguish whether it is a variation caused by the automatic analyzer.
上述した第1知見に基づくと、本反応が正常であったとしても、第1試薬を添加した後の妨害成分の前処理反応が、本反応の測定結果の算出に影響を及ぼすことがある。このような場合、従来技術のような本反応における反応過程データの変動チェックでは、前処理反応における反応過程データの異常変動(ノイズ)を見落としてしまう可能性がある。このことから、前処理反応の段階で反応過程データの異常変動を検出することが重要である。 Based on the first knowledge described above, even if this reaction is normal, the pretreatment reaction of the interfering components after the addition of the first reagent may affect the calculation of the measurement result of this reaction. In such a case, there is a possibility that abnormal fluctuations (noise) in the reaction process data in the pretreatment reaction may be overlooked in the fluctuation check of the reaction process data in the main reaction as in the prior art. For this reason, it is important to detect abnormal fluctuations in the reaction process data at the stage of the pretreatment reaction.
さらに、上述した第2知見に基づくと、反応過程データの変動が検体自体に起因する変動であるのか、あるいは、自動分析装置に起因する変動であるのかを特定することも重要である。この点に関し、本反応では、濃度依存的に吸光度が増加するため、本反応の吸光度の変化が大きい場合、突発的なノイズの影響は相対的に小さいため、ノイズは埋もれてしまい検出しにくい。このことは、本反応の段階では、反応過程データの変動が検体自体に起因する変動であるのか、あるいは、自動分析装置に起因する変動であるのかを特定することが困難になることを意味する。これに対し、前処理反応における反応過程データは、吸光度の変動が小さいという特徴を有していることから、突発的なノイズも顕在化しやすい。このことは、前処理反応の段階で反応過程データの異常変動を検出する技術的思想は、反応過程データの異常変動が検体自体に起因する変動であるか、あるいは、自動分析装置の機構に起因する変動であるかを感度よく判別することに適していることを意味する。したがって、前処理反応の段階で反応過程データの異常変動を検出する技術的思想は、反応過程データの異常変動の原因を追究する上でも重要な技術的意義を有していると言える。 Furthermore, based on the second knowledge mentioned above, it is also important to specify whether the variation in the reaction process data is due to the sample itself or due to the automatic analyzer. In this regard, since the absorbance increases in a concentration-dependent manner in this reaction, when the change in absorbance in this reaction is large, the effect of sudden noise is relatively small, and the noise is buried and difficult to detect. This means that it becomes difficult to identify whether the variation in the reaction process data is due to the sample itself or the automated analyzer at the stage of the reaction. . On the other hand, the reaction process data in the pretreatment reaction is characterized by small fluctuations in absorbance, so that sudden noise is likely to become apparent. This means that the technical idea of detecting abnormal fluctuations in reaction process data at the stage of the pretreatment reaction is based on whether the abnormal fluctuations in reaction process data are caused by the sample itself, or by the mechanism of the automatic analyzer. It means that it is suitable for discriminating with high sensitivity whether it is a fluctuation that Therefore, it can be said that the technical idea of detecting abnormal fluctuations in reaction process data at the stage of the pretreatment reaction has important technical significance in investigating the cause of abnormal fluctuations in reaction process data.
さらに言えば、検体に含まれる妨害成分は個々の検体ごとに異なる。妨害成分の前処理反応による影響も検体ごとに異なるため、本反応への影響も異なる。このため、本反応を近似式で近似した場合、検体成分で乖離した事象と自動分析装置の不具合などによって発生した事象かを判定することができず、系統的な分類が困難である。特に、溶血検体や高脂血症の場合、第1試薬を添加した後の反応は、他の正常検体とは大きく異なる。正常検体の前処理反応における反応過程データは、フラットなままであるが、夾雑物が一定量含まれている場合では、その夾雑物を除くための反応により、前処理反応の間に吸光度が漸近的に低下する場合もある。一方、同一の項目でも、試薬分注時の反応容器内の気泡の付着や光源ランプが不安定などの場合、ランダムな吸光度の変動が発生する。これらの自動分析装置に起因する吸光度のずれと検体に起因する吸光度の変動は混在している場合が多い。突発的に変動した項目は、再検査や自動分析装置を停止してのメンテナンスを実施することが望ましい一方で、検体の夾雑物の影響である場合、自動分析装置の不具合ではないため、再検査を自動で実施することが望ましい。しかしながら、検体に含まれる夾雑物の影響が大きい検体を測定している場合であっても、自動分析装置の測定者は、測定が終了するまで気づくことができずに再測定をすることが困難であることが実情である。 Furthermore, the interfering components contained in the sample are different for each individual sample. Since the influence of interfering components due to the pretreatment reaction also differs for each sample, the influence on this reaction also differs. For this reason, when this reaction is approximated by an approximation formula, it is not possible to determine whether an event in which the sample components deviate from each other or an event caused by a malfunction of an automatic analyzer, etc., making systematic classification difficult. In particular, in the case of a hemolyzed sample or hyperlipidemia, the reaction after addition of the first reagent is significantly different from that of other normal samples. The reaction process data in the pretreatment reaction of normal samples remains flat, but when a certain amount of contaminants is contained, the absorbance asymptotically approaches during the pretreatment reaction due to the reaction to remove the contaminants. In some cases, it actually decreases. On the other hand, even for the same item, if air bubbles adhere to the reaction vessel during reagent dispensing or if the light source lamp is unstable, random fluctuations in absorbance will occur. Absorbance shifts caused by these automatic analyzers and absorbance fluctuations caused by specimens often coexist. Items that suddenly fluctuate should be retested or maintenance should be performed by stopping the automatic analyzer. should be performed automatically. However, even when measuring a sample that is greatly affected by contaminants contained in the sample, it is difficult for the operator of the automated analyzer to re-measure without noticing until the end of the measurement. is the actual situation.
また、異常発生時の対処方法は異なる。洗浄液の滴下等が起因で突発的なノイズが計測された場合は、自動分析装置の分析を継続せずに停止させることが重要である。このような重大な事象の発生は極めてまれである。検体の夾雑物は含有量の大小はあるが、ほとんどの検体に含まれており、多くの項目では試薬の工夫で本反応には影響しないように試薬が調整されている。しかし、検体に含まれる夾雑物の含有量が大きい場合は、本反応の濃度成分に影響する項目も存在する。その場合は、試料量を少なくして、再測定することがデータの信頼性を確保する上でも重要である。 In addition, the method of coping when an abnormality occurs is different. When sudden noise is measured due to dripping of cleaning liquid, etc., it is important to stop the analysis of the automatic analyzer without continuing it. The occurrence of such serious events is extremely rare. Contaminants in specimens are contained in most of the specimens, although the amount of contaminants varies, and the reagents for many items are adjusted so as not to affect this reaction by devising the reagents. However, if the sample contains a large amount of contaminants, there are items that affect the concentration component of this reaction. In that case, it is important to reduce the amount of sample and measure again in order to ensure the reliability of the data.
このことから、特定成分の濃度測定の早い段階で反応過程データの異常変動を検出することができれば、その後の対応を迅速に実施できる。すなわち、本反応よりも前の前処理反応の段階で反応過程データの異常変動を検出することは、測定を即時中断して、再測定が必要か、あるいは、自動分析装置を停止する必要があるかを測定の早い段階で判断することできることを意味する。したがって、前処理反応の段階で反応過程データの異常変動を検出する技術的思想は、検査結果報告時間の短縮と自動分析装置の状態管理を可能とする観点から非常に有用であることがわかる。
前処理反応の具体的な事例を2例に挙げる。Therefore, if an abnormal change in reaction process data can be detected at an early stage of concentration measurement of a specific component, subsequent measures can be taken quickly. That is, if an abnormal change in the reaction process data is detected in the pretreatment reaction stage prior to the main reaction, the measurement must be immediately interrupted and remeasured, or the automatic analyzer must be stopped. This means that it is possible to determine at an early stage of the measurement whether Therefore, it can be seen that the technical idea of detecting abnormal fluctuations in reaction process data at the pretreatment reaction stage is very useful from the viewpoint of shortening the test result reporting time and enabling the state management of the automatic analyzer.
Two specific examples of pretreatment reactions are given.
LDL-C(LDLコレステロール)等の脂質成分では、目的となる成分以外の妨害成分を除去するために前処理反応を実施している。検体中の脂質成分が過剰であった場合、前処理反応での余分な脂質成分の除去が実施しきれないため、正常な検体と異なり、前処理反応の吸光度が大きくなり、この影響を除去しきれなかった場合、妥当な測定結果を得ることができないことがある。また、血清中にグロブリン成分が過剰に含まれていた場合、生化学測定用の試薬と混合されることによって、白濁してしまい、前処理反応では上昇しないはずの反応時間において吸光度が上昇する場合がある。これによって、測定濃度が異常となる場合が生じる。上述した2例以外にも検体に含まれる成分に起因して前処理反応中に反応過程データが異常となってしまうケースがある。 Lipid components such as LDL-C (LDL cholesterol) are subjected to a pretreatment reaction in order to remove interfering components other than the target components. If the lipid component in the specimen is excessive, the excess lipid component cannot be removed in the pretreatment reaction, so unlike normal specimens, the absorbance of the pretreatment reaction increases, and this effect cannot be removed. If not, it may not be possible to obtain valid measurement results. Also, if the serum contains an excessive amount of globulin components, it will become cloudy by being mixed with the reagent for biochemical measurement, and the absorbance will increase during the reaction time, which should not increase during the pretreatment reaction. There is As a result, the measured density may become abnormal. In addition to the two examples described above, there are cases where the reaction process data become abnormal during the pretreatment reaction due to the components contained in the sample.
そこで、本実施の形態では、上述した第1知見に基づき、「影響変動」と「非影響変動」とを区別して、「影響変動」だけを反応過程データの異常変動として検出する工夫を施している。さらに、本実施の形態では、上述した第2知見に基づき、反応過程データの変動が検体自体に起因する変動であるのか、あるいは、自動分析装置に起因する変動であるのかを区別するための工夫も施している。以下では、この工夫を施した本実施の形態における技術的思想について説明することにする。 Therefore, in the present embodiment, based on the above-described first knowledge, "influenced variation" and "non-influenced variation" are distinguished, and only "influenced variation" is detected as anomalous variation in the reaction process data. there is Furthermore, in the present embodiment, based on the second knowledge described above, a device for distinguishing whether the variation in the reaction process data is due to the sample itself or the variation due to the automatic analyzer is also applied. In the following, the technical idea of this embodiment with this ingenuity will be described.
<自動分析装置の構成>
図1は、検体を分析する自動分析装置の構成例を説明する図である。
図1において、自動分析装置100は、分析部1、記憶部14、表示部15、操作部16、制御部17を備える。分析部1は、搬送ライン4、検体プローブ5、試薬プローブ6、試薬ディスク8、反応ディスク10、撹拌部11、光度計12、洗浄部13を有する。<Configuration of automatic analyzer>
FIG. 1 is a diagram illustrating a configuration example of an automatic analyzer that analyzes a sample.
In FIG. 1 , the
搬送ライン4は、血液や尿等の検体が収容される複数の検体容器2が搭載される検体ラック3を検体プローブ5がアクセスする位置まで搬送する。なお、検体ラック3と搬送ライン4は、環状に搭載される検体容器2を移動させるために一方向に回転する検体ディスクに置き換えられてもよい。
The
試薬ディスク8は、検体と反応させる試薬を収容する複数の試薬容器7を保管するとともに、試薬プローブ6がアクセスする位置へ試薬容器7を移動させるために一方向に回転する。反応ディスク10は、検体と試薬が分注される複数の反応容器9を環状に保持するとともに、所定の位置へ反応容器9を移動させるために一方向に回転する。
The
検体プローブ5は、搬送ライン4によって搬送された検体ラック3に搭載される検体容器2から反応容器9へ検体を分注する。試薬プローブ6は、検体が分注された反応容器9へ試薬容器7から試薬を分注する。なお、反応容器9に分注される試薬は、一つに限られず複数であっても良い。
The
撹拌部11は、反応ディスク10の周囲に配置され、検体と試薬が分注された反応容器9の中を撹拌する。光度計12は、反応ディスク10の周囲に配置され、撹拌部11によって撹拌された反応容器9の中の溶液の吸光度を反応容器9が前を横切るたびに測定する。反応ディスク10が一定のタイミングで間歇的に回転するので、反応容器9の中の溶液の吸光度は一定の時間間隔で測定される。測定された吸光度は、予め作成された検量線を用いて、検体に含まれる特定成分の濃度に換算される。なお検量線は、特定成分の濃度が既知である標準液と試薬を反応させた反応液の吸光度の測定を含むキャリブレーションの実行により作成される。洗浄部13は、反応ディスク10の周囲に配置され、分析が終了した反応容器9を洗浄する。
The stirring
キャリブレーションに使用される標準液は特定成分を含む水溶液であり、自動分析装置100の測定範囲の上限値近辺の濃度と下限値近辺の濃度を少なくとも有する。つまり、少なくとも2つの標準液が使用される。なお、特定成分の濃度が略ゼロであって試薬と反応しない標準液は第1標準液と呼ばれ、多くの場合、生理食塩水や精製水等である。
A standard solution used for calibration is an aqueous solution containing a specific component, and has at least a concentration near the upper limit and a concentration near the lower limit of the measurement range of the
記憶部14は、例えばHDD(Hard Disk Drive)やSSD(Solid State Drive)であり、光度計12によって測定された吸光度や吸光度から換算される濃度などが記憶される。
The
表示部15は、例えば液晶ディスプレイやタッチパネルであり、吸光度や濃度などの情報が表示される。操作部16は、例えばキーボードやマウスであり、分析に必要な条件やパラメータの入力等の操作が行われる。なお、表示部15がタッチパネルである場合には、タッチパネルに表示されるGUI(Graphical User Interface)が操作部16として機能する。制御部17は、例えばCPU(Central Processing Unit)等の演算器であり、各部を制御するとともに各種演算を実行する。
以上のようにして、自動分析装置100が構成されている。The
The
<反応過程データの一例>
次に、反応過程データの一例について説明する。
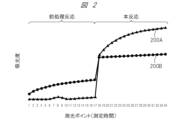
図2は、CRPの反応過程データの一例を示すグラフである。
図2において、横軸は、測光ポイント(測光時間)を示しており、縦軸は、吸光度を示している。そして、「測光ポイント1」から「測光ポイント17」までの時間範囲が前処理反応に対応し、「測光ポイント18」から「測光ポイント34」までの時間範囲が本反応に対応している。<Example of reaction process data>
Next, an example of reaction process data will be described.
FIG. 2 is a graph showing an example of CRP reaction process data.
In FIG. 2, the horizontal axis indicates the photometric point (photometric time), and the vertical axis indicates the absorbance. The time range from "
図2に示す検体200Aに対するグラフでは、前処理反応における反応過程データは、ほぼフラットであり、これは、前処理反応における反応過程データの変動が少なく正常であることを示している。また、検体200Aに対するグラフでは、本反応における反応過程データが増加傾向にあることがわかる。このような検体200Aの反応過程データは、正常データの一例である。これに対し、検体200Bに対するグラフでは、前処理反応における反応過程データがフラットではなく増加傾向にある。通常、前処理反応における反応過程データはフラットであるため、増加傾向の変動を示す検体200Bの反応過程データは異常である。つまり、検体200Bの反応過程データは、異常データの一例である。
In the graph for the
ここで、特定成分の濃度は、例えば、本反応の吸光度と前処理反応の吸光度との差分に基づいて測定される。例えば、図2において、本反応の吸光度としては、最終測光ポイントである「測光ポイント34」の吸光度が使用される一方、前処理反応の吸光度としては、前処理反応の最終測光ポイントである「測光ポイント17」の吸光度が使用される。したがって、検体200Bの異常データでは、前処理反応の最終測光ポイントである「測光ポイント17」の吸光度が大きくなっていることから、本反応の吸光度と前処理反応の吸光度との差分に基づいて測定される特定成分の濃度に影響が及ぶことになる。つまり、図2に示す検体200Bの反応過程データの変動は、「影響変動」に該当する。
続いて、図3は、LDL-Cの反応過程データの一例を示すグラフである。Here, the concentration of the specific component is measured, for example, based on the difference between the absorbance of the main reaction and the absorbance of the pretreatment reaction. For example, in FIG. 2, the absorbance at the final photometric point "
Next, FIG. 3 is a graph showing an example of LDL-C reaction process data.
図3に示す検体300Aに対するグラフでは、前処理反応における反応過程データは、ほぼフラットであり、これは、前処理反応における反応過程データの変動が少なく正常であることを示している。一方、図3に示す検体300Bに対するグラフでは、前処理反応における反応過程データが減少傾向を示している。したがって、一見すると、検体300Bに対するグラフは、異常であると考えられる。しかし、実際には、検体300Bでは、妨害成分が多く含まれており、前処理反応で妨害成分の除去が進む結果、妨害成分に起因する吸光度が減少したものと考えられる。そして、前処理反応の最終段階(「測光ポイント17」)では、妨害成分がほとんど除去されて、正常な吸光度になっていると考えられる。すなわち、本反応の吸光度としては、最終測光ポイントである「測光ポイント34」の吸光度が使用される一方、前処理反応の吸光度としては、前処理反応の最終測光ポイントである「測光ポイント17」の吸光度が使用されるとすると、検体300Bの反応過程データでは、特定成分の濃度の測定に前処理反応での変動が影響を与えないことになる。つまり、検体300Bにおける反応過程データの変動は、「非影響変動」に該当する正常データということになる。
In the graph for the
したがって、前処理反応での異常変動を検出する際、例えば、図2に示す検体200Bにおける反応過程データの変動は、異常変動であると検出できる一方、図3に示す検体300Bにおける反応過程データの変動は、異常変動であると検出しない必要がある。
Therefore, when detecting an abnormal variation in the pretreatment reaction, for example, the variation in the reaction process data for the
以下では、「影響変動」を異常変動として検出する一方、「非影響変動」を異常変動として検出しない自動分析装置について説明する。 An automatic analyzer that detects "influential fluctuations" as abnormal fluctuations but does not detect "non-influential fluctuations" as abnormal fluctuations will be described below.
なお、吸光度に関する表現は、自動分析装置上で整数表示しているため、本明細書に記載されている吸光度は、例えば、10000倍して整数値で表現している。 Since the absorbance is represented by an integer on the automatic analyzer, the absorbance described in this specification is represented by an integer value multiplied by 10000, for example.
<自動分析装置の機能ブロック構成>
図4は、自動分析装置の機能ブロック構成を示す図である。
図4において、自動分析装置100は、反応過程データ取得部500と、条件設定部501と、異常変動判断部502と、出力部504と、測定中断部505と、データ記憶部506とを有している。<Functional block configuration of automatic analyzer>
FIG. 4 is a diagram showing the functional block configuration of the automatic analyzer.
In FIG. 4, the
反応過程データ取得部500は、前処理反応において吸光度を時系列で測定することにより得られた反応過程データを取得するように構成されている。反応過程データの一例としては、図2や図3に示す反応過程データを挙げることができる。反応過程データ取得部500で取得された反応過程データは、データ記憶部506に記憶される。
The reaction process data acquisition unit 500 is configured to acquire reaction process data obtained by measuring absorbance in time series in the pretreatment reaction. As an example of the reaction process data, the reaction process data shown in FIGS. 2 and 3 can be mentioned. The reaction process data acquired by the reaction process data acquisition unit 500 is stored in the
次に、条件設定部501は、吸光度に関する条件を含む初期条件を設定することができるように構成されている。例えば、図5は、条件設定部501で設定される初期条件の一例を示す表である。図5において、「項目」には、濃度の測定対象となる成分が設定される。例えば、「項目」に「LDL」が設定されている場合、「LDL」に対応する行には、「LDL」の反応過程データの解析に使用される条件が設定される。
Next, the
「項目」ごとに設定される条件には、「測光ポイント」、「ばらつき許容値」、「ポイント数」、「Err許容値」、「前処理反応の吸光度幅」、「判定方法」および「測定継続」がある。 The conditions set for each “item” include “photometry points”, “variation tolerance”, “number of points”, “Err tolerance”, “absorbance range of pretreatment reaction”, “judgment method” and “measurement There is a continuation.
「測光ポイント」には、反応過程データの解析に使用される測光区間が規定される。例えば、「測光ポイント」に「5-17」と記載されている場合、「測光ポイント5」から「測光ポイント17」の反応過程データを使用して、反応過程データの解析が行われる。
The “photometric point” defines a photometric interval used for analysis of reaction process data. For example, when "5-17" is described in "photometry point", the reaction process data of "
「ばらつき許容値」には、反応過程データをフィッティングした近似関数からの許容されるずれの範囲が規定される。例えば、「ばらつき許容値」に「100」と記載されている場合、近似関数からの許容されるずれの範囲が「100」であることを意味する。 The "permissible variation value" defines the range of permissible deviation from the approximation function to which the reaction process data is fitted. For example, if "100" is written in the "permissible variation value", it means that the range of allowable deviation from the approximation function is "100".
「ポイント数」には、近似関数からの許容されるずれの範囲外にある反応過程データの許容データ数が規定される。例えば、「ポイント数」に「5」と記載されている場合、ずれの許容範囲外にある反応過程データの許容データ数が「5」であることを意味する。 The "number of points" defines the allowable number of reaction process data outside the range of allowable deviation from the approximation function. For example, when "point number" is described as "5", it means that the allowable data number of reaction process data outside the allowable deviation range is "5".
「Err許容値」には、近似関数と測定された反応過程テータとに基づく二乗誤差の許容範囲が規定される。例えば、「Err許容値」に「200」と記載されている場合、二乗誤差の許容範囲が「200」であることを意味する。 "Err Tolerance" defines the allowable range of square error based on the approximation function and the measured reaction process data. For example, when "200" is written in "Err tolerance", it means that the tolerance of the squared error is "200".
「前処理反応の吸光度幅」には、前処理反応における反応過程データの最小値と最大値との差に対する許容値が規定される。例えば、「前処理反応の吸光度幅」に「150」と記載されている場合、吸光度幅に対する許容値が「150」であることを意味する。 The "absorbance width of pretreatment reaction" defines an allowable value for the difference between the minimum value and the maximum value of the reaction process data in the pretreatment reaction. For example, when "150" is written in the "absorbance width of pretreatment reaction", it means that the allowable value for the absorbance width is "150".
「判定方法」には、吸光度に関する複数の条件をAND条件として使用するか、あるいは、OR条件として使用するかが規定される。具体的には、「ばらつき許容値」および「ポイント数」に基づく条件と、「Err許容値」に基づく条件と、「前処理反応の吸光度幅」に基づく条件のAND条件、あるいは、OR条件で反応過程データの異常変動を判断するかが規定される。例えば、「判定方法」に「AND」と記載されている場合、上述した吸光度に関する複数の条件をAND条件にして反応過程データの異常変動の有無が判断されることを意味する。 In the "determination method", it is defined whether a plurality of absorbance conditions are used as AND conditions or as OR conditions. Specifically, the condition based on the "permissible variation value" and the "number of points", the condition based on the "permissible Err value", and the condition based on the "absorbance width of the pretreatment reaction" are ANDed or ORed. It is defined whether to judge abnormal fluctuations in the reaction process data. For example, when "AND" is described in the "determination method", it means that the presence or absence of abnormal fluctuations in the reaction process data is determined with the plurality of conditions related to absorbance as AND conditions.
「測定継続」には、反応過程データに異常変動があった場合に測定を継続するか、あるいは、測定を中断するかが規定される。例えば、「測定継続」に「停止」と記載されている場合、反応過程データに異常変動があった場合に測定を中断することを意味する。 “Measurement continuation” specifies whether to continue the measurement or suspend the measurement when there is an abnormal change in the reaction process data. For example, when "stop" is written in "measurement continuation", it means that the measurement is interrupted when there is an abnormal change in the reaction process data.
なお、図5には記載されていないが、条件設定部501では、反応過程データをフィッティングする際に使用される近似関数を選択して設定できるように構成されている。例えば、近似関数の種類として、一次関数、反比例関数、指数関数、対数関数などがあり、これらの関数の中からフィッティングに使用する近似関数を設定することができる。ただし、本実施の形態では、簡単のため、フィッティングに使用する近似関数として一次関数を選択するものとして説明することにする。
Although not shown in FIG. 5, the
自動分析装置100では、「影響変動」を異常変動として検出する一方、「非影響変動」を異常変動として検出しないために、条件設定部501において、図5に示す条件だけでなく、以下に示す例外条件も設定するように構成される。
In the
例えば、図6は、条件設定部501で設定される例外条件の一例を示す表である。図6において、「項目」には、濃度の測定対象となる成分が設定される。例えば、「項目」に「LDL」が設定されている場合、「LDL」に対応する行には、「LDL」の反応過程データを異常変動と判断しないための例外条件が規定されている。この例外条件には、「測光ポイント」、「変化方向」、「変化率」がある。
For example, FIG. 6 is a table showing an example of exception conditions set by the
「測光区間(測光ポイント)」には、反応過程データの測光区間が規定される。例えば、「測光ポイント」に「5-17」と記載されている場合、「測光ポイント5」から「測光ポイント17」の反応過程データが例外条件の適用範囲となることを意味している。
The "photometry interval (photometry point)" defines the photometry interval of the reaction process data. For example, if "5-17" is written in the "photometry point", it means that the reaction process data from "
「変化方向」には、例外条件となる反応過程データの変化方向が規定される。例えば、「変化方向」が「連続減少」と記載されている場合、反応過程データの変化が連続減少である場合に例外条件が適用されることを意味している。言い換えれば、「変化方向」が「連続減少」と記載されている場合、反応過程データの変化が「連続減少」以外のときは例外条件が適用されないことを意味している。 The "direction of change" defines the direction of change of the reaction process data as an exception condition. For example, when "direction of change" is described as "continuous decrease", it means that the exceptional condition is applied when the change in the reaction process data is continuous decrease. In other words, when the "direction of change" is described as "continuous decrease", it means that the exceptional condition is not applied when the change in the reaction process data is other than "continuous decrease".
「変化率」には、例外条件となる反応過程データの変化率が規定される。例えば、「変化率」が「100」と記載されている場合、反応過程データをフィッティングした近似関数の傾きが「100」以下である場合に例外条件が適用されることを意味している。 The "rate of change" defines the rate of change of the reaction process data as an exception condition. For example, when the "rate of change" is described as "100", it means that the exceptional condition is applied when the slope of the approximation function obtained by fitting the reaction process data is "100" or less.
なお、「コメント」の欄には、反応過程データの変動が生じる要因を端的に記載することができる。例えば、「コメント」の欄に「弱乳び影響」と記載されている場合には、「弱乳び」によって、反応過程データに例外条件に該当する変動が生じていると理解できる。 In addition, in the column of "comment", it is possible to simply describe the factors that cause fluctuations in the reaction process data. For example, when "weak chyle effect" is described in the "comment" column, it can be understood that "weak chyle" causes a change corresponding to the exceptional condition in the reaction process data.
以上のようにして、条件設定部501は、例えば、図5に示す条件とともに、図6に示す例外条件も設定するように構成されている。そして、条件設定部501で設定された吸光度に関する条件(図5および図6)は、データ記憶部506に記憶される。
As described above, the
続いて、異常変動判断部502は、条件設定部501で設定された吸光度に関する条件に基づいて、前処理反応で取得された反応過程データの変動が本反応における特定成分の濃度の測定に影響を及ぼす変動であるか否かを判断するように構成されている。
異常変動判断部502では、以下に示す判断処理を行うように構成される。Subsequently, based on the absorbance condition set by the
The abnormal
<<第1判断処理構成>>
異常変動判断部502は、反応過程データの最小値と最大値との差が条件設定部501で設定された「前処理反応の吸光度幅」の許容範囲内に収まっているか否かを判断するように構成されている。これにより、異常変動判断部502は、反応過程データの変動が一定の傾きを超えているか否かを判断することができる。<<First determination processing configuration>>
The abnormal
<<第2判断処理構成>>
異常変動判断部502は、近似関数(回帰直線)で反応過程データをフィッティングすることにより近似関数に含まれるパラメータを決定するように構成されたパラメータ決定部503を有する。パラメータ決定部503では、反応過程データへのフィッティングを通じて、回帰直線である「Y=aX+b」の傾き「a」とY切片「b」のパラメータを決定するように構成されている。そして、異常変動判断部502は、条件設定部501で設定された「ばらつき許容値」と「ポイント数」に基づいて、反応過程データの回帰直線からのずれを評価するように構成されている。<<Second judgment processing configuration>>
The abnormal
具体的に、異常変動判断部502は、条件設定部501で設定された「ばらつき許容値」を「A」とすると、反応過程データが「Y=aX+b±A」の許容範囲に収まっているか否かを判断するように構成されている。そして、異常変動判断部502は、この許容範囲に収まっていない反応過程データがある場合、許容範囲に収まっていない反応過程データの数が「ポイント数」で規定されている許容データ数を超えているか否かを判断するように構成されている。これにより、異常変動判断部502は、反応過程データの変動が回帰直線からのずれの大きい変動であるかを判断することができる。
Specifically, if the “permissible variation value” set by the
例えば、図7は、図2に示す反応過程データのうち前処理反応での反応過程データを拡大して示すグラフである。図7では、検体200Aの反応過程データに対して破線で示す回帰直線の許容範囲で評価している状態と、検体200Bの反応過程データに対して破線で示す回帰直線の許容範囲で評価している状態とが示されている。
For example, FIG. 7 is a graph showing enlarged reaction process data in the pretreatment reaction among the reaction process data shown in FIG. In FIG. 7, the reaction process data of the
図7において、検体200Aの反応過程データのうち回帰直線の許容範囲を超えている反応過程データのデータ数は、検体200Bの反応過程データのうち回帰直線の許容範囲を超えている反応過程データのデータ数よりも少ない。したがって、例えば、異常変動判断部502は、検体200Aの反応過程データのうち回帰直線の許容範囲を超えている反応過程データのデータ数が許容データ数よりも少ないと判断することができる。一方、異常変動判断部502は、検体200Bの反応過程データのうち回帰直線の許容範囲を超えている反応過程データのデータ数が許容データ数よりも多いと判断することができる。
In FIG. 7, the number of reaction process data exceeding the allowable range of the regression line among the reaction process data of the
同様に、図8は、図3に示す反応過程データのうち前処理反応での反応過程データを拡大して示すグラフである。図8では、検体300Aの反応過程データに対して破線で示す回帰直線の許容範囲で評価している状態と、検体300Bの反応過程データに対して破線で示す回帰直線の許容範囲で評価している状態とが示されている。
Similarly, FIG. 8 is a graph showing enlarged reaction process data in the pretreatment reaction among the reaction process data shown in FIG. In FIG. 8, the reaction process data of the
図8において、検体300Aの反応過程データのうち回帰直線の許容範囲を超えている反応過程データのデータ数は、検体300Bの反応過程データのうち回帰直線の許容範囲を超えている反応過程データのデータ数よりも少ない。したがって、例えば、異常変動判断部502は、検体300Aの反応過程データのうち回帰直線の許容範囲を超えている反応過程データのデータ数が許容データ数よりも少ないと判断することができる。一方、異常変動判断部502は、検体300Bの反応過程データのうち回帰直線の許容範囲を超えている反応過程データのデータ数が許容データ数よりも多いと判断することができる。
In FIG. 8, the number of reaction process data exceeding the allowable range of the regression line among the reaction process data of the
<<第3判断処理構成>>
異常変動判断部502は、条件設定部501で設定された近似関数(回帰直線)と反応過程データとの二乗誤差の許容範囲に基づいて、前処理反応で取得された反応過程データの変動が許容範囲内に収まっているか否かを判断するように構成されている。これにより、異常変動判断部502は、反応過程データのばらつきが大きいか否かを判断できる。<<Third Judgment Process Configuration>>
Abnormal
<<第4判断処理構成>>
異常変動判断部502は、前処理反応で取得された反応過程データの変動が、条件設定部501で設定された例外条件(図6参照)に該当する場合、上述した第1判断処理と第2判断処理と第3判断処理の結果に関わらず、反応過程データの変動が異常変動ではないと判断するように構成されている。<<Fourth Judgment Processing Configuration>>
The abnormal
これにより、異常変動判断部502は、「影響変動」を異常変動として検出する一方、「非影響変動」を異常変動として検出しないことになる。
As a result, the abnormal
<<異常判断処理構成>>
異常変動判断部502は、第1判断処理と第2判断処理と第3判断処理と第4判断処理の判断結果を総合的に考慮して、前処理反応における反応過程データの変動が異常変動であるか否かを判断するように構成されている。<<Abnormality judgment processing configuration>>
The abnormal
具体的には、条件設定部501で設定された「判定方法」に基づいて、異常変動判断部502では、前処理反応における反応過程データの変動が異常変動であるか否かが判断される。例えば、条件設定部501で設定された「判定方法」がAND条件である場合、第1判断処理で反応過程データの最小値と最大値との差が「前処理反応の吸光度幅」の許容範囲内に収まっていないと判断され、かつ、第2判断処理で反応過程データの変動が回帰直線からのずれの大きい変動であると判断され、かつ、第3判断処理で反応過程データの変動が二乗誤差の許容範囲内に収まっていないと判断され、かつ、第4判断処理で例外条件に該当しないと判断されると、異常変動判断部502において、前処理反応での反応過程データの変動が異常変動であると判断される。一方、第1判断処理と第2判断処理と第3判断処理の判断結果が上記と同じであっても、第4判断処理で例外条件に該当すると判断されると、異常変動判断部502において、前処理反応での反応過程データの変動が異常変動ではないと判断されることになる。
Specifically, based on the “determination method” set by the
このようにして、異常変動判断部502は、「影響変動」を異常変動として検出することができる一方、「非影響変動」を異常変動として検出しないように構成されている。
In this way, the abnormal
例えば、図7の検体200Bに対する反応過程データは「影響変動」である一方、図8の検体300Bに対する反応過程データは、「非影響変動」である。
For example, the reaction process data for
この点に関し、異常変動判断部502が第4判断処理構成を有さないとすると、図7の検体200Bに対する反応過程データの変動も図8の検体300Bに対する反応過程データの変動も異常変動として判断されると考えられる。
Regarding this point, if the abnormal
しかしなから、本実施の形態では、異常変動判断部502が第1判断処理構成~第3判断処理構成だけでなく、例外条件に関する第4判断処理構成も有している。この結果、本実施の形態によれば、図8に示す反応過程データの変動は、例外条件に該当するとして、異常変動とは判断されないことになる。以上のことから、本実施の形態における自動分析装置100によれば、「影響変動」を異常変動として検出する一方、「非影響変動」を異常変動として検出しない構成が具現化されることになる。
However, in this embodiment, the abnormal
次に、出力部504は、異常変動判断部502で判断された判断結果を出力するように構成されている。例えば、出力部504は、異常変動判断部502で判断された判断結果が異常変動であるという判断結果の場合、音声で警告を出したり、表示装置に警告文や画像を表示することができるように構成されている。出力部504からの出力方法は、予め条件設定部501で設定しておくことができる。
Next, the
図9には、出力部504から出力される表示の一例が示されている。これにより、測定者は、前処理反応において、反応過程データに異常変動が生じていることを把握することができる。さらに、本実施の形態における自動分析装置100は、異常変動判断部502で反応過程データの変動が「影響変動」であると判断された場合、検体に含まれる特定成分の濃度の測定を中断するように構成された測定中断部505を有する。この測定中断部505によって測定を中断するか否かは、予め条件設定部501で設定することができる。
FIG. 9 shows an example of a display output from the
以上のことから、本実施の形態における自動分析装置100によれば、特定成分の濃度測定の早い段階(前処理反応の段階)で反応過程データの異常変動を検出することができるため、その後の対応を迅速に実施できる。すなわち、本実施の形態における自動分析装置100によれば、本反応よりも前の前処理反応の段階で反応過程データの異常変動を検出できることから、測定を即時中断して、再測定が必要か、あるいは、自動分析装置を停止する必要があるかを測定の早い段階で判断することできる。したがって、前処理反応の段階で反応過程データの「影響変動」を検出する技術的思想は、検査結果報告時間の短縮と自動分析装置の状態管理を可能とする観点から非常に有用であることがわかる。
As described above, according to the
<自動分析装置の動作>
続いて、自動分析装置100の動作について説明する。
図10は、自動分析装置100での反応過程データの異常変動を検出する全体動作の流れを示すフローチャートである。図10において、まず、条件を設定する(S101)。具体的には、条件設定部501において、図5に示す吸光度に関する条件を含む初期条件を設定するとともに、図6に示す例外条件を設定する。その後、条件設定部501において、判断結果の出力方法を設定する(S102)。例えば、判断結果の出力方法としては、ブザーによる警告や警告文の表示が考えられる。そして、反応過程データの解析を開始する(S103)。以下では、反応過程データの解析動作について説明する。<Operation of automatic analyzer>
Next, the operation of the
FIG. 10 is a flow chart showing the flow of the overall operation for detecting abnormal fluctuations in the reaction process data in the
図11および図12は、反応過程データの異常変動を検出するための解析動作の流れを説明するフローチャートである。なお、本実施の形態では、反応過程データの異常変動を検出するための方法として、測定する吸光度と時間との関係を一次関数(回帰直線)で近似することにより、反応過程データを解析する方法を示す。 11 and 12 are flowcharts for explaining the flow of analysis operations for detecting abnormal fluctuations in reaction process data. In the present embodiment, as a method for detecting abnormal fluctuations in the reaction process data, the reaction process data is analyzed by approximating the relationship between the absorbance to be measured and time with a linear function (regression line). indicates
まず、光度計で検体と第1試薬を混合した反応液の吸光度を測定する(S201)。これにより、前処理反応における反応過程データが取得される(S202)。取得された反応過程データは、自動分析装置100のデータ記憶部506に記憶される(S203)。ここで、例えば、データ記憶部506は、自動分析装置100に含まれている構成を前提としているが、これに限らず、データ記憶部506は、自動分析装置100とネットワーク接続されたサーバなどに搭載されていてもよい。
First, a photometer is used to measure the absorbance of a reaction solution in which a specimen and a first reagent are mixed (S201). Thereby, reaction process data in the pretreatment reaction is acquired (S202). The acquired reaction process data is stored in the
次に、前処理反応における反応過程データの解析に必要な測定ポイント(測光区間)の反応過程データが取得できたかを判断する(S204)。必要な反応過程データが取得できている場合には、次の処理に進む。一方、必要な反応過程データが取得できていない場合には、反応過程データがそろうまで反応液の吸光度測定を継続する。 Next, it is determined whether or not the reaction process data of the measurement points (photometry section) necessary for analyzing the reaction process data in the pretreatment reaction has been acquired (S204). If the necessary reaction process data has been acquired, proceed to the next process. On the other hand, if the necessary reaction process data cannot be obtained, the absorbance measurement of the reaction solution is continued until the reaction process data are obtained.
続いて、取得した反応過程データに基づいて、吸光度幅を算出する(S205)。例えば、吸光度幅は、吸光度の最大値と最小値の差から算出することができる。その後、例えば、図5に示す測光ポイントで指定された測光区間の反応過程データ(吸光度)と測定時間から、「Y」を吸光度、「X」を測定時間としたときの回帰直線「Y=aX+b」の傾き「a」とY切片「b」を算出する(S206)。 Subsequently, the absorbance width is calculated based on the acquired reaction process data (S205). For example, the absorbance width can be calculated from the difference between the maximum absorbance value and the minimum absorbance value. Then, for example, from the reaction process data (absorbance) and the measurement time of the photometry section designated by the photometry points shown in FIG. ” and the Y-intercept “b” are calculated (S206).
そして、算出された回帰直線の傾きとY切片から許容幅を算出する(S207)。許容幅は、例えば、図5に示す「ばらつき許容値」(Aとする)を回帰直線の両側に設定するため、許容幅は、「Y=aX+b±A」となる。本実施の形態では、「ばらつき許容値」に任意の値を設定できるようにしているが、「ばらつき許容値」は、過去の検体や精度管理試料の反応過程データにおける標準偏差に基づいて設定されてもよい。 Then, the allowable width is calculated from the slope of the calculated regression line and the Y intercept (S207). For example, the allowable range is "Y=aX+b±A" because the "variation allowable value" (assumed to be A) shown in FIG. 5 is set on both sides of the regression line. In the present embodiment, an arbitrary value can be set for the "permissible variation value". may
その後、算出した許容幅で特定される許容範囲外のデータ数を算出して、算出したデータ数をデータ記憶部506に記憶する(S208)。 After that, the number of data outside the allowable range specified by the calculated allowable width is calculated, and the calculated number of data is stored in the data storage unit 506 (S208).
さらに、反応過程データと回帰直線との二乗誤差(Err)を算出してデータ記憶部506に記憶する(S209)。二乗誤差は、測定した吸光度(反応過程データ)と算出した回帰直線とを比較することによって算出される。二乗誤差は、反応過程データの変動が検体自体に起因する変動か、あるいは、自動分析装置100の不具合に起因する変動かを区別するために算出される。例えば、反応過程データの変動が検体の濁り成分に起因する場合、反応過程データは、一定時間間隔で徐々に増加あるいは減少する傾向がある。一方、反応過程データの変動が自動分析装置100の光学系における不具合に起因する場合、変動の傾向が一律にならずにばらつきが大きくなることが多い。
Furthermore, the squared error (Err) between the reaction process data and the regression line is calculated and stored in the data storage unit 506 (S209). The squared error is calculated by comparing the measured absorbance (reaction process data) and the calculated regression line. The squared error is calculated to distinguish whether the variation in the reaction process data is due to the sample itself or due to malfunction of the
次に、反応過程データの変動が異常変動であるいか否かを判断する(S210)。例えば、算出した許容範囲外のデータ数「B」と、算出した吸光度幅「C」と、算出した二乗誤差「Err」を、例えば、図5に示す表のように設定したポイント数「D」と、Err許容値「E」と、前処理反応の吸光度幅「F」と比較する。例えば、「B>D」かつ「Err>E」かつ「C>F」のとき、反応過程データの変動が異常変動であると判断される。ここで、判定方法は、例えば、図5の判定方法の欄に設定することができる。例えば、「OR」と設定されている場合は、「B>D」または「Err>E」または「C>F」の条件が満たされている場合に、反応過程データの変動が異常変動であると判断される。一方、例えば、「AND」と設定されている場合は、「B>D」かつ「Err>E」かつ「C>F」の条件が満たされている場合に、反応過程データの変動が異常変動であると判断される。 Next, it is determined whether or not the change in the reaction process data is an abnormal change (S210). For example, the calculated data number "B" outside the allowable range, the calculated absorbance width "C", and the calculated squared error "Err" are set, for example, as shown in the table shown in FIG. and the Err tolerance "E" and the absorbance width "F" of the pretreatment reaction. For example, when 'B>D', 'Err>E', and 'C>F', the variation in the reaction process data is determined to be an abnormal variation. Here, the determination method can be set in the determination method column in FIG. 5, for example. For example, if it is set to "OR", if the condition "B>D" or "Err>E" or "C>F" is satisfied, the fluctuation in the reaction process data is an abnormal fluctuation. is judged. On the other hand, for example, when it is set as "AND", if the conditions of "B>D", "Err>E", and "C>F" are satisfied, the fluctuation of the reaction process data is an abnormal fluctuation. is determined to be
反応過程データの変動が異常変動ではないと判断された場合は、処理を終了する。一方、反応過程データの変動が異常変動であると判断された場合、次に処理に進む。 If it is determined that the change in the reaction process data is not an abnormal change, the process ends. On the other hand, if the variation in the reaction process data is determined to be abnormal variation, the process proceeds to the next step.
続いて、反応過程データの変動が例外項目に該当するか否かが判断される(S211)。これは、反応過程データの変動が「非影響変動」である場合には、反応過程データの変動が異常変動であると判断しないことを考慮したものである。つまり、反応過程データの変動が「非影響変動」である事例を予め例外項目に登録しておくことによって、「非影響変動」を異常変動として判断されることを防止できる。 Subsequently, it is determined whether or not the change in the reaction process data corresponds to the exceptional item (S211). This is in consideration of not judging that the fluctuation of the reaction process data is abnormal fluctuation when the fluctuation of the reaction process data is "non-influencing fluctuation". In other words, by registering cases in which the reaction process data fluctuation is "non-influencing fluctuation" as an exception item in advance, it is possible to prevent "non-influencing fluctuation" from being judged as abnormal fluctuation.
例えば、例外項目は、図6に示す表のように設定される。例外項目は、例えば、検体に含まれる夾雑物を前処理反応で除去するような測定項目を示しており、前処理反応中に吸光度の変化が生じる項目を指している。各項目の前処理反応における反応過程データの変動は、基本的に図5に示すパラメータに基づいて判断される。しかしながら、「LDL-C」のような項目においては、前処理反応において目的となる特定成分以外の成分を除去するために吸光度変化が生じる(例えば、図3の検体300B参照)。これ以外にも、前処理反応において吸光度変化(「非影響変動」)が生じる項目について、予め例外条件として登録しておくことができる。このような反応過程データの変動は、項目に特有の反応過程データの変動であって「非影響変動」であることから、例外項目として追加しておき、「影響変動」と区別することができる。 For example, exception items are set as in the table shown in FIG. Exceptional items indicate, for example, measurement items in which contaminants contained in the specimen are removed by the pretreatment reaction, and indicate items in which the absorbance changes during the pretreatment reaction. Fluctuations in the reaction process data in the pretreatment reaction of each item are basically determined based on the parameters shown in FIG. However, for an item such as "LDL-C", absorbance changes occur due to the removal of components other than the target specific component in the pretreatment reaction (see, for example, sample 300B in FIG. 3). In addition to this, items that cause absorbance changes (“non-influential changes”) in the pretreatment reaction can be registered in advance as exceptional conditions. Such changes in the reaction process data are changes in the reaction process data specific to the item and are "non-influencing changes", so they can be added as exception items and distinguished from "influence changes". .
まず、例外項目に該当する場合、例えば、図6のように設定された測光区間をセットする(S212)。そして、セットされた測光区間において、反応過程データの変化方向(変化傾向)が図6のように設定された「変化方向」と一致するか否か判断される(S213)。一致する場合には、図6のように設定された吸光度の変化率と回帰直線の傾き「a」とを比較して、設定値以下であるか否かが判断される(S214)。設定値以下である場合には、反応過程データの変動が「非影響変動」であるとみなして警告対象から除外する。なお、本実施の形態では、変化方向のみに言及しているが、例えば、前処理反応における測定開始吸光度や前処理反応における反応過程データの中で濃度算出ポイントにあたる吸光度を判断材料とすることもできる。 First, if the item corresponds to the exceptional item, for example, a photometric interval set as shown in FIG. 6 is set (S212). Then, it is determined whether or not the direction of change (tendency of change) of the reaction process data in the set photometric interval matches the "direction of change" set as shown in FIG. 6 (S213). If they match, the change rate of absorbance set as shown in FIG. 6 is compared with the slope "a" of the regression line, and it is determined whether or not they are equal to or less than the set value (S214). If it is equal to or less than the set value, the change in the reaction process data is regarded as a "non-influencing change" and is excluded from the warning targets. In the present embodiment, only the direction of change is mentioned, but for example, the absorbance at the start of measurement in the pretreatment reaction or the absorbance corresponding to the concentration calculation point in the reaction process data in the pretreatment reaction may be used as criteria for judgment. can.
それ以外の場合は、前処理反応における反応過程データの変動が異常変動(「影響変動」)であることを表示して(S215)、測定者に通知する。この通知方法は、図9に示すような表示例に限定されず、例えば、反応過程データに異常を示すアラームを付加する方法や自動分析装置100から警告音を鳴らす方法などによって警告することもできる。 Otherwise, it is displayed (S215) that the change in the reaction process data in the pretreatment reaction is an abnormal change (“effect change”), and is notified to the measurer. This notification method is not limited to the example of display shown in FIG. .
続いて、例えば、図5の「測定継続」の欄を参照して、測定中断設定がされているか否かを判断する(S216)。「停止」と設定されていた場合には、測定を中止する(S217)。一方、「継続」と設定されていた場合は、測定を継続して特定成分の濃度を算出する(S218)。以上のようにして、反応過程データの解析動作が終了する。 Next, for example, referring to the column of "measurement continuation" in FIG. 5, it is determined whether or not measurement interruption is set (S216). If "stop" is set, the measurement is stopped (S217). On the other hand, if "continue" is set, the measurement is continued to calculate the concentration of the specific component (S218). As described above, the reaction process data analysis operation is completed.
<動作の変形例>
上述した動作では、例外条件を設定することにより、反応過程データの「非影響変動」を反応過程データの異常変動とは判断しない例を説明したが、例外条件を設定するのではなく、反応過程データの異常変動を判断する条件に例外条件を組み込むこともできる。
図13は、動作の変形例を説明するフローチャートである。<Modified example of operation>
In the operation described above, by setting an exception condition, an example was explained in which the "non-influential fluctuation" of the reaction process data is not judged to be an abnormal fluctuation of the reaction process data. Exceptional conditions can also be incorporated into the conditions for judging abnormal data fluctuations.
FIG. 13 is a flow chart for explaining a modification of the operation.
本変形例では、図11に示すフローチャートに示す動作を実施した後、反応過程データの変動の変化方向を特定する(S301)。例えば、反応過程データの変動が「単調減少」や「単調増加」や「増減の繰り返し」などであるかを特定する。その後、本変形例では、反応過程データの異常変動であるか否かを判断する(S302)。ここでの判断は、実施の形態で使用した判断条件だけではなく、反応過程データの変動の変化方向と変化率に関する例外条件に相当する条件も加味されて、反応過程データの変動が異常変動であるか否かが判断される。例えば、S302での変化方向に関する判断は、S301で特定された変化方向に基づいて行われ、かつ、S302での変化率に関する判断は、S206で算出した回帰直線の傾きが設定値以下であるか否かに基づいて行われる。これにより、本変形例においても、反応過程データの「非影響変動」を反応過程データの異常変動とは判断しないようにすることができる。その後の動作は、図12に示す実施の形態と同様なので説明は省略する。以上のようにして、本変形例の動作が行われる。 In this modified example, after performing the operation shown in the flowchart shown in FIG. 11, the change direction of the fluctuation of the reaction process data is specified (S301). For example, it specifies whether the variation in the reaction process data is "monotonically decreasing," "monotonically increasing," or "repetitive increase/decrease." After that, in this modified example, it is determined whether or not there is an abnormal change in the reaction process data (S302). In this judgment, not only the judgment conditions used in the embodiment, but also the conditions corresponding to the exception conditions regarding the change direction and change rate of the fluctuation of the reaction process data are taken into consideration, and the fluctuation of the reaction process data is an abnormal fluctuation. It is determined whether there is For example, the determination of the direction of change in S302 is made based on the direction of change specified in S301, and the determination of the rate of change in S302 is based on whether the slope of the regression line calculated in S206 is equal to or less than the set value. or not. As a result, even in this modified example, it is possible not to judge the "non-influential variation" of the reaction process data as an abnormal variation of the reaction process data. Since the subsequent operation is the same as that of the embodiment shown in FIG. 12, the explanation is omitted. As described above, the operation of this modified example is performed.
<反応過程データの変動原因の推定>
例えば、反応過程データの変動は、自動分析装置に起因する光学系が原因の場合、ランダムに変動することが多い。一方、検体中に含まれる夾雑物は、試薬成分と反応しているため、異常な反応であるが、一定方向に吸光度が上昇/低下するなどの特徴的な変化をすることが多い。さらには、反応過程データの変動が検体の濁り成分に起因する場合、反応過程データは、一定時間間隔で徐々に増加あるいは減少する傾向がある。一方、反応過程データの変動が自動分析装置の光学系における不具合に起因する場合、変動の傾向が一律にならずにばらつきが大きくなることが多い。<Estimation of the cause of variation in reaction process data>
For example, fluctuations in reaction process data often fluctuate randomly due to optical systems of automatic analyzers. Contaminants contained in the sample, on the other hand, react with the reagent components, so they are abnormal reactions, but often exhibit characteristic changes such as an increase/decrease in absorbance in a certain direction. Furthermore, when fluctuations in the reaction process data are caused by turbidity components of the sample, the reaction process data tend to gradually increase or decrease at regular time intervals. On the other hand, when fluctuations in the reaction process data are caused by defects in the optical system of the automatic analyzer, the tendency of the fluctuations is not uniform and the fluctuations often increase.
このように反応過程データの変動には、検体に含まれる夾雑物に起因する変動と自動分析装置の機構や測定条件に起因する変動がある。したがって、反応過程データの変動が、検体自体に起因しているのか、あるいは、自動分析装置の機構や測定条件に起因しているのかを特定することができれば、反応過程データの変動原因を突き止めることができるので、その後の対応が容易となる。 In this way, fluctuations in reaction process data include fluctuations caused by contaminants contained in the sample and fluctuations caused by the mechanism of the automatic analyzer and the measurement conditions. Therefore, if it is possible to identify whether fluctuations in the reaction process data are caused by the specimen itself or by the mechanism of the automatic analyzer and the measurement conditions, the cause of the fluctuations in the reaction process data can be identified. This makes it easier to deal with later.
この点に関し、1テスト単位の解析では、検体自体に起因しているのか、あるいは、自動分析装置の機構や測定条件に起因しているのかを特定することは困難である。 Regarding this point, it is difficult to determine whether the problem is caused by the specimen itself or by the mechanism or measurement conditions of the automatic analyzer in the analysis of one test unit.
そこで、本実施の形態では、1テスト単位(1つの検体に対する反応過程データ単位)の解析の他に、複数の検体に対する反応過程データを蓄積し、この蓄積した複数の検体に対する反応過程データを解析することにより、反応過程データの変動原因を推定している。
以下では、この技術的思想を具現化した自動分析装置について説明する。Therefore, in the present embodiment, in addition to the analysis of one test unit (reaction process data unit for one specimen), reaction process data for a plurality of specimens are accumulated, and the accumulated reaction process data for the plurality of specimens are analyzed. By doing so, we estimate the cause of fluctuations in the reaction process data.
An automatic analyzer embodying this technical idea will be described below.
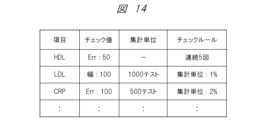
図4において、自動分析装置100は、特定条件設定部600と変動原因推定部601とを有している。特定条件設定部600は、反応過程データの変動原因を特定するための特定条件を設定するように構成されている。例えば、特定条件設定部600では、図14に示す特定条件が設定される。図14において、例えば、「HDL」では、「チェック値」として二乗誤差(Err)が「50」に設定され、かつ、「チェックルール」が「連続5回」に設定されている。これは、「HDL」に対する蓄積された反応過程データにおいて、二乗誤差が「50」以上である反応過程データが連続して5回以上検出された場合(「チェックルール」に違反した場合)、反応過程データの変動が自動分析装置の機構や測定条件に起因すると判断するものである。なぜなら、連続して5回以上もばらつきの大きな反応過程データが測定されるのは、検体自体が変動原因とは考えにくく、自動分析装置の機構や測定条件が変動原因である蓋然性が高いと考えられるからである。また、「LDL」では、「チェック値」として、幅(吸光度幅)が「100」に設定され、かつ、「集計単位」が「1000テスト」に設定され、かつ、「チェックルール」が「集計単位:1%」に設定されている。これは、「LDL」に対する蓄積された反応過程データにおいて、吸光度幅が「100」以上である反応過程データが1000テストのうちの1%以上の高頻度で測定された場合(「チェックルール」に違反した場合)、反応過程データの変動が自動分析装置の機構や測定条件に起因すると判断するものである。なぜなら、高頻度で吸光度幅の大きな反応過程データが測定されるのは、検体自体が変動原因とは考えにくく、自動分析装置の機構や測定条件が変動原因であると考えられるからである。
In FIG. 4 , the
そして、変動原因推定部601は、特定条件設定部600で設定した特定条件(図14参照)に基づいて、検体自体に起因しているのか、あるいは、自動分析装置の機構や測定条件に起因しているのかを特定するように構成されている。 Based on the specific conditions (see FIG. 14) set by the specific condition setting unit 600, the fluctuation cause estimation unit 601 determines whether the fluctuation is caused by the sample itself or by the mechanism of the automatic analyzer and the measurement conditions. is configured to identify whether
変動原因推定部601による反応過程データの変動原因の推定は、例えば、図15に示すフローチャートにしたがって行われる。図15は、反応過程データの変動原因を推定する動作を説明するフローチャートである。図15において、まず、例えば、反応過程データを解析することにより、図14に示す「チェック値」に設定された項目のデータを取得してデータ記憶部506に記憶する(S401)。 The estimation of the variation cause of the reaction process data by the variation cause estimation unit 601 is performed, for example, according to the flowchart shown in FIG. FIG. 15 is a flowchart for explaining the operation of estimating the cause of variation in reaction process data. In FIG. 15, first, for example, by analyzing the reaction process data, the data of the item set as the "check value" shown in FIG. 14 is acquired and stored in the data storage unit 506 (S401).
次に、所定数のデータが蓄積されたか否かを判断する(S402)。例えば、図14に示す「HDL」の場合、5個以上の「二乗誤差」が蓄積されているか否かが判断される。また、図14に示す「LDL」の場合、1000個以上の「幅(吸光度幅)」が蓄積されているか否かが判断される。 Next, it is determined whether or not a predetermined number of data has been accumulated (S402). For example, in the case of "HDL" shown in FIG. 14, it is determined whether or not five or more "squared errors" are accumulated. In the case of "LDL" shown in FIG. 14, it is determined whether or not 1000 or more "widths (absorbance widths)" are accumulated.
続いて、蓄積されたデータが所定数以上に達した場合、図14に示す「チェックルール」に違反しているか否かが判断される(S403)。「チェックルール」に違反している場合には、反応過程データの変動が自動分析装置の機構や測定条件に起因すると推定して、警告を表示する(S404)。図16は、警告表示の一例を示す図である。 Subsequently, when the accumulated data reaches a predetermined number or more, it is determined whether or not the "check rule" shown in FIG. 14 is violated (S403). If the "check rule" is violated, it is presumed that the variation in the reaction process data is caused by the mechanism of the automatic analyzer and the measurement conditions, and a warning is displayed (S404). FIG. 16 is a diagram showing an example of warning display.
このようにして、前処理反応における反応過程データの変動が連続で発生、あるいは、高頻度で発生している場合は、検体の夾雑物が変動原因ではなく、自動分析装置の機構や測定条件が変動原因である蓋然性が高いことから、警告を表示して、自動分析装置の機構の点検や測定条件の見直しを促すことができる。 In this way, when fluctuations in the reaction process data in the pretreatment reaction occur continuously or occur frequently, the cause of the fluctuations is not contaminants in the sample, but the mechanism of the automatic analyzer and the measurement conditions. Since there is a high probability that this is the cause of the fluctuation, a warning can be displayed to encourage inspection of the mechanism of the automatic analyzer and review of the measurement conditions.
<応用例>
本実施の形態における技術的思想を具現化するための反応過程データの解析手法の1つとして、直線近似法を例に挙げて説明したが、反応過程データの解析手法としては、これに限らず、例えば、以下に示す解析手法を挙げることもできる。<Application example>
As one of the reaction process data analysis methods for embodying the technical idea in the present embodiment, the linear approximation method has been described as an example, but the reaction process data analysis method is not limited to this. , for example, the analysis method shown below can also be mentioned.
この解析手法とは、前処理反応での反応過程データの解析対象区間において、対象となる測光ポイントにおける吸光度とその直前の測光ポイントにおける吸光度との差分を計算して、前処理反応での反応過程データを解析する手法である。 This analysis method calculates the difference between the absorbance at the target photometric point and the absorbance at the immediately preceding photometric point in the analysis target section of the reaction process data in the pretreatment reaction, and calculates the reaction process in the pretreatment reaction. It is a method of analyzing data.
図17は、UA(尿酸)の反応過程データの例を示すグラフである。この反応過程データでは、「測光ポイント1」から「測光ポイント19」までの時間が前処理反応に対応し、「測光ポイント20」から「測光ポイント38」までの範囲が本反応に対応している。
FIG. 17 is a graph showing an example of reaction process data of UA (uric acid). In this reaction process data, the time from "
検体700Aに対するグラフでは前処理反応における反応過程データはほぼフラットである。これは、前処理反応における反応過程データの変動が少なく正常であることを示している。これに対し、検体700Bに対するグラフでは、前処理反応における反応過程データがフラットではなく増加傾向にある。通常、前処理反応における反応過程データはフラットであるため、増加傾向を示す検体700Bの反応過程データは異常である。これは前述の通り、「影響変動」に該当する。
In the graph for
図18は、CRE(クレアチニン)の反応過程データの例を示すグラフである。検体800Aに対するグラフでは、前処理反応における反応過程データは、ほぼフラットである。これは、前処理反応における反応過程データの変動が少なく正常であることを示している。一方、検体800Bでは、5ポイント付近の測光ポイントに突発的な吸光度上昇がある。この吸光度の変動はCREの濃度計算に影響しない「非影響変動」に該当する。ただし、このような変動は、その頻度が高頻度であるか否かによって自動分析装置自体の光学系に原因があることもある。
FIG. 18 is a graph showing an example of CRE (creatinine) reaction process data. In the graph for
このような反応過程データを解析するための条件が条件設定部501で設定される。例えば、図19は、条件設定部501で設定される初期条件の一例を示す表である。図19において、「項目」ごとに設定される条件には、「測光ポイント」、「変動許容値」、「ばらつき許容吸光度差」、「ポイント数」、「判定方法」、「測定継続」がある。
Conditions for analyzing such reaction process data are set by the
「測光ポイント」には、反応過程データの解析に使用される測光区間が規定される。例えば「測光ポイント」に「5-19」と記載されている場合。「測光ポイント5」から「測光ポイント19」の反応過程データを使用して、反応過程データの解析が行われる。
The “photometric point” defines a photometric interval used for analysis of reaction process data. For example, when "5-19" is written in the "photometry point". Analysis of the reaction process data is performed using the reaction process data from "
「変動許容値」には、「測光ポイント」で指定した区間における変動量の許容値が規定される。例えば「±200」と記載されている場合、指定した区間内で許容される変動の範囲は「±200」であることを意味する。「変動許容値」に「15%」と百分率で記載されている場合、指定した区間内で許容される変動の範囲は、解析対象の反応過程データの吸光度幅の「15%」であることを意味する。 The "permissible fluctuation value" defines the permissible value for the amount of fluctuation in the section specified by the "photometry point". For example, when "±200" is written, it means that the range of variation allowed within the specified interval is "±200". If "15%" is written as a percentage in "Variation tolerance", the range of allowable variation within the specified interval is "15%" of the absorbance width of the reaction process data to be analyzed. means.
ここで、例えば、「変動許容値」が絶対数値で記載されている場合、本反応における反応過程データを測定することなく、前処理反応における反応過程データを測定した段階(測定の早い段階)で異常の有無を判断することできる。 Here, for example, when the "permissible variation value" is described as an absolute value, at the stage of measuring the reaction process data in the pretreatment reaction (early stage of measurement) without measuring the reaction process data in the main reaction It is possible to judge the presence or absence of abnormality.
一方、「変動許容値」が解析対象の反応過程データの吸光度幅に対する百分率で記載されている場合、前処理反応と本反応を合わせた全体の反応過程データを測定した段階でないと、「変動許容値」に基づく異常の有無を判断することができないが、「変動許容値」を絶対数値で表現することが困難な場合に有効である。 On the other hand, if the "variation tolerance" is described as a percentage of the absorbance width of the reaction process data to be analyzed, the "variation tolerance However, it is effective when it is difficult to express the "permissible fluctuation value" in terms of absolute numerical values.
「ばらつき許容吸光度差」には、「測光ポイント」で規定した区間における隣り合う吸光度の差の許容される範囲が規定される。例えば「ばらつき許容吸光度差」に「100」と記載されている場合、「測光ポイント」で規定した区間における隣り合う吸光度の差の許容値が「100」であることを意味する。「ばらつき許容吸光度差」に「15%」と記載されている場合、「測光ポイント」で指定した区間における隣り合う吸光度の差の許容値は、解析対象の反応過程データの全体の吸光度変化量の「15%」であることを意味する。この場合においても、「変動許容値」と同様に、条件を絶対数値で表現した場合には、本反応における反応過程データを測定することなく、前処理反応における反応過程データを測定した段階(測定の早い段階)で異常の有無を判断することできる。一方、条件を百分率で表現することは、「ばらつき許容吸光度差」を絶対数値で表現することが困難な場合に有効である。 The "permissible absorbance difference variation" defines the allowable range of the difference between adjacent absorbances in the section defined by the "photometry point". For example, if the "permissible absorbance difference variation" is "100", it means that the allowable value for the difference between adjacent absorbances in the section defined by the "photometry point" is "100". If "15%" is entered in "Allowable absorbance difference for variation", the allowable value for the difference between adjacent absorbances in the section specified in "Photometry point" is the amount of change in absorbance for the entire reaction process data to be analyzed. It means "15%". Even in this case, as with the “permissible fluctuation value”, when the conditions are expressed as absolute numerical values, the reaction process data in the pretreatment reaction is measured without measuring the reaction process data in the main reaction (measurement It is possible to judge the presence or absence of abnormality at the early stage of On the other hand, expressing the conditions in terms of percentages is effective when it is difficult to express the "permissible absorbance difference for variations" in absolute numerical values.
「ポイント数」には、「測光ポイント」で規定した区間における隣り合う吸光度の差の中で、「ばらつき許容吸光度差」の範囲外にあるデータ個数が規定される。例えば、「ポイント数」が「2」と記載されている場合、「測光ポイント」で規定した区間における隣り合う吸光度の差が、「ばらつき許容吸光度差」の範囲外にあるデータ数が「2」以下であれば許容範囲内であることを意味する。言い換えれば、「測光ポイント」で規定した区間における隣り合う吸光度の差が、「ばらつき許容吸光度差」の範囲外にあるデータ数が「2」よりも多ければ許容範囲外であることを意味する。 The "number of points" defines the number of data that are outside the range of the "permissible absorbance variation" among the differences in adjacent absorbances in the section defined by the "photometry points". For example, if the "number of points" is described as "2", the number of data in which the difference between adjacent absorbances in the section defined by the "photometry points" is outside the range of the "permissible absorbance variation" is "2". If it is below, it means that it is within the allowable range. In other words, the difference between adjacent absorbances in the section defined by the “photometry point” is out of the allowable range if the number of data outside the range of “permissible absorbance variation” is greater than “2”.
「判定方法」には解析に関する複数の条件を「AND条件」で判定するか、あるいは、「OR条件」として使用するのかについて規定される。 In the "judgment method", it is specified whether a plurality of conditions related to analysis are judged by "AND condition" or used as "OR condition".
「測定継続」には、反応過程データに異常変動があった場合に測定を継続するか、あるいは、測定を中断するのかについて規定される。 "Measurement continuation" specifies whether to continue or interrupt the measurement when there is an abnormal change in the reaction process data.
次に、近似関数を使用した反応過程データの解析手法と同様に、本解析手法においても、自動分析装置100において「影響変動」を異常変動として検出する一方、「非影響変動」を異常変動として検出しないために、条件設定部501において、図19に示す条件だけでなく、図20に示すような例外条件も使用する。
Next, similarly to the reaction process data analysis method using an approximation function, in this analysis method, the
図20は、例外条件の一例を示す表である。図20において、「項目」には、濃度の測定対象となる成分が設定される。例えば、「項目」に「AST」が設定されている場合、「AST」の反応過程データを異常変動としないための例外条件が規定される。この例外条件には「測光ポイント」、「変化方向」、「変動許容値」がある。 FIG. 20 is a table showing an example of exceptional conditions. In FIG. 20, the "item" is set with the component whose concentration is to be measured. For example, when "AST" is set in the "item", an exception condition is defined to prevent the reaction process data of "AST" from being anomalous fluctuations. The exception conditions include "photometry point", "change direction", and "fluctuation tolerance".
「測光ポイント」には、反応過程データの測光区間が規定される。例えば、「測光ポイント」に「5-19」と記載されている場合、「測光ポイント5」から「測光ポイント19」の反応過程データが例外条件の適用範囲となることを意味している。
The "photometry point" defines a photometry interval of the reaction process data. For example, if "5-19" is written in the "photometry point", it means that the reaction process data from "
「変化方向」には、例外条件となる反応過程データの変化の方向が規定される。例えば、「変化方向」が「連続減少」である場合に例外条件が適用されることを意味している。 The "direction of change" defines the direction of change of the reaction process data as an exception condition. For example, it means that the exceptional condition is applied when the "direction of change" is "continuous decrease".
「変動許容値」には、例外条件となる反応過程データの許容値が規定される。例えば「変動許容値」が「-400」と記載されている場合、「-400」以上であれば例外条件が適用されることを意味している。 In the "permissible fluctuation value", the permissible value of the reaction process data that is an exception condition is defined. For example, when the "permissible fluctuation value" is described as "-400", it means that the exceptional condition is applied if it is "-400" or more.
なお、「コメント」の欄には、反応過程データの変動が生じる要因を端的に記載することができる。「コメント」の欄に「弱乳び影響」と記載されている場合には「弱乳び」によって、反応過程データに例外条件に該当する変動が生じていると理解できる。 In addition, in the column of "comment", it is possible to simply describe the factors that cause fluctuations in the reaction process data. When "weak chyle effect" is described in the "comment" column, it can be understood that "weak chyle" causes fluctuations corresponding to exceptional conditions in the reaction process data.
条件設定部501で設定された吸光度解析に関する条件(図19および図20)は、データ記憶部506に記憶される。そして、異常変動判断部502では、条件設定部501で設定された吸光度解析に関する条件に基づいて、以下に示す判断処理が行われる。
The conditions (FIGS. 19 and 20) related to the absorbance analysis set by the
異常変動判断部502は、条件設定部501で設定された「測光ポイント」で演算処理を実施する。具体的に、「m-n」と指定されていた場合、測光ポイント「x」における吸光度「A(x)」とその直前の測光ポイント「x-1」における吸光度「A(x-1)の差{A(x)-A(x-1)}を測光ポイント「x=m」から測光ポイント「x=n」まで繰り返す。異常変動判断部502は、測光ポイント「x=m」から測光ポイント「x=n」まで{A(x)-A(x-1)}を計算した後、この演算した結果を合計して、「変動許容値」の範囲内に収まっているか否かを判断する。
The abnormal
具体的な例を以下に示す。
図21は、図17に示す反応過程データの前処理反応である測光ポイント「1」から測光ポイント「19」までの区間において、吸光度「A(x)」とその直前の吸光度「A(x-1)」との差{A(x)-A(x-1)}を計算して、時系列順にプロットしたグラフである。Specific examples are shown below.
FIG. 21 shows the absorbance “A(x)” and the absorbance “A(x- 1)” and the difference {A(x)-A(x-1)} is calculated and plotted in chronological order.
図17に示すように、検体700Aの場合、前処理反応における吸光度の変動がほとんどないため、図21に示す検体700Aでの吸光度「A(x)」とその直前の吸光度「A(x-1)」との差{(A(x)-A(x-1))は、「0」に近いデータで推移する。一方、検体700Bの場合、前処理反応において、時間経過に依存して吸光度が徐々に上昇している反応過程データであるため、図21に示す検体700Bのグラフは、常に「0」以上の値をとっている。このことから、検体700Bのような反応過程データの場合、測光ポイント「x=m」から測光ポイント「x=n」までの{A(x)-A(x-1)}を合計した値が大きくなる。なお、変動の方向が減少方向だった場合は、測光ポイント「x=m」から測光ポイント「x=n」までの{A(x)-A(x-1)}を計算した値を合計した値は小さくなる。異常判断部502は、条件設定部501で設定した「変動許容値」と、測光ポイント「x=m」から測光ポイント「x=n」までの{A(x)-A(x-1)}を合計した値とを比較して、前処理反応における反応過程データの変動が大きいか否かを評価する。
As shown in FIG. 17, in the case of the
次に、異常判断部502は、測光ポイント「x=m」から測光ポイント「x=n」まで{A(x)-A(x-1)}を計算したそれぞれの値の絶対値が、条件設定部501で設定された「ばらつき許容吸光度差」以下であるか否かを判定する。このとき、測光ポイント「x=m」から測光ポイント「x=n」まで{(A(x)-A(x-1))を計算したそれぞれの値の絶対値が「ばらつき許容吸光度差」を超えたデータ数が条件設定部501で設定された「ポイント数」を超えているか否かを確認する。
Next, the
図22は、図18に示す反応過程データの前処理反応である測光ポイント「1」から測光ポイント「19」の区間において、吸光度「A(x)」とその直前の吸光度A(x-1)の差{A(x)-A(x-1)}を計算して、時系列順にプロットしたグラフである。 FIG. 22 shows the absorbance “A(x)” and the absorbance A(x−1) immediately before that in the section from the photometric point “1” to the photometric point “19” which is the preprocessing reaction of the reaction process data shown in FIG. is a graph plotting the difference {A(x)-A(x-1)} in chronological order.
図18に示す検体800Aの場合、前処理反応における吸光度の変動がほとんどないため、図22に示す検体800Aでの吸光度A(x)とその直前の吸光度A(x-1)の差{A(x)-A(x-1)}は、「0」に近いデータで推移する。一方、図18に示す検体800Bの場合、前処理反応の区間において、数ポイントのばらつきがあるため、吸光度A(x)とその直前の吸光度A(x-1)の差{A(x)-A(x-1))は「0」付近で安定することなく、大きくばらついている。
In the case of the
しかしながら、検体800Bでは、吸光度A(x)とその直前の吸光度A(x-1)の差{A(x)-A(x-1))がプラス側とマイナス側に変動しているため、測光ポイント「x=m」から測光ポイント「x=n」までの吸光度A(x)とその直前の吸光度A(x-1)の差{A(x)-A(x-1)}の合計値は、検体700Bの場合よりも小さくなる。このため、本解析手法でも、連続的な吸光度の上昇や減少と吸光度のばらつきを区別することができる。
However, in the
図22に示す破線は、条件設定部501で設定したCREの「ばらつき許容吸光度差」に設定した「±30」で描いている。検体800Aは全てのデータが破線の内側にあるため、異常なしと判断される。一方、検体800Bは条件設定部501において指定した「測光ポイント」において、4点のデータが破線を超えている。したがって、検体800Bは、条件設定部501で設定したCREの「ポイント数」である「2」よりも大きいため、異常と判断される。
The dashed line shown in FIG. 22 is drawn with “±30” set in the “permissible absorbance variation” of CRE set by the
ここで、異常変動判断部502は、反応過程データの変動が条件設定部501で設定された例外条件(図20参照)に該当する場合、上述した結果にかかわらず、反応過程データの変動が異常変動ではないと判断する。
Here, if the reaction process data fluctuation corresponds to the exception condition (see FIG. 20) set by the
なお、例えば、図19に示すように、条件設定部501で設定された「判定方法」に従って前処理反応における反応過程データが異常であるか否かが判定される。「判定方法」が「AND条件」で設定されていた場合、異常変動判断部502は、測光ポイント「x=m」から測光ポイント「x=n」まで{A(x)-A(x-1)}を計算した後、この演算した結果を合計した値が「変動許容値」を超えており、かつ、「ばらつき許容吸光度差」を超えたデータ数が「ポイント数」を上回っている場合に異常と判断する。
For example, as shown in FIG. 19, whether or not the reaction process data in the pretreatment reaction is abnormal is determined according to the “determination method” set by the
これに対し、「OR条件」が設定されている場合、異常変動判断部502は、上述した2条件のいずれかが条件設定部501で設定された値を超えた場合に異常と判断する。
On the other hand, when the “OR condition” is set, the abnormal
異常判断部502は、このような判断を行った後、条件設定部501で設定された例外条件に該当するか否かを判断し、例外条件に該当する場合、異常判断部502は、前処理反応での反応過程データの変動が異常変動ではないと判断する。
その他の特徴や動作に関しては近似関数を使用した解析手法と同様である。After making such determination, the
Other features and operations are the same as the analysis method using the approximation function.
図23は、反応過程データの異常変動を上述した解析手法で検出するための流れを説明するフローチャートである。本応用例では、反応過程データで連続して測定される吸光度の差を用いることにより解析する手法を示す。 FIG. 23 is a flow chart for explaining the flow for detecting abnormal fluctuations in the reaction process data using the analysis method described above. In this application example, a method of analyzing by using the difference in absorbance continuously measured in the reaction process data is shown.
まず、光度計で検体と第1試薬を混合した反応液の吸光度を測定する(S501)。これにより、前処理反応における反応過程データが取得される(S502)。取得された反応過程データは、自動分析装置100のデータ記憶部506に記憶される(S503)。ここで、例えば、データ記憶部506は、自動分析装置100に含まれている構成を前提としているが、これに限らず、データ記憶部506は、自動分析装置100とネットワーク接続されたサーバなどに搭載されていてもよい。
First, a photometer is used to measure the absorbance of a reaction solution obtained by mixing a sample and a first reagent (S501). Thereby, reaction process data in the pretreatment reaction is acquired (S502). The acquired reaction process data is stored in the
次に、自動分析装置100は、前処理反応における反応過程データの解析に必要な測定ポイント(測光区間)の反応過程データが取得できたかを判断する(S504)。続いて、自動分析装置100は、条件設定部501で指定された「測光ポイント」の区間(「m-n」)において、測光ポイント「x=m」から測光ポイント「x=n」までの吸光度で吸光度差{A(x)-A(x-1)}を計算する(S505)。そして、自動分析装置100は、算出された吸光度差{A(x)-A(x-1)}の合計を計算する(S506)。
Next, the
次に、自動分析装置100は、許容値を算出する。例えば、図19に示すように、条件設定部501で「変動許容値」や「ばらつき許容吸光度差」を百分率で設定した場合は、解析対象の反応過程データの吸光度幅を基準として、許容値を計算する(S507)。そして、許容値と算出された吸光度差{A(x)-A(x-1)}の絶対値を比較して、許容範囲外となるデータ数を算出する(S508)。本応用例では、任意の数値を入力できるようにしているが、「変動許容値」と「ばらつき許容吸光度差」は過去の検体や精度管理試料の反応過程データを統計的に解析した値に基づいて設定されてもよい。
Next, the
反応過程データが異常変動であるか否かの判断は、例えば、図12の「S210」、図13の「S302」で実施する。本応用例では、条件設定部501に設定した「変動許容値」、「ポイント数」、「判定条件」に従って、異常判断部502で実施する。例えば、算出した吸光度差{A(x)-A(x-1)}の合計「G」と許容範囲外のデータ個数「H」を、条件設定部501で設定した変動許容値「I」と、ポイント数「K」とを比較する。「G>I」かつ「H>K」のとき、反応過程データは異常変動であると判定される。ここで「判定方法」に「OR」と設定されている場合は、「G>I」または「H>K」のとき、反応過程データは異常変動であると判定される。
The determination of whether or not the reaction process data is an abnormal variation is performed, for example, in "S210" of FIG. 12 and "S302" of FIG. In this application example, the
それ以降の判定処理は、近似直線を使用した解析手法(図12~図16)と同様の処理を行うことにより、反応過程データの変動原因の推定等を実現することができる。 Subsequent determination processing is performed in the same manner as the analysis method using the approximate straight line (FIGS. 12 to 16), thereby estimating the cause of variation in the reaction process data, etc., can be realized.
以上、本発明者によってなされた発明をその実施の形態に基づき具体的に説明したが、本発明は前記実施の形態に限定されるものではなく、その要旨を逸脱しない範囲で種々変更可能であることは言うまでもない。 Although the invention made by the present inventor has been specifically described based on the embodiment, the invention is not limited to the above embodiment, and can be variously modified without departing from the gist of the invention. Needless to say.
1 分析部
2 検体容器
3 検体ラック
4 搬送ライン
5 検体プローブ
6 試薬プローブ
7 試薬容器
8 試薬ディスク
9 反応容器
10 反応ディスク
11 撹拌部
12 光度計
13 洗浄部
14 記憶部
15 表示部
16 操作部
17 制御部
100 自動分析装置
200A 検体
200B 検体
300A 検体
300B 検体
500 反応過程データ取得部
501 条件設定部
502 異常変動判断部
503 パラメータ決定部
504 出力部
505 測定中断部
506 データ記憶部
600 特定条件設定部
601 変動原因推定部
700A 検体
700B 検体
800A 検体
800B 検体1
Claims (15)
前記検体と前記試薬との反応は、
前記検体と第1の試薬とを反応させる前処理反応と、
前記検体と前記第1の試薬以外の試薬とを反応させる本反応と、
を含み、
前記自動分析装置は、
前記前処理反応において吸光度を時系列で測定することにより反応過程データを取得するように構成された反応過程データ取得部と、
吸光度に関する条件を設定するように構成された条件設定部と、
前記条件設定部で設定された前記条件に基づいて、前記前処理反応で取得された前記反応過程データの変動が前記本反応における前記特定成分の濃度の測定に影響を及ぼす変動であるか否かを判断するように構成された異常変動判断部と、
前記異常変動判断部で判断された判断結果を出力するように構成された出力部と、
を備え、
前記条件設定部で設定される前記条件には、前記前処理反応で取得された前記反応過程データの変動が前記本反応における前記特定成分の濃度の測定に影響を及ぼさない変動であることを示す例外条件も含まれ、
前記異常変動判断部は、前記前処理反応で取得された前記反応過程データの変動が前記例外条件に該当する場合、前記反応過程データの変動が異常変動ではないと判断するように構成される、自動分析装置。An automatic analyzer configured to measure the concentration of a specific component contained in the specimen based on the absorbance of the reaction liquid between the specimen and the reagent,
The reaction between the specimen and the reagent is
a pretreatment reaction for reacting the specimen with a first reagent;
a main reaction in which the specimen and a reagent other than the first reagent are reacted;
including
The automatic analyzer is
a reaction process data acquisition unit configured to acquire reaction process data by measuring absorbance in time series in the pretreatment reaction;
a condition setting unit configured to set a condition related to absorbance;
Whether or not the variation in the reaction process data acquired in the pretreatment reaction is variation that affects the measurement of the concentration of the specific component in the main reaction, based on the conditions set by the condition setting unit an abnormal change determination unit configured to determine
an output unit configured to output a determination result determined by the abnormal fluctuation determination unit;
with
The condition set by the condition setting unit indicates that the variation in the reaction process data acquired in the pretreatment reaction is a variation that does not affect the measurement of the concentration of the specific component in the main reaction. including exceptions,
The abnormal change determination unit is configured to determine that the change in the reaction process data is not an abnormal change when the change in the reaction process data acquired in the pretreatment reaction corresponds to the exception condition. Automatic analyzer.
吸光度に関する前記条件は、吸光度の範囲を示す吸光度幅を含む、自動分析装置。In the automatic analyzer according to claim 1,
The automated analyzer, wherein the conditions related to absorbance include an absorbance width indicating a range of absorbance.
前記異常変動判断部は、近似関数で前記反応過程データをフィッティングすることにより前記近似関数に含まれるパラメータを決定するように構成されたパラメータ決定部を有する、自動分析装置。In the automatic analyzer according to claim 1,
The automatic analyzer, wherein the abnormal fluctuation determination unit has a parameter determination unit configured to determine parameters included in the approximate function by fitting the reaction process data with the approximate function.
前記条件設定部は、前記近似関数からの許容されるずれの範囲を示す許容範囲を設定するように構成され、
前記異常変動判断部は、前記許容範囲に基づいて、前記前処理反応で取得された前記反応過程データの変動が異常変動であるか否かを判断するように構成される、自動分析装置。In the automatic analyzer according to claim 3,
The condition setting unit is configured to set an allowable range indicating a range of allowable deviation from the approximation function,
The automatic analyzer, wherein the abnormal variation determination unit is configured to determine whether or not the variation in the reaction process data acquired in the pretreatment reaction is an abnormal variation based on the allowable range.
前記条件設定部は、前記近似関数と前記反応過程データとの二乗誤差の許容範囲を設定するように構成され、
前記異常変動判断部は、前記許容範囲に基づいて、前記前処理反応で取得された前記反応過程データの変動が異常変動であるか否かを判断するように構成される、自動分析装置。In the automatic analyzer according to claim 3,
The condition setting unit is configured to set an allowable range of square error between the approximation function and the reaction process data,
The automatic analyzer, wherein the abnormal variation determination unit is configured to determine whether or not the variation in the reaction process data acquired in the pretreatment reaction is an abnormal variation based on the allowable range.
前記自動分析装置は、前記異常変動判断部で前記反応過程データの変動が前記本反応における前記特定成分の濃度の測定に影響を及ぼす変動であると判断された場合、前記検体に含まれる特定成分の濃度の測定を中断するように構成された測定中断部を有する、自動分析装置。In the automatic analyzer according to claim 1,
In the automatic analyzer, when the abnormal change determination unit determines that the change in the reaction process data is a change that affects the measurement of the concentration of the specific component in the main reaction, the specific component contained in the sample an automated analyzer having a measurement interrupter configured to interrupt the measurement of the concentration of
前記前処理反応は、前記特定成分以外の成分であって前記本反応における前記吸光度の測定に影響を及ぼす妨害成分を除去する反応であり、
前記本反応は、前記特定成分の濃度を測定するための反応である、自動分析装置。In the automatic analyzer according to claim 1,
The pretreatment reaction is a reaction for removing components other than the specific component that interfere with the measurement of the absorbance in the main reaction,
The automatic analyzer, wherein the main reaction is a reaction for measuring the concentration of the specific component.
前記自動分析装置は、前記本反応における吸光度と前記前処理反応における吸光度との差分に基づいて、前記特定成分の濃度を測定するように構成される、自動分析装置。In the automatic analyzer according to claim 1,
The automatic analyzer is configured to measure the concentration of the specific component based on the difference between the absorbance in the main reaction and the absorbance in the pretreatment reaction.
前記自動分析装置は、
複数の前記検体のそれぞれに対する前記反応過程データを記憶するデータ記憶部と、
前記データ記憶部に記憶されている複数の前記反応過程データの変動原因を特定するための特定条件を設定するように構成された特定条件設定部と、
前記特定条件設定部で設定された前記特定条件に基づいて、前記反応過程データの変動原因を推定するように構成された変動原因推定部と、
を有し、
前記出力部は、前記変動原因推定部で推定された変動原因も出力するように構成される、自動分析装置。In the automatic analyzer according to claim 1,
The automatic analyzer is
a data storage unit that stores the reaction process data for each of the plurality of specimens;
a specific condition setting unit configured to set a specific condition for specifying a cause of variation in the plurality of reaction process data stored in the data storage unit;
a variation cause estimation unit configured to estimate a variation cause of the reaction process data based on the specific condition set by the specific condition setting unit;
has
The automatic analysis device, wherein the output unit is configured to output the cause of variation estimated by the cause-of-variation estimation unit.
前記特定条件は、前記反応過程データの変動が、前記検体に起因する変動であるのか、あるいは、前記自動分析装置に起因する変動であるのかを特定するための条件である、自動分析装置。In the automatic analyzer according to claim 10,
The automatic analyzer, wherein the specific condition is a condition for specifying whether the variation in the reaction process data is due to the specimen or due to the automatic analyzer.
前記異常変動判断部は、時系列で測定された吸光度に含まれる互いに隣り合う第1測定ポイントの吸光度と第2測定ポイントの吸光度との吸光度差に基づいて、前記前処理反応で取得された前記反応過程データの変動が前記本反応における前記特定成分の濃度の測定に影響を及ぼす変動であるか否かを判断するように構成されている、自動分析装置。In the automatic analyzer according to claim 1,
The abnormal change determination unit is based on the absorbance difference between the absorbance at the first measurement point and the absorbance at the second measurement point that are adjacent to each other, which are included in the absorbance measured in time series. An automatic analyzer configured to determine whether or not a change in reaction process data is a change that affects measurement of the concentration of the specific component in the main reaction.
前記異常変動判断部は、前記反応過程データの連続的な減少あるいは増加を判断可能に構成されている、自動分析装置。In the automatic analyzer according to claim 12,
The automatic analysis device, wherein the abnormal fluctuation determination unit is configured to be able to determine continuous decrease or increase of the reaction process data.
前記異常変動判断部は、前記吸光度差の絶対値に基づいて、前記反応過程データの変動が許容範囲内の変動であるか否かを判断可能に構成されている、自動分析装置。In the automatic analyzer according to claim 12,
The automatic analyzer, wherein the abnormal variation determination section is configured to be able to determine whether the variation in the reaction process data is within an allowable range based on the absolute value of the absorbance difference.
前記検体と前記試薬との反応は、
前記検体と第1の試薬とを反応させる前処理反応と、
前記検体と前記第1の試薬以外の試薬とを反応させる本反応と、
を含み、
前記自動分析方法は、
前記前処理反応において吸光度を時系列で測定することにより反応過程データを取得する反応過程データ取得工程と、
吸光度に関する条件を設定する条件設定工程と、
前記条件設定工程で設定された前記条件に基づいて、前記前処理反応で取得された前記反応過程データの変動が前記本反応における前記特定成分の濃度の測定に影響を及ぼす変動であるか否かを判断する異常変動判断工程と、
前記異常変動判断工程で判断された判断結果を出力する出力工程と、
を備え、
前記条件設定工程で設定される前記条件には、前記前処理反応で取得された前記反応過程データの変動が前記本反応における前記特定成分の濃度の測定に影響を及ぼさない変動であることを示す例外条件も含まれ、
前記異常変動判断工程は、前記前処理反応で取得された前記反応過程データの変動が前記例外条件に該当する場合、前記反応過程データの変動が異常変動ではないと判断する、自動分析装置。An automatic analysis method for measuring the concentration of a specific component contained in the specimen based on the absorbance of the reaction solution of the specimen and the reagent,
The reaction between the specimen and the reagent is
a pretreatment reaction for reacting the specimen with a first reagent;
a main reaction in which the specimen and a reagent other than the first reagent are reacted;
including
The automatic analysis method is
a reaction process data acquisition step of acquiring reaction process data by measuring absorbance in time series in the pretreatment reaction;
A condition setting step of setting conditions related to absorbance;
Whether the variation in the reaction process data obtained in the pretreatment reaction is variation that affects the measurement of the concentration of the specific component in the main reaction, based on the conditions set in the condition setting step an abnormal change judgment step for judging
an output step of outputting the judgment result judged in the abnormal fluctuation judging step;
with
The conditions set in the condition setting step indicate that fluctuations in the reaction process data acquired in the pretreatment reaction are fluctuations that do not affect the measurement of the concentration of the specific component in the main reaction. including exceptions,
The abnormal change determination step determines that the change in the reaction process data is not an abnormal change when the change in the reaction process data acquired in the pretreatment reaction corresponds to the exception condition.
Applications Claiming Priority (5)
| Application Number | Priority Date | Filing Date | Title |
|---|---|---|---|
| JP2020123484 | 2020-07-20 | ||
| JP2020123484 | 2020-07-20 | ||
| JP2021092327 | 2021-06-01 | ||
| JP2021092327 | 2021-06-01 | ||
| PCT/JP2021/024619 WO2022019064A1 (en) | 2020-07-20 | 2021-06-29 | Automated analyzer and automated analysis method |
Publications (3)
| Publication Number | Publication Date |
|---|---|
| JPWO2022019064A1 JPWO2022019064A1 (en) | 2022-01-27 |
| JPWO2022019064A5 JPWO2022019064A5 (en) | 2023-03-08 |
| JP7320137B2 true JP7320137B2 (en) | 2023-08-02 |
Family
ID=79729452
Family Applications (1)
| Application Number | Title | Priority Date | Filing Date |
|---|---|---|---|
| JP2022538661A Active JP7320137B2 (en) | 2020-07-20 | 2021-06-29 | Automatic analyzer and automatic analysis method |
Country Status (2)
| Country | Link |
|---|---|
| JP (1) | JP7320137B2 (en) |
| WO (1) | WO2022019064A1 (en) |
Citations (5)
| Publication number | Priority date | Publication date | Assignee | Title |
|---|---|---|---|---|
| JP2004347385A (en) | 2003-05-21 | 2004-12-09 | Hitachi Ltd | Anomaly detection system and anomaly detecting method |
| JP2005181106A (en) | 2003-12-19 | 2005-07-07 | Wako Pure Chem Ind Ltd | Measuring method |
| JP2011149832A (en) | 2010-01-22 | 2011-08-04 | Hitachi High-Technologies Corp | Autoanalyzer |
| JP2014145750A (en) | 2013-01-30 | 2014-08-14 | Shino-Test Corp | Colorimetric measuring method of substance to be measured in milk sample, method and reagent of pretreatment of milk sample, and suppression method of influence on colorimetric measurement originating in milk sample |
| JP2015197370A (en) | 2014-04-01 | 2015-11-09 | 株式会社日立ハイテクノロジーズ | Automatic analysis device |
Family Cites Families (2)
| Publication number | Priority date | Publication date | Assignee | Title |
|---|---|---|---|---|
| JP4366261B2 (en) * | 2004-07-09 | 2009-11-18 | 株式会社日立ハイテクノロジーズ | Method for determining presence / absence of abnormality in measurement reaction process, automatic analyzer capable of executing the method, and storage medium storing program of the method |
| JP5860643B2 (en) * | 2011-09-08 | 2016-02-16 | 株式会社日立ハイテクノロジーズ | Automatic analyzer |
-
2021
- 2021-06-29 WO PCT/JP2021/024619 patent/WO2022019064A1/en active Application Filing
- 2021-06-29 JP JP2022538661A patent/JP7320137B2/en active Active
Patent Citations (5)
| Publication number | Priority date | Publication date | Assignee | Title |
|---|---|---|---|---|
| JP2004347385A (en) | 2003-05-21 | 2004-12-09 | Hitachi Ltd | Anomaly detection system and anomaly detecting method |
| JP2005181106A (en) | 2003-12-19 | 2005-07-07 | Wako Pure Chem Ind Ltd | Measuring method |
| JP2011149832A (en) | 2010-01-22 | 2011-08-04 | Hitachi High-Technologies Corp | Autoanalyzer |
| JP2014145750A (en) | 2013-01-30 | 2014-08-14 | Shino-Test Corp | Colorimetric measuring method of substance to be measured in milk sample, method and reagent of pretreatment of milk sample, and suppression method of influence on colorimetric measurement originating in milk sample |
| JP2015197370A (en) | 2014-04-01 | 2015-11-09 | 株式会社日立ハイテクノロジーズ | Automatic analysis device |
Also Published As
| Publication number | Publication date |
|---|---|
| WO2022019064A1 (en) | 2022-01-27 |
| JPWO2022019064A1 (en) | 2022-01-27 |
Similar Documents
| Publication | Publication Date | Title |
|---|---|---|
| JP5193937B2 (en) | Automatic analyzer and analysis method | |
| US9383376B2 (en) | Automatic analyzer | |
| EP2096442B1 (en) | Automatic analyzer | |
| JP5795268B2 (en) | Method for detecting an impending analytical failure of a networked diagnostic clinical analyzer | |
| JP5520519B2 (en) | Automatic analyzer and analysis method | |
| US9506942B2 (en) | Automatic analyzer and method for detecting measurement value abnormalities | |
| JP5320313B2 (en) | Automatic analyzer | |
| JP5932540B2 (en) | Automatic analyzer | |
| EP3734288B1 (en) | Automated analyzer and automated analysis method | |
| CN109557292B (en) | Calibration method | |
| JP2010151519A (en) | Automatic analyzer | |
| JP7320137B2 (en) | Automatic analyzer and automatic analysis method | |
| JP2006023214A (en) | Abnormality existence determining method of measurement reaction process, automatic analyzer executing this method, and storage medium stored with program of this method | |
| JP2005127757A (en) | Automatic analyzer | |
| JP5953089B2 (en) | Method for detecting measurement data abnormality and measurement data abnormality detection device | |
| CN113574390A (en) | Data analysis method, data analysis system and computer | |
| JP7299914B2 (en) | Abnormality determination method and automatic analyzer |
Legal Events
| Date | Code | Title | Description |
|---|---|---|---|
| A529 | Written submission of copy of amendment under article 34 pct |
Free format text: JAPANESE INTERMEDIATE CODE: A5211 Effective date: 20221111 |
|
| A621 | Written request for application examination |
Free format text: JAPANESE INTERMEDIATE CODE: A621 Effective date: 20221111 |
|
| TRDD | Decision of grant or rejection written | ||
| A01 | Written decision to grant a patent or to grant a registration (utility model) |
Free format text: JAPANESE INTERMEDIATE CODE: A01 Effective date: 20230711 |
|
| A61 | First payment of annual fees (during grant procedure) |
Free format text: JAPANESE INTERMEDIATE CODE: A61 Effective date: 20230721 |
|
| R150 | Certificate of patent or registration of utility model |
Ref document number: 7320137 Country of ref document: JP Free format text: JAPANESE INTERMEDIATE CODE: R150 |