JP7281409B2 - Particle characterization - Google Patents
Particle characterization Download PDFInfo
- Publication number
- JP7281409B2 JP7281409B2 JP2019552113A JP2019552113A JP7281409B2 JP 7281409 B2 JP7281409 B2 JP 7281409B2 JP 2019552113 A JP2019552113 A JP 2019552113A JP 2019552113 A JP2019552113 A JP 2019552113A JP 7281409 B2 JP7281409 B2 JP 7281409B2
- Authority
- JP
- Japan
- Prior art keywords
- measurements
- scatter
- scattering
- intensity
- light
- Prior art date
- Legal status (The legal status is an assumption and is not a legal conclusion. Google has not performed a legal analysis and makes no representation as to the accuracy of the status listed.)
- Active
Links
- 238000011192 particle characterization Methods 0.000 title description 17
- 238000005259 measurement Methods 0.000 claims description 272
- 239000002245 particle Substances 0.000 claims description 132
- 239000012535 impurity Substances 0.000 claims description 91
- 238000000034 method Methods 0.000 claims description 66
- 230000003993 interaction Effects 0.000 claims description 18
- 230000003595 spectral effect Effects 0.000 claims description 18
- 238000001914 filtration Methods 0.000 claims description 11
- 238000005311 autocorrelation function Methods 0.000 description 64
- 238000009826 distribution Methods 0.000 description 42
- 238000000926 separation method Methods 0.000 description 37
- 238000004458 analytical method Methods 0.000 description 28
- 230000003287 optical effect Effects 0.000 description 27
- 238000002296 dynamic light scattering Methods 0.000 description 21
- 238000000149 argon plasma sintering Methods 0.000 description 17
- 230000000875 corresponding effect Effects 0.000 description 15
- 230000000717 retained effect Effects 0.000 description 11
- 230000002123 temporal effect Effects 0.000 description 10
- 238000001370 static light scattering Methods 0.000 description 9
- 230000006870 function Effects 0.000 description 8
- 230000008569 process Effects 0.000 description 8
- 238000012937 correction Methods 0.000 description 7
- 238000001514 detection method Methods 0.000 description 7
- 239000013307 optical fiber Substances 0.000 description 7
- 238000012545 processing Methods 0.000 description 7
- 238000010586 diagram Methods 0.000 description 6
- 238000009499 grossing Methods 0.000 description 6
- 239000004816 latex Substances 0.000 description 6
- 229920000126 latex Polymers 0.000 description 6
- 230000008859 change Effects 0.000 description 5
- 238000002338 electrophoretic light scattering Methods 0.000 description 5
- 238000005286 illumination Methods 0.000 description 5
- 230000001052 transient effect Effects 0.000 description 5
- 239000002131 composite material Substances 0.000 description 4
- 238000005314 correlation function Methods 0.000 description 4
- 230000009467 reduction Effects 0.000 description 4
- 238000013459 approach Methods 0.000 description 3
- 230000008901 benefit Effects 0.000 description 3
- 102000004169 proteins and genes Human genes 0.000 description 3
- 108090000623 proteins and genes Proteins 0.000 description 3
- 230000004044 response Effects 0.000 description 3
- 238000005204 segregation Methods 0.000 description 3
- 102000016943 Muramidase Human genes 0.000 description 2
- 108010014251 Muramidase Proteins 0.000 description 2
- 108010062010 N-Acetylmuramoyl-L-alanine Amidase Proteins 0.000 description 2
- 230000002159 abnormal effect Effects 0.000 description 2
- 230000002411 adverse Effects 0.000 description 2
- 238000012512 characterization method Methods 0.000 description 2
- 239000000428 dust Substances 0.000 description 2
- 230000000694 effects Effects 0.000 description 2
- 229960000274 lysozyme Drugs 0.000 description 2
- 235000010335 lysozyme Nutrition 0.000 description 2
- 239000004325 lysozyme Substances 0.000 description 2
- 230000014759 maintenance of location Effects 0.000 description 2
- 230000010287 polarization Effects 0.000 description 2
- 238000002360 preparation method Methods 0.000 description 2
- 238000013139 quantization Methods 0.000 description 2
- 230000035945 sensitivity Effects 0.000 description 2
- 238000001228 spectrum Methods 0.000 description 2
- 230000007704 transition Effects 0.000 description 2
- QPLDLSVMHZLSFG-UHFFFAOYSA-N Copper oxide Chemical compound [Cu]=O QPLDLSVMHZLSFG-UHFFFAOYSA-N 0.000 description 1
- 239000005751 Copper oxide Substances 0.000 description 1
- 238000005033 Fourier transform infrared spectroscopy Methods 0.000 description 1
- 241000143252 Idaea infirmaria Species 0.000 description 1
- 230000003044 adaptive effect Effects 0.000 description 1
- 230000002547 anomalous effect Effects 0.000 description 1
- 238000013528 artificial neural network Methods 0.000 description 1
- 230000001427 coherent effect Effects 0.000 description 1
- 239000000356 contaminant Substances 0.000 description 1
- 229910000431 copper oxide Inorganic materials 0.000 description 1
- 230000002596 correlated effect Effects 0.000 description 1
- 238000010219 correlation analysis Methods 0.000 description 1
- 230000003247 decreasing effect Effects 0.000 description 1
- 238000002050 diffraction method Methods 0.000 description 1
- 239000003085 diluting agent Substances 0.000 description 1
- 239000006185 dispersion Substances 0.000 description 1
- 230000005684 electric field Effects 0.000 description 1
- 239000000284 extract Substances 0.000 description 1
- 239000000835 fiber Substances 0.000 description 1
- 239000012530 fluid Substances 0.000 description 1
- 239000012634 fragment Substances 0.000 description 1
- 230000005484 gravity Effects 0.000 description 1
- 239000003112 inhibitor Substances 0.000 description 1
- 230000002401 inhibitory effect Effects 0.000 description 1
- 238000012804 iterative process Methods 0.000 description 1
- 230000000670 limiting effect Effects 0.000 description 1
- 239000004973 liquid crystal related substance Substances 0.000 description 1
- 239000000463 material Substances 0.000 description 1
- 230000004048 modification Effects 0.000 description 1
- 238000012986 modification Methods 0.000 description 1
- 239000002105 nanoparticle Substances 0.000 description 1
- 238000001208 nuclear magnetic resonance pulse sequence Methods 0.000 description 1
- 230000005693 optoelectronics Effects 0.000 description 1
- 239000011164 primary particle Substances 0.000 description 1
- 230000002829 reductive effect Effects 0.000 description 1
- 239000007787 solid Substances 0.000 description 1
- 238000007619 statistical method Methods 0.000 description 1
- 239000000725 suspension Substances 0.000 description 1
- 238000012360 testing method Methods 0.000 description 1
- 238000013519 translation Methods 0.000 description 1
- XLYOFNOQVPJJNP-UHFFFAOYSA-N water Substances O XLYOFNOQVPJJNP-UHFFFAOYSA-N 0.000 description 1
- 238000000733 zeta-potential measurement Methods 0.000 description 1
Images


Classifications
-
- G—PHYSICS
- G01—MEASURING; TESTING
- G01N—INVESTIGATING OR ANALYSING MATERIALS BY DETERMINING THEIR CHEMICAL OR PHYSICAL PROPERTIES
- G01N15/00—Investigating characteristics of particles; Investigating permeability, pore-volume or surface-area of porous materials
- G01N15/02—Investigating particle size or size distribution
- G01N15/0205—Investigating particle size or size distribution by optical means
- G01N15/0211—Investigating a scatter or diffraction pattern
-
- G—PHYSICS
- G01—MEASURING; TESTING
- G01N—INVESTIGATING OR ANALYSING MATERIALS BY DETERMINING THEIR CHEMICAL OR PHYSICAL PROPERTIES
- G01N15/00—Investigating characteristics of particles; Investigating permeability, pore-volume or surface-area of porous materials
- G01N2015/0042—Investigating dispersion of solids
- G01N2015/0053—Investigating dispersion of solids in liquids, e.g. trouble
-
- G—PHYSICS
- G01—MEASURING; TESTING
- G01N—INVESTIGATING OR ANALYSING MATERIALS BY DETERMINING THEIR CHEMICAL OR PHYSICAL PROPERTIES
- G01N15/00—Investigating characteristics of particles; Investigating permeability, pore-volume or surface-area of porous materials
- G01N15/02—Investigating particle size or size distribution
- G01N15/0205—Investigating particle size or size distribution by optical means
- G01N15/0211—Investigating a scatter or diffraction pattern
- G01N2015/0222—Investigating a scatter or diffraction pattern from dynamic light scattering, e.g. photon correlation spectroscopy
Landscapes
- Chemical & Material Sciences (AREA)
- Dispersion Chemistry (AREA)
- Physics & Mathematics (AREA)
- Health & Medical Sciences (AREA)
- Life Sciences & Earth Sciences (AREA)
- Analytical Chemistry (AREA)
- Biochemistry (AREA)
- General Health & Medical Sciences (AREA)
- General Physics & Mathematics (AREA)
- Immunology (AREA)
- Pathology (AREA)
- Investigating Or Analysing Materials By Optical Means (AREA)
Description
本発明は、粒子特性評価装置、及び適応光子相関分光法を含み得る粒子特性評価方法に関する。
光子相関分光法(動的光散乱法、又はDLSともいう)は、試料のある領域から散乱する光の強度の経時的変化によって、粒子の特性を評価する技術である。散乱光の測定値の時系列が、試料中に分散している粒子の粒径又は粒径分布を決定するために用いられる。
The present invention relates to particle characterization apparatus and methods that may include adaptive photon correlation spectroscopy.
Photon correlation spectroscopy (also known as dynamic light scattering, or DLS) is a technique that characterizes particles by changes in the intensity of light scattered from an area of a sample over time. A time series of scattered light measurements is used to determine the size or size distribution of the particles dispersed in the sample.
国際特許出願公開公報WO2009/090562において論じられているように、照射光の波長より小さい粒子により散乱される光の強度が、粒径に強く関連することは、周知である。粒子半径が照射光の波長の0.1未満であるレイリー散乱限界において、散乱光の強度は粒子半径の6乗に比例する。また、そのような小さい粒子から散乱される光は、ほぼ等方的である。したがって、典型的には粒径0.3nm~20nmのタンパク質の分散において、例えば粒径が100nmを超える凝集体又はフィルタ阻害粒子は、試料中の光学的検出ボリュームから拡散し終わるまで、信号の大部分を占める可能性がある。しばしば用いられるキュムラント換算においては、Z平均及び多分散性指数(Pdi)の出力が、比較的大きな断片によって大きく歪められ得る。 As discussed in International Patent Application Publication WO 2009/090562, it is well known that the intensity of light scattered by particles smaller than the wavelength of the illuminating light is strongly related to particle size. In the Rayleigh scattering limit, where the particle radius is less than 0.1 of the wavelength of the illuminating light, the intensity of the scattered light is proportional to the particle radius to the sixth power. Also, the light scattered from such small particles is nearly isotropic. Thus, in dispersions of proteins typically between 0.3 nm and 20 nm in size, aggregates or filter-inhibiting particles with a size of, for example, greater than 100 nm will produce a large signal until they have diffused out of the optical detection volume in the sample. may occupy part. In the often used cumulant reduction, the Z-mean and polydispersity index (Pdi) outputs can be greatly distorted by relatively large fragments.
不純物に対するこのような敏感性は、注意深い試料調製の重要性を強調する多くの文献によって知られているが、フィルタ阻害物又は凝集体の存在を完全に回避することは難しい。 Such susceptibility to impurities is well known from many publications emphasizing the importance of careful sample preparation, but it is difficult to completely avoid the presence of filter inhibitors or aggregates.
主に小径粒子を含むが、より大径の粒子も含む試料の光散乱測定は、複数の大径粒子に対して、又は個々の大径粒子に対してさえ、非常に敏感になり得る。大径粒子は、小径粒子が特性評価され得る品質を低下させる可能性がある。このような大径粒子は、望ましくない不純物、つまり、一次粒子の凝集体又は何らかの他の物質であり得る。 Light scattering measurements of samples containing predominantly small particles but also larger particles can be very sensitive to multiple large particles or even individual large particles. Large particles can degrade the quality with which small particles can be characterized. Such large particles may be undesirable impurities, ie aggregates of primary particles or some other material.
試料からの回析光/散乱光のパターンを解析することにより粒子特性評価を行うことも、周知である。その光源は、一般にレーザであり、この種の解析は、レーザ回析解析又は静的光散乱(SLS)と称されることもある。大径粒子は、静的光散乱測定やレーザ回析測定においても問題となり得る。すなわち、大径粒子からの散乱が小径粒子から散乱される比較的少量の光を不明瞭にし得る。 It is also well known to perform particle characterization by analyzing the pattern of diffracted/scattered light from a sample. The light source is typically a laser, and this type of analysis is sometimes referred to as laser diffraction analysis or static light scattering (SLS). Large particles can also be a problem in static light scattering and laser diffraction measurements. That is, scattering from large particles can obscure the relatively small amount of light scattered from small particles.
米国特許出願公開公報US2014/0226158(Trainer)は、複数の光散乱データセットを取ることで光散乱測定を行うことを開示している。各データセットはある時間(例えば、1秒)に対応している。Trainerは、アルゴリズムを使用して、データセットを類似の特性(例えば、大径粒子を含むという特性)を有するグループに分類することを開示している。各グループは別々に反転されて、複数の粒径分布が生成される。複数の粒径分布は、その後、総信号時間によって重み付けされ、且つ、各チャネルサイズで合計され、総粒子粒径分布が形成される。データセットを分類するために提案されたアルゴリズムは、フーリエ変換又はアナログ電子バンドパスフィルタを用いて決定されるある複数の帯域内のスペクトルパワーの測定に基づく。代替として、Trainerは、異なる周波数帯域に代えて、異なる遅れ時間の帯域を用い、データセットの自己相関関数を用いて、データセットを分類することを提案している。 US Patent Application Publication US2014/0226158 (Trainer) discloses making light scattering measurements by taking multiple light scattering data sets. Each data set corresponds to a period of time (eg, 1 second). Trainer discloses using an algorithm to sort data sets into groups with similar properties, such as containing large particles. Each group is separately inverted to produce multiple particle size distributions. The multiple particle size distributions are then weighted by total signal time and summed for each channel size to form a total particle size distribution. Proposed algorithms for classifying data sets are based on measurements of spectral power within certain bands determined using Fourier transforms or analog electronic bandpass filters. Alternatively, Trainer proposes using bands of different delay times instead of different frequency bands and using the autocorrelation function of the data sets to classify the data sets.
光散乱による粒子特性評価のための改良された方法及び装置が望まれる。
本発明の一局面によれば、試料中の粒子を特性評価する方法が提供されており、該方法は、照射光線と試料との相互作用によって生成される散乱光の測定値の時系列をそれぞれ含む複数の散乱測定値を検出器から取得することと、各散乱測定値から分離パラメータを決定することと、分離パラメータから分離基準を決定することと、各散乱測定値の分離パラメータを分離基準と比較することにより、不純物が前記散乱光に影響していた汚染された散乱測定値を特定することと、汚染された散乱測定値として特定されていない散乱測定値から粒子特性を決定することと、を含む。
Improved methods and apparatus for particle characterization by light scattering are desired.
According to one aspect of the invention, there is provided a method of characterizing particles in a sample, comprising time series of measurements of scattered light produced by the interaction of an illuminating beam with the sample, respectively. obtaining from the detector a plurality of scatter measurements comprising; determining a separation parameter from each scatter measurement; determining a separation criterion from the separation parameter; and using the separation parameter of each scatter measurement as the separation criterion. identifying contaminated scatter measurements in which impurities contributed to the scattered light by comparison; determining particle properties from scatter measurements not identified as contaminated scatter measurements; including.
散乱測定値を異常であるか又は汚染されているとして分類する動的基準を用いることは、適切な場合には、例えば、高度に多分散性である可変試料の場合には、大径粒子からの散乱データを含め、また、適切な場合には、例えば、多分散性の低い試料中の不純物又は凝集体を拒絶する場合には、大径粒子からの散乱を除外又は補正するのに足るだけのロバスト性を当該方法が有し得ることを意味する。 Using dynamic criteria to classify scatter measurements as abnormal or contaminated can be used where appropriate, e.g. and, where appropriate, sufficient to exclude or correct for scattering from larger particles, e.g., reject impurities or aggregates in samples with low polydispersity. This means that the method can have the robustness of
本発明の一局面によれば、試料中の粒子を特性評価する方法が提供されており、該方法は、照射光線と試料との相互作用によって生成される散乱光の測定値の時系列をそれぞれ含む複数の散乱測定値を検出器から取得することと、不純物が前記散乱光に影響していた汚染された散乱測定値を特定することと、汚染された散乱測定値として特定されていない各散乱測定値の自己相関関数を決定し、且つ、前記自己相関関数を組み合わせて、粒子特性を導き出すための平均自己相関関数を生成することで、汚染された散乱測定値として特定されていない散乱測定値から粒子特性を決定することと、を含む。 According to one aspect of the invention, there is provided a method of characterizing particles in a sample, comprising time series of measurements of scattered light produced by the interaction of an illuminating beam with the sample, respectively. obtaining from a detector a plurality of scatter measurements comprising; identifying contaminated scatter measurements in which an impurity contributed to the scattered light; and each scatter not identified as a contaminated scatter measurement. Scattering measurements not identified as contaminated scattering measurements by determining an autocorrelation function of the measurements and combining the autocorrelation functions to produce an average autocorrelation function for deriving a particle property. and determining the particle properties from.
本発明の一局面によれば、試料中の粒子を特性評価する方法が提供されており、該方法は、照射光線と試料との相互作用によって生成される散乱光の測定値の時系列を含む散乱測定値を検出器から取得することと、散乱測定の少なくとも幾つかの時間の中で散乱強度を低減することにより、不純物からの散乱寄与を補償することを含み、補正された散乱測定値を生成することと、前記補正された散乱測定値から粒子特性を決定することと、を含む。 According to one aspect of the invention, a method of characterizing particles in a sample is provided, the method comprising a time series of measurements of scattered light produced by the interaction of an illuminating beam with the sample. obtaining a scatter measurement from a detector; and reducing the scatter intensity during at least some time of the scatter measurement to compensate for the scattering contribution from the impurities, producing a corrected scatter measurement. and determining particle properties from the corrected scattering measurements.
散乱測定値は、時間に対する散乱強度の測定値を含み得る。散乱測定値は、検出器での一連の光子到達時間を含み得る。こういった一連の散乱強度は、光子到達時間をビニングすることにより定められ得、各ビンは時間に対応する。各ビンでの光子到達時間のカウントは、対応する時間(ビン)での強度(光子計数率)を指す。 Scattering measurements may include measurements of scattering intensity versus time. A scatter measurement may include a series of photon arrival times at the detector. A series of these scattered intensities can be determined by binning the photon arrival times, each bin corresponding to time. The photon arrival time count at each bin refers to the intensity (photon count rate) at the corresponding time (bin).
散乱強度を低減することは、散乱測定値をハイパスフィルタリングすることを含んでもよい。これは、不純物の特性である、比較的低周波の散乱寄与を除去し得る。ハイパスフィルタのカットオフ周波数は、少なくとも0.5Hz、1Hz、2Hz、5Hz、10Hz、20Hz、又は50Hzであってもよい。このハイパスフィルタは、バターワース、チェビシェフ、ハニングウィンドウなど、適切などのフィルタでもよい。 Reducing the scatter intensity may include high-pass filtering the scatter measurements. This can remove relatively low frequency scattering contributions that are characteristic of impurities. The cutoff frequency of the high pass filter may be at least 0.5 Hz, 1 Hz, 2 Hz, 5 Hz, 10 Hz, 20 Hz, or 50 Hz. This high pass filter may be any suitable filter such as Butterworth, Chebyshev, Hanning window, or the like.
散乱強度を低減することは、不純物からの散乱寄与のモデルを決定し、その後、散乱測定値からモデルを差し引くことを含んでもよい。
モデルを決定することは、散乱測定値をローパスフィルタ処理すること、又は散乱測定値をスムージング処理することを含んでもよい。これは、不純物からの散乱信号(周波数がより低い傾向にある)を維持しながら、対象の粒子からの光散乱を表現する可能性が高い高周波散乱信号を除去する効果を有する。モデルは、散乱測定値のローパスフィルタ処理された又は平滑化されたバージョンを含んでもよい。よって、散乱測定値のローパスフィルタ処理されたバージョンを除去することにより、「よりきれいな」散乱測定値が生成され得る。
Reducing the scattering intensity may include determining a model of the scattering contribution from the impurities and then subtracting the model from the scattering measurements.
Determining the model may include low-pass filtering the scatter measurements or smoothing the scatter measurements. This has the effect of removing high frequency scattered signals, which are likely representative of light scattering from the particles of interest, while preserving scattered signals from impurities (which tend to be lower in frequency). The model may include low-pass filtered or smoothed versions of the scatter measurements. Thus, a "cleaner" scatter measurement can be produced by removing the low-pass filtered version of the scatter measurement.
ローパスフィルタ処理又はスムージング処理は、移動平均、Savitsky Golayフィルタ、又は、ハイパスフィルタを参照して上述したいずれのフィルタタイプを含んでもよい。ローパスフィルタ用のカットオフ周波数は、ハイパスフィルタを参照して上述した値と同じであってもよい。 Low-pass filtering or smoothing may include any of the filter types described above with reference to moving averages, Savitsky Golay filters, or high-pass filters. The cutoff frequency for the lowpass filter may be the same as the value described above with reference to the highpass filter.
モデルは、散乱測定値に対するフィット値を含んでもよい。計数率の波形がスパイクを含む場合など、スムージング処理を適用するよりもより適している場合があり得る。散乱測定値の中のスパイクは、ピーク関数(ガウス、ローレンツ、ヴォイトなど)を用いて適合されてもよい。フィット値は、ピークが閾値を超える強度に関して特定される領域で適用されてもよい。或いは、フィット値は、平滑化された散乱信号の導関数がいつゼロクロスするかを見つけるなど、他のピーク検出方法が適用されてもよい。 The model may include fits to the scatter measurements. In some cases, such as when the count rate waveform contains spikes, it may be more suitable than applying a smoothing process. Spikes in the scatter measurements may be fitted using a peak function (Gaussian, Lorentzian, Voigt, etc.). A fit value may be applied in regions where peaks are identified for intensities above a threshold. Alternatively, the fit value may be applied with other peak detection methods, such as finding when the derivative of the smoothed scatter signal crosses zero.
散乱強度を低減することは、散乱測定値から不純物パラメータを決定することを含み、散乱強度を低減する工程は、不純物パラメータに対応している(結果、不純物パラメータは、散乱強度の低減量と散乱強度を低減する時間の少なくとも1つに影響する)。不純物パラメータは、例えば、上述のハイパスフィルタやローパスフィルタのカットオフ周波数を含んでもよい。不純物パラメータは、代替的に又は付加的に、不純物散乱に対応する閾値強度(例えば、計数率)を含み得る。 Reducing the scattering intensity includes determining an impurity parameter from the scattering measurements, wherein the step of reducing the scattering intensity corresponds to the impurity parameter (resulting in the impurity parameter being the amount of reduction in scattering intensity and the scattering affect at least one of the intensity reduction times). Impurity parameters may include, for example, the cutoff frequencies of the highpass and lowpass filters described above. Impurity parameters may alternatively or additionally include a threshold intensity (eg, count rate) corresponding to impurity scattering.
散乱データから不純物パラメータを決定することは、不純物散乱の低減がデータのタイプに対応する動的プロセスであることを意味する。この結果は、高多分散性の試料と単分散性の試料との両方の解析に適するよりロバスト性のある方法である。 Determining impurity parameters from scattering data means that the reduction of impurity scattering is a dynamic process that scales with the type of data. The result is a more robust method suitable for analysis of both highly polydisperse and monodisperse samples.
散乱測定値から不純物パラメータを決定することは、前記散乱測定値のスペクトルコンテンツ内の統計的外れ値を見つけることを含んでもよい。
不純物パラメータを決定することは、散乱測定値の複数の時間それぞれのスペクトルコンテンツを決定することを含んでもよい。例えば、測定値の時系列は、一連のより短い散乱測定値を含み、各散乱測定値のスペクトルコンテンツが決定されてもよい。各時間のスペクトルコンテンツを決定するために、フーリエ変換を用いてもよい。
Determining impurity parameters from scattering measurements may include finding statistical outliers within the spectral content of said scattering measurements.
Determining the impurity parameter may include determining the spectral content of each of the plurality of times of scattering measurements. For example, the time series of measurements may include a series of shorter scatter measurements and the spectral content of each scatter measurement determined. A Fourier transform may be used to determine the spectral content of each time.
不純物パラメータを決定することは、周波数の領域それぞれでスペクトルパワーの統計的性質を決定することを含んでもよい。統計的性質は、平均値及び/又は標準偏差を含んでもよい。周波数の領域は、過渡的な不純物が大きな寄与を果たし得ることが予測される周波数の領域を含んでもよい。周波数の領域は、10Hz、20Hz、30Hz、40Hz、50Hz、又は100Hzまでを含んでもよい。カットオフ周波数は、どの時間も外れ値であるスペクトルパワーを含まない最低周波数を周波数領域内で見つけることにより、決定されてもよい。 Determining impurity parameters may include determining statistical properties of the spectral power in each frequency domain. Statistical properties may include mean and/or standard deviation. The range of frequencies may include a range of frequencies where it is expected that transient impurities can make a significant contribution. The range of frequencies may include 10 Hz, 20 Hz, 30 Hz, 40 Hz, 50 Hz, or up to 100 Hz. The cutoff frequency may be determined by finding the lowest frequency in the frequency domain that does not contain outlier spectral power at any time.
測定値(例えば、スペクトルパワー)は、平均値から閾値偏差分以上外れる場合に、外れ値と見なされてもよい。閾値偏差は、標準偏差(例えば、2又は3標準偏差)を参照して決定されてもよい。 A measurement (eg, spectral power) may be considered an outlier if it deviates from the mean by more than a threshold deviation. The threshold deviation may be determined with reference to standard deviations (eg, 2 or 3 standard deviations).
散乱測定値の少なくとも1つの時間内で散乱強度を低減することは、調整された散乱測定値を生成してもよい。
時間の経過と共に振幅が変動する有意な信号を生成するために、少なくとも幾つかのビン時間の間に1より多い光子到達を含むのに十分な幅のあるビン幅を選定することが必要である。散乱強度のビニングされた時間履歴の時間分解能は、ビンの時間幅によって制限される。これは、ビニングされた時間履歴から導出されるコレログラムは、非常に短い減衰時間を分解しないであろうことを意味する。つまり、生の光子到達時間データで利用可能な時間分解能は、信号をビニングすることで破棄されざるを得ない。
Reducing the scatter intensity within at least one time of the scatter measurement may produce an adjusted scatter measurement.
In order to produce a significant signal with amplitude variation over time, it is necessary to choose a bin width that is wide enough to contain more than one photon arrival during at least some of the bin times. . The temporal resolution of the binned time history of scattered intensity is limited by the temporal width of the bins. This means that correlograms derived from binned time histories will not resolve very short decay times. That is, the temporal resolution available in the raw photon time-of-arrival data must be discarded by binning the signal.
補正された散乱測定値を生成することは、補正されない散乱測定値(例えば、一連の光子到達時間)から導出される生の自己相関関数の部分を調整された散乱測定値から導出される調整された自己相関関数の部分と組み合わせることにより、複合自己相関関数を生成することを含んでもよい。生の自己相関関数の部分は、選択された遅延時間と同じかそれより短い遅延時間に対応してもよい。調整された自己相関関数の部分は、前記選択された遅延時間と同じかそれより長い遅延時間に対応してもよい。生の自己相関関数は、選択された遅延時間で調整された自己相関関数と連続するように正規化(すなわち、係数により乗算)されてもよい。 Generating corrected scatter measurements involves substituting the portion of the raw autocorrelation function derived from the uncorrected scatter measurements (e.g., a series of photon arrival times) with the adjusted scatter measurements derived from the adjusted scatter measurements. generating a composite autocorrelation function by combining with the portions of the autocorrelation function that are obtained. Portions of the raw autocorrelation function may correspond to delay times equal to or less than the selected delay time. Portions of the adjusted autocorrelation function may correspond to delay times equal to or greater than the selected delay time. The raw autocorrelation function may be normalized (ie, multiplied by a factor) to be continuous with the adjusted autocorrelation function at the selected delay time.
選択された遅延時間は、50から200マイクロ秒の範囲にあってもよい。選択された遅延時間は、例えば、5倍又は10倍のビン幅など、調整された散乱測定値のビン幅から得られてもよい。選択された遅延時間は、キュムラント解析を行うことで決定されてもよく、又は、最小曲率点を見つけるための調整された自己相関関数の微分と、対応する遅延時間を選択された遅延時間として用いることと、により決定されてもよい。 The selected delay time may be in the range of 50 to 200 microseconds. The selected delay time may be derived from the bin width of the adjusted scatter measurements, eg, the bin width of 5 or 10 times. The selected delay time may be determined by performing a cumulant analysis, or using the derivative of the adjusted autocorrelation function to find the point of minimum curvature and the corresponding delay time as the selected delay time. and may be determined by
生の自己相関関数は、生の自己相関関数の線形領域の勾配(例えば、キュムラント解析の多分散性に対応)が調整された自己相関関数の同一の線形領域の勾配と一致するように選択される係数によって正規化されてもよい。 The raw autocorrelation function is chosen such that the slope of the linear region of the raw autocorrelation function (e.g., corresponding to the polydispersity of the cumulant analysis) matches the slope of the same linear region of the adjusted autocorrelation function. may be normalized by a factor that
散乱測定値が一連の光子パルス(光子到達時間に対応)を含む場合、散乱強度を低減することは、この一連の光子パルスから光子パルス(例えば光子到達時間)を除去することを含んでもよい。これは、生データを補正されたデータと組み合わせるという必要無く、時間分解能を補正された散乱測定値内で維持できるという利点を有する。一連の光子パルスから光子パルスを除去することは、ソフトウェア光減衰器に類似していると見なされ得る。 If the scattering measurements include a series of photon pulses (corresponding to photon arrival times), reducing the scattering intensity may include removing the photon pulses (e.g., photon arrival times) from the series of photon pulses. This has the advantage that the temporal resolution can be maintained within the corrected scatter measurements without the need to combine the raw data with the corrected data. Removing a photon pulse from a series of photon pulses can be viewed as analogous to a software optical attenuator.
一連のものからイベントを除去することは、散乱強度に基づいてビン(除去する光子パルスを含む)を選択することを含んでもよい(例えば、ビニングにより、上述したように決定される)。ビンを選択する閾値散乱強度は、散乱測定値から決定されてもよい(例えば、散乱測定値の分布に基づいて)。例えば、閾値散乱強度は、散乱測定値の平均強度から決定されてもよい。閾値散乱強度は、例えば、(散乱測定値の)平均強度に平均値と最小計数率との差を足したものを含んでもよいし、又は、平均強度に3標準偏差を足したものを含んでもよいし、又は、最小計数率に最小計数率の2乗根の2倍を足したものを含んでもよい。 Removing events from the series may include selecting bins (containing photon pulses to remove) based on scattering intensity (eg, determined by binning as described above). A threshold scatter intensity for selecting bins may be determined from the scatter measurements (eg, based on the distribution of the scatter measurements). For example, the threshold scatter intensity may be determined from the average intensity of the scatter measurements. The threshold scatter intensity may, for example, comprise the average intensity (of the scatter measurements) plus the difference between the average value and the minimum count rate, or the average intensity plus 3 standard deviations. Alternatively, it may include the minimum count rate plus twice the square root of the minimum count rate.
選択されたビンは、その選択されたビンから複数の光子パルスを除去することで、それぞれ補正されてもよい。光子の適切な数は、閾値を超える光子パルスの超過数であってもよい。光子パルスは、選択されたビンの中の光子パルスからランダムに選択されてもよい。 Each selected bin may be corrected by removing multiple photon pulses from the selected bin. A suitable number of photons may be the excess number of photon pulses above a threshold. A photon pulse may be randomly selected from the photon pulses in the selected bin.
散乱強度を低減することは、散乱寄与のモデルを一連の光子パルスから差し引くことにより、一連の光子パルスを含む散乱測定値を直接補正することを含んでもよい。不純物からの散乱寄与のモデルは、上述したように決定されてもよい(例えば、光子パルスのビニングと、ローパスフィルタリング又はスムージングによって)。散乱寄与のモデルは、不純物からの散乱による各ビンの中の光子パルスの数の推定値を含んでもよい。よって、各ビンを補正することは、モデルによって示される各ビンから複数の光子パルスを(例えば、それらをランダムに選択することで)除去することを含んでもよい。 Reducing the scatter intensity may involve directly correcting the scatter measurements that include the series of photon pulses by subtracting a model of the scattering contribution from the series of photon pulses. A model of the scattering contribution from impurities may be determined as described above (eg, by binning the photon pulses and low-pass filtering or smoothing). A model of the scattering contribution may include an estimate of the number of photon pulses in each bin due to scattering from impurities. Correcting each bin may thus include removing multiple photon pulses from each bin indicated by the model (eg, by randomly selecting them).
一連の光子パルスのこの直接的な補正(例えば、ビニング前)により、散乱信号の時間分解能が損なわれることが回避される。結果、非常に短い減衰時間を分解できる補正された自己相関関数となる。 This direct correction of the photon pulse sequence (eg, before binning) avoids compromising the temporal resolution of the scattered signal. The result is a corrected autocorrelation function that can resolve very short decay times.
散乱強度を低減することは、記録された散乱測定値を修正することを含んでもよい。散乱強度を低減することは、光学的ドメインの中で散乱信号を減衰させることを含んでもよい。 Reducing the scattering intensity may include modifying the recorded scattering measurements. Reducing the scattered intensity may include attenuating the scattered signal within the optical domain.
この方法は、光線を試料セル内の試料に照射して、光線と試料との相互作用により散乱光を生成することを含んでもよい。
散乱測定値を取得することは、検出器から測定値を受信すること、不揮発性機械読取り可能な記録媒体(例えば、ハードディスク、SSD、光媒体など)から散乱測定値を受信すること、又は、通信チャンネル(例えば、ネットワーク、直列接続、USB、SATA、IDE、PCIE)を介して測定値を受信することを含んでもよい。
The method may include illuminating a sample in a sample cell with a beam of light and generating scattered light due to interaction of the beam with the sample.
Obtaining scatter measurements may include receiving measurements from a detector, receiving scatter measurements from a non-volatile machine-readable storage medium (e.g., hard disk, SSD, optical medium, etc.), or communicating It may include receiving measurements over a channel (eg, network, serial connection, USB, SATA, IDE, PCIE).
粒子特性を決定することは、粒径、粒度分布、ゼータ電位、タンパク質の移動性、及びレオロジー特性の少なくとも1つを決定することを含んでもよい。
この方法は、不純物による散乱光への寄与を含む散乱測定値として特定されている散乱測定値から、更なる粒子特性を決定することを更に含んでもよい。この方法は、散乱測定値全てから平均粒子特性を決定することを更に含んでもよい。
Determining particle properties may include determining at least one of particle size, particle size distribution, zeta potential, protein mobility, and rheological properties.
The method may further comprise determining additional particle properties from the scatter measurements identified as scatter measurements that include contributions to the scattered light by impurities. The method may further comprise determining an average particle property from all scattering measurements.
この方法は、各散乱測定値の自己相関関数を決定することを含んでもよい。
複数の散乱測定値が取得されている場合、粒度分布を決定することは、汚染された散乱測定値として特定されていない各散乱測定値の自己相関関数を組み合わせることを含んでもよい。更なる粒度分布を決定することは、各汚染された散乱測定値の自己相関関数を組み合わせることを含んでもよい。一般に、粒度分布を決定することは、含まれるべき散乱測定値の自己相関関数を組み合わせることを含んでもよい。
The method may include determining an autocorrelation function for each scatter measurement.
If multiple scatter measurements are taken, determining the particle size distribution may include combining the autocorrelation function of each scatter measurement not identified as a contaminated scatter measurement. Determining a further particle size distribution may include combining the autocorrelation function of each contaminated scatter measurement. In general, determining the particle size distribution may involve combining the autocorrelation functions of the scattering measurements to be included.
自己相関関数を組み合わせることは、自己相関関数を足し合わせることを含んでもよい。自己相関関数を組み合わせることは、平均自己相関関数を決定することを含んでもよい。 Combining the autocorrelation functions may include summing the autocorrelation functions. Combining the autocorrelation functions may include determining an average autocorrelation function.
各散乱測定値の分離パラメータは、その散乱測定値の自己相関関数から決定されてもよい。分離パラメータを決定することは、各散乱測定値の自己相関関数を反転させて、各測定値粒子特性を決定することを含んでもよい(例えば、キュムラント方法、又はCONTINなど別の方法を用いて)。 A separation parameter for each scatter measurement may be determined from the autocorrelation function for that scatter measurement. Determining the separation parameter may include inverting the autocorrelation function of each scatter measurement to determine each measurement particle property (e.g., using the cumulant method, or another method such as CONTIN). .
分離パラメータは、多分散性指数(Pdi)、平均粒径(Z平均)、少なくとも1つの遅延時間に対応する自己相関値、少なくとも1つの周波数領域に対応するスペクトルパワー、平均強度、強度変化(すなわち、最大強度マイナス最小強度)、及び/又はドップラー周波数幅の少なくとも1つを含んでもよい。 Separation parameters include polydispersity index (Pdi), average particle size (Z-average), autocorrelation value corresponding to at least one lag time, spectral power corresponding to at least one frequency region, mean intensity, intensity change (i.e. , maximum intensity minus minimum intensity), and/or Doppler frequency spread.
本開示における「平均」という用語は、平均、モード、及び中央を含み、分離パラメータの分布又はヒストグラムに対するベストフィット(例えば、正規分布を用いる)から算出されるパラメータを含む。分離基準は、汚染された散乱測定値を特定する閾値として用いられてもよい。 The term "mean" in this disclosure includes mean, mode, and median, and includes parameters calculated from a best fit (eg, using a normal distribution) to a distribution or histogram of separation parameters. Separation criteria may be used as thresholds to identify contaminated scatter measurements.
分離基準は、分離パラメータの少なくとも1つの統計的性質から得られてもよい。分離基準を決定することは、分離パラメータの平均値及び/又は標準偏差を決定することを含んでもよい。分離基準は、分離パラメータの標準偏差と平均値から得られてもよい。分離基準は、2、3、4、5、又は6標準偏差を平均分離パラメータに足すことにより決定されてもよい。 A separation criterion may be obtained from at least one statistical property of the separation parameter. Determining the separation criteria may include determining the mean and/or standard deviation of the separation parameters. Separation criteria may be obtained from the standard deviation and mean of the separation parameters. The segregation criterion may be determined by adding 2, 3, 4, 5, or 6 standard deviations to the average segregation parameter.
単一の検出器があってもよい。或いは、各(又はその)散乱測定値は、複数の検出器からの散乱光の測定値の時系列を含んでもよい。複数の検出器のうち少なくとも幾つかは、照射光線に対して異なる散乱角度で散乱する光を受け取るように配置されてもよい。複数の検出器のうち少なくとも幾つかは、照射光線に対して同一の散乱角度で散乱する光を受け取るように配置されてもよい。散乱角度というときは、検出器の重心を参照してもよい。 There may be a single detector. Alternatively, each (or its) scatter measurement may comprise a time series of scattered light measurements from multiple detectors. At least some of the plurality of detectors may be arranged to receive light scattered at different scattering angles with respect to the illuminating light beam. At least some of the plurality of detectors may be arranged to receive light scattered at the same scattering angle with respect to the illuminating light beam. When referring to the scattering angle, the center of gravity of the detector may be referred to.
分離パラメータは、異なる散乱角度での強度の分散を含んでもよい(時系列での平均強度に基づいて)。例えば、異なる散乱角度での散乱光の平均分布は、分離基準として用いられてよく、汚染された散乱測定期間は、異なる散乱角度での散乱光の平均分布との類似性の不足に基づいて特性されてもよい。 Separation parameters may include the variance of intensities at different scattering angles (based on average intensities over time). For example, the average distribution of scattered light at different scattering angles may be used as a separation criterion, and the contaminated scattering measurement period is characterized based on its lack of similarity with the average distribution of scattered light at different scattering angles. may be
分離基準が1つより大きな値を含む場合、分離パラメータの各値と分離基準との間の差異の加重平均は、汚染された散乱測定値を特定するために用いられてもよい。
粒度分布を決定することは、処理された測定値の時系列から動的光散乱測定を行うことを含んでもよい。
If the separation criterion includes more than one value, a weighted average of the differences between each value of the separation parameter and the separation criterion may be used to identify the contaminated scatter measurements.
Determining the particle size distribution may comprise performing dynamic light scattering measurements from the time series of processed measurements.
粒度分布を決定することは、測定値の時系列に対して光回析粒子特性評価解析(例えば、Fraunhofer理論、又はMie散乱理論を用いて)を行うことを含んでもよい。本明細書中で開示される方法は、静的光散乱(SLS)、動的光散乱(DLS)、電気泳動光散乱(ELS)、磁気泳動光散乱(MLS)、及び、関連する方法に適用されることで、例えば、タンパク質の移動性、表面ゼータ、マイクロレオロジーなどを測定してもよい。相関光散乱データは、本明細書に記載された他の実施形態の方法で、過渡的な効果を除去して、マイクロレオロジー測定用に処理できるであろう。 Determining the particle size distribution may include performing an optical diffraction particle characterization analysis (eg, using Fraunhofer theory, or Mie scattering theory) on the time series of measurements. The methods disclosed herein apply to static light scattering (SLS), dynamic light scattering (DLS), electrophoretic light scattering (ELS), magnetophoretic light scattering (MLS), and related methods. Thus, for example, protein mobility, surface zeta, microrheology, etc. may be measured. Correlated light scattering data could be processed for microrheological measurements with transient effects removed by methods of other embodiments described herein.
「不純物」という用語は、大径粒子、でなければ異常粒子を含む。「大径粒子」という用語は、複数の大径粒子を除外しない。「大径粒子」という用語は、所定の閾値サイズより大きな直径を有する粒子を意味し得る。幾つかの実施形態では、それは、例えば、データを参照して決定されるパラメータの解析(例えば、統計的解析)に基づいて特定される/補正される、単に異常な(又は一時的な)散乱データである。 The term "impurities" includes large or otherwise abnormal particles. The term "large particles" does not exclude a plurality of large particles. The term "large particles" can mean particles having a diameter greater than a predetermined threshold size. In some embodiments, it is simply anomalous (or transient) scattering that is identified/corrected, for example, based on analysis (e.g., statistical analysis) of parameters determined with reference to the data. Data.
他の実施形態は、不純物により散乱される光を補正する上記の方法を、組み合わせて用いてもよい。
不純物からの散乱による信号をこのように補正することにより、試料中に存在する小径粒子に関するより正確な情報を散乱測定値から抽出することができる。これにより、複数の光子計数検出器の必要性が低減され得る。大径粒子挙動のモデルをデータに当てはめ、不純物の予測の寄与分を除去することは、非常に有利である。測定された信号に大径粒子が影響を及ぼしている期間において、小径粒子データの少なくともかなりの部分が失われないためである。
Other embodiments may use a combination of the above methods to correct for light scattered by impurities.
By correcting the signal due to scattering from impurities in this way, more accurate information about the small particles present in the sample can be extracted from the scattering measurements. This may reduce the need for multiple photon counting detectors. Fitting a model of large particle behavior to the data to remove the predictive contribution of impurities is highly advantageous. This is because at least a significant portion of the small particle data is not lost during the period when the large particle affects the measured signal.
複数の散乱測定値が取得されている場合、各散乱測定値の継続時間は、5秒以下、2秒以下、1秒以下、0.5秒以下、又は0.1秒以下であってもよい。試料を特性評価するために、少なくとも10、20、50、又は100の散乱測定値を用いてもよい。 If multiple scatter measurements are taken, the duration of each scatter measurement may be 5 seconds or less, 2 seconds or less, 1 second or less, 0.5 seconds or less, or 0.1 seconds or less. . At least 10, 20, 50, or 100 scattering measurements may be used to characterize the sample.
汚染された散乱測定値として特定されていない散乱測定値から粒度分布を決定することは、各散乱測定値を別々に解析し、その後、各散乱測定値解析の平均を用いて粒度分布を決定することを含んでもよい。例えば、各散乱測定値の自己相関関数を組み合わせて平均化されたコレログラムを生成することができ、平均化されたコレログラムから粒度分布を決定できる。 Determining the particle size distribution from scatter measurements not identified as contaminated scatter measurements analyzes each scatter measurement separately and then uses the average of each scatter measurement analysis to determine the particle size distribution. may include For example, the autocorrelation function of each scattering measurement can be combined to produce an averaged correlogram, from which the particle size distribution can be determined.
この方法は、散乱測定値の初期回数を実行し、組み合わされたデータから取得される平均値が収束するまで(例えば、平均コレログラムが収束するまで)、散乱測定値を取得してもよい。収束基準は、組み合わせたデータから取得される平均値が、多数の連続する測定値に渡って変化する量に基づいてもよい。 The method may perform an initial number of scatter measurements and acquire scatter measurements until the average values obtained from the combined data converge (eg, until the average correlogram converges). A convergence criterion may be based on the amount by which the mean value obtained from the combined data changes over a large number of consecutive measurements.
いくつかの実施形態において、分離基準は、使用者により選択可能であってもよい。情報(例えば、統計的情報、パラメータの分布、及び/又は閾値を用いて取得された解析結果)が使用者に提供されて、使用者による適切な閾値の選択に役立てられてもよい。 In some embodiments, the separation criteria may be user-selectable. Information (eg, statistical information, parameter distributions, and/or analysis results obtained using thresholds) may be provided to the user to assist the user in selecting an appropriate threshold.
本発明の1つの局面によれば、照射光線と試料との相互作用により生成される散乱光の検出器への一連の光子到達時間を含む散乱測定値の汚染された部分を特定する方法が提供される。この方法は、複数のウィンドウのそれぞれの光子数の関数として光子到達時間の勾配を決定することと、各ウィンドウの勾配を閾値勾配領域と比較することにより、不純物からの光散乱を含む汚染されたウィンドウを特定することと、を含む。 According to one aspect of the invention, a method is provided for identifying a contaminated portion of a scatter measurement comprising a series of photon arrival times at a detector of scattered light produced by interaction of an illuminating beam with a sample. be done. This method includes light scattering from impurities by determining the slope of the photon arrival time as a function of the number of photons in each of a plurality of windows and comparing the slope of each window to a threshold slope area. identifying the window.
この方法は、汚染されたウィンドウを有さない散乱測定値の最長の連続的な時間に対応する、散乱測定値の最適な時間を特定することを含んでもよい。
この方法は、最適な時間から粒子特性を決定することを含んでもよい。
The method may include identifying an optimal time of scatter measurements that corresponds to the longest continuous time of scatter measurements that do not have a contaminated window.
The method may include determining particle properties from the optimal time.
閾値勾配領域は、複数のウィンドウそれぞれの勾配から決定されてもよい。閾値勾配領域を決定することは、ウィンドウの勾配の平均値を決定することを含んでもよい。例えば、閾値勾配領域は、平均ウィンドウ勾配のいずれかの側でのパーセンテージ範囲であってもよい。 A threshold slope region may be determined from the slope of each of the plurality of windows. Determining the threshold gradient region may include determining an average value of the gradients of the window. For example, the threshold slope area may be a percentage range on either side of the average window slope.
閾値勾配領域は、散乱測定値全体の勾配から、例えば、散乱測定値全体の勾配の逸脱のパーセンテージから、決定されてもよい。散乱測定値全体の勾配は、散乱測定値全体に対する直線の当てはめから決定されてもよい。 The threshold slope area may be determined from the slope of the overall scatter measurements, eg, from the percentage deviation of the slope of the overall scatter measurements. The slope of the overall scatter measurements may be determined from a straight line fit to the overall scatter measurements.
各ウィンドウは、時間、又は光子到達時間の数に対応してもよい。より大きなウィンドウは、より長い時間、又は光子到達時間のより大きい数に対応し得て、より小さなウィンドウは、より短い時間、又は、光子到達時間のより小さい数に対応し得る。 Each window may correspond to time or number of photon arrival times. A larger window may correspond to a longer time or a larger number of photon arrival times, and a smaller window may correspond to a shorter time or a smaller number of photon arrival times.
この方法は、不純物への所望の敏感性の増大に応じてウィンドウを小さくすることを含んでもよい。
この方法は、反復的な処理を含んでもよい。この反復的な処理において、大きなウィンドウは、候補の最適な時間を初期に特定するために用いられ、小さなウィンドウ(又は、一連の小さなウィンドウ)は、不純物が存在しない最適な時間の信頼レベルを高めるために用いられる。
The method may include decreasing the window in response to the desired increase in sensitivity to impurities.
The method may include iterative processing. In this iterative process, a large window is used to initially identify the candidate optimal time, and a small window (or a series of small windows) increases the confidence level of the optimal impurity-free time. used for
本発明の1つの局面によると、不揮発性機械読取り可能な記憶媒体が提供される。この媒体は、適切なプロセッサ上での実行時に、該プロセッサが、照射光線と試料との相互作用によって生成される散乱光の測定値の時系列をそれぞれ含む複数の散乱測定値を検出器から取得し、各散乱測定値から分離パラメータを決定し、分離パラメータから分離基準を決定し、各散乱測定値の分離パラメータを分離基準と比較することにより、不純物が散乱光に寄与していた汚染された散乱測定値を特定し、且つ、汚染された散乱測定値として特定されていない散乱測定値から粒子特性を決定する、ようにする指示を含む。 According to one aspect of the invention, a non-volatile machine-readable storage medium is provided. The medium, when running on a suitable processor, acquires a plurality of scatter measurements from the detector, each including a time series of scattered light measurements produced by the interaction of the illumination beam with the sample. by determining a separation parameter from each scattering measurement, determining a separation criterion from the separation parameter, and comparing the separation parameter of each scattering measurement with the separation criterion to determine which impurities contributed to the scattered light. Instructions are included to identify scatter measurements and to determine particle properties from scatter measurements not identified as contaminated scatter measurements.
本発明の1つの局面によると、不揮発性機械読取り可能な記憶媒体が提供される。この媒体は、適切なプロセッサ上での実行時に、該プロセッサが、不純物が散乱光に寄与していた汚染された散乱測定値を特定し、汚染された散乱測定値として特定されていない散乱測定値から粒子特性を決定する、ようにする指示を含む。この粒子特性を決定することは、汚染された散乱測定値として特定されていない各散乱測定値の自己相関関数を決定することと、自己相関関数を組み合わせることで、粒子特性が導出される平均自己相関関数を生成することと、を含む。 According to one aspect of the invention, a non-volatile machine-readable storage medium is provided. This medium, when run on a suitable processor, enables the processor to identify contaminated scatter measurements in which impurities contributed to the scattered light and scatter measurements not identified as contaminated scatter measurements. including instructions to determine the particle properties from. Determining this particle property involves determining the autocorrelation function for each scatter measurement not identified as a contaminated scatter measurement, and combining the autocorrelation functions to derive the average autocorrelation function from which the particle property is derived. generating a correlation function.
本発明の1つの局面によると、不揮発性機械読取り可能な記憶媒体が提供される。この媒体は、適切なプロセッサ上での実行時に、該プロセッサが、照射光線と試料との相互作用により生成される散乱光の測定値の時系列を含む散乱測定値を検出器から取得し、補正された散乱測定値を生成し、補正された散乱測定値から粒子特性を決定する、ようにする指示を含む。この補正された散乱測定値を生成することは、散乱測定の少なくとも幾つかの時間の中で散乱強度を低減することにより、不純物からの散乱寄与を補償することを含む。 According to one aspect of the invention, a non-volatile machine-readable storage medium is provided. The medium, when running on a suitable processor, acquires and corrects scatter measurements from the detector, including a time series of scattered light measurements produced by the interaction of the illumination beam with the sample. generating corrected scatter measurements and determining particle properties from the corrected scatter measurements. Generating this corrected scattering measurement includes compensating for the scattering contribution from impurities by reducing the scattering intensity during at least some time of the scattering measurement.
本発明の1つの局面によると、不揮発性機械読取り可能な記憶媒体が提供される。この媒体は、適切なプロセッサ上での実行時に、該プロセッサに、複数のウィンドウそれぞれの光子数の関数として光子到達時間の勾配を決定することと、ウィンドウそれぞれの勾配を閾値勾配領域と比較することにより、不純物からの散乱光を含む汚染されたウィンドウを決定することと、を含む工程により、照射光線と試料との相互作用により生成される散乱光の検出器における一連の光子到達時間を含む散乱測定値の汚染された部分を特定させる指示を含む。 According to one aspect of the invention, a non-volatile machine-readable storage medium is provided. This medium, when executing on a suitable processor, instructs the processor to determine the slope of photon arrival times as a function of photon count for each of a plurality of windows, and to compare the slope of each of the windows to a threshold slope area. determining a contaminated window containing scattered light from the impurity by scattering a sequence of photon arrival times at the detector of the scattered light produced by the interaction of the illuminating beam with the sample. Contains instructions that allow the contaminated portion of the measurement to be identified.
本発明の1つの局面によると、光源と、試料セルと、検出器と、プロセッサと、を含む、粒子特性評価装置が提供される。前記光源は、光線を試料セル内の試料に照射して、光線と試料との相互作用により散乱光を生成するように動作可能であり、検出器は、散乱光を検出し、且つ、測定値の時系列を生成するように構成され、プロセッサは、照射光線と試料との相互作用により生成される散乱光の測定値の時系列をそれぞれ含む複数の散乱測定値を検出器から取得し、各散乱測定値から分離パラメータを決定し、分離パラメータから分離基準を決定し、各散乱測定値の分離パラメータを分離基準と比較することにより、不純物が散乱光に寄与していた汚染された散乱測定値を特定し、且つ、汚染された散乱測定値として特定されていない散乱測定値から粒子特性を決定するように構成される。 According to one aspect of the invention, a particle characterization apparatus is provided that includes a light source, a sample cell, a detector, and a processor. The light source is operable to irradiate a sample in the sample cell with light beams to produce scattered light due to the interaction of the light beams with the sample, and the detector detects the scattered light and provides a measured value. the processor obtains from the detector a plurality of scatter measurements each including a time series of scattered light measurements produced by the interaction of the illuminating beam with the sample; Contaminated scatter measurements whose impurities contributed to the scattered light were determined by determining a separation parameter from the scatter measurements, determining a separation criterion from the separation parameters, and comparing the separation parameter of each scatter measurement to the separation criterion. and determine particle properties from scatter measurements not identified as contaminated scatter measurements.
本発明の1つの局面によると、光源と、試料セルと、検出器と、プロセッサと、を含む、粒子特性評価装置が提供される。光源は、光線を試料セル内の試料に照射して、光線と試料との相互作用により散乱光を生成するように動作可能であり、検出器は、散乱光を検出し、且つ、測定値の時系列を生成するように構成され、プロセッサは、不純物が散乱光に寄与していた汚染された散乱測定値を特定し、汚染された散乱測定値として特定されていない散乱測定値から粒子特性を決定するように構成される。粒子特性を決定することは、汚染された散乱測定値として特定されていない各散乱測定値の自己相関関数を決定することと、自己相関関数を組み合わせて、粒子特性が導出される平均自己相関関数を生成することと、を含む。 According to one aspect of the invention, a particle characterization apparatus is provided that includes a light source, a sample cell, a detector, and a processor. A light source is operable to irradiate a sample in the sample cell with a beam of light to produce scattered light from interaction of the beam with the sample, and a detector detects the scattered light and provides a measurement. The processor, configured to generate the time series, identifies contaminated scattering measurements in which impurities contributed to the scattered light, and identifies particle properties from the scattering measurements not identified as contaminated scattering measurements. configured to determine. Determining the particle properties includes determining an autocorrelation function for each scatter measurement not identified as a contaminated scatter measurement, and combining the autocorrelation functions to obtain an average autocorrelation function from which the particle properties are derived. and generating a
本発明の1つの局面によると、光源と、試料セルと、検出器と、プロセッサと、を含む、粒子特性評価装置が提供される。光源は、光線を試料セル内の試料に照射して、光線と試料との相互作用により散乱光を生成するように動作可能であり、検出器は、散乱光を検出し、且つ、測定値の時系列を生成するように構成され、プロセッサは、検出器からの散乱光の測定値の時系列を含む散乱測定値を取得し、補正された散乱測定値を生成し、補正された散乱測定値から粒子特性を決定するように構成される。この補正された散乱測定値を生成することは、散乱測定の少なくとも幾つかの時間の中で散乱強度を低減することにより、不純物からの散乱寄与を補償することを含む。 According to one aspect of the invention, a particle characterization apparatus is provided that includes a light source, a sample cell, a detector, and a processor. A light source is operable to irradiate a sample in the sample cell with a beam of light to produce scattered light from interaction of the beam with the sample, and a detector detects the scattered light and provides a measurement. The processor, configured to generate a time series, obtains a scatter measurement including a time series of measurements of scattered light from the detector, generates a corrected scatter measurement, and a corrected scatter measurement. is configured to determine the particle properties from. Generating this corrected scattering measurement includes compensating for the scattering contribution from impurities by reducing the scattering intensity during at least some time of the scattering measurement.
本発明の1つの局面によると、光源と、試料セルと、検出器と、コントローラと、を含む、粒子特性評価装置が提供される。光源は、光線を試料セル内の試料に照射して、光線と試料との相互作用により散乱光を生成するように動作可能であり、検出器は、散乱光を検出し、且つ、測定値の時系列を生成するように構成され、コントローラは、検出器からの散乱光の測定値の時系列を含む散乱測定値を取得し、散乱測定の少なくとも幾つかの時間の中で散乱強度を低減することにより、不純物からの散乱寄与を補償する、ように構成される。 According to one aspect of the invention, a particle characterization apparatus is provided that includes a light source, a sample cell, a detector, and a controller. A light source is operable to irradiate a sample in the sample cell with a beam of light to produce scattered light from interaction of the beam with the sample, and a detector detects the scattered light and provides a measurement. Configured to generate a time series, the controller obtains the scatter measurements including the time series of scattered light measurements from the detector and reduces the scatter intensity during at least some time of the scatter measurements. thereby compensating for scattering contributions from impurities.
上記装置は、可変減衰器を含んでもよい。可変減衰器は、散乱光を減衰することにより、不純物からの散乱寄与を補償するように構成されてもよい。可変減衰器は、照射光線を減衰することにより、不純物からの散乱寄与を補償するように構成されてもよい。 The device may include a variable attenuator. The variable attenuator may be configured to attenuate scattered light, thereby compensating for scattering contributions from impurities. The variable attenuator may be configured to compensate for scattering contributions from impurities by attenuating the illuminating beam.
コントローラは、不純物からの散乱寄与に比例する信号を可変減衰器へ供給するように動作可能であってもよい。
幾つかの実施形態において、検出器は、光子計数検出器を含んでもよく、及び/又は、後方散乱光、前方散乱光、及び/又は側方散乱光を検出するように構成されてもよい。上記装置は、散乱光を検出するように構成される複数の検出器を含んでもよい。検出器のうち少なくとも幾つかは、異なる散乱角度で散乱する光を検出するように構成されてもよく、及び/又は、検出器のうち少なくとも幾つかは、同一の散乱角度で散乱される光を検出するように構成されてもよい。
The controller may be operable to provide a signal proportional to the scattering contribution from the impurity to the variable attenuator.
In some embodiments, the detector may include a photon counting detector and/or may be configured to detect backscattered light, forward scattered light, and/or side scattered light. The apparatus may include multiple detectors configured to detect scattered light. At least some of the detectors may be configured to detect light scattered at different scattering angles and/or at least some of the detectors may detect light scattered at the same scattering angles. may be configured to detect.
上記装置は、1つ又は複数の検出器と光源によって照射される散乱ボリュームとの間の光路を提供する少なくとも1つの光ファイバを更に含んでもよい。
本発明の1つの局面によると、光源と、試料セルと、検出器と、プロセッサと、を含む、粒子特性評価装置が提供される。光源は、光線を試料セル内の試料に照射して、光線と試料との相互作用により散乱光を生成するように動作可能であり、検出器は、散乱光を検出し、且つ、検出器での散乱光の一連の光子到達時間を含む散乱測定値を生成するように構成され、プロセッサは、複数のウィンドウそれぞれについて光子数の関数として光子到達時間の勾配を決定し、且つ、各ウィンドウの勾配を閾値勾配領域と比較することにより、不純物からの光散乱を含む汚染されたウィンドウを決定することにより、散乱測定値の汚染された部分を特定するように構成される。
The apparatus may further comprise at least one optical fiber providing an optical path between one or more detectors and the scattering volume illuminated by the light source.
According to one aspect of the invention, a particle characterization apparatus is provided that includes a light source, a sample cell, a detector, and a processor. The light source is operable to illuminate a sample in the sample cell with a beam of light to produce scattered light from interaction of the beam with the sample, the detector detects the scattered light, and the detector detects the scattered light. the processor determines a slope of the photon arrival times as a function of photon number for each of the plurality of windows; is configured to identify the contaminated portion of the scatter measurement by determining a contaminated window that includes light scattering from the impurity by comparing λ with a threshold gradient area.
1つ1つの局面の特徴は、他の1つ1つの局面の特徴と組み合わされてもよい。装置に関係する局面は、対応する方法を行うように構成されてもよく、且つ、選択が自由な方法の工程のいずれも行うように構成されてもよい。 Features of any one aspect may be combined with features of any other aspect. Aspects relating to the apparatus may be configured to perform the corresponding method and may be configured to perform any of the optional method steps.
例示的な実施形態は、添付の図面を参照して、単に例として説明される。
図1は、光源102、試料セル104、後方散乱検出器114、前方散乱検出器124、及び光トラップ108を備える粒子特性評価装置を示す。
光源102は、レーザ等のコヒーレント光源であってもよく、単色光を出力してもよい。あるいは、光源102はLEDであってもよい。光源102は、試料セル104内の試料106に対し、光軸に沿って光線103を照射するように構成されている。
FIG. 1 shows a particle characterization system comprising a
照射光線103と試料106との相互作用により、散乱光が生じる。前方散乱光121は、照射光軸の方向に対して90度未満の角度で散乱される光であると定義してもよい。後方散乱光111は、光軸の方向に対して90度を超える角度で散乱される光(すなわち、照射光線とは反対方向における成分を有する)であると定義してもよい。
Interaction of the
前方散乱検出器124は前方散乱光121を検出するように構成されている。前方散乱光121は、散乱光121を光ファイバ122につなぐ集光レンズ120を介して、検出器124に向けられる。光ファイバ122は、前方散乱検出器124への光路を提供する。集光レンズ120は、屈折率分布型レンズであってもよく、又は、他の適切なレンズであってもよい。試料106の照射領域と前方散乱検出器124との間の光路には、更なる光学部品又はより少ない光学部品が備えられてもよい。例えば、いくつかの実施形態において、光ファイバ122が除かれ、代わりに自由空間光学系が使用されてもよい。
後方散乱検出器114は、後方散乱光111を検出するように構成されている。後方散乱光111は、光ファイバ112に散乱光111をつなぐ集光レンズ110を介して、センサに向けられる。光ファイバ112は、後方散乱検出器114への光路を提供する。集光レンズ110は、屈折率分布型レンズであってもよく、又は、他の適切なレンズであってもよい。試料106の照射領域と後方散乱検出器114との間の光路には、更なる光学部品又はより少ない光学部品が備えられてもよい。例えば、いくつかの実施形態において、光ファイバ112が除かれ、代わりに自由空間光学系が使用されてもよい。
いくつかの実施形態において、単一の検出器だけが設けられてもよく、例えば、側方散乱検出器(90度で散乱する光を検出)のみ、前方散乱検出器のみ、又は後方散乱検出器のみが存在してもよい。 In some embodiments, only a single detector may be provided, e.g., side scatter detector only (detects light scattered at 90 degrees), forward scatter detector only, or back scatter detector. may only be present.
図1の装置は、例えば単一の検出器(後方散乱検出器114など)からの出力を用いて、動的光散乱解析を行うように構成されてもよい。
図2は、検出器114、プロセッサ130、及び出力装置132を示す。プロセッサ130は、検出器114から光強度測定値の時系列を受信し、それら測定値に相関演算を行って、動的光散乱により試料の粒子を特性評価するように構成されている。プロセッサ130は、例えばメモリ、ソリッドステートストレージドライブ、ハードディスク、クラウド等、機械読取り可能な記録媒体に測定値を保存してもよい。プロセッサ130は、その後、解析結果を出力装置132に出力してもよく、出力装置132は表示画面を備えてもよい。
The apparatus of FIG. 1 may be configured to perform dynamic light scattering analysis using, for example, output from a single detector (such as backscatter detector 114).
FIG. 2 shows
プロセッサ130は、検出器114からの測定値の時系列から、不純物(例えば大径粒子)が散乱光に寄与していたときにどの測定値が取得されたかを判断するように構成されている。
1つの実施形態に係る装置は、図1及び2に示す(また、これら図面を参照して説明される)特徴を組み合わせてもよく、図3において概略的に示される方法を行うように構成されてもよい。 An apparatus according to one embodiment may combine the features shown in (and described with reference to) FIGS. may
図3は、一連の方法ステップ201~204を示す。ステップ201は、試料セル104内の試料106に光線103を照射して、光線103と試料106との相互作用によって散乱光111を生じさせることを含む。
FIG. 3 shows a series of method steps 201-204. Step 201 involves illuminating a
ステップ202は、検出器114から散乱光111の測定値の時系列を取得することを含み、検出器114は単一の検出器であってもよい。本明細書で使用される「単一の検出器」という用語は、特定の光散乱角度(又は、5度以下などの狭い範囲の光散乱角度)に対応する複数の検出器(例えば、1D又は2D検出素子アレイ)を含んでもよい。
Step 202 includes obtaining a time series of measurements of scattered light 111 from
ステップ203は、検出器114からの測定値の時系列から、不純物(例えば大径粒子)が散乱光に寄与していたときにどの測定値が取得されたかを判断することを含む。より十分に以下に説明されるように、これを実施するために多くの様々な方法を用いることが可能である。
Step 203 involves determining from the time series of measurements from
ステップ204は、不純物が散乱光に寄与していたときに取得されたものではない測定値から、又は、不純物からの散乱の影響を軽減するために補正された測定値から、粒子特性(例えば、粒径分布)を決定することを含む。ステップ204は、測定値の時系列を用いる動的光散乱測定を行うことを含んでもよい。不純物からの散乱光を補正することによって、粒子の特性評価の品質及び/又は精度が向上し得る。なぜなら、それにより、不純物(例えば大径粒子)からの比較的強度の高い散乱によって、試料中の小径粒子(最も関心の対象となるであろう粒子)の特性評価が損なわれることを回避でき得るからである。 Step 204 extracts the particle properties (e.g., particle size distribution). Step 204 may include performing dynamic light scattering measurements using the time series of measurements. Correcting for scattered light from impurities may improve the quality and/or accuracy of particle characterization. because it may avoid compromising the characterization of small particles in the sample (those that may be of most interest) due to relatively intense scattering from impurities (e.g., large particles). It is from.
図4は、検出器からの測定結果320の時系列と共に、それら測定結果320から取得された相関関数310のプロットを示している。粒径に対する散乱光強度の粒度分布(PSD)プロット330もまた示されている。測定値320の考察は、大径粒子からの散乱に対応するt=8s以降に光強度が際立って増大することを示している。
FIG. 4 shows a plot of the
これは、大径粒子が光を散乱させているときに取得される測定値を特定する1つの方法である。この場合、例えば、大径粒子から散乱している光を特定するために、毎秒600カウントの閾値強度値を用い得る。この閾値を超えている所定時間(例えば1秒又は0.5秒)内のデータは、その後のDLS解析から除外されてもよい。例えば、t=9sにおいて閾値が超過される場合、t=8s以降のデータは除外されてもよく、又は、大径粒子による散乱寄与の適合モデルがこれらデータから差し引かれてもよい。強度閾値及び時間窓の正確な値は、装置の構成及び具体的な測定準備に依存しうる。閾値は、強度値の2、3、4、又は5標準偏差であってもよい(それは、測定が完了した後で決定してもよく、又は、測定が行われている際に動的に決定してもよい)。 This is one way of identifying measurements taken when large particles are scattering light. In this case, for example, a threshold intensity value of 600 counts per second may be used to identify light scattering from large particles. Data within a predetermined amount of time (eg, 1 second or 0.5 seconds) exceeding this threshold may be excluded from subsequent DLS analysis. For example, if the threshold is exceeded at t=9 s, data after t=8 s may be excluded, or a fitted model of the scattering contribution due to large particles may be subtracted from these data. The exact values of intensity threshold and time window may depend on the configuration of the device and the specific measurement setup. The threshold may be 2, 3, 4, or 5 standard deviations of the intensity value (it may be determined after the measurement is completed, or it may be determined dynamically while the measurement is taking place). may be used).
代替的に又は付加的に、測定値の時系列内の特徴的な周波数は、大径粒子からの光散乱を特定するために用いられてもよい。つまり、低周波数特性は、大径粒子に対応する傾向にある。例示的なデータ320において、t=8sからの低周波数、振幅の大きな逸脱までは、測定値は比較的安定している。光強度の低周波数と振幅の大変動の組み合わせは、大径粒子に非常に特徴的であるため、大径粒子が散乱させている時間を特定するのに用いられてもよい。10、5、4、3、2、1Hz未満、又は0.5Hz以下の周波数は、大径粒子と関連し得る。
Alternatively or additionally, characteristic frequencies within the time series of measurements may be used to identify light scattering from large particles. That is, the low frequency characteristics tend to correspond to large diameter particles. In the
PSDプロット330は、t=8sとt=10sとの間の時系列を含む、データの全時系列の処理に基づく。PSDプロット330は、約1000nmの粒径に対応する光強度のピークを示している。
特定の時間窓内に大径粒子が存在することを識別する1つの方法は、全時系列のデータ(又はラン)をより短い時間ランを有する複数の散乱測定値(又はサブラン)に分割し、その後、各サブランを解析して、それが不純物からの散乱を含むかを決定することである。例えば、データ320が時間1秒の複数のサブランに分割され、DLS相関解析が各サブランのデータに行われた場合、どのサブランにおいて1つ又は複数の大径粒子が大量の光散乱に寄与しているかを識別することは、容易であろう(例えば、全散乱光の1%、5%、又は10%超え、又は、ある特定の閾値を超える粒径で、強度PSDが1、5、又は10%を超えるとき)。不純物(例えば大径粒子)からの大量の散乱を有するサブランは、その後、測定値列から除外され得る。そして、残りの測定データを組み合わせ、その組み合わせた残りの測定データに基づいてDLS測定が行われてもよい。あるいは、不純物による散乱のモデルを、不純物からの大量の散乱を有する各サブラン内のデータに適合してもよい。適合したモデルによって算出された不純物による散乱信号の推定値を、その後、そのサブラン内のデータから差し引いてもよい。残りの補正されたデータは、その後、測定値列の他のサブランからのデータと組み合わされ、その組み合わされた補正後のデータ列につきDLS測定を行ってもよい。
One method of identifying the presence of large particles within a particular time window is to divide the full time series of data (or runs) into multiple scattering measurements (or subruns) with shorter time runs, Each subrun is then analyzed to determine if it contains scattering from impurities. For example, if the
本発明の実施形態は、大径粒子が問題である場合に、著しく向上したDLS特性評価の忠実性を提供できる。
図5は、散乱光検出器から取得された経時的な光子計数率のグラフ350を示している。スパイク351がデータ内に存在し(それら全てが図5に表示されているわけではない)、装置の測定ボリューム内に高散乱粒子(すなわち不純物)が存在している時間に対応している。この不純物からの寄与に対処する1つの方法は、データを補正し、不純物からの散乱寄与を除去することである。これは、潜在的に価値のある測定データを維持し得るので、汚染されたデータを単に破棄することと比べて有利となり得る。
Embodiments of the present invention can provide significantly improved DLS characterization fidelity when large particles are a problem.
FIG. 5 shows a
図6は、散乱検出器から取得された経時的な光子計数率のグラフ360を示している。図5の短時間の「スパイク」とは対照的に、図6のデータに関する不純物は、測定ボリュームにゆっくりと作用する大径粒子であり、その結果、検出された強度において低周波変動となる。大径粒子からのこの種の散乱への寄与は、データの低周波成分を除去することで対処してもよい。
FIG. 6 shows a
汚染された散乱測定値(例えば、大径粒子が散乱に寄与したサブラン)を特定できることが望ましい。これを行う1つの方法は、各サブランの強度を測定し、拒絶基準として平均強度値(例えば平均値、中央値等)を用いることである。大径粒子は強い散乱と関連があるので、高い強度のサブランは大径粒子と関連するであろう。サブランを拒絶する閾値は、全てのサブランの全体的特性から決定されてもよい。例えば、閾値平均強度は、全てのサブランにおいて取得された平均強度から導出され得る(例えば、全てのサブランについての平均強度から2又は3標準偏差)。 It is desirable to be able to identify contaminated scattering measurements (eg, subruns in which large particles contributed to the scattering). One way to do this is to measure the intensity of each subrun and use the average intensity value (eg mean, median, etc.) as a rejection criterion. Since large particles are associated with strong scattering, high intensity subruns will be associated with large particles. A threshold for rejecting a subrun may be determined from the overall characteristics of all subruns. For example, a threshold mean intensity can be derived from mean intensities obtained in all subruns (eg, 2 or 3 standard deviations from the mean intensity for all subruns).
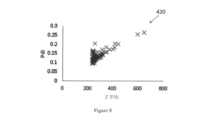
図7は、220nmラテックス球及び何らかのフィルタ阻害物(大径微粒子不純物)を含む試料に対して行われた測定から取得された、複数の散乱測定値(又はサブラン)に関するZ平均粒径の関数としての平均計数率(強度)のグラフ410を示している。このZ平均は、ISO13321及び/又はISO22412で規定されているように、各サブランについて決定されてもよい。平均強度に基づく拒絶基準の1つの欠点は、小径粒子と関連していることをZ平均が示す多くのサブランを拒絶する結果になり得ることである。
FIG. 7 shows Z-average particle size as a function of multiple scattering measurements (or subruns) obtained from measurements performed on samples containing 220 nm latex spheres and some filter obstructions (large particle impurities). 4 shows a
1つの代替案は、多分散性指数(Pdi)に基づいてサブランを拒絶することである。これは、ISO13321及び/又はISO22412で規定されているように、キュムラント解析から決定されてもよい。図8は、図7に示されているものと同一のサブランデータについてのZ平均に対する多分散性指数Pdiのグラフ420を示している。Z平均と多分散性指数との間にはより強い相関関係があり、これは、多分散性に基づく拒絶基準が、大径粒子によって影響されるサブランに対してより選択的である傾向があることを意味する。
One alternative is to reject subruns based on their polydispersity index (Pdi). This may be determined from cumulant analysis as specified in ISO13321 and/or ISO22412. FIG. 8 shows a
更にもう1つの代替案は、拒絶基準としてZ平均粒径を用い、閾値を超えるZ平均粒径を有するサブランを拒絶することである。この場合もやはり、閾値は、全てのサブランの集合体から算出されるZ平均を参照して決定されてもよい(例えば、全てのサブランについてのZ平均から3標準偏差を超える値を拒絶する)。 Yet another alternative is to use the Z-average particle size as a rejection criterion and reject subruns with a Z-average particle size above a threshold. Again, the threshold may be determined with reference to the Z-mean calculated from the aggregate of all subruns (e.g., reject values that are more than 3 standard deviations from the Z-mean for all subruns). .
図9は、測定のため、閾値拒絶基準がどのように算出されるかを説明する1組のPdiヒストグラム430である。Pdi値の第1ヒストグラム、第2ヒストグラム、及び第3ヒストグラムは、リゾチーム、220nmラテックス球、及び60nmラテックス球それぞれに対応して示されている。第1正規分布431、第2正規分布432、及び第3正規分布433が、各ヒストグラムにそれぞれ当てはめられる(例えば、最小二乗ペナルティ関数を用いて)。各測定のPdiの平均値及び標準偏差σは、各測定のサブランから取得されたヒストグラムにベストフィットする正規分布431、432、433から決定されてもよい。ベストフィットする正規分布を用いることは、外れ値サブランによる平均値のスキューを回避するのに役立ち、このことは、図9にて見られる(例えば、0.15より大きなPdi値)。
FIG. 9 is a set of
閾値拒絶基準は、サブランのヒストグラムにベストフィットするもの(例えば、Z平均、Pdi又は強度)から取得した平均値に、標準偏差の倍数、例えば3倍(又は2、4、5、6倍等)を加えたものを含んでもよい。 The threshold rejection criterion is a multiple of the standard deviation, such as 3 (or 2, 4, 5, 6, etc.), to the mean value taken from the subrun histogram best fit (e.g., Z-mean, Pdi or intensity). may include the addition of
図10は、拒絶基準がPdiに基づき、且つ、閾値が、ベストフィットする正規分布から決定した平均値から3標準偏差である、拒絶方法の一例を説明している。図10は、ベストフィットする正規分布441と、平均Pdi442(ベストフィットする正規分布441から算出)と、閾値拒絶基準443(平均値+3σ)と、を有するグラフ440を示している。維持されたサブラン445と拒絶/分離されたサブラン444もまた、同じグラフにプロットされている。閾値を超えるPdiを有するサブランは拒絶/分離され、閾値以下のPdiを有するサブランは別の解析のために維持される。
FIG. 10 illustrates an example rejection method in which the rejection criteria are based on Pdi and the threshold is 3 standard deviations from the mean determined from the best-fit normal distribution. FIG. 10 shows
図11は、維持されたサブラン455、拒絶/分離されたサブラン454、及び全てのサブラン453それぞれについて取得したg1相関関数を示すグラフ450である。図12は、維持されたサブラン465、拒絶/分離されたサブラン464、及び全てのサブラン463それぞれに関する強度粒度分布を示すグラフである。維持されたサブランが不純物粒子からのデータを含まないことは、明らかである。全てのサブランが用いられるときに報告される小径粒子(すなわち、不純物を除いた対象の粒子)についての平均粒径は、維持されたサブランから取得するそれとは異なる。維持されたサブランからのデータは、大径粒子/不純物からの散乱によって歪められないので、より正確である。拒絶/分離されたサブランは、大径の(例えば不純物)粒子の特性を特定するために用いることができる。維持されたサブランと拒絶/分離されたサブランについての情報を別々に解析し且つ提示するアプローチは、使用者により多くの情報を提供し、且つ、光散乱データの処理に伴い得る曖昧性を取り除く。
FIG. 11 is a
パラメータの分布に基づく(例えば、パラメータの標準偏差に基づく)拒絶/分離基準の使用は、範囲外のデータのみが拒絶され、且つ、拒絶/分離が動的であって、測定されている試料に対応することを意味する。偶発的な不純物を有しており高度に単分散した試料は、かなり狭い分布Pdiとなり、結果、不純物からの散乱データは、比較的高い感度で拒絶されるであろう。その対極として、高度に多分散であり可変な試料は、連続的なサブランの間でPdiにおいて高い標準偏差を有し得る。これは、ほとんどのデータが拒絶/分離されないであろうことを意味し、結果、試料内の粒径の多様性を反映するマルチモーダル粒度分布となるであろう。解析に動的に対応する(例えば、測定中に更新されるパラメータの分布に基づいて)拒絶/分離基準を決定するこのアプローチは、測定が、広い範囲の試料を受け入れることができる十分なロバスト性を有することを意味し、且つ、粒子の予想範囲を事前に特定することを使用者に求めないことを意味する。 The use of rejection/separation criteria based on the distribution of the parameters (e.g., based on the standard deviation of the parameters) allows only out-of-range data to be rejected, and the rejection/segregation is dynamic and does not affect the sample being measured. means to correspond. A highly monodisperse sample with incidental impurities will have a fairly narrow distribution Pdi, so that scattering data from impurities will be rejected with relatively high sensitivity. On the other end of the spectrum, highly polydisperse and variable samples can have high standard deviations in Pdi between successive subruns. This means that most of the data will not be rejected/segregated, resulting in a multimodal particle size distribution that reflects the variation in particle size within the sample. This approach of determining rejection/separation criteria dynamically adapted to the analysis (e.g., based on parameter distributions updated during the measurement) is robust enough to allow the measurement to accept a wide range of samples. and does not require the user to pre-specify the expected range of particles.
図13は、酸化銅ナノ粒子の高度に多分散性である可変試料に適用された、図11に示される拒絶/分離アプローチを説明している。この種の高度に可変である分散性の試料において、大多数のサブランは、非過渡的であると特定され、且つ、報告される結果は、試料の分散性(すなわち、マルチモーダル/多分散性)を反映する。図13は、ベストフィットする正規分布441、平均Pdi442(ベストフィットする正規分布441から導出)、閾値拒絶基準443(平均値+3σ)を有するグラフ470を示している。維持されたサブラン445と拒絶/分離されたサブラン444もまた、同じグラフにプロットされている。1つのサブラン(非常に高いPdiを有する)のみがデータセットから拒絶/分離されている。
FIG. 13 illustrates the rejection/separation approach shown in FIG. 11 applied to a highly polydisperse variable sample of copper oxide nanoparticles. In this type of highly variable dispersive sample, the majority of sublanes are identified as non-transient, and the reported results reflect the sample dispersibility (i.e., multimodal/polydispersity ). FIG. 13 shows a
上記の説明は、DLSにおける適用に主に焦点を当てているが、同様の技術は、SLS測定及びELS測定にも採用することができる。
分子量測定等の用途のための静的光散乱において、関心の対象となるのは、測定された散乱強度の時間的特性というよりも、測定された散乱強度の大きさであり、SLS測定もまた、試料内のダストの影響を受けやすいことを意味する。
Although the above description focuses primarily on applications in DLS, similar techniques can be employed for SLS and ELS measurements as well.
In static light scattering for applications such as molecular weight measurements, it is the magnitude of the measured scattering intensity rather than the temporal properties of the measured scattering intensity that is of interest, and SLS measurements are also , means that it is susceptible to dust in the sample.
相関器を組み込んだSLS装置において、DLSにおいて説明されたものと同じ拒絶プロセスを適用することが可能であり、維持されたデータの平均強度が次の解析に用いられる。しかしながら、相関器が利用可能でないときは、各サブランの測定された散乱を定量化し、拒絶パラメータとして用いられる平均値、ドリフト、又はスプレッド(或いは何か他の値)と比較することで、拒絶を適用することは可能である。 In an SLS device incorporating a correlator, the same rejection process as described in DLS can be applied and the mean intensity of the retained data is used for subsequent analysis. However, when a correlator is not available, rejection can be reduced by quantifying the measured scatter of each subrun and comparing it to the mean, drift, or spread (or some other value) used as the rejection parameter. It is possible to apply
図15は、散乱検出器での光強度を示す模擬計数率データ512、及び、光強度データ512から算出された移動平均511(例えば、20ポイントウィンドウを有する)を示す。移動平均は、ローパスフィルタとして作用し、対象の高周波情報を除去するとともに、低周波変動をたどる。データ512から移動平均511を差し引くことにより、強度における低速変動が除去された、図16に示されるデータが得られる。移動平均は、データを処理するために用いることができる一種のローパスフィルタであるが、他の種類のフィルタリング処理やスムージング処理も同様な方法で用いてもよい(例えば、デジタルIIRフィルタ若しくはデジタルFIRフィルタ、又は、Savitzky-Golayフィルタ)。
FIG. 15 shows simulated
電気泳動光散乱は、散乱した粒子の電化に応じて散乱した粒子における動きを誘導するために、試料に負荷される外部電界を用い、この動きは、散乱光のドップラー解析により検出される。 Electrophoretic light scattering uses an external electric field applied to the sample to induce motion in the scattered particles in response to their electrification, which motion is detected by Doppler analysis of the scattered light.
計数率波形の特性のみならず、拒絶の根拠となり得る他のパラメータは、スペクトル幅を有するドップラー信号を表すパラメータを含む。
図14は、外れ値データを特定して破棄するために、スペクトル幅がどのように用いられ得るかを説明する。図14のグラフ500は、散乱光の正規化された強度対周波数シフトの多数の曲線を示す。各曲線は、リゾチームを含む試料の電気泳動測定の異なる測定ラン(又はサブラン)に対応する。狭いスペクトル幅502を有する測定ランは、凝集体が存在する試料に対応する。広いスペクトル幅501を有する測定ランは、凝集体を含まない試料に対応する。よって、凝集体を有するサンプルは、複数のサブランを選び、例えば、測定されたスペクトル幅の分布(例えば、平均プラス又はマイナスいくつかの標準偏差)に基づいて、非常に狭いスペクトル幅(他の測定と比較して)を有するサブランを破棄することによって、解析してもよい。
In addition to characteristics of the count rate waveform, other parameters that may be the basis for rejection include parameters that describe Doppler signals with spectral width.
FIG. 14 illustrates how spectral width can be used to identify and discard outlier data.
図17は、散乱測定値の数が増加するにつれて、解析結果がどのように収束し得るかを説明するグラフ550である。一連の散乱測定が実施され、蓄積され維持されるデータから取得され(5散乱測定毎に更新)報告されたZ平均が、一次y軸上で(x軸上の散乱測定の数に対して)図17においてプロット532されている。散乱測定の総数に対する拒絶/分離された散乱測定の率として定義されるデータ維持率は、第1の2次y軸に対してプロット531される(これも5散乱測定毎に決定される)。各データ点におけるZ平均の変化は、第2の2次y軸に対してプロット533される。
FIG. 17 is a
この例のデータセットにおいて、初期の散乱測定は大径粒子を含み、相当量のデータが最初の5散乱測定から除外されるが、報告されるZ平均は依然比較的大きい。更に多くのデータが散乱測定6~10において除外され、報告されるZ平均がより低めである。粒径のよりモノモーダルな分布が散乱測定10より後に検出され、結果として、より少ないデータが拒絶され、Z平均が、モノモーダル粒子(対象の粒子である可能性が高い)のZ平均に収束し始める。Z平均は、45散乱測定以内で1%未満に収束する。
In this example data set, the initial scatter measurements contain large particles and a significant amount of data is excluded from the first 5 scatter measurements, but the reported Z-average is still relatively large. More data is left out in scatter measurements 6-10 and the reported Z-average is lower. A more monomodal distribution of particle sizes is detected after the
使用者は、測定の終了のきっかけとなる収束基準を設定することも可能である。本例の場合、信頼性の低い測定は、Z平均収束交差を10%に設定することで取得することは可能であり、結果として、約30散乱測定(45散乱測定ではなく)の後に測定が終了する。 The user can also set convergence criteria that trigger the end of the measurement. In this example, a less reliable measurement could be obtained by setting the Z-average convergence crossing to 10%, resulting in a measurement after about 30 scatter measurements (instead of 45 scatter measurements). finish.
別途解析された比較的短い一連の散乱測定を用いることは、収束基準が満たされれば解析を早めに終了することができるので、解析がより迅速になり得ることを意味し、同時に、過渡的な大径粒子が測定に影響を与えることができず、十分に信頼できる散乱データが取得されるまでその測定が継続されるので、解析がより信頼性の高いものとなることを意味する。整合性のないデータを拒絶する向上した性能は、さほど厳格でない試料調製をも可能にし、又は、解析に適していないと従来考えられていた試料の解析を可能にし得る。 Using a relatively short series of separately analyzed scatter measurements means that the analysis can be quicker, as the analysis can be terminated early if the convergence criteria are met, while at the same time the transient This means that the analysis will be more reliable as large particles cannot affect the measurement and the measurement will continue until sufficiently reliable scattering data are obtained. Improved ability to reject inconsistent data may also allow for less stringent sample preparation, or allow analysis of samples previously considered unsuitable for analysis.
多くの用途において、散乱光は、アバランシェフォトダイオードや同様のフォトンカウンティング装置を用いて検出され、これらから、各光子パルスの正確な到達時間を記録できる。結果は、一連の時間測定となり、各時間測定は、検出器での光子の到達と関連付けられる。計数率信号を取得するためには、時間間隔に対応するビンに到達時間をビニングすることにより、光子の到達の生の時系列を処理することが必要であり、計数率はビン(ビン幅で区切られる)の中の光子の数から決定される。ビンの大きさは、計数率信号の経時的分解能を決定し、各ビン内の量子化分解能と経時的分解能との間にはトレードオフがある。大きさが小さいビンは、大きな経時的分解能を示すが、比較的少量の光子を有するので量子化分解能が制限される。大きさが大きいビンは、より多くの量子を有するが、良好な経時的構造が破棄されることとなる。 In many applications, the scattered light is detected using an avalanche photodiode or similar photon counting device, from which the precise time of arrival of each photon pulse can be recorded. The result is a series of time measurements, each time measurement associated with the arrival of the photon at the detector. To obtain the count rate signal, it is necessary to process the raw time series of photon arrivals by binning the arrival times into bins corresponding to the time intervals, and the count rate is binned (in bin width). is determined from the number of photons in the The size of the bins determines the temporal resolution of the count rate signal, and there is a trade-off between quantization resolution and temporal resolution within each bin. Smaller magnitude bins exhibit greater temporal resolution, but have a relatively small number of photons, which limits quantization resolution. A bin with a large magnitude will have more quanta, but good temporal structure will be discarded.
図18は、フィルタ阻害物を含む220nmのラテックス懸濁液について、時間に対して1秒あたり数千カウント(kcps)を示す計数率波形601を示す。ピーク602は、波形中に目で確認でき、これは、不純物(この場合フィルタ阻害物)からの散乱に対応する。ピーク602は、比較的低い周波数を有し、散乱強度が高い。
FIG. 18 shows a
散乱測定値を補正するために計数率波形を補正する1つの方法は、計数率をハイパスフィルタリングすることである。これは、低周波数成分を除去するという効果を有するので、不純物からの散乱寄与を除去しやすい。いずれの適したフィルタも使用することができ、フィルタは、電子的又はデジタル式で実施され得る。適したフィルタの例として、FTIRデジタルフィルタ及びIIRデジタルフィルタ、及び、バターワースフィルタ、チェビシェフ及びハニングウィンドウフィルタが含まれる。 One method of correcting the countrate waveform to correct the scatter measurements is to high pass filter the countrate. This has the effect of removing low frequency components, and thus tends to remove scattering contributions from impurities. Any suitable filter can be used, and the filter can be implemented electronically or digitally. Examples of suitable filters include FTIR and IIR digital filters, and Butterworth, Chebyshev and Hanning window filters.
一般的な光散乱技術で測定できる粒子の径の範囲は非常に広いので、全ての測定状況に合うフィルタの任意のカットオフ周波数を決めることは難しいであろう。低過ぎる固定のカットオフ周波数は、大径粒子を解析する方法の能力に不利に影響を及ぼす可能性があり、又、高過ぎる固定のカットオフ周波数は、モノモーダル小径粒子を特性評価する方法の精度を制限する可能性がある。 Since the range of particle sizes that can be measured with common light scattering techniques is very wide, it would be difficult to determine an arbitrary cut-off frequency for the filter to suit all measurement situations. A fixed cutoff frequency that is too low can adversely affect the ability of the method to analyze large particles, and a fixed cutoff frequency that is too high can affect the ability of the method to characterize monomodal small particles. May limit accuracy.
この問題の解決策は、散乱測定におけるフィルタ処理用のカットオフ周波数を動的に決定することである。これを行う1つの方法は、散乱測定を一連のより短いサブランに分割し(別の言い方をすると、複数の散乱測定値を取得し)、サブランごとに多くの異なる周波数でのパワー(又は振幅)を解析(例えば、各サブランの計数率のフーリエ変換を行う)することである。 A solution to this problem is to dynamically determine the cutoff frequency for filtering in the scatterometry. One way to do this is to divide the scatter measurements into a series of shorter subruns (in other words, take multiple scatter measurements), and for each subrun the power (or amplitude) at many different frequencies. is analyzed (eg, taking a Fourier transform of the count rate of each subrun).
不純物からの散乱寄与を含む周波数は、残りのサブランのパワーの分布からの外れ値であるパワーを有するサブランを含む周波数として定義されてもよい。例えば、周波数ごとに、平均パワーレベルと標準偏差を、各サブランのパワーレベルから決定してもよい。ある特定の周波数が、平均値からの標準偏差(例えば、2標準偏差や3標準偏差)の所定倍数を超えるパワーレベルを有する場合、その周波数は、不純物からの散乱寄与を含むと特定され得る。不純物からの散乱寄与を含まない最低周波数は、散乱測定におけるフィルタ処理用のカットオフ周波数として用いられてもよい。 Frequencies containing scattering contributions from impurities may be defined as frequencies containing subruns with powers that are outliers from the distribution of powers of the remaining subruns. For example, for each frequency, the average power level and standard deviation may be determined from the power level of each subrun. If a particular frequency has a power level that exceeds a predetermined multiple of standard deviations (eg, 2 standard deviations or 3 standard deviations) from the mean, then that frequency can be identified as containing a scattering contribution from the impurity. The lowest frequency that does not contain scattering contributions from impurities may be used as a cutoff frequency for filtering in scattering measurements.
図19はこれを説明しており、図18で示される散乱測定をそれぞれ1秒の10ランに分割することにより得られたフーリエ変換611を示す。2つのラン623は、10Hzより低い周波数(すなわち、2~3秒と5~6秒)における明らかな統計的外れ値である。したがって、動的カットオフ周波数は、10Hzと決定され、且つ、散乱測定が適切にフィルタ処理され得る。 FIG. 19 illustrates this, showing the Fourier transform 611 obtained by dividing the scatter measurement shown in FIG. 18 into 10 runs of 1 second each. Two runs 623 are clear statistical outliers at frequencies below 10 Hz (ie, 2-3 seconds and 5-6 seconds). Therefore, the dynamic cutoff frequency can be determined as 10 Hz and the scatter measurements filtered appropriately.
散乱データを補正する代替的な方法は、データのローパス又は平滑化されたバージョンを差し引くことである(図15及び図16を参照して既に説明されたように)。動的カットオフ周波数を決定するのに上述された方法は、この目的に適したスムージング特性又はローバスフィルタリング特性を決定するのに適用されてもよい。 An alternative method of correcting the scatter data is to subtract a low-pass or smoothed version of the data (as already described with reference to Figures 15 and 16). The methods described above for determining the dynamic cutoff frequency may be applied to determine suitable smoothing or low-pass filtering characteristics for this purpose.
図20を参照して、生の散乱測定値から取得された自己相関関数631と補正された散乱測定値から取得された自己相関関数632のプロット630が示される。この場合における生データは、一連の光子到達時間を含み、補正された自己相関関数を決定する補正された散乱測定値は、(例えば、計数率のフィルタされた/平滑化されたバージョンをフィルタ処理又は差し引くことで)補正が完了したビニングされた計数率を含む。本例の場合、ビンサイズ633は10マイクロ秒であり、結果、10マイクロ秒より小さい(及びそれに近い)減衰時間は分解され得ない。補正により、(長い遅延時間において)自己相関関数の基線上でノイズを除去することには成功したが、結果、短い遅延時間においては分解されない自己相関関数となる。
Referring to FIG. 20, a
短い遅延時間においては、生データから取得された自己相関関数は、不純物によってそれほど影響を受けない。補正された自己相関関数と生の自己相関関数両方の利点を維持するために、図21に示されるように、生の自己相関関数の一部632(短い減衰時間に対応)と、補正された自己相関関数の一部631a(長い減衰時間に対応)と組み合わせることで、複合自己相関関数を決定してもよい。
At short delay times, the autocorrelation function obtained from raw data is less affected by impurities. To maintain the benefits of both the corrected autocorrelation function and the raw autocorrelation function, a
補正された自己相関関数の生部分と補正部分との間の境界線をマークするカットオフ減衰時間は、50~250マイクロ秒の範囲から選択され得る。図21に示されるように、生の自己相関関数の値が、補正された自己相関関数の値とカットオフ減衰時間で合致するように、生の自己相関関数を再正規化してもよい。 A cutoff decay time that marks the boundary between the raw and corrected parts of the corrected autocorrelation function can be selected from the range of 50-250 microseconds. The raw autocorrelation function may be renormalized such that the raw autocorrelation function values match the corrected autocorrelation function values at the cutoff decay time, as shown in FIG.
固定のカットオフ減衰時間を選択することの代替として、複合自己相関関数の生の部分と補正された部分との間の遷移での勾配変化を最小化するカットオフ減衰時間が選択されてもよい。生の自己相関関数と補正された自己相関関数との間の遷移に最適なカットオフ減衰時間を決定するのに、反復方法が用いられてもよい。 As an alternative to choosing a fixed cutoff decay time, a cutoff decay time may be chosen that minimizes the slope change at the transition between the raw and corrected parts of the composite autocorrelation function. . An iterative method may be used to determine the optimal cutoff decay time for the transition between the raw autocorrelation function and the corrected autocorrelation function.
散乱測定値が一連の光子到達時間の形である場合、光子到着時間を削除して、関連する時点における有効な散乱強度を低減することで、散乱測定値を直接補正することができる。図22は、図18において先に説明されたものと同じ散乱計数率601を示すグラフであるが、平均計数率604(この場合は中央値であるが、平均やモードも用いられ得る)も含む。最低計数率605も示され、汚染されていない散乱の上限値603も示されている。上限値603は、散乱計数率から算出され、この場合、平均計数率604に平均計数率604と最低計数率605との差を足したものである。他の実施形態において、標準計数率用の上限値603を定めるのに、他の基準が用いられてもよい(例えば、平均プラスn標準偏差)。上限値603の外側にあるビン602が示されている。これらビンは、汚染されたビン(すなわち、不純物からの散乱寄与を含む)として特定されている。
If the scatter measurements are in the form of a series of photon arrival times, the scatter measurements can be directly corrected by removing the photon arrival times to reduce the effective scatter intensity at the relevant time point. FIG. 22 is a graph showing the same
各汚染されたビン602について、汚染されたビンの中の計数率を上限値603から引き去ることにより、余剰のカウント数が決定され得る。例えば、そのビンから除去するための記録された光子パルスをランダムに選定することにより、余剰のカウント数に等しい光子の到達イベント数を、各汚染されたビンからその後除去できる。図23は、各ビンの中で強度の上限値603を超えないように制限された、結果的に補正された計数率波形655を示す。
For each contaminated
いくつかの実施形態において、各ビンから除去されるカウント量は、図23において目に見える1ビンあたりのフォトンカウントのハードリミットを回避するように、ある程度のランダム性を持って選定されてもよい。例えば、各ビンの光子の余剰の数と除去されるべき光子の最大数との間の乱数に基づいて、除去されるためのいくつかの光子が選定されてもよい。代替的に又は付加的に、光子の余剰数を超える追加のランダム光子は、各ビンのカウントの広がりの統計量が何らかの品質基準(例えば、ポアソン分布テスト)を満たすまで、反復的に除去されてもよい。 In some embodiments, the amount of counts removed from each bin may be chosen with some degree of randomness to avoid the hard limit of photon counts per bin visible in FIG. . For example, some photons may be selected for removal based on a random number between the excess number of photons in each bin and the maximum number of photons to be removed. Alternatively or additionally, additional random photons beyond the photon surplus are iteratively removed until the count spread statistic for each bin meets some quality criterion (e.g., a Poisson distribution test). good too.
図24は、生の散乱測定値の自己相関関数651と、補正された散乱測定値の自己相関関数652とを示している。補正された自己相関関数は、かなり低いベースラインを有するが、ビニング後に散乱測定値を補正することにより悪影響を受け得る低い減衰時間では情報を維持する。
FIG. 24 shows the
生の自己相関関数651にキュムラント解析を行うことで、結果、報告されるZ平均は451nmとなる。補正された自己相関関数652にキュムラント解析を行うことで、結果、報告されるZ平均は247nmとなる。後者の数字は、Z平均242nmをもたらした、厳密にフィルタされた試料に実行されたキュムラント解析と見事に一致する。
Performing a cumulant analysis on the
光子到達時間を破棄するこの方法は、散乱強度に対するシンプルな上限値よりもっと複雑な基準に基づいて散乱データを補正するように適合できる。例えば、散乱寄与のモデルは、生の計数率タイミングデータから差し引かれてもよい。つまり、例えば、図15の平滑化された計数率511は、生の光子到達時間散乱測定値の各ビンから除去するカウント数を定めるのに用いられ得る。この種の補正により、最初に散乱測定値をビニングすることなく、補正された散乱測定値が生の散乱測定値から直接的に生成できるようになる。
This method of discarding photon arrival times can be adapted to correct scattering data based on more complex criteria than simple upper bounds on scattering intensity. For example, a model of scattering contribution may be subtracted from the raw count rate timing data. Thus, for example, the smoothed
一連の生の光子到達時間は、不純物からの散乱寄与を特定するのに、直接処理されてもよい。ビニング後に高い計数率を特定する代わりに、光子到達時間に対する光子計数の勾配を用いて、散乱測定値の高強度部分を特定してもよい。図25は、水の中で分散した500nmのラテックス球に関する光子到達時間に対する光子数のプロット660を示す。丸で囲まれた領域661は、不純物からの散乱寄与に対応する勾配の変化を示す。このような領域は、計数率波形の局所勾配を全測定値の平均勾配と比較することにより特定されてもよい。
A series of raw photon arrival times may be processed directly to identify scattering contributions from impurities. Instead of identifying high count rates after binning, the slope of photon counts versus photon arrival time may be used to identify high intensity portions of scatter measurements. FIG. 25 shows a
図26は、複数のウィンドウそれぞれについての平均勾配671と算出された勾配670とを示す。ウィンドウは、光子到達の決められた数に基づいて、又は、決まった時間に基づいて、定められてもよい。勾配閾値672を、平均勾配のパーセンテージ(この場合70%)として定める。この結果、5個のウィンドウ673が汚染されていると特定される。
FIG. 26 shows the
この過程は、不純物からの散乱寄与を含まない生の計数率波形の部分を特定するのに用いられてもよい。図示例において、散乱測定値の中央部分(図25において第1及び第2の丸で囲まれた領域661の間)が、汚染されていない散乱測定値の最も長く継続した部分である。この最長の汚染されていない部分は、粒子の特性(例えば、粒径又は粒度分布)を決定する根拠として用いられてもよい。
This process may be used to identify portions of the raw countrate waveform that do not contain scattering contributions from impurities. In the illustrated example, the central portion of the scatter measurement (between the first and second circled
より小さなウィンドウサイズは、不純物からの散乱寄与をより高感度で特定し、より大きなウィンドウサイズは、感度が下がりやすくなる。ウィンドウサイズは、試料の特性に合うように調整してもよい(例えば、散乱測定値の統計的な特性に基づいて)。 Smaller window sizes identify scattering contributions from impurities more sensitively, while larger window sizes tend to be less sensitive. The window size may be adjusted to match sample properties (eg, based on statistical properties of the scattering measurements).
上述したように、計数率の修正は、光信号の減衰(例えば、光学的ドメインで減衰器を用いるもの)に類似していると考えられ得る。図27から図29は、本明細書で記載される方法の特徴が光学的ドメインにて実施される例示的な実施形態を説明する。 As noted above, count rate modification can be thought of as analogous to attenuation of an optical signal (eg, using an attenuator in the optical domain). 27-29 illustrate exemplary embodiments in which features of the methods described herein are implemented in the optical domain.
図27から図29を参照して、可変減衰器105、焦点レンズ107、試料セル104、検出器114、相関器117、及び制御電子機器127を含む、粒子特性評価装置が図示される。
Referring to FIGS. 27-29, a particle characterization system is illustrated, including
図27から図29のそれぞれにおいて、希釈流体中で浮遊する粒子を含む試料106は、試料セル104の中にある。光源(図示なし)からの照射光線103が試料106を照射し、散乱光111が生成される。光線103は、焦点レンズ107(セル内の検出領域を変えるために移動可能であってもよい)によって試料セル104の中で焦点が合わせられる。散乱光111は、焦点レンズ107を通る検出光路を介して検出器114によって受け取られる。検出器114は、アバランシェフォトダイオード又は類似した物など、光子計数検出器であってもよい。検出器114からの出力は、例えば、DLS解析や同様の解析を行うために、相関器に提供される。照射光線と散乱光の両方が同じ焦点レンズを通過することは必須ではない。つまり、検出光路が光線と重なるように導くために、いかなる適切な光学配置を用いてもよい。例えば、幾つかの状況において、光線及び/又は検出器光路は、コリメートされてもよいし、又は、分岐してもよい。
In each of FIGS. 27-29, a
図27の例において、検出器114からの出力は、制御電子機器127に提供される。制御電子機器127は、散乱光の中の不純物の散乱寄与を検出器で検出するように構成される。制御電子機器は、不純物からの散乱寄与を検出するために本明細書で記載される方法のいずれをも具体化し得る。1つの例として、制御電子機器は、ローパスフィルタを含んでもよい。制御電子機器は、不純物からの散乱寄与に比例する制御信号を、照射ビームを減衰することで不純物からの散乱を補償する可変減衰器に提供してもよい。
In the example of FIG. 27, the output from
図28は、ビームスプリッタ128と更なる検出器129とを更に含む、代替の粒子特性評価装置を示す。
この装置では、ビームスプリッタは、散乱光111の一部を更なる検出器129に提供するように配置される。制御電子機器127は、散乱光の中の不純物からの散乱寄与を更なる検出器129で検出するように構成される。ここでもまた、制御電子機器は、不純物からの散乱寄与を検出するために本明細書に記載される方法を具体化し得る。1つの例として、制御電子機器は、ローパスフィルタを含んでもよい。制御電子機器は、不純物からの散乱寄与に比例する制御信号を、検出器114によって受け取られる散乱光を減衰する可変減衰器に提供して、不純物からの散乱を補償してもよい。
FIG. 28 shows an alternative particle characterization apparatus further comprising a
In this device the beam splitter is arranged to provide part of the
図29は、図28の装置(更なる検出器129が制御電子機器に信号を提供するために用いられる)と同様の、更に代替の装置を示すが、ビームスプリッタが省略されている。この実施形態において、更なる検出器129によって検出された散乱光111は、検出器114で最終的に受け取られる散乱光とは異なる方向に散乱する。検出器114と更なる検出器129の散乱角度は、好ましくは実質的に同じであるとよいが、これは必須ではない。更なる検出器129は、異なる散乱角度であってもよい(例えば、前方散乱を検出し、後方散乱検出器114を備える)。
FIG. 29 shows a further alternative arrangement similar to that of FIG. 28 (where an
いずれの実施形態の可変減衰器105も、(例えば、ステッパモータや圧電トランスデューサを含む)並進ステージ上に搭載される可変NDフィルタを含んでもよい。あるいは、減衰量は、システム内の光の偏光を使って変えられてもよい(少なくともある程度まで、照射光線は偏光され、散乱光はこの偏光を維持してもよい)。これらの原則に基づく可変減衰器は、調整可能なクロス偏光子、単偏光子及びポッケルスセル、ファラデー回転子、固定されたファイバ偏光子、可変波長板、及び/又は液晶素子の組み合わせを含んでもよい。
これら方法それぞれは、それ独自の関連応答時間を有するが、計数率の低速変動の典型的な時間的尺度は、これら方法それぞれの範囲内にあるであろう。一方、光電工学的方法は、計数率のスパイクに応答するためにより高い能力を有するであろう。 Each of these methods has its own associated response time, but typical time scales for slow variations in count rate will be within the range of each of these methods. Optoelectronic methods, on the other hand, will have a higher ability to respond to count rate spikes.
多くの商業用実験機器が「ブラックボックス」として扱われる一方で、粒子特性評価技術(DLSなど)の使用者は、それらの試料の品質と所定の解析方法へのその適性に関する明瞭且つ関連する情報から恩恵を受けるであろう。よって、本明細書に記載される方法は、不純物による散乱寄与について使用者に情報を提供するのに用いられ得るだろう。例えば、生の光子計数率と修正されたバージョンは、使用者に提供され得るだろう(例えば、図16のように)。同様に、例えば、DLSの生の自己相関関数と補正された自己相関関数(例えば図24のように)とELSとMLSのフェーズプロット又は周波数プロット、及び、データの処理で用いられる波形(例えば、図19のスペクトルや図26の窓付き勾配)の提供など、他の関連するどの様なデータセットも、処理前後に示され得る。 While many commercial laboratory instruments are treated as "black boxes", users of particle characterization techniques (such as DLS) have access to clear and relevant information about the quality of their samples and their suitability for a given analytical method. will benefit from Thus, the methods described herein could be used to inform a user about the scattering contribution by impurities. For example, the raw photon count rate and a modified version could be provided to the user (eg, as in FIG. 16). Similarly, for example, DLS raw and corrected autocorrelation functions (eg, as in FIG. 24) and ELS and MLS phase plots or frequency plots, and waveforms used in processing the data (eg, Any other relevant data set can be shown before and after processing, such as providing the spectrum in FIG. 19 or the windowed gradient in FIG.
これら方法の結果(又は理想信号)と生の初期信号との比較もまた、純粋に質に関する測定値というよりむしろ試料の適性の定量的測定値を与えるのに用いられ得る。例えば、スパイク又は低速変動を含む生の計数率と平均計数率での直線との間の剰余の合計は、安定した計数率に関して算出されるそれよりもっと大きいであろう。 Comparison of the results (or ideal signals) of these methods with the raw initial signal can also be used to give a quantitative measure of the suitability of the sample rather than a purely quality measure. For example, the sum of the remainders between the raw count rate containing spikes or slow fluctuations and the straight line at the average count rate will be much larger than that calculated for the steady count rate.
これらパラメータは、単に使用者に報告される基準として、又は、測定値の質を特性評価するためにニューラルネットワーク内の追加のパラメータとして、用いられてもよい。
本明細書で詳細に記載されるこれら例は、動的光散乱測定の状況に焦点を置く傾向があったが、同様の概念が他の種類の光散乱測定にも直接準用され得ることが理解されるだろう。例えば、本明細書に記載される測定結果は強度に基づくが、幾つかの実施形態においては、光散乱測定は、変調基準(又は散乱)ビームを用いるヘテロダイン検波に基づいてもよい。その場合、変調された検出信号の包絡線の振幅が測定パラメータであってもよく(散乱光の強度ではなく)、本明細書に記載される方法は、適宜修正されてもよい。同様に、本明細書に記載される方法は、ゼータ電位測定への不純物の影響を低減するために、PALS(位相角光散乱)を処理するように簡単に適合できる。
These parameters may be used simply as criteria reported to the user or as additional parameters within the neural network to characterize the quality of the measurements.
Although the examples detailed herein tended to focus on the context of dynamic light scattering measurements, it is understood that similar concepts can be directly applied mutatis mutandis to other types of light scattering measurements. will be For example, although the measurements described herein are based on intensity, in some embodiments light scattering measurements may be based on heterodyne detection using a modulated reference (or scattered) beam. In that case, the amplitude of the envelope of the modulated detection signal may be the measured parameter (rather than the intensity of the scattered light), and the methods described herein may be modified accordingly. Similarly, the methods described herein can be easily adapted to process PALS (Phase Angle Light Scattering) to reduce the influence of impurities on zeta potential measurements.
特定の例が記載されているが、これらは限定を意図するものではなく、当業者であれば、添付の請求項によって定められるように、本発明の範囲内で他の変形も可能であることを理解するであろう。 Although specific examples have been described, these are not intended to be limiting, and those skilled in the art will appreciate that other variations are possible within the scope of the invention as defined by the appended claims. will understand.
Claims (5)
照射光線と試料との相互作用によって生成される散乱光の測定値の時系列を含む散乱測定値を検出器から取得することであって、前記時系列は光子到達時間の個別のビンを含み、各ビンは時間に対応し、各ビンでの光子到達時間のカウントは、対応する時間での強度を示す、取得することと、
散乱測定の少なくともいくつかのビンの中で散乱強度を低減することにより、不純物からの散乱寄与を補償することを含み、補正された散乱測定値を生成することと、
前記補正された散乱測定値から粒子特性を決定することと、
を含み、
前記散乱強度を低減することは、前記散乱測定値をハイパスフィルタリングすることを含む、方法。 A method of characterizing particles in a sample, comprising:
obtaining from a detector scatter measurements comprising a time series of measurements of scattered light produced by the interaction of the illuminating beam with the sample, the time series comprising discrete bins of photon arrival times; obtaining each bin corresponds to time, and the count of photon arrival times at each bin indicates the intensity at the corresponding time;
generating corrected scatter measurements comprising compensating for scattering contributions from impurities by reducing the scatter intensity in at least some bins of the scatter measurements;
determining particle properties from the corrected scattering measurements;
including
The method , wherein reducing the scatter intensity includes high-pass filtering the scatter measurements .
請求項1又は2に記載の方法。 reducing the scattering intensity includes determining a cutoff frequency for the high-pass filtering from the scattering measurements;
3. A method according to claim 1 or 2 .
請求項3に記載方法。 determining the cutoff frequency includes finding statistical outliers within the spectral content of the scatter measurements;
4. The method of claim 3 .
光源と、
試料セルと、
検出器と、
プロセッサと、を含み、
前記光源は、前記試料セル内の試料に光線を照射して、前記光線と前記試料との相互作用により散乱光を生成するように動作可能であり、
前記検出器は、前記散乱光を検出して、測定値の時系列を生成するように構成され、
前記プロセッサは、
前記検出器からの前記散乱光の測定値の時系列を含む散乱測定値を取得し、前記時系列は光子到達時間の個別のビンを含み、各ビンは時間に対応し、各ビンでの光子到達時間のカウントは、対応する時間での強度を示し、
散乱測定の少なくともいくつかのビンの中で散乱強度を低減することにより不純物からの散乱寄与を補償することを含み、補正された散乱測定値を生成し、
前記補正された散乱測定値から粒子特性を決定するように構成され、
前記散乱強度を低減することは、前記散乱測定値をハイパスフィルタリングすることを含む、
装置。 An apparatus for characterizing particles, comprising:
a light source;
a sample cell;
a detector;
a processor;
the light source is operable to illuminate a sample in the sample cell with a beam of light and produce scattered light from interaction of the beam of light with the sample;
the detector is configured to detect the scattered light to produce a time series of measurements;
The processor
obtaining a scatter measurement comprising a time series of measurements of the scattered light from the detector, the time series comprising separate bins of photon arrival times, each bin corresponding to time, photons at each bin The arrival time count indicates the intensity at the corresponding time,
generating a corrected scatter measurement comprising compensating for the scatter contribution from impurities by reducing the scatter intensity in at least some bins of the scatter measurement;
configured to determine a particle property from the corrected scattering measurements ;
reducing the scattering intensity includes high-pass filtering the scattering measurements;
Device.
Applications Claiming Priority (3)
| Application Number | Priority Date | Filing Date | Title |
|---|---|---|---|
| EP17162676.5 | 2017-03-23 | ||
| EP17162676.5A EP3379232A1 (en) | 2017-03-23 | 2017-03-23 | Particle characterisation |
| PCT/EP2018/057033 WO2018172362A1 (en) | 2017-03-23 | 2018-03-20 | Particle characterisation |
Publications (3)
| Publication Number | Publication Date |
|---|---|
| JP2020514762A JP2020514762A (en) | 2020-05-21 |
| JP2020514762A5 JP2020514762A5 (en) | 2021-04-30 |
| JP7281409B2 true JP7281409B2 (en) | 2023-05-25 |
Family
ID=58412957
Family Applications (1)
| Application Number | Title | Priority Date | Filing Date |
|---|---|---|---|
| JP2019552113A Active JP7281409B2 (en) | 2017-03-23 | 2018-03-20 | Particle characterization |
Country Status (5)
| Country | Link |
|---|---|
| US (3) | US11199486B2 (en) |
| EP (2) | EP3379232A1 (en) |
| JP (1) | JP7281409B2 (en) |
| CN (1) | CN110431398B (en) |
| WO (1) | WO2018172362A1 (en) |
Families Citing this family (12)
| Publication number | Priority date | Publication date | Assignee | Title |
|---|---|---|---|---|
| EP4215900A1 (en) | 2015-09-23 | 2023-07-26 | Malvern Panalytical Limited | Particle characterisation |
| US11002655B2 (en) | 2015-09-23 | 2021-05-11 | Malvern Panalytical Limited | Cuvette carrier |
| GB201604460D0 (en) | 2016-03-16 | 2016-04-27 | Malvern Instr Ltd | Dynamic light scattering |
| EP3379232A1 (en) | 2017-03-23 | 2018-09-26 | Malvern Panalytical Limited | Particle characterisation |
| EP3739321B1 (en) * | 2019-05-17 | 2023-03-08 | Xtal Concepts GmbH | Qualification method for cryoelectron microscopy samples and corresponding sample holder |
| EP3922977B1 (en) * | 2020-06-08 | 2024-08-07 | Universität für Bodenkultur Wien | Method for determining a property of a particle in a medium |
| JP7473200B2 (en) | 2020-11-12 | 2024-04-23 | 国立研究開発法人物質・材料研究機構 | Dynamic light scattering measurement device, dynamic light scattering measurement/analysis method, and measurement/analysis program |
| JP7504460B2 (en) | 2021-01-07 | 2024-06-24 | 国立研究開発法人物質・材料研究機構 | Dynamic light scattering measurement device, dynamic light scattering measurement/analysis method, and measurement/analysis program |
| KR102544474B1 (en) * | 2021-10-19 | 2023-06-20 | 관악아날로그 주식회사 | Dust sensor |
| JP7452583B2 (en) * | 2022-07-22 | 2024-03-19 | 栗田工業株式会社 | Method for determining agglomeration state and agglomeration treatment method |
| JP7363984B1 (en) * | 2022-07-22 | 2023-10-18 | 栗田工業株式会社 | Method for determining agglomeration state and agglomeration treatment method |
| GB202302879D0 (en) * | 2023-02-27 | 2023-04-12 | Malvern Panalytical Ltd | Particle characterisation |
Citations (2)
| Publication number | Priority date | Publication date | Assignee | Title |
|---|---|---|---|---|
| JP2007527997A (en) | 2004-03-06 | 2007-10-04 | マイケル トレイナー, | Method and apparatus for determining particle size and shape |
| JP2011059048A (en) | 2009-09-14 | 2011-03-24 | Hokuto Denshi Kogyo Kk | Method and device for detecting size of particles in liquid |
Family Cites Families (88)
| Publication number | Priority date | Publication date | Assignee | Title |
|---|---|---|---|---|
| US3621220A (en) | 1969-08-29 | 1971-11-16 | Norman C Ford Jr | Scattered light measurement providing autocorrelation function |
| US4074939A (en) | 1973-12-19 | 1978-02-21 | Max-Planck-Gesellschaft Zur Foerderung Der Wissenschaften E.V. | Apparatus for investigating fast chemical reactions by optical detection |
| US4473296A (en) | 1978-05-03 | 1984-09-25 | Ppm, Inc. | System and method and apparatus for a continuous aerosol monitor (CAM) using electro-optical weighing for general aerosols |
| US4178917A (en) | 1979-01-03 | 1979-12-18 | Shapiro Howard M | Method and system for non-invasive detection of zinc protoporphyrin in erythrocytes |
| US4710025A (en) | 1982-06-22 | 1987-12-01 | Wyatt Technology Company | Process for characterizing suspensions of small particles |
| US4537861A (en) | 1983-02-03 | 1985-08-27 | Elings Virgil B | Apparatus and method for homogeneous immunoassay |
| US4690561A (en) | 1985-01-18 | 1987-09-01 | Canon Kabushiki Kaisha | Particle analyzing apparatus |
| US4676641A (en) | 1986-01-08 | 1987-06-30 | Coulter Electronics Of New England, Inc. | System for measuring the size distribution of particles dispersed in a fluid |
| US4781460A (en) * | 1986-01-08 | 1988-11-01 | Coulter Electronics Of New England, Inc. | System for measuring the size distribution of particles dispersed in a fluid |
| US5166052A (en) | 1986-05-27 | 1992-11-24 | Boris Cercek | Method for measuring polarization of bathochromically shifted fluorescence |
| GB8705844D0 (en) | 1987-03-12 | 1987-04-15 | Secr Defence | Dynamic light scattering apparatus |
| DE68924749T2 (en) * | 1988-09-15 | 1996-07-04 | The Board Of Trustees Of The University Of Arkansas, Little Rock, Ark. | Identification of particles by modulated dynamic light scattering. |
| JPH02228069A (en) | 1989-02-28 | 1990-09-11 | Omron Tateisi Electron Co | Photodetector array |
| JPH05172730A (en) | 1991-12-25 | 1993-07-09 | Shimadzu Corp | Measurement of particle-size distribution |
| JP3294668B2 (en) * | 1993-04-30 | 2002-06-24 | 花王株式会社 | Method and apparatus for detecting particle size of particle group |
| US5576827A (en) | 1994-04-15 | 1996-11-19 | Micromeritics Instrument Corporation | Apparatus and method for determining the size distribution of particles by light scattering |
| FI98765C (en) | 1995-01-16 | 1997-08-11 | Erkki Soini | Flow cytometric method and apparatus |
| US6052184A (en) * | 1996-11-13 | 2000-04-18 | The Administrators Of The Tulane Educational Fund | Miniature, submersible, versatile, light scattering probe for absolute equilibrium and non-equilibrium characterization of macromolecular and colloidal solutions |
| DE19725211C1 (en) | 1997-06-15 | 1998-06-04 | Alv Laser Vertriebsgesellschaf | Optical fibre detector for liquid suspension concentration measurement |
| US5956139A (en) | 1997-08-04 | 1999-09-21 | Ohio Aerospace Institute | Cross-correlation method and apparatus for suppressing the effects of multiple scattering |
| US6016193A (en) | 1998-06-23 | 2000-01-18 | Awareness Technology, Inc. | Cuvette holder for coagulation assay test |
| US6100976A (en) | 1998-09-21 | 2000-08-08 | The Board Of Regents For Oklahoma State University | Method and apparatus for fiber optic multiple scattering suppression |
| US6509161B1 (en) | 2000-02-29 | 2003-01-21 | Gentronix Limited | Green fluorescent protein |
| US6603546B1 (en) | 2000-07-21 | 2003-08-05 | I.S.S. (Usa) Inc. | Rapid high throughput spectrometer and method |
| JP2002196222A (en) | 2000-12-25 | 2002-07-12 | Nikon Corp | Plane position detector and aligner |
| JP2002341173A (en) | 2001-05-15 | 2002-11-27 | Namiki Precision Jewel Co Ltd | Optical fiber array with microlens and method of manufacturing for the same |
| EP1291642A1 (en) | 2001-09-05 | 2003-03-12 | Linde Medical Sensors AG | Sensor system comprising an integrated optical waveguide for the detection of chemical substances |
| GB0122219D0 (en) | 2001-09-13 | 2001-11-07 | Gentronix Ltd | Toxicity monitoring |
| US6794671B2 (en) * | 2002-07-17 | 2004-09-21 | Particle Sizing Systems, Inc. | Sensors and methods for high-sensitivity optical particle counting and sizing |
| JP3720799B2 (en) * | 2002-10-02 | 2005-11-30 | 神栄株式会社 | Pollen sensor |
| CN1502981A (en) | 2002-11-20 | 2004-06-09 | 上海理工大学 | Granule measurement method and device based on dynamic light scuttering signal parting |
| US7138091B2 (en) | 2003-07-18 | 2006-11-21 | Dade Behring Inc. | Reaction cuvette having anti-wicking features for use in an automatic clinical analyzer |
| ZA200704831B (en) | 2003-08-14 | 2009-08-26 | Cytonome Inc | Optical detector for a particle sorting system |
| US7268881B2 (en) | 2004-02-17 | 2007-09-11 | The Curators Of The University Of Missouri | Light scattering detector |
| US20070242269A1 (en) * | 2004-03-06 | 2007-10-18 | Michael Trainer | Methods and apparatus for determining characteristics of particles |
| US20140226158A1 (en) | 2004-03-06 | 2014-08-14 | Michael Trainer | Methods and apparatus for determining particle characteristics |
| US9297737B2 (en) * | 2004-03-06 | 2016-03-29 | Michael Trainer | Methods and apparatus for determining characteristics of particles |
| WO2005099408A2 (en) * | 2004-04-10 | 2005-10-27 | Michael Trainer | Methods and apparatus for determining particle characterics by measuring scattered light |
| US10386283B2 (en) | 2004-03-06 | 2019-08-20 | Michael Trainer | Methods and apparatus for determining particle characteristics by utilizing force on particles |
| US20080221814A1 (en) | 2004-04-10 | 2008-09-11 | Michael Trainer | Methods and apparatus for determining particle characteristics by measuring scattered light |
| US10955327B2 (en) | 2004-03-06 | 2021-03-23 | Michael Trainer | Method and apparatus for determining particle characteristics utilizing a plurality of beam splitting functions and correction of scattered light |
| US10620105B2 (en) * | 2004-03-06 | 2020-04-14 | Michael Trainer | Methods and apparatus for determining characteristics of particles from scattered light |
| JP4517145B2 (en) * | 2004-09-02 | 2010-08-04 | 国立大学法人北海道大学 | Light scattering device, light scattering measurement method, light scattering analysis device, and light scattering measurement analysis method |
| ITMI20050964A1 (en) | 2005-05-25 | 2006-11-26 | Tenax Spa | PARTICULARLY PACKAGING FOR FRUIT AND VEGETABLE FOOD PRODUCTS IN GENRE REALIZABLE WITH AUTOMATIC PACKAGING MACHINES |
| US20070229823A1 (en) | 2006-03-31 | 2007-10-04 | Intel Corporation | Determination of the number concentration and particle size distribution of nanoparticles using dark-field microscopy |
| WO2007126389A1 (en) | 2006-05-02 | 2007-11-08 | Asensor Pte Ltd | Optical detector system for sample analysis having at least two different optical pathlengths |
| JP2008039539A (en) | 2006-08-04 | 2008-02-21 | Shimadzu Corp | Light scattering detector |
| EP1906252A1 (en) | 2006-09-28 | 2008-04-02 | Carl Zeiss SMT AG | Instrument for measuring the angular distribution of light produced by an illumination system of a microlithographic projection exposure apparatus |
| US8877458B2 (en) | 2007-02-02 | 2014-11-04 | Canadian Blood Services | Method of detecting bacterial contamination using dynamic light scattering |
| CA2699523A1 (en) | 2007-09-13 | 2009-03-19 | Duke University | Apparatuses, systems, and methods for low-coherence interferometry (lci) |
| CN101477023A (en) | 2008-01-02 | 2009-07-08 | 杨晖 | Ultrafine grain measuring apparatus and method based on dynamic light scattering signal time coherence |
| WO2009090562A2 (en) | 2008-01-15 | 2009-07-23 | Malvern Instruments Ltd | Light scattering measurements using simultaneous detection |
| CN102037343B (en) | 2008-06-12 | 2013-10-02 | 东卡莱罗纳大学 | Flow cytometer apparatus for three dimensional diffraction imaging and related methods |
| JP5172730B2 (en) | 2009-02-05 | 2013-03-27 | 株式会社ジェイアール西日本ビルト | Exterior material mounting member, exterior structure, and construction method thereof |
| US8493559B2 (en) | 2009-03-17 | 2013-07-23 | Trevor Harvard | Cuvette |
| DE102009014080B4 (en) | 2009-03-23 | 2011-12-15 | Baumer Innotec Ag | Device for determining particle sizes |
| CN102428377B (en) * | 2009-05-12 | 2015-08-12 | 赛默飞世尔科技有限公司 | The calibration of particle detection and sensor |
| DE102010005962B4 (en) * | 2010-01-21 | 2012-01-26 | Alv-Laser Vertriebsgesellschaft Mbh | Method for determining the static and / or dynamic light scattering |
| EP2365313B1 (en) | 2010-03-12 | 2015-08-26 | LS Instruments AG | Cross-correlation dynamic light scattering (DLS) method and system |
| US8717562B2 (en) * | 2010-08-23 | 2014-05-06 | Scattering Solutions, Inc. | Dynamic and depolarized dynamic light scattering colloid analyzer |
| JP5662742B2 (en) | 2010-08-27 | 2015-02-04 | アイステーシス株式会社 | Particle size measuring apparatus and particle size measuring method |
| US8729502B1 (en) | 2010-10-28 | 2014-05-20 | The Research Foundation For The State University Of New York | Simultaneous, single-detector fluorescence detection of multiple analytes with frequency-specific lock-in detection |
| US9164042B2 (en) * | 2011-02-10 | 2015-10-20 | Hitachi High-Technologies Corporation | Device for detecting foreign matter and method for detecting foreign matter |
| US10359361B2 (en) | 2011-02-18 | 2019-07-23 | The General Hospital Corporation | Laser speckle micro-rheology in characterization of biomechanical properties of tissues |
| CN202275041U (en) | 2011-03-17 | 2012-06-13 | 上海理工大学 | Device for simultaneously measuring dynamic light scattering nano particle sizes of particles |
| CN103608671B (en) | 2011-06-15 | 2016-05-18 | 马尔文仪器有限公司 | Surface charge measurement |
| GB2493391B (en) | 2011-08-05 | 2015-09-16 | Malvern Instr Ltd | Optical detection and analysis of particles |
| CN202453283U (en) | 2011-12-27 | 2012-09-26 | 江西科技师范学院 | Cuvette support frame |
| JP5442052B2 (en) | 2012-02-16 | 2014-03-12 | 株式会社堀場製作所 | Particle analyzer |
| RU2015101834A (en) | 2012-06-22 | 2016-08-10 | Малверн Инструментс Лимитед | DETERMINATION OF CHARACTERISTICS OF HETEROGENEOUS FLUID SAMPLES |
| EP2698624A1 (en) | 2012-08-16 | 2014-02-19 | Siemens Healthcare Diagnostics Products GmbH | Reaction container |
| US8854621B1 (en) * | 2012-08-29 | 2014-10-07 | University Of South Florida | Systems and methods for determining nanoparticle dimensions |
| RU2525605C2 (en) | 2012-10-26 | 2014-08-20 | Вячеслав Геннадьевич Певгов | Method and apparatus for optical measurement of distribution of size and concentration of dispersed particles in liquids and gases using single-element and matrix laser radiation photodetectors |
| EP2869054A1 (en) | 2013-11-05 | 2015-05-06 | Malvern Instruments Limited | Improvements relating to particle characterisation |
| JP6691043B2 (en) | 2013-11-05 | 2020-04-28 | マルバーン インストゥルメンツ リミテッド | Particle characterization device |
| GB201516851D0 (en) | 2015-09-23 | 2015-11-04 | Malvern Instr Ltd | Cuvette carrier |
| EP4215900A1 (en) | 2015-09-23 | 2023-07-26 | Malvern Panalytical Limited | Particle characterisation |
| US11002655B2 (en) | 2015-09-23 | 2021-05-11 | Malvern Panalytical Limited | Cuvette carrier |
| CN108291863B (en) | 2015-10-02 | 2020-07-03 | 国家光学研究所 | System and method for individual particle size measurement using light scattering techniques |
| US10119910B2 (en) | 2015-10-09 | 2018-11-06 | Malvern Panalytical Limited | Particle characterisation instrument |
| FR3048240B1 (en) | 2016-02-29 | 2018-04-13 | Cordouan Tech | DEVICE FOR CHARACTERIZING PARTICLES DISPERSE IN A LIQUID MEDIUM |
| GB201604460D0 (en) | 2016-03-16 | 2016-04-27 | Malvern Instr Ltd | Dynamic light scattering |
| US10365198B2 (en) | 2016-04-21 | 2019-07-30 | Malvern Panalytical Limited | Particle characterization |
| US10113945B2 (en) | 2016-05-10 | 2018-10-30 | Microtrac Inc. | Method and apparatus for combining measurements of particle characteristics using light scattering and optical imaging |
| EP3309536A1 (en) | 2016-10-11 | 2018-04-18 | Malvern Panalytical Limited | Particle characterisation instrument |
| DE102017001439A1 (en) | 2017-02-15 | 2018-08-16 | Paragon Ag | Particle measuring device for determining the particle mass concentration in aerosols with different properties and method for determining the particle mass concentration in aerosols with different properties |
| EP3379232A1 (en) | 2017-03-23 | 2018-09-26 | Malvern Panalytical Limited | Particle characterisation |
| FR3090874B1 (en) | 2018-12-21 | 2022-05-27 | Commissariat Energie Atomique | Optical particle detector |
-
2017
- 2017-03-23 EP EP17162676.5A patent/EP3379232A1/en not_active Withdrawn
-
2018
- 2018-03-20 EP EP18710904.6A patent/EP3602001A1/en active Pending
- 2018-03-20 JP JP2019552113A patent/JP7281409B2/en active Active
- 2018-03-20 CN CN201880018559.3A patent/CN110431398B/en active Active
- 2018-03-20 US US16/496,027 patent/US11199486B2/en active Active
- 2018-03-20 WO PCT/EP2018/057033 patent/WO2018172362A1/en unknown
-
2021
- 2021-11-19 US US17/531,021 patent/US11906412B2/en active Active
-
2023
- 2023-10-20 US US18/491,034 patent/US20240192108A1/en active Pending
Patent Citations (2)
| Publication number | Priority date | Publication date | Assignee | Title |
|---|---|---|---|---|
| JP2007527997A (en) | 2004-03-06 | 2007-10-04 | マイケル トレイナー, | Method and apparatus for determining particle size and shape |
| JP2011059048A (en) | 2009-09-14 | 2011-03-24 | Hokuto Denshi Kogyo Kk | Method and device for detecting size of particles in liquid |
Non-Patent Citations (1)
| Title |
|---|
| Xinjun Zhu,Analysis of noisy dynamic light scattering data using constrained regularization techniques,APPLIED OPTICS,Optical Society of America,2012年11月01日,Vol. 51, No. 31,pp.7537-7548,https://doi.org/10.1364/AO.51.007537 |
Also Published As
| Publication number | Publication date |
|---|---|
| JP2020514762A (en) | 2020-05-21 |
| US11906412B2 (en) | 2024-02-20 |
| US20220326128A1 (en) | 2022-10-13 |
| US20200033245A1 (en) | 2020-01-30 |
| WO2018172362A1 (en) | 2018-09-27 |
| US20240192108A1 (en) | 2024-06-13 |
| EP3602001A1 (en) | 2020-02-05 |
| CN110431398B (en) | 2023-03-21 |
| US11199486B2 (en) | 2021-12-14 |
| EP3379232A1 (en) | 2018-09-26 |
| CN110431398A (en) | 2019-11-08 |
Similar Documents
| Publication | Publication Date | Title |
|---|---|---|
| JP7281409B2 (en) | Particle characterization | |
| JP7361079B2 (en) | Particle characterization | |
| JP3328032B2 (en) | Particle analyzer | |
| JP2020514762A5 (en) | ||
| EP3152566A1 (en) | Nanoparticle analyzer | |
| US7362421B2 (en) | Analysis of signal oscillation patterns | |
| JP4132692B2 (en) | Particle size distribution measuring device | |
| FR2740561A1 (en) | METHOD FOR EVALUATING THE INTENSITY VARIATION OF A POLYCHROMATIC RADIATION HAVING A KNOWN FREQUENCY SPECTRUM, AFTER CROSSING AN ABSORBENT BODY | |
| EP2542869B1 (en) | Method of locating and removing spike noise from spectral data | |
| Machnio et al. | Reconstruction enhancement via projection screening in holographic tomography | |
| EP1058128B1 (en) | Method and device for discriminating pulses from semi-conductor radiation-detectors | |
| KR101437410B1 (en) | Solar absorption fourier transform spectrometer apparatus and method for processing spectrum thereof | |
| US20230393117A1 (en) | Biological information measurement device, biological information measurement method, and computer-readable recording medium | |
| Gu et al. | Information entropy characteristic of the light scattering signal amplitude distribution of aerosols | |
| FR2986397A1 (en) | Device for determining e.g. dose rate of electron beam emitted by electron accelerator of sterilization system for sterilizing object, has processing unit whose reconstruction unit reconstructs penetration curve for predefined energy beam |
Legal Events
| Date | Code | Title | Description |
|---|---|---|---|
| A521 | Request for written amendment filed |
Free format text: JAPANESE INTERMEDIATE CODE: A523 Effective date: 20210312 |
|
| A621 | Written request for application examination |
Free format text: JAPANESE INTERMEDIATE CODE: A621 Effective date: 20210312 |
|
| A977 | Report on retrieval |
Free format text: JAPANESE INTERMEDIATE CODE: A971007 Effective date: 20211215 |
|
| A131 | Notification of reasons for refusal |
Free format text: JAPANESE INTERMEDIATE CODE: A131 Effective date: 20220125 |
|
| A601 | Written request for extension of time |
Free format text: JAPANESE INTERMEDIATE CODE: A601 Effective date: 20220425 |
|
| A521 | Request for written amendment filed |
Free format text: JAPANESE INTERMEDIATE CODE: A523 Effective date: 20220627 |
|
| A02 | Decision of refusal |
Free format text: JAPANESE INTERMEDIATE CODE: A02 Effective date: 20221108 |
|
| A521 | Request for written amendment filed |
Free format text: JAPANESE INTERMEDIATE CODE: A523 Effective date: 20230308 |
|
| C60 | Trial request (containing other claim documents, opposition documents) |
Free format text: JAPANESE INTERMEDIATE CODE: C60 Effective date: 20230308 |
|
| A911 | Transfer to examiner for re-examination before appeal (zenchi) |
Free format text: JAPANESE INTERMEDIATE CODE: A911 Effective date: 20230320 |
|
| C21 | Notice of transfer of a case for reconsideration by examiners before appeal proceedings |
Free format text: JAPANESE INTERMEDIATE CODE: C21 Effective date: 20230322 |
|
| TRDD | Decision of grant or rejection written | ||
| A01 | Written decision to grant a patent or to grant a registration (utility model) |
Free format text: JAPANESE INTERMEDIATE CODE: A01 Effective date: 20230418 |
|
| A61 | First payment of annual fees (during grant procedure) |
Free format text: JAPANESE INTERMEDIATE CODE: A61 Effective date: 20230515 |
|
| R150 | Certificate of patent or registration of utility model |
Ref document number: 7281409 Country of ref document: JP Free format text: JAPANESE INTERMEDIATE CODE: R150 |