JP7204192B2 - Systems and methods for preventing, reducing, and/or treating dementia - Google Patents
Systems and methods for preventing, reducing, and/or treating dementia Download PDFInfo
- Publication number
- JP7204192B2 JP7204192B2 JP2018525754A JP2018525754A JP7204192B2 JP 7204192 B2 JP7204192 B2 JP 7204192B2 JP 2018525754 A JP2018525754 A JP 2018525754A JP 2018525754 A JP2018525754 A JP 2018525754A JP 7204192 B2 JP7204192 B2 JP 7204192B2
- Authority
- JP
- Japan
- Prior art keywords
- subject
- mice
- stimulation
- stimulus
- visual
- Prior art date
- Legal status (The legal status is an assumption and is not a legal conclusion. Google has not performed a legal analysis and makes no representation as to the accuracy of the status listed.)
- Active
Links
Images


Classifications
-
- A—HUMAN NECESSITIES
- A61—MEDICAL OR VETERINARY SCIENCE; HYGIENE
- A61M—DEVICES FOR INTRODUCING MEDIA INTO, OR ONTO, THE BODY; DEVICES FOR TRANSDUCING BODY MEDIA OR FOR TAKING MEDIA FROM THE BODY; DEVICES FOR PRODUCING OR ENDING SLEEP OR STUPOR
- A61M21/00—Other devices or methods to cause a change in the state of consciousness; Devices for producing or ending sleep by mechanical, optical, or acoustical means, e.g. for hypnosis
-
- A—HUMAN NECESSITIES
- A61—MEDICAL OR VETERINARY SCIENCE; HYGIENE
- A61H—PHYSICAL THERAPY APPARATUS, e.g. DEVICES FOR LOCATING OR STIMULATING REFLEX POINTS IN THE BODY; ARTIFICIAL RESPIRATION; MASSAGE; BATHING DEVICES FOR SPECIAL THERAPEUTIC OR HYGIENIC PURPOSES OR SPECIFIC PARTS OF THE BODY
- A61H23/00—Percussion or vibration massage, e.g. using supersonic vibration; Suction-vibration massage; Massage with moving diaphragms
- A61H23/02—Percussion or vibration massage, e.g. using supersonic vibration; Suction-vibration massage; Massage with moving diaphragms with electric or magnetic drive
-
- A—HUMAN NECESSITIES
- A61—MEDICAL OR VETERINARY SCIENCE; HYGIENE
- A61N—ELECTROTHERAPY; MAGNETOTHERAPY; RADIATION THERAPY; ULTRASOUND THERAPY
- A61N5/00—Radiation therapy
- A61N5/06—Radiation therapy using light
- A61N5/0613—Apparatus adapted for a specific treatment
- A61N5/062—Photodynamic therapy, i.e. excitation of an agent
-
- A—HUMAN NECESSITIES
- A61—MEDICAL OR VETERINARY SCIENCE; HYGIENE
- A61N—ELECTROTHERAPY; MAGNETOTHERAPY; RADIATION THERAPY; ULTRASOUND THERAPY
- A61N5/00—Radiation therapy
- A61N5/06—Radiation therapy using light
- A61N5/0613—Apparatus adapted for a specific treatment
- A61N5/0622—Optical stimulation for exciting neural tissue
-
- A—HUMAN NECESSITIES
- A61—MEDICAL OR VETERINARY SCIENCE; HYGIENE
- A61M—DEVICES FOR INTRODUCING MEDIA INTO, OR ONTO, THE BODY; DEVICES FOR TRANSDUCING BODY MEDIA OR FOR TAKING MEDIA FROM THE BODY; DEVICES FOR PRODUCING OR ENDING SLEEP OR STUPOR
- A61M21/00—Other devices or methods to cause a change in the state of consciousness; Devices for producing or ending sleep by mechanical, optical, or acoustical means, e.g. for hypnosis
- A61M2021/0005—Other devices or methods to cause a change in the state of consciousness; Devices for producing or ending sleep by mechanical, optical, or acoustical means, e.g. for hypnosis by the use of a particular sense, or stimulus
- A61M2021/0022—Other devices or methods to cause a change in the state of consciousness; Devices for producing or ending sleep by mechanical, optical, or acoustical means, e.g. for hypnosis by the use of a particular sense, or stimulus by the tactile sense, e.g. vibrations
-
- A—HUMAN NECESSITIES
- A61—MEDICAL OR VETERINARY SCIENCE; HYGIENE
- A61M—DEVICES FOR INTRODUCING MEDIA INTO, OR ONTO, THE BODY; DEVICES FOR TRANSDUCING BODY MEDIA OR FOR TAKING MEDIA FROM THE BODY; DEVICES FOR PRODUCING OR ENDING SLEEP OR STUPOR
- A61M21/00—Other devices or methods to cause a change in the state of consciousness; Devices for producing or ending sleep by mechanical, optical, or acoustical means, e.g. for hypnosis
- A61M2021/0005—Other devices or methods to cause a change in the state of consciousness; Devices for producing or ending sleep by mechanical, optical, or acoustical means, e.g. for hypnosis by the use of a particular sense, or stimulus
- A61M2021/0027—Other devices or methods to cause a change in the state of consciousness; Devices for producing or ending sleep by mechanical, optical, or acoustical means, e.g. for hypnosis by the use of a particular sense, or stimulus by the hearing sense
-
- A—HUMAN NECESSITIES
- A61—MEDICAL OR VETERINARY SCIENCE; HYGIENE
- A61M—DEVICES FOR INTRODUCING MEDIA INTO, OR ONTO, THE BODY; DEVICES FOR TRANSDUCING BODY MEDIA OR FOR TAKING MEDIA FROM THE BODY; DEVICES FOR PRODUCING OR ENDING SLEEP OR STUPOR
- A61M21/00—Other devices or methods to cause a change in the state of consciousness; Devices for producing or ending sleep by mechanical, optical, or acoustical means, e.g. for hypnosis
- A61M2021/0005—Other devices or methods to cause a change in the state of consciousness; Devices for producing or ending sleep by mechanical, optical, or acoustical means, e.g. for hypnosis by the use of a particular sense, or stimulus
- A61M2021/0044—Other devices or methods to cause a change in the state of consciousness; Devices for producing or ending sleep by mechanical, optical, or acoustical means, e.g. for hypnosis by the use of a particular sense, or stimulus by the sight sense
-
- A—HUMAN NECESSITIES
- A61—MEDICAL OR VETERINARY SCIENCE; HYGIENE
- A61M—DEVICES FOR INTRODUCING MEDIA INTO, OR ONTO, THE BODY; DEVICES FOR TRANSDUCING BODY MEDIA OR FOR TAKING MEDIA FROM THE BODY; DEVICES FOR PRODUCING OR ENDING SLEEP OR STUPOR
- A61M2210/00—Anatomical parts of the body
- A61M2210/06—Head
- A61M2210/0693—Brain, cerebrum
-
- A—HUMAN NECESSITIES
- A61—MEDICAL OR VETERINARY SCIENCE; HYGIENE
- A61N—ELECTROTHERAPY; MAGNETOTHERAPY; RADIATION THERAPY; ULTRASOUND THERAPY
- A61N5/00—Radiation therapy
- A61N5/06—Radiation therapy using light
- A61N2005/063—Radiation therapy using light comprising light transmitting means, e.g. optical fibres
-
- A—HUMAN NECESSITIES
- A61—MEDICAL OR VETERINARY SCIENCE; HYGIENE
- A61N—ELECTROTHERAPY; MAGNETOTHERAPY; RADIATION THERAPY; ULTRASOUND THERAPY
- A61N5/00—Radiation therapy
- A61N5/06—Radiation therapy using light
- A61N2005/065—Light sources therefor
- A61N2005/0651—Diodes
-
- A—HUMAN NECESSITIES
- A61—MEDICAL OR VETERINARY SCIENCE; HYGIENE
- A61N—ELECTROTHERAPY; MAGNETOTHERAPY; RADIATION THERAPY; ULTRASOUND THERAPY
- A61N5/00—Radiation therapy
- A61N5/06—Radiation therapy using light
- A61N2005/0658—Radiation therapy using light characterised by the wavelength of light used
- A61N2005/0662—Visible light
-
- A—HUMAN NECESSITIES
- A61—MEDICAL OR VETERINARY SCIENCE; HYGIENE
- A61N—ELECTROTHERAPY; MAGNETOTHERAPY; RADIATION THERAPY; ULTRASOUND THERAPY
- A61N5/00—Radiation therapy
- A61N5/06—Radiation therapy using light
- A61N5/0613—Apparatus adapted for a specific treatment
- A61N5/0618—Psychological treatment
Landscapes
- Health & Medical Sciences (AREA)
- Engineering & Computer Science (AREA)
- Biomedical Technology (AREA)
- Life Sciences & Earth Sciences (AREA)
- Animal Behavior & Ethology (AREA)
- General Health & Medical Sciences (AREA)
- Public Health (AREA)
- Veterinary Medicine (AREA)
- Pathology (AREA)
- Nuclear Medicine, Radiotherapy & Molecular Imaging (AREA)
- Radiology & Medical Imaging (AREA)
- Biophysics (AREA)
- Psychology (AREA)
- Anesthesiology (AREA)
- Physics & Mathematics (AREA)
- Neurosurgery (AREA)
- Heart & Thoracic Surgery (AREA)
- Hematology (AREA)
- Acoustics & Sound (AREA)
- Epidemiology (AREA)
- Rehabilitation Therapy (AREA)
- Physical Education & Sports Medicine (AREA)
- Pain & Pain Management (AREA)
- Child & Adolescent Psychology (AREA)
- Social Psychology (AREA)
- Psychiatry (AREA)
- Hospice & Palliative Care (AREA)
- Developmental Disabilities (AREA)
- Medicines That Contain Protein Lipid Enzymes And Other Medicines (AREA)
- Radiation-Therapy Devices (AREA)
- Peptides Or Proteins (AREA)
- Pharmaceuticals Containing Other Organic And Inorganic Compounds (AREA)
- Saccharide Compounds (AREA)
- Electrotherapy Devices (AREA)
- Medicines Containing Antibodies Or Antigens For Use As Internal Diagnostic Agents (AREA)
Description
政府支援に関する陳述
本発明は、国立衛生研究所によって与えられた認可番号RF1 AG047661の下、政府支援を受けてなされた。政府は本発明に所定の権利を有する。
STATEMENT OF GOVERNMENT SUPPORT This invention was made with government support under grant number RF1 AG047661 awarded by the National Institutes of Health. The Government has certain rights in this invention.
関連出願の相互参照
本出願は、米国特許法第119条(e)の定めにより、2015年11月24日に出願された「System and Methods for Preventing,Mitigating,and/or Treating Dementia」と題する米国出願第62/259,187号の優先権の利益を主張する。当該出願の開示は、参照することによりその全体が本明細書に組み込まれる。
CROSS-REFERENCE TO RELATED APPLICATIONS This application, entitled "System and Methods for Preventing, Mitigating, and/or Treating Dementia," filed November 24, 2015 pursuant to 35 U.S.C. Priority benefit of Application No. 62/259,187 is claimed. The disclosure of that application is incorporated herein by reference in its entirety.
本開示は、概して、対象における認知症を予防、軽減、及び/または治療するためのシステムならびに方法に関する。より具体的には、本開示は、対象の少なくとも1つの脳領域において、同期ガンマ振動を誘導するためのシステム及び方法に関する。 The present disclosure relates generally to systems and methods for preventing, reducing, and/or treating dementia in a subject. More specifically, the present disclosure relates to systems and methods for inducing synchronous gamma oscillations in at least one brain region of a subject.
アルツハイマー病(AD)は、記憶力、見当識、及び論理的思考の低下を特徴とする進行性の神経変性疾患である。これは、世界における認知症の最も一般的な形であり、65歳以上の約8人に1人を侵し、米国では死因の第6位である。この進行性の神経変性疾患の患者数は、今後10年で40%増加すると推定される。 Alzheimer's disease (AD) is a progressive neurodegenerative disorder characterized by deterioration of memory, orientation, and reasoning. It is the most common form of dementia in the world, affecting approximately 1 in 8 people over the age of 65 and the sixth leading cause of death in the United States. The prevalence of this progressive neurodegenerative disease is estimated to increase by 40% over the next decade.
病理組織学的には、ADは、アミロイドβ(Aβ)ペプチドを含むアミロイド斑及びタウタンパク質からなる神経原線維変化(NFT)の蓄積を特徴とし得る。Aβペプチドは、36~43アミノ酸のタンパク質であり、その正常な生理的機能はいまだ不明である。Aβペプチドは、アミロイド前駆体タンパク質(APP)のβセクレターゼ1(BACE1)及びγセクレターゼによる一連のタンパク質分解的切断によって形成される。C末端断片β(β-CTF)は、BACE1によるAPPのアミロイド形成的切断の過程で産生されるAPP誘導体であり、ひいてはAβペプチド産生の別の指標である。正常な状態では、可溶性のAβペプチドはニューロンによって産生及び分泌され、その後、脳脊髄液(CSF)経路を介して脳から除去される。しかしながら、ADの対象では、Aβペプチドは、より高次の種に凝集し、可溶性のオリゴマーと不溶性の斑を濃度依存的に形成すると思われる。この凝集は、脳代謝の破壊、神経炎症、機能的結合の低下、シナプス及びニューロンの損失、及び/またはNFTの形成を含めた多くの神経毒性事象を引き起こす場合がある。 Histopathologically, AD can be characterized by the accumulation of neurofibrillary tangles (NFTs) composed of amyloid plaques and tau protein containing the amyloid-β (Aβ) peptide. Aβ peptide is a protein of 36-43 amino acids and its normal physiological function is still unknown. Aβ peptides are formed by a series of proteolytic cleavages of the amyloid precursor protein (APP) by β-secretase 1 (BACE1) and γ-secretase. The C-terminal fragment β (β-CTF) is an APP derivative produced during the amyloidogenic cleavage of APP by BACE1 and thus another indicator of Aβ peptide production. Under normal conditions, soluble Aβ peptides are produced and secreted by neurons and then cleared from the brain via the cerebrospinal fluid (CSF) pathway. However, in subjects with AD, Aβ peptides appear to aggregate into higher order species and form soluble oligomers and insoluble plaques in a concentration-dependent manner. This aggregation can lead to a number of neurotoxic events, including disruption of brain metabolism, neuroinflammation, loss of functional connectivity, loss of synapses and neurons, and/or formation of NFTs.
Aβ濃度とニューロンの活動の間の基本的関係は証明されている。第一に、APPを過剰発現するトランスジェニック(Tg)マウスから調製した器官型海馬スライスのテトロドトキシンでの処理で、ニューロンの活動が低下し、それに続いてAβレベルが低下した。その後、逆の効果、すなわち、ニューロンの活動の増加がピクロトキシンでの処理で観察された。Aβペプチド濃度及び最終的な斑沈着のインビボでの動的調節もまた、ニューロンの活動を用いて証明されている。ヒトAD患者では、神経系の画像化で、最も深刻な斑沈着が、「デフォルトモードネットワーク」として知られる最も一貫して活発な脳領域と一致し得ることが示される。 A fundamental relationship between Aβ concentration and neuronal activity has been demonstrated. First, treatment of organotypic hippocampal slices prepared from APP-overexpressing transgenic (Tg) mice with tetrodotoxin decreased neuronal activity and subsequently decreased Aβ levels. Subsequently, the opposite effect, namely an increase in neuronal activity, was observed with treatment with picrotoxin. Dynamic regulation of Aβ peptide concentration and eventual plaque deposition in vivo has also been demonstrated using neuronal activity. In human AD patients, imaging of the nervous system shows that the most severe plaque deposits may coincide with the most consistently active brain regions known as the 'default mode network'.
これまでのところ、ADは治療法がなく、治療選択肢は、ADの病理学的進行を抑制せず、主に姑息的であり、及び/または複数の厄介な副作用を有する場合もある。例えば、Aβペプチド及び/またはその前駆体を標的とする予防及び/または治療戦略(例えば、Aβ免疫療法ならびにβセクレターゼ及びγセクレターゼの阻害)は、臨床試験では、ADの病変の低減において害があり、及び/または効果がないとされている。アミロイドベータワクチン(例えば、バピネオズマブ)を使用する臨床試験は、認知機能に関する効果の不足のために失敗している。ガンマセクレターゼ阻害剤(例えば、セマガセスタット)は、対象における認知障害の悪化のため、臨床試験に失敗している。アセチルコリンエステラーゼ阻害剤(例えば、ドネペジル及びリバスチグミン)ならびにN-メチル-D-アスパラギン酸(NMDA)受容体アンタゴニスト(例えば、メマンチン)等の既存薬でさえ、認知機能に関する軽度の効果しか示さない。 To date, AD has no cure, and treatment options do not control the pathological progression of AD, are largely palliative, and/or may have multiple troubling side effects. For example, preventive and/or therapeutic strategies targeting Aβ peptides and/or their precursors (e.g., Aβ immunotherapy and inhibition of β- and γ-secretase) have been shown to be detrimental in reducing AD lesions in clinical trials. , and/or ineffective. Clinical trials using amyloid beta vaccines (eg, bapineuzumab) have failed due to lack of efficacy on cognitive function. Gamma secretase inhibitors (eg, semagacestat) have failed in clinical trials due to worsening cognitive impairment in subjects. Even existing drugs such as acetylcholinesterase inhibitors (eg donepezil and rivastigmine) and N-methyl-D-aspartate (NMDA) receptor antagonists (eg memantine) show only modest effects on cognitive function.
ADの重要な微視的病理学的特徴としては、アミロイド斑、NFT、及び広範囲に及ぶニューロンの欠損の存在が挙げられる。このニューロンの損傷の蓄積は、長い時間をかけて生じ、脳内の巨視的な回路の機能不全、とりわけ、記憶と集中の作業の過程でガンマパワー不足を誘導する。これらのガンマ振動(例えば、約20Hz~約100Hz、約20Hz~約80Hz、または約20Hz~約50Hz)は、主にファスト・スパイキング・パルブアルブミン(FS-PV)介在ニューロンを生じ、これにより調節される。 Key microscopic pathological features of AD include the presence of amyloid plaques, NFTs, and widespread neuronal loss. This accumulation of neuronal damage occurs over time and induces dysfunction of macroscopic circuits in the brain, particularly gamma power deficits during memory and concentration tasks. These gamma oscillations (eg, about 20 Hz to about 100 Hz, about 20 Hz to about 80 Hz, or about 20 Hz to about 50 Hz) primarily give rise to and are modulated by fast-spiking parvalbumin (FS-PV) interneurons. be done.
一態様において、本開示は、当該対象の少なくとも1つの脳領域において同期ガンマ振動を誘導することを含む、対象における認知症を予防、軽減、及び/または治療するための装置、方法、ならびにシステムを提供する。いくつかの実施形態では、該認知症は、AD、血管性認知症、前頭側頭認知症、レビー小体認知症、及び/または加齢関連認知低下と関連する。該対象は、ヒトの場合も動物の場合もある。 In one aspect, the present disclosure provides devices, methods, and systems for preventing, reducing, and/or treating dementia in a subject comprising inducing synchronous gamma oscillations in at least one brain region of the subject. offer. In some embodiments, the dementia is associated with AD, vascular dementia, frontotemporal dementia, Lewy body dementia, and/or age-related cognitive decline. The subject may be human or animal.
いくつかの実施形態では、該同期ガンマ振動は、周波数約20Hz~約50Hz、例えば、約40Hzを有する。該同期ガンマ振動は、細胞型特異的に誘導され得る。例えば、該振動は、FS-PV介在ニューロンの同期的活動化と調和し得る。該同期ガンマ振動は、脳領域特異的に誘導され得る。例えば、該振動は、海馬領域及び感覚野領域の少なくとも一方における同期的活動化と調和し得る。 In some embodiments, the synchronous gamma oscillations have a frequency of about 20Hz to about 50Hz, such as about 40Hz. The synchronous gamma oscillations can be induced in a cell-type specific manner. For example, the oscillations can be coordinated with synchronous activation of FS-PV interneurons. The synchronous gamma oscillations can be induced brain region-specifically. For example, the oscillations can be coordinated with synchronous activation in hippocampal and/or sensory areas.
1つの実施形態では、対象における認知症を予防、軽減、及び/または治療するための方法は、刺激放出装置を制御して刺激を放出するステップ、ならびに該対象を該刺激に曝露するステップ、及び/または該対象に該刺激を投与するステップを含み、それにより、該対象の少なくとも1つの脳領域においてインビボで同期ガンマ振動を誘導する。該刺激は、周波数約35Hz~約45Hz、例えば、周波数約40Hzを有し得る。該刺激放出装置は、触覚装置、発光装置、及び/または放音装置であり得る。例えば、該発光装置は、光ファイバー装置であり得る。該刺激への該対象の曝露期間及び/または該対象への該刺激の投与期間は、約1時間でよい。該刺激への該対象の曝露及び/または該対象への該刺激の投与は、ある期間にわたって繰り返してもよい。例えば、該刺激への該対象の曝露及び/または該対象への該刺激の投与は、該期間にわたって少なくとも1日1回繰り返してよい。該期間としては、1日、2日、3日、4日、5日、6日、1週間、2週間、3週間、及び/または1か月(またはより長期間、例えば、当該対象の生涯にわたり、1日1回)を挙げることができるがこれに限定されない。 In one embodiment, a method for preventing, reducing, and/or treating dementia in a subject comprises the steps of controlling a stimulus-releasing device to release a stimulus, and exposing the subject to the stimulus; /or administering said stimulus to said subject, thereby inducing synchronous gamma oscillations in vivo in at least one brain region of said subject. The stimulus may have a frequency of about 35Hz to about 45Hz, such as a frequency of about 40Hz. The stimulus emitting device can be a haptic device, a light emitting device, and/or a sound emitting device. For example, the light emitting device can be a fiber optic device. The duration of exposure of the subject to the stimulus and/or administration of the stimulus to the subject may be about 1 hour. Exposure of the subject to the stimulus and/or administration of the stimulus to the subject may be repeated over a period of time. For example, exposure of the subject to the stimulus and/or administration of the stimulus to the subject may be repeated at least once daily over the period of time. The period of time may be 1 day, 2 days, 3 days, 4 days, 5 days, 6 days, 1 week, 2 weeks, 3 weeks, and/or 1 month (or longer, e.g., the lifetime of the subject). over a period of time, once a day), but are not limited to this.
一態様において、対象の少なくとも1つの脳領域においてAβペプチドのレベル(例えば、量または割合)を低減するための方法は、該対象の少なくとも1つの脳領域において同期ガンマ振動を誘導することを含む。該Aβペプチドとしては、Aβペプチドの1つ以上のアイソフォーム(例えば、アイソフォームAβ1-40、アイソフォームAβ1-42、及び/またはアイソフォームAβ1-43)、可溶性Aβペプチド、及び/または不溶性Aβペプチドを挙げることができる。 In one aspect, a method for reducing levels (e.g., amount or percentage) of Aβ peptides in at least one brain region of a subject comprises inducing synchronous gamma oscillations in at least one brain region of the subject. The Aβ peptide includes one or more isoforms of Aβ peptide (eg, isoform Aβ 1-40 , isoform Aβ 1-42 , and/or isoform Aβ 1-43 ), soluble Aβ peptide, and/or Mention may be made of insoluble Aβ peptides.
いくつかの実施形態では、該同期ガンマ振動は、例えば、該対象の該少なくとも1つの脳領域においてAPPのC末端断片(CTF)及び/またはN末端断片(NTF)のレベル(例えば、量または割合)を低減することにより、該対象の該少なくとも1つの脳領域においてAβペプチドの産生を低減する。該同期ガンマ振動は、該対象の該少なくとも1つの脳領域においてBACE1及び/またはγセクレターゼによるAPPのCTF及びNTFへの切断を低減し得る。該同期ガンマ振動は、該対象の該少なくとも1つの脳領域においてエンドソームのレベル(例えば、数または割合)を低減し得る。例えば、該エンドソームは、初期エンドソーム抗原1(EEA1)及び/またはRAB5A遺伝子(Rab5)がコードするRas関連タンパク質に対して陽性であり得る。いくつかの実施形態では、該同期ガンマ振動は、該対象の該少なくとも1つの脳領域においてAβペプチドのクリアランスを促進する。該同期ガンマ振動は、該対象の該少なくとも1つの脳領域においてミクログリアによるAβペプチドの取り込みを増加させ得る。 In some embodiments, the synchronized gamma oscillations are, for example, the level (e.g., amount or percentage) of C-terminal fragment (CTF) and/or N-terminal fragment (NTF) of APP in said at least one brain region of said subject ), thereby reducing production of Aβ peptide in said at least one brain region of said subject. The synchronized gamma oscillations may reduce cleavage of APP into CTFs and NTFs by BACE1 and/or γ-secretase in the at least one brain region of the subject. The synchronized gamma oscillations can reduce the level (eg, number or proportion) of endosomes in the at least one brain region of the subject. For example, the endosome can be positive for early endosomal antigen 1 (EEA1) and/or Ras-related proteins encoded by the RAB5A gene (Rab5). In some embodiments, said synchronized gamma oscillations promote clearance of Aβ peptide in said at least one brain region of said subject. The synchronous gamma oscillations can increase uptake of Aβ peptide by microglia in the at least one brain region of the subject.
一態様における、対象の少なくとも1つの脳領域において同期ガンマ振動を誘導することを含む、対象の少なくとも1つの脳領域におけるミクログリア細胞のレベル(例えば、数または割合)、神経保護状態と一致するミクログリア細胞の形態学的変化、及び/または該ミクログリア細胞の活性を増加させる方法。該同期ガンマ振動は、少なくとも1つの差次的に発現される遺伝子、例えば、該対象の該少なくとも1つの脳領域においてミクログリアの活性に関与する、Nr4a1、Arc、Npas4、Cd68、B2m、Bsr2、Icam1、Lyz2、Irf7、Spp1、Csf1r、及び/またはCsf2raを上方制御し得る。該神経保護状態と一致するミクログリア細胞の形態学的変化は、細胞体のサイズの増加及び/または過程の長さの減少を含み得る。 In one aspect, the level (e.g., number or percentage) of microglial cells in at least one brain region of the subject, comprising inducing synchronized gamma oscillations in at least one brain region of the subject, microglial cells consistent with a neuroprotective state and/or increasing the activity of said microglial cells. The synchronous gamma oscillations are associated with at least one differentially expressed gene, such as Nr4a1, Arc, Npas4, Cd68, B2m, Bsr2, Icam1, which is involved in microglial activity in the at least one brain region of the subject. , Lyz2, Irf7, Spp1, Csf1r, and/or Csf2ra. Morphological changes in microglial cells consistent with the neuroprotective state may include an increase in cell body size and/or a decrease in process length.
一態様において、対象の海馬においてAβペプチドのレベル(例えば、量または割合)を低減するための方法は、該海馬において光遺伝学的にFS-PV介在ニューロンを、複数の光パルスで刺激すること含み、該FS-PV介在ニューロンは、光遺伝学的アクチュエータを発現し、それにより、該海馬におけるAβペプチドのレベルを低減する興奮性ニューロン(例えば、FS-PV介在ニューロン)における局所電場電位によって測定されるインビボ同期ガンマ振動に同調する。該光パルスは、パルス周波数約40パルス/秒を有し得る。各光パルスは、持続時間約1ミリ秒を有し得る。少なくとも1つの光パルスは、波長約473nmを有し得る。該光遺伝学的アクチュエータは、チャネルロドプシン、ハロロドプシン、及び/またはアーキロドプシンを含み得る。例えば、該光遺伝学的アクチュエータは、チャネルロドプシン2(ChR2)であり得る。 In one aspect, a method for reducing levels (e.g., amount or percentage) of Aβ peptide in the hippocampus of a subject comprises optogenetically stimulating FS-PV interneurons in the hippocampus with a plurality of pulses of light. wherein said FS-PV interneurons express optogenetic actuators, thereby reducing levels of Aβ peptide in said hippocampus, as measured by local field potentials in excitatory neurons (e.g., FS-PV interneurons) tuned to the in vivo synchronous gamma oscillations. The light pulses may have a pulse frequency of approximately 40 pulses/second. Each light pulse may have a duration of about 1 millisecond. At least one light pulse may have a wavelength of about 473 nm. The optogenetic actuator may comprise channelrhodopsin, halorhodopsin, and/or archrhodopsin. For example, the optogenetic actuator can be channelrhodopsin 2 (ChR2).
一態様において、対象の視覚野における可溶性及び/または不溶性Aβペプチドのレベル(例えば、量または割合)を低減するための方法は、該対象を複数の光パルスでパルス周波数約40パルス/秒にて刺激することを含み、それにより、該視覚野において同期ガンマ振動をインビボで誘導し、これが該視覚野における可溶性及び/または不溶性Aβペプチドのレベルを低減する。 In one aspect, a method for reducing levels (e.g., amount or percentage) of soluble and/or insoluble Aβ peptide in the visual cortex of a subject comprises exposing said subject to multiple light pulses at a pulse frequency of about 40 pulses/second. stimulating, thereby inducing synchronous gamma oscillations in the visual cortex in vivo, which reduce levels of soluble and/or insoluble Aβ peptides in the visual cortex.
一態様において、対象の視覚野におけるタウリン酸化のレベル(例えば、量または割合)を低減するための方法は、該対象を複数の光パルスでパルス周波数約40パルス/秒にて刺激することを含み、それにより、該視覚野において同期ガンマ振動をインビボで誘導し、これが該視覚野におけるタウリン酸化を低減する。 In one aspect, a method for reducing the level (e.g., amount or rate) of tau phosphorylation in the visual cortex of a subject comprises stimulating the subject with multiple light pulses at a pulse frequency of about 40 pulses/second. , thereby inducing synchronous gamma oscillations in the visual cortex in vivo, which reduces tau phosphorylation in the visual cortex.
一態様において、対象の海馬及び/または聴覚野におけるAβペプチドのレベル(例えば、量または割合)を低減するための方法は、該対象を複数の音波パルスでパルス周波数約40パルス/秒にて刺激することを含み、それにより、該海馬及び聴覚野の少なくとも一方において同期ガンマ振動をインビボで誘導し、これが該海馬及び聴覚野の少なくとも一方におけるAβペプチドのレベルを低減する。 In one aspect, a method for reducing levels (e.g., amount or percentage) of Aβ peptide in the hippocampus and/or auditory cortex of a subject comprises stimulating the subject with a plurality of sound pulses at a pulse frequency of about 40 pulses/second. thereby inducing synchronized gamma oscillations in vivo in said hippocampus and/or auditory cortex, which reduce levels of Aβ peptide in said hippocampus and/or auditory cortex.
一態様において、対象におけるAβペプチド、神経炎症、及び/または認知機能のレベル(例えば、量または割合)または変化を予防、低減、及び/または治療するためのシステムは、当該対象の脳領域のインビボでの同期的活動化のための刺激放出装置、刺激パラメータ及びプロセッサの実行命令を保存するための少なくとも1つのメモリ、ならびに該刺激放出装置及び該少なくとも1つのメモリに伝達可能に接続された少なくとも1つのプロセッサを具備する。該プロセッサの実行命令の実行時、該少なくとも1つのプロセッサは、該刺激放出装置を制御して該刺激パラメータに従う刺激を放出し、該パラメータは、当該周波数で該脳領域を同期的に活動化する周波数を含み、それにより、該対象におけるAβペプチド、神経炎症、及び/または認知症が予防、低減、及び/または治療される。該周波数は、約35Hz~約45Hz、例えば、約40Hzでよい。該インビボでの同期的活動化は、酵素によって調節される場合があり、及び/または特定の細胞型、例えば、免疫反応性FS-PV介在ニューロンで生じる場合もある。該酵素としては、光遺伝学的活性化剤、微生物オプシン、ChR2、及び/またはベクターAAV-DIO-ChR2-EYFPを挙げることができる。 In one aspect, the system for preventing, reducing, and/or treating levels (e.g., amounts or percentages) or changes in Aβ peptides, neuroinflammation, and/or cognitive function in a subject comprises in vivo at least one memory for storing stimulation parameters and instructions for execution of a processor; with one processor. Upon execution of the processor's execution instructions, the at least one processor controls the stimulation emitting device to emit stimulation according to the stimulation parameters, which synchronously activate the brain regions at the frequencies. frequencies whereby Aβ peptides, neuroinflammation, and/or dementia are prevented, reduced, and/or treated in said subject. The frequency may be from about 35 Hz to about 45 Hz, such as about 40 Hz. The in vivo synchronous activation may be enzymatically regulated and/or may occur in specific cell types, such as immunoreactive FS-PV interneurons. The enzyme can include optogenetic activator, microbial opsin, ChR2, and/or vector AAV-DIO-ChR2-EYFP.
一態様において、対象におけるAβペプチド、神経炎症、及び/または認知機能のレベル(例えば、量または割合)または変化を予防、低減、及び/または治療するためのシステムは、該対象の少なくとも一方の目に対する周囲光を低減するための光閉塞装置及び/または該対象の少なくとも一方の耳に対する周囲騒音を低減するための雑音消去装置を具備する。該光閉塞装置は、該対象の視覚野及び海馬のうちの少なくとも一方のインビボでの同期的活動化のため、該少なくとも一方の目に対して、光刺激を放出するための発光ユニットを具備してもよい。該雑音消去装置は、該対象の聴覚野及び海馬のうちの少なくとも一方のインビボでの同期的活動化のため、該少なくとも一方の耳に対して、音刺激を放出するためのスピーカーユニットを具備してもよい。該システムはまた、プロセッサの実行命令を保存するための少なくとも1つのメモリ、ならびに該光閉塞装置及び/または該雑音消去装置ならびに該少なくとも1つのメモリに伝達可能に接続された少なくとも1つのプロセッサを具備する。該プロセッサの実行命令の実行時、該少なくとも1つのプロセッサは、該発光ユニットが、当該周波数で視覚野及び海馬の該少なくとも一方を同期的に活動化する周波数にて該光刺激を放出するように、該光閉塞装置を制御する場合がある。代替的に、またはさらに、該少なくとも1つのプロセッサは、該スピーカーユニットが、当該周波数で聴覚野及び海馬の少なくとも一方を同期的に活動化する周波数にて該音刺激を作動させるように、該雑音消去装置を制御する場合がある。 In one aspect, the system for preventing, reducing, and/or treating levels (e.g., amounts or percentages) or changes in Aβ peptides, neuroinflammation, and/or cognitive function in a subject comprises: and/or a noise cancellation device for reducing ambient noise to at least one ear of the subject. The light occlusion device comprises a light emitting unit for emitting a light stimulus to the at least one eye for synchronous activation in vivo of at least one of the visual cortex and hippocampus of the subject. may The noise cancellation device comprises a speaker unit for emitting sound stimuli to the at least one ear for synchronous activation in vivo of at least one of the subject's auditory cortex and hippocampus. may The system also includes at least one memory for storing processor executable instructions, and at least one processor communicatively connected to the light occlusion device and/or the noise canceller and the at least one memory. do. Upon execution of the processor's executable instructions, the at least one processor causes the light emitting unit to emit the light stimulus at a frequency that synchronously activates the at least one of the visual cortex and hippocampus at the frequency. , may control the light occlusion device. Alternatively or additionally, the at least one processor is configured to reduce the noise such that the speaker unit activates the sound stimulus at a frequency that synchronously activates at least one of the auditory cortex and the hippocampus at the frequency. It may control an erasure device.
一態様において、対象における認知機能を改善するための方法は、少なくとも1つの電気音響変換器を制御し、電気的音声信号を対応する音刺激に変換することを含む。いくつかの実施形態では、該音刺激としては、クリック頻度約35クリック/秒~約45クリック/秒のクリック・トレインが挙げられる。該方法はさらに、該対象を該音刺激に曝露し、及び/または該対象に対して該刺激を投与し、該対象の少なくとも1つの脳領域において同期ガンマ振動を誘導することを含み、該同期ガンマ振動が、該対象における認知機能の改善をもたらす。該認知機能としては、認識、識別、及び/または空間記憶を挙げることができる。 In one aspect, a method for improving cognitive function in a subject includes controlling at least one electroacoustic transducer to convert electrical audio signals into corresponding sound stimuli. In some embodiments, the sound stimulus includes a click train with a click frequency of about 35 clicks/second to about 45 clicks/second. The method further comprises exposing the subject to the acoustic stimulus and/or administering the stimulus to the subject to induce synchronous gamma oscillations in at least one brain region of the subject; Gamma oscillations result in improved cognitive function in the subject. The cognitive functions can include recognition, discrimination, and/or spatial memory.
一態様において、対象におけるAβペプチド、神経炎症、及び/または認知機能のレベル(例えば、量または割合)または変化を予防、低減、及び/または治療するための方法は、少なくとも1つの電気音響変換器を制御し、電気的音声信号を、対応する音刺激、すなわち、クリック頻度約35クリック/秒~約45クリック/秒のクリック・トレイン等の音刺激に変換すること、ならびに該対象を該音刺激に曝露し、及び/または該対象に対して該刺激を投与し、該対象の少なくとも1つの脳領域において同期ガンマ振動を誘導することを含み、該同期ガンマ振動が、該対象におけるAβペプチド、神経炎症、及び/または認知症のレベルの予防、低減、及び/または治療をもたらす。 In one aspect, a method for preventing, reducing, and/or treating a level (e.g., amount or rate) or change in Aβ peptide, neuroinflammation, and/or cognitive function in a subject comprises at least one electroacoustic transducer to convert the electrical audio signal into a corresponding sound stimulus, namely a sound stimulus such as a click train with a click frequency of about 35 clicks/sec to about 45 clicks/sec; and/or administering the stimulus to the subject to induce synchronous gamma oscillations in at least one brain region of the subject, wherein the synchronous gamma oscillations are associated with Aβ peptides, neuro It provides prevention, reduction and/or treatment of inflammation and/or levels of dementia.
該Aβペプチドとしては、Aβペプチドの1つ以上のアイソフォーム(例えば、アイソフォームAβ1-40、アイソフォームAβ1-42、及び/またはアイソフォームAβ1-43)、可溶性Aβペプチド、及び/または不溶性Aβペプチドを挙げることができる。該同期ガンマ振動は、当該対象の少なくとも1つの脳領域におけるミクログリア細胞の数を増加させること、及び/または、該少なくとも1つの脳領域における該ミクログリア細胞によるAβペプチドの取り込みを増加させることによって、該対象におけるAβペプチド、神経炎症、及び/または認知症のレベルを予防、低減、及び/または治療し得る。該少なくとも1つの脳領域としては、聴覚野及び/または海馬を挙げることができる。 The Aβ peptide includes one or more isoforms of Aβ peptide (eg, isoform Aβ 1-40 , isoform Aβ 1-42 , and/or isoform Aβ 1-43 ), soluble Aβ peptide, and/or Mention may be made of insoluble Aβ peptides. The synchronized gamma oscillations increase the number of microglial cells in at least one brain region of the subject and/or increase the uptake of Aβ peptide by the microglial cells in the at least one brain region. Levels of Aβ peptides, neuroinflammation, and/or dementia in a subject may be prevented, reduced, and/or treated. The at least one brain region can include the auditory cortex and/or the hippocampus.
該クリック頻度は、約40クリック/秒でよい。該クリック・トレインの各クリックは、持続時間約1ミリ秒を有し得る。該クリック・トレインの各クリックは、周波数約10Hz~約100kHz、約12Hz~約28kHz、約20Hz~約20kHz、及び/または約2kHz~約5kHzを有し得る。該クリック・トレインの各クリックは、音圧レベル約0dB~約85dB、約30dB~約70dB、及び約60dB~約65dBを有し得る。 The click frequency may be about 40 clicks/second. Each click in the click train may have a duration of about 1 millisecond. Each click of the click train can have a frequency of about 10 Hz to about 100 kHz, about 12 Hz to about 28 kHz, about 20 Hz to about 20 kHz, and/or about 2 kHz to about 5 kHz. Each click of the click train can have a sound pressure level of about 0 dB to about 85 dB, about 30 dB to about 70 dB, and about 60 dB to about 65 dB.
該少なくとも1つの電気音響変換器としては、少なくとも1つのヘッドホンを挙げることができ、この場合、該方法は、当該対象の少なくとも一方の耳の周囲に、耳の上に、及び/または耳の中に該少なくとも1つのヘッドホンを使用し、該対象の該少なくとも一方の耳に音刺激を向けることを含み得る。該方法としてはまた、受動的雑音遮断及び/または能動的雑音消去を用いた周囲騒音の低減を挙げることができる。 The at least one electro-acoustic transducer can include at least one headphone, wherein the method includes: around, on, and/or in at least one ear of the subject. using the at least one headphone to direct a sound stimulus to the at least one ear of the subject. The method can also include reducing ambient noise using passive noise blocking and/or active noise cancellation.
一態様において、対象におけるAβペプチド、神経炎症、及び/または認知機能のレベル(例えば、量または割合)または変化を予防、低減、及び/または治療するためのシステムは、電気的音声信号を、対応する音刺激、すなわち、クリック頻度約35クリック/秒~約45クリック/秒のクリック・トレイン等の音刺激に変換するための少なくとも1つの電気音響変換器、該電気的音声信号及びプロセッサの実行命令を保存するための少なくとも1つの記憶装置、ならびに該少なくとも1つの電気音響変換器及び該少なくとも1つの記憶装置に伝達可能に接続された少なくとも1つのプロセッサを具備する。該プロセッサの実行命令の実行時、該少なくとも1つのプロセッサは、該電気音響変換器を制御し、該対象の少なくとも一方の耳に音刺激を出力し、該対象の少なくとも1つの脳領域において同期ガンマ振動を誘導し、該同期ガンマ振動が、該対象におけるAβペプチド、神経炎症、及び/または認知症のレベルの予防、低減、及び/または治療をもたらす。 In one aspect, a system for preventing, reducing, and/or treating levels (e.g., amounts or percentages) or changes in Aβ peptides, neuroinflammation, and/or cognitive function in a subject comprises an electrical audio signal, a corresponding at least one electro-acoustic transducer, the electrical audio signal and processor executable instructions for converting into a sound stimulus, such as a click train with a click frequency of about 35 clicks/second to about 45 clicks/second. and at least one processor communicatively connected to the at least one electroacoustic transducer and the at least one storage device. Upon execution of the processor's execution instructions, the at least one processor controls the electroacoustic transducer to output sound stimulation to at least one ear of the subject, and to perform synchronous gamma stimulation in at least one brain region of the subject. Oscillations are induced and the synchronized gamma oscillations result in prevention, reduction and/or treatment of levels of Aβ peptides, neuroinflammation and/or dementia in the subject.
該システムは、固定式でも携帯式でもよい。該少なくとも1つの電気音響変換器が、当該対象の少なくとも一方の耳の周囲に、耳の上に、及び/または耳の中に着用するための該少なくとも1つのヘッドホンを具備し、該対象の該少なくとも一方の耳に音刺激を向け、かつ周囲騒音を低減する場合、該システムは、さらに、該電気的音声信号を該少なくとも1つのヘッドホンに伝達するためのヘッドホンインタフェースを具備してもよい。代替的に、またはさらに、該システムは、該音刺激の出力の前、最中、及び/または後に、該対象の該少なくとも1つの脳領域の機能を監視する神経画像装置を具備してもよい。 The system may be fixed or portable. The at least one electroacoustic transducer comprises the at least one headphone for wearing around, on, and/or in at least one ear of the subject; For directing sound stimulation to at least one ear and reducing ambient noise, the system may further comprise a headphone interface for transmitting the electrical audio signal to the at least one headphone. Alternatively, or additionally, the system may comprise a neuroimaging device for monitoring the function of the at least one brain region of the subject before, during and/or after the output of the sound stimuli. .
一態様において、対象における認知症を予防、軽減、及び/または治療するための方法は、該対象の少なくとも1つの脳領域において同期ガンマ振動を誘導する装置を提供することを含む。 In one aspect, a method for preventing, reducing, and/or treating dementia in a subject comprises providing a device that induces synchronous gamma oscillations in at least one brain region of said subject.
一態様において、対象におけるストレス反応に関与する糖質コルチコイドの血中レベル(例えば、量)を維持及び/または低減するための方法は、該対象の少なくとも1つの脳領域において同期ガンマ振動を誘導する装置を提供することを含む。 In one aspect, a method for maintaining and/or reducing blood levels (e.g., amounts) of glucocorticoids involved in the stress response in a subject induces synchronous gamma oscillations in at least one brain region of the subject. Including providing equipment.
一態様において、対象における不安を予防及び/または低減するための方法は、該対象の少なくとも1つの脳領域において同期ガンマ振動を誘導する装置を提供することを含む。 In one aspect, a method for preventing and/or reducing anxiety in a subject comprises providing a device that induces synchronous gamma oscillations in at least one brain region of the subject.
一態様において、記憶の連合を維持及び/または強化するための方法は、当該対象の少なくとも1つの脳領域において同期ガンマ振動を誘導する装置を提供することを含む。該記憶の連合は、空間記憶に基づきうる。 In one aspect, a method for maintaining and/or enhancing memory associations includes providing a device that induces synchronous gamma oscillations in at least one brain region of the subject. The memory association may be based on spatial memory.
一態様において、認識の柔軟性を維持及び/または強化するための方法は、当該対象の少なくとも1つの脳領域において同期ガンマ振動を誘導する装置を提供することを含む。 In one aspect, a method for maintaining and/or enhancing cognitive flexibility includes providing a device that induces synchronous gamma oscillations in at least one brain region of the subject.
一態様において、対象の少なくとも1つの脳領域において、生体構造及び/または形態に関する変化を維持及び/または低減するための方法は、該対象の少なくとも1つの脳領域において同期ガンマ振動を誘導する装置を提供することを含む。該生体構造及び/または形態としては、脳重量、側脳室サイズ、皮層の厚さ、ニューロン層の厚さ、及び/または血管径を挙げることができる。該少なくとも1つの脳領域としては、該対象の視覚野、体性感覚皮質、及び/または島皮質を挙げることができる。 In one aspect, a method for maintaining and/or reducing changes in anatomy and/or morphology in at least one brain region of a subject comprises a device that induces synchronous gamma oscillations in at least one brain region of the subject. Including providing. The anatomy and/or morphology can include brain weight, lateral ventricular size, cortical thickness, neuronal layer thickness, and/or vessel diameter. The at least one brain region can include the subject's visual cortex, somatosensory cortex, and/or insular cortex.
一態様において、対象の少なくとも1つの脳領域において、ニューロンの数、該ニューロンのDNAの質、及び/またはシナプス点密度に関する変化を維持及び/または低減するための方法は、該対象の少なくとも1つの脳領域において同期ガンマ振動を誘導する装置を提供することを含む。該少なくとも1つの脳領域としては、該対象の視覚野、体性感覚皮質、島皮質、及び/または海馬を挙げることができる。 In one aspect, the method for maintaining and/or reducing changes in neuron number, DNA quality of said neurons, and/or synaptic point density in at least one brain region of said subject comprises: This includes providing a device for inducing synchronous gamma oscillations in brain regions. The at least one brain region can include the subject's visual cortex, somatosensory cortex, insular cortex, and/or hippocampus.
一態様において、対象の少なくとも1つの脳領域において同期ガンマ振動を誘導する装置は、該対象における認知症及び/または不安を予防、軽減、及び/または治療すること、該対象の記憶の連合及び/または認識の柔軟性を維持及び/または強化すること、及び/または該対象の少なくとも1つの脳領域において生体構造、形態、細胞、及び分子に関する変化を維持及び/または低減することができる。 In one aspect, a device that induces synchronous gamma oscillations in at least one brain region of a subject is used to prevent, reduce, and/or treat dementia and/or anxiety in said subject, memory associations and/or or maintaining and/or enhancing cognitive flexibility and/or maintaining and/or reducing anatomic, morphological, cellular and molecular changes in at least one brain region of said subject.
前述の概念及び以下により詳細に論じられるさらなる概念のすべての組合せ(ただし、かかる概念が互いに矛盾しないことを条件とする)は、本明細書に開示の本発明の主題の一部であるとして企図されることを理解されたい。特に、本開示の最後に現れる請求項に記載の主題のすべての組合せは、本明細書に開示の本発明の主題の一部であるとして企図される。また、参照により組み込まれる任意の開示にも同様に現れる場合がある本明細書で明示的に使用される用語は、本明細書に開示の特定の概念と最も一致する意味を与えられるべきであることも理解されたい。 All combinations of the foregoing concepts and further concepts discussed in more detail below, provided such concepts are not mutually exclusive, are contemplated as being part of the inventive subject matter disclosed herein. It should be understood that In particular, all combinations of claimed subject matter appearing at the end of this disclosure are contemplated as being part of the inventive subject matter disclosed herein. Also, terms expressly used herein that may likewise appear in any disclosure incorporated by reference should be given the meaning most consistent with the specific concepts disclosed herein. It should also be understood.
他のシステム、過程、及び特徴は、以下の図面及び詳細な説明を検討することにより、当業者には明らかになるであろう。すべてのかかる追加のシステム、過程、及び特徴は、本説明に含まれ、本発明の範囲内であり、添付の特許請求の範囲によって保護されることが意図される。 Other systems, processes, and features will become apparent to one with skill in the art upon examination of the following drawings and detailed description. It is intended that all such additional systems, processes, and features be included within this description, be within the scope of the invention, and be protected by the accompanying claims.
当業者には、図面は主に説明のためのものであり、本明細書に記載の本発明の主題の範囲を限定するものではないことが理解されよう。図面は必ずしも縮尺通りではなく、いくつかの例では、本明細書に開示の本発明の主題の様々な態様は、異なる特徴の理解を容易にするために、図面に誇張されて示される場合、または拡大されて示される場合がある。図面において、同類の参照符号は、概して、例えば、同類の特徴(例えば、機能的に同類及び/または構造的に同類の要素)を参照する。 Those skilled in the art will appreciate that the drawings are primarily for the purpose of illustration and do not limit the scope of the inventive subject matter described herein. The drawings are not necessarily to scale and, in some instances, various aspects of the inventive subject matter disclosed herein are shown exaggerated in the drawings to facilitate understanding of different features. Or it may be shown enlarged. In the drawings, like reference characters generally refer, for example, to like features (eg, functionally similar and/or structurally similar elements).
詳細な説明
一態様において、本開示は、対象における脳障害または認知機能障害/認知障害を予防、軽減、及び/または治療するための方法、装置、ならびにシステムを提供する。いくつかの実施形態では、該脳障害は認知症である。
DETAILED DESCRIPTION In one aspect, the present disclosure provides methods, devices, and systems for preventing, reducing, and/or treating brain damage or cognitive impairment/cognitive impairment in a subject. In some embodiments, the brain disorder is dementia.
認知機能は、ニューラルネットワーク活動における、特にガンマ周波数の振動の正確なタイミング、すなわち、集中と作業記憶に関係しているリズム(例えば、約20Hz~約100Hz、約20Hz~約80Hz、または約20Hz~約50Hz)に大いに依存している。これらの振動はシナプス活動から生じるため、それらはニューロンの分子特性と高レベルの首尾一貫した脳活動の間の直接的なつながりを提供する。重要なことには、ガンマ振動活性は、ADにおける分子神経病理によって損なわれた神経回路で中断され、当該疾患における記憶障害の主な決定要因を象徴し得る。病理と脳の振動の障害との間に因果関係があるかどうかはまだ確定していない。しかしながら、脳のリズムを操縦することは、AD等の認知症の治療に対する複数標的療法として働くことができ、かつ、これは非侵襲的治療によって達成することができる。 Cognitive function depends on the precise timing of gamma-frequency oscillations in neural network activity, particularly rhythms that are related to concentration and working memory (e.g., about 20 Hz to about 100 Hz, about 20 Hz to about 80 Hz, or about 20 Hz to about 80 Hz). 50 Hz). Because these oscillations arise from synaptic activity, they provide a direct link between the molecular properties of neurons and high levels of coherent brain activity. Importantly, gamma oscillatory activity is disrupted in neural circuits compromised by molecular neuropathology in AD and may represent a major determinant of memory impairment in the disease. Whether there is a causal relationship between pathology and disturbances in brain oscillations remains to be determined. However, manipulating brain rhythms can serve as a multi-targeted therapy for the treatment of dementias such as AD, and this can be achieved through non-invasive treatments.
一態様において、本開示は、ガンマ振動を増強するための、または誘導するための装置、方法、及びシステムを提供する。いくつかの実施形態では、ガンマ振動の該増強または誘導は、光遺伝的方法による。他の実施形態では、ガンマ振動の該増強または誘導は、行動的方法による。本開示は、光遺伝学的、行動的、もしくは他の方法によるガンマ振動の該増強及び/または誘導が、ADの病変を低減すると定めている。 In one aspect, the present disclosure provides devices, methods, and systems for enhancing or inducing gamma oscillations. In some embodiments, said enhancement or induction of gamma oscillations is by optogenetic methods. In other embodiments, said enhancement or induction of gamma oscillations is by behavioral methods. The present disclosure provides that said enhancement and/or induction of gamma oscillations by optogenetic, behavioral, or other methods reduces pathology of AD.
一態様において、本開示は、認知症を有する対象におけるガンマ振動リズムの回復または誘導のための装置、システム、及び方法を提供する。いくつかの実施形態では、該認知症は、AD、血管性認知症、前頭側頭認知症(FTD)、及び/またはレビー小体認知症である。従って、いくつかの実施形態では、本開示は、認知症を治療するための装置、システム、及び方法を提供する。 In one aspect, the present disclosure provides devices, systems, and methods for restoring or inducing gamma oscillatory rhythms in subjects with dementia. In some embodiments, the dementia is AD, vascular dementia, frontotemporal dementia (FTD), and/or Lewy body dementia. Accordingly, in some embodiments, the present disclosure provides devices, systems, and methods for treating dementia.
本明細書で使用される、「treatment(治療)」または「treating(治療)」という用語は、治療的な治療及びprophylactic(予防的)もしくはpreventive(予防的)措置の両方を指す。いくつかの実施形態では、治療を必要とする対象には、当該疾患もしくは状態をすでに有する対象だけでなく、当該疾患もしくは状態を発症し得る対象であり、目的が該疾患もしくは状態を予防、遅延、または減少させることである該対象が含まれる。例えば、いくつかの実施形態では、本明細書に開示の装置、方法、及びシステムは、当該対象が遺伝的にかかりやすい疾患もしくは状態、例えばADを予防、遅延、または軽減するために使用され得る。いくつかの実施形態では、本明細書に開示の装置、方法、及びシステムは、当該対象がすでに診断されている疾患もしくは状態、例えば、ADの症状を治療、軽減、低減、及び/またはその進行を遅延するために使用され得る。 As used herein, the terms "treatment" or "treating" refer to both therapeutic treatment and prophylactic or preventive measures. In some embodiments, subjects in need of treatment include those who already have the disease or condition, as well as those who may develop the disease or condition, where the purpose is to prevent, delay, or prevent the disease or condition. , or reducing said subject. For example, in some embodiments, the devices, methods, and systems disclosed herein can be used to prevent, delay, or alleviate a disease or condition to which the subject is genetically predisposed, such as AD. . In some embodiments, the devices, methods, and systems disclosed herein treat, alleviate, reduce, and/or progress symptoms of a disease or condition for which the subject has been previously diagnosed, e.g., AD. can be used to delay the
本明細書で使用される、「対象」という用語は、哺乳類、例えば、げっ歯類、ネコ、イヌ、または霊長類を意味する。好ましくは、本発明の対象はヒトである。 As used herein, the term "subject" means a mammal, such as a rodent, cat, dog, or primate. Preferably, the subject of the present invention is human.
本明細書で使用される、「約」という用語は、「約」が修飾するもののプラスマイナス10パーセントを指す。 As used herein, the term "about" refers to plus or minus 10 percent of what "about" modifies.
認知症は、知的能力の損失及び/または記憶障害を特徴とする疾患である。認知症としては、例えば、AD、血管性認知症、レビー小体認知症、ピック病、前頭側頭認知症(FTD)、エイズによる認知症、加齢関連認知機能障害、及び加齢関連記憶障害が挙げられる。認知症はまた、神経学的及び/または精神状態、例えば、脳腫瘍、脳障害、てんかん、多発性硬化症、ダウン症候群、レット症候群、進行性核上まひ、前頭葉症候群、統合失調症、及び外傷性脳損傷とも関連している場合がある。 Dementia is a disease characterized by loss of intellectual capacity and/or memory impairment. Dementia includes, for example, AD, vascular dementia, Lewy body dementia, Pick's disease, frontotemporal dementia (FTD), dementia due to AIDS, age-related cognitive impairment, and age-related memory impairment. are mentioned. Dementia also includes neurological and/or psychiatric conditions such as brain tumors, brain disorders, epilepsy, multiple sclerosis, Down's syndrome, Rett's syndrome, progressive supranuclear palsy, frontal lobe syndrome, schizophrenia, and traumatic It may also be associated with brain injury.
ADは、先進国において最も頻度の高い神経変性疾患である。ADは、Aβペプチドからなるアミロイド斑及びタウタンパク質からなるNFTの蓄積を特徴とし得る。臨床的に、ADは、記憶、機能、言語能力、判断、及び実行機能の損失を特徴とする進行性認知障害と関連している。ADは、多くの場合、その後期に深刻な行動上の症状をもたらす。 AD is the most common neurodegenerative disease in developed countries. AD can be characterized by accumulation of amyloid plaques consisting of Aβ peptide and NFTs consisting of tau protein. Clinically, AD is associated with progressive cognitive impairment characterized by loss of memory, function, verbal skills, judgment, and executive function. AD often leads to severe behavioral symptoms later in life.
血管性認知症は、脳血管性認知症とも呼ばれる場合があり、概して改善期間及び段階的悪化を伴う変動する経過を有する脳血管障害(例えば、大脳半球の梗塞)を指す。血管性認知症は、見当識障害、記憶障害、及び/または判断力の低下の1つ以上の症状を含む場合がある。血管性認知症は、別々の複数の梗塞によって引き起こされる可能性も、他の血管要因、例えば、自己免疫性血管炎、例えば、全身性エリテマトーデスに見られるもの、感染性血管炎、例えば、ライム病、再発性脳内出血、及び/または脳卒中等によって引き起こされる可能性もある。 Vascular dementia, also sometimes referred to as cerebrovascular dementia, refers to cerebrovascular disorders (eg, hemispheric infarctions) that generally have a variable course with periods of improvement and gradual deterioration. Vascular dementia may include one or more symptoms of disorientation, memory impairment, and/or poor judgment. Vascular dementia can be caused by multiple separate infarcts, as well as other vascular factors, such as autoimmune vasculitis, such as that seen in systemic lupus erythematosus, infectious vasculitis, such as Lyme disease. , recurrent intracerebral hemorrhage, and/or stroke.
前頭側頭認知症(FTD)は、進行性の神経変性障害である。FTDの対象は、一般に顕著な行動変化及び人格変化を示し、多くの場合言語機能障害を伴う。 Frontotemporal dementia (FTD) is a progressive neurodegenerative disorder. Subjects with FTD generally exhibit marked behavioral and personality changes, often accompanied by language impairment.
レビー小体認知症は、ADのものと重複する特徴を有する認知症発現、パーキンソン病の特徴の発現、及び/または幻覚の早期発現の1つ以上の症状を特徴とする。レビー小体認知症は、一般に症状の重症度の日々の変動を特徴とする。 Lewy body dementia is characterized by one or more symptoms of dementia episodes with features overlapping those of AD, episodes of Parkinson's disease features, and/or early episodes of hallucinations. Lewy body dementia is generally characterized by daily fluctuations in symptom severity.
いくつかの態様において、本開示は、当該対象の脳において同期ガンマ振動を誘導することを含む、対象における認知症を予防、軽減、及び/または治療するための方法を提供する。いくつかの実施形態では、神経疾患もしくは障害または加齢に伴う低下を抱える対象におけるガンマ振動の誘導は、該疾患もしくは障害または加齢に伴う低下の結果として、またはそれに関連して該対象において破壊されたガンマ振動リズムを回復するように作用する。 In some aspects, the present disclosure provides methods for preventing, reducing, and/or treating dementia in a subject comprising inducing synchronous gamma oscillations in the subject's brain. In some embodiments, the induction of gamma oscillations in a subject with a neurological disease or disorder or age-related decline is disrupted in the subject as a result of or in connection with said disease or disorder or age-related decline. acts to restore the normalized gamma oscillatory rhythm.
いくつかの実施形態では、ガンマ振動の誘導は、アイソフォームAβ1-40及びAβ1-42の産生を低減する。いくつかの実施形態では、ガンマ振動の誘導は、対象の脳からのAβ(例えば、アイソフォームAβ1-40及びAβ1-42)のクリアランスを高める。いくつかの実施形態では、ガンマ振動の誘導は、対象の脳においてAβの蓄積を防止する。いくつかの実施形態では、本明細書に提供する方法は、対象の脳におけるAβのレベルを、治療前の該対象の脳におけるAβのレベルと比較して、約10%、約20%、約30%、約40%、約50%、約60%、約70%、またはそれ以上低減する。いくつかの実施形態では、対象の脳におけるAβのレベルは、治療前の該対象の脳におけるAβのレベルと比較して、少なくとも約50%低減される。 In some embodiments, induction of gamma oscillations reduces production of isoforms Aβ 1-40 and Aβ 1-42 . In some embodiments, induction of gamma oscillations enhances clearance of Aβ (eg, isoforms Aβ 1-40 and Aβ 1-42 ) from the subject's brain. In some embodiments, induction of gamma oscillations prevents accumulation of Aβ in the subject's brain. In some embodiments, the methods provided herein reduce the level of Aβ in the brain of the subject by about 10%, about 20%, about Reduce by 30%, about 40%, about 50%, about 60%, about 70%, or more. In some embodiments, the level of Aβ in the subject's brain is reduced by at least about 50% compared to the level of Aβ in the subject's brain prior to treatment.
いくつかの実施形態では、対象の脳におけるAβのレベルは、該対象の脳におけるAPPの切断の減少によって低減される。いくつかの実施形態では、本明細書に提供する方法は、対象の脳におけるAPPの切断を、治療前の該対象の脳におけるAPP切断のレベルと比較して、約10%、約20%、約30%、約40%、約50%、約60%、約70%、またはそれ以上低減する。いくつかの実施形態では、対象の脳におけるAPP切断のレベルは、治療前の該対象の脳におけるAPP切断のレベルと比較して、少なくとも約50%低減される。いくつかの実施形態では、APP切断のレベルは、対象の脳におけるC末端断片β(β-CTF)のレベルによって測定される。いくつかの実施形態では、脳におけるAPP切断のレベルは、β及び/またはγセクレターゼの阻害によって、例えば、β及び/またはγセクレターゼ活性の阻害のレベルを増大させることによって低減される。いくつかの実施形態では、本明細書に提供する方法は、対象の脳におけるAβ斑の凝集を低減する。 In some embodiments, levels of Aβ in the brain of the subject are reduced by reducing cleavage of APP in the brain of the subject. In some embodiments, the methods provided herein reduce APP cleavage in the brain of a subject by about 10%, about 20%, Reduce by about 30%, about 40%, about 50%, about 60%, about 70%, or more. In some embodiments, the level of APP cleavage in the subject's brain is reduced by at least about 50% compared to the level of APP cleavage in the subject's brain prior to treatment. In some embodiments, the level of APP cleavage is measured by the level of C-terminal fragment β (β-CTF) in the subject's brain. In some embodiments, the level of APP cleavage in the brain is reduced by inhibition of β and/or γ secretase, eg, by increasing the level of inhibition of β and/or γ secretase activity. In some embodiments, the methods provided herein reduce aggregation of Aβ plaques in the brain of a subject.
いくつかの実施形態では、該方法は、対象における認知能力及び/または記憶を改善する。 In some embodiments, the method improves cognitive performance and/or memory in the subject.
別の態様において、本開示は、当該対象の脳において同期ガンマ振動を誘導することを含む、対象の脳における神経保護プロファイルまたは神経保護環境を誘導するための方法を提供する。例えば、いくつかの実施形態では、該神経保護プロファイルは、神経保護ミクログリア細胞プロファイルと関連している。さらなる実施形態では、該神経保護プロファイルは、M-CSF経路の活性の増加によって誘導されるか、または、これと関連している。いくつかの実施形態では、該神経保護環境は、抗炎症シグナル伝達経路と関連している。例えば、いくつかの実施形態では、該抗炎症シグナル伝達経路は、抗炎症ミクログリアシグナル伝達経路である。 In another aspect, the present disclosure provides methods for inducing a neuroprotective profile or environment in the brain of a subject comprising inducing synchronous gamma oscillations in the brain of the subject. For example, in some embodiments the neuroprotective profile is associated with a neuroprotective microglial cell profile. In a further embodiment, said neuroprotective profile is induced by or associated with increased activity of the M-CSF pathway. In some embodiments, the neuroprotective environment is associated with anti-inflammatory signaling pathways. For example, in some embodiments, the anti-inflammatory signaling pathway is an anti-inflammatory microglial signaling pathway.
いくつかの実施形態では、該神経保護プロファイルは、炎症性グリア細胞活性の減少または不足と関連している。炎症性グリア細胞活性は、ミクログリアのM1表現型と関連し、酸素の反応種(ROS)、神経分泌タンパク質クロモグラニンA、分泌補助因子シスタチンC、NADPHオキシダーゼ、一酸化窒素シンターゼ酵素、例えばiNOS、NF-κB依存性炎症応答タンパク質、ならびに炎症性サイトカイン及びケモカイン(例えば、TNF、IL-1β、IL-6、及びIFNγ)の産生を含む。 In some embodiments, said neuroprotective profile is associated with reduced or absent inflammatory glial cell activity. Inflammatory glial cell activity is associated with the M1 phenotype of microglia, oxygen reactive species (ROS), neurosecretory protein chromogranin A, cosecretory cystatin C, NADPH oxidase, nitric oxide synthase enzymes such as iNOS, NF- Involves the production of κB-dependent inflammatory response proteins, as well as inflammatory cytokines and chemokines such as TNF, IL-1β, IL-6, and IFNγ.
対照的に、ミクログリアのM2表現型は、炎症の下方制御及び炎症誘発損傷の修復と関連している。抗炎症性サイトカイン及びケモカイン(IL-4、IL-3、IL-10、及び/またはTGFβ)ならびに食作用活性の増大は、M2表現型と関連している。従って、いくつかの実施形態では、本明細書に提供する方法は、ミクログリアにおける神経保護M2表現型を誘発する。いくつかの実施形態では、本明細書に提供する方法は、対象の脳における食作用活性を増大する。例えば、いくつかの実施形態では、本明細書に提供する方法は、Aβのクリアランスが増加するようにミクログリアの食作用活性を増大する。 In contrast, the M2 phenotype of microglia is associated with down-regulation of inflammation and repair of inflammation-induced damage. Increased anti-inflammatory cytokines and chemokines (IL-4, IL-3, IL-10, and/or TGFβ) and phagocytic activity are associated with the M2 phenotype. Thus, in some embodiments, the methods provided herein induce a neuroprotective M2 phenotype in microglia. In some embodiments, the methods provided herein increase phagocytic activity in the subject's brain. For example, in some embodiments, the methods provided herein increase microglial phagocytic activity such that clearance of Aβ is increased.
ガンマ振動は、約20Hz~約100Hzを含み得る。従って、いくつかの実施形態では、本開示は、当該対象の脳において、約20Hz~約100Hz、もしくは約20Hz~約80Hz、もしくは約20Hz~約50Hz、もしくは約30~約60Hz、もしくは約35Hz~約45Hz、または約40Hzのガンマ振動を誘導することを含む、対象における認知症を予防、軽減、または治療するための方法を提供する。好ましくは、該ガンマ振動は、約40Hzである。 Gamma oscillations can include about 20 Hz to about 100 Hz. Thus, in some embodiments, the present disclosure provides a frequency of about 20 Hz to about 100 Hz, or about 20 Hz to about 80 Hz, or about 20 Hz to about 50 Hz, or about 30 to about 60 Hz, or about 35 Hz to about 35 Hz in the brain of the subject. Methods are provided for preventing, reducing, or treating dementia in a subject comprising inducing gamma oscillations of about 45 Hz, or about 40 Hz. Preferably, the gamma oscillations are around 40 Hz.
刺激は、少なくとも1つの脳領域においてガンマ振動を直接または最終的に誘導する、対象の内部もしくは外部環境における検出可能な変化を含み得る。例えば、刺激は、電磁放射線受容器(例えば、光受容器、赤外線受容器、及び/または紫外線受容器)、機械受容器(例えば、機械的ストレス及び/または歪)、侵害受容器(例えば、痛み)、音受容器、電気受容器(例えば、電場)、磁気受容器(例えば、磁場)、水受容器、化学受容器、温度受容器、浸透圧受容器、及び/または自己受容器(すなわち、位置感覚)を刺激するように設計され得る。受容器からの反応を誘発するために必要な感覚の絶対閾値または最小量は、刺激のタイプと対象によって異なり得る。いくつかの実施形態では、刺激は、個々の感度に基づいて適応される。 A stimulus can include a detectable change in the subject's internal or external environment that directly or ultimately induces gamma oscillations in at least one brain region. For example, the stimulus may be an electromagnetic radiation receptor (e.g., photoreceptor, infrared receptor, and/or ultraviolet receptor), a mechanoreceptor (e.g., mechanical stress and/or strain), a nociceptor (e.g., pain ), sound receptors, electroreceptors (e.g., electric field), magnetoreceptors (e.g., magnetic field), water receptors, chemoreceptors, thermoreceptors, osmoreceptors, and/or autoreceptors (i.e., location senses). The absolute threshold or minimum amount of sensation required to elicit a response from a receptor can vary depending on the type of stimulus and subject. In some embodiments, stimulation is adapted based on individual sensitivity.
いくつかの実施形態では、ガンマ振動は、脳領域特異的に誘導される。例えば、いくつかの実施形態では、ガンマ振動は、海馬、視覚野、バレル皮質、聴覚野、またはそれらの任意の組み合わせにおいて誘導される。一例として、いくつかの実施形態では、ガンマ振動は、閃光を用いて視覚野において誘導され、他の実施形態では、ガンマ振動は、特定の周波数の聴覚刺激を用いて聴覚野において誘導される。いくつかの実施形態では、ガンマ振動は、視覚、聴覚、及び/または他の刺激の組合せを用いて複数の脳領域で同時に誘導される。いくつかの実施形態では、ガンマ振動は、仮想現実システムで誘導される。 In some embodiments, gamma oscillations are induced in a brain region-specific manner. For example, in some embodiments gamma oscillations are induced in the hippocampus, visual cortex, barrel cortex, auditory cortex, or any combination thereof. As an example, in some embodiments gamma oscillations are induced in the visual cortex using a flash of light, and in other embodiments gamma oscillations are induced in the auditory cortex using an auditory stimulus of a particular frequency. In some embodiments, gamma oscillations are simultaneously induced in multiple brain regions using a combination of visual, auditory, and/or other stimuli. In some embodiments, gamma oscillations are induced in a virtual reality system.
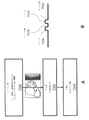
いくつかの実施形態では、対象は、ガンマ振動を誘導するように構成された環境、例えば、無関係の刺激を受動的または能動的に遮断する(例えば、遮光もしくは雑音消去)チャンバーを介して刺激を受ける。代替的に、またはさらに、対象は、例えば、遮光または雑音消去の特徴を含むシステムを介して刺激を受けてもよい。いくつかの実施形態では、対象は、刺激放出装置、例えば、刺激を送るように設計された眼鏡類を介して視覚刺激を受ける。該装置は、他の光を遮断し得る。いくつかの実施形態では、対象は、刺激放出装置、例えば、刺激を送るように設計されたヘッドホンを介して聴覚刺激を受ける。該装置は、他の雑音を除去し得る。 In some embodiments, the subject receives the stimulus through an environment configured to induce gamma oscillations, e.g., a chamber that passively or actively blocks irrelevant stimuli (e.g., light-shielding or noise-canceling). receive. Alternatively or additionally, the subject may be stimulated via a system that includes, for example, shading or noise cancellation features. In some embodiments, the subject receives visual stimulation via a stimulus-releasing device, such as eyewear designed to deliver the stimulus. The device may block other light. In some embodiments, the subject receives auditory stimulation via a stimulus-releasing device, eg, headphones designed to deliver the stimulus. The device can remove other noise.
刺激を放出するための少なくとも1つのインタフェースに加えて、いくつかの実施形態は、少なくとも1つのプロセッサ(例えば、刺激を生成させ、該刺激の放出を制御し、該刺激の放出/結果を監視し、及び/または該刺激/結果に関するフィードバックを処理する)、少なくとも1つのメモリ(例えば、プロセッサが実行可能な命令、少なくとも1つの刺激、刺激生成指針、フィードバック、及び/または結果を保存する)、少なくとも1つの通信インタフェース(例えば、当該対象、ヘルスケア提供者、介護者、臨床研究調査員、データベース、監視アプリケーション等と通信する)、及び/または検出装置(例えば、該刺激及び/または該対象を検出し、ガンマ振動が誘導されているかどうか、対象の感受性、認知機能、物理的もしくは化学的変化、ストレス、安全性等を含む、該刺激及び/または該対象に関するフィードバックを与える)を具備する場合がある。 In addition to at least one interface for emitting stimuli, some embodiments include at least one processor (e.g., for generating stimuli, controlling the release of the stimuli, monitoring the release/result of the stimuli). , and/or processing feedback about the stimuli/results); A communication interface (e.g., to communicate with the subject, healthcare provider, caregiver, clinical research investigator, database, monitoring application, etc.) and/or detection device (e.g., to detect the stimulus and/or the subject). and provide feedback regarding the stimulus and/or the subject, including whether gamma oscillations are induced, subject sensitivity, cognitive function, physical or chemical changes, stress, safety, etc.). be.
いくつかの実施形態では、ガンマ振動は、約20Hz~約100Hzの閃光等の視覚刺激によって誘導される。特定の実施形態では、ガンマ振動は、約20Hz~約50Hzの閃光によって誘導される。さらなる実施形態では、ガンマ振動は、約35Hz~約45Hzの閃光によって誘導される。さらに別の実施形態では、ガンマ振動は、約40Hzの閃光によって誘導される。いくつかの実施形態では、対象は、約20Hz~約100Hzの閃光、もしくは約20Hz~約50Hzの閃光、もしくは約35Hz~約45Hzの閃光、または約40Hzの閃光を(例えば、発する遮光装置を備えたチャンバー内に配置されて、または、発する遮光装置を身に着けて)受ける。 In some embodiments, gamma oscillations are induced by visual stimuli such as flashes of light between about 20 Hz and about 100 Hz. In certain embodiments, gamma oscillations are induced by flashes of light between about 20 Hz and about 50 Hz. In a further embodiment, gamma oscillations are induced by flashes of light between about 35 Hz and about 45 Hz. In yet another embodiment, gamma oscillations are induced by flashes of light at about 40 Hz. In some embodiments, the subject is equipped with a shading device that emits flashes of light from about 20 Hz to about 100 Hz, or flashes from about 20 Hz to about 50 Hz, or flashes from about 35 Hz to about 45 Hz, or flashes of light from about 40 Hz (e.g., placed in a closed chamber or wearing a shading device that emits light).
いくつかの実施形態では、ガンマ振動は、周波数約20Hz~約100Hz、もしくは約20Hz~約80Hz、もしくは約20Hz~約50Hz、もしくは約35Hz~約45Hz、または約40Hzの音波等の聴覚刺激によって誘導される。いくつかの実施形態では、対象は、約20Hz~約100Hz、約20Hz~約80Hz、約20Hz~約50Hz、約35Hz~約45Hz、または約40Hzの聴覚刺激を(例えば、発する雑音消去装置を備えたチャンバー内に配置されて、または、発する雑音消去装置を身に着けて)受ける。 In some embodiments, the gamma oscillations are induced by an auditory stimulus such as sound waves with a frequency of about 20 Hz to about 100 Hz, or about 20 Hz to about 80 Hz, or about 20 Hz to about 50 Hz, or about 35 Hz to about 45 Hz, or about 40 Hz. be done. In some embodiments, the subject is provided with a noise canceling device that emits an auditory stimulus (e.g., about 20 Hz to about 100 Hz, about 20 Hz to about 80 Hz, about 20 Hz to about 50 Hz, about 35 Hz to about 45 Hz, or about 40 Hz). placed in a separate chamber or wearing a noise canceling device).
いくつかの実施形態では、対象は、約1時間、約2時間、約3時間、約4時間、約5時間、またはそれ以上の間、視覚及び/または聴覚刺激を(例えば、発する遮光装置を備えたチャンバー内に配置されて、または、発する遮光装置を身に着けて)受ける。いくつかの実施形態では、対象は、約6時間未満、約5時間未満、約4時間未満、約3時間未満、約2時間未満、または約1時間未満刺激を(例えば、発する遮光装置を備えたチャンバー内に配置されて、または、発する遮光装置を身に着けて)受ける。いくつかの実施形態では、対象は、1時間未満刺激を(例えば、発する遮光装置を備えたチャンバー内に配置されて、または、発する遮光装置を身に着けて)受ける。 In some embodiments, the subject is exposed to visual and/or auditory stimulation (e.g., a shading device that emits light for about 1 hour, about 2 hours, about 3 hours, about 4 hours, about 5 hours, or more). placed in a chamber equipped with or wearing a shading device that emits light). In some embodiments, the subject is provided with a shading device that emits stimulation (e.g., less than about 6 hours, less than about 5 hours, less than about 4 hours, less than about 3 hours, less than about 2 hours, or less than about 1 hour). placed in a closed chamber or wearing a shading device that emits light). In some embodiments, the subject receives stimulation (eg, placed in a chamber with an emitting shading device or wearing an emitting shading device) for less than 1 hour.
いくつかの実施形態では、対象は、本明細書に提供する方法を受ける。他の実施形態では、対象は、複数の別々の機会に本明細書に提供する方法で治療を受ける。対象は、定期的なスケジュールで、または症状が生じた時点もしくは悪化した時点で治療され得る。いくつかの実施形態では、長期的な治療は、可溶性のAβペプチド及び/または不溶性のAβペプチド(すなわち、斑)を低減するのに有効であり得る。 In some embodiments, the subject undergoes the methods provided herein. In other embodiments, the subject is treated with the methods provided herein on multiple separate occasions. Subjects can be treated on a regular schedule or when symptoms develop or worsen. In some embodiments, long-term treatment can be effective in reducing soluble and/or insoluble Aβ peptide (ie, plaques).
いくつかの実施形態では、ガンマ振動は、細胞型特異的に誘導される。いくつかの実施形態では、ガンマ振動は、FS-PV介在ニューロンにおいて誘導される。「ファスト・スパイキング」(FS)という用語は、ニューロンのクラスを説明するために用いられる場合、スパイクの高さにおいてスパイク周波数の適応や減衰がほとんどなく長期間高率でニューロンが放電する能力を指す。従って、これらのニューロンは、大幅な調節なしに持続する高周波数(例えば、約100Hzまたは約150Hzに等しいかそれより高い)の放電が可能である。FSニューロンのこの特性は、それらの、高速の遅延整流性チャネル、すなわち、非常に迅速に活性化及び不活性化するチャネルの発現に大部分起因する。 In some embodiments, gamma oscillations are induced in a cell-type specific manner. In some embodiments, gamma oscillations are induced in FS-PV interneurons. The term "fast spiking" (FS), when used to describe a class of neurons, refers to the ability of neurons to discharge at a high rate for long periods of time with little adaptation or decay of spike frequency in spike height. Point. Thus, these neurons are capable of sustained high-frequency (eg, equal to or higher than about 100 Hz or about 150 Hz) discharges without significant modulation. This property of FS neurons is due in large part to their expression of fast delayed rectifier channels, ie channels that activate and deactivate very quickly.
一態様において、刺激は非侵襲的であり得る。本明細書で使用される、「非侵襲的」という用語は、組成物もしくは装置の注入または移植等、身体の外科的介入または処置を必要としない装置、方法、及びシステムを指す。例えば、該刺激は、視覚(例えば、点滅光)、聴覚(例えば、音の振動)、及び/または触覚(力、振動、または動きを伴う機械的刺激)であり得る。 In one aspect, the stimulation can be non-invasive. As used herein, the term "non-invasive" refers to devices, methods, and systems that do not require surgical intervention or manipulation of the body, such as injection or implantation of a composition or device. For example, the stimulus can be visual (eg, flashing lights), auditory (eg, sound vibrations), and/or tactile (mechanical stimuli involving force, vibration, or movement).
別の態様において、刺激は侵襲的であるか、または少なくとも部分的に侵襲的であり得る。例えば、視覚、聴覚、及び/または触覚刺激は、組成物(例えば、感光性タンパク質)もしくは装置(例えば、集積光ファイバー及び固体光源)の注入または移植と組み合わせてもよい。 In another embodiment, the stimulation may be invasive or at least partially invasive. For example, visual, auditory, and/or tactile stimulation may be combined with injection or implantation of compositions (eg, photosensitive proteins) or devices (eg, integrated fiber optics and solid-state light sources).
実験データ
ガンマ振動は、5XFADマウスにおいて疾患早期の海馬SWR中に低下する。
ガンマの障害は、いくつかの神経及び精神障害における複数の脳領域で、ADのヒト患者における自発的ガンマ同期の低下を含め、観察されている。興味深いことに、自発的ガンマの低下はまた、2つのADのマウスモデル(ヒトアミロイド前駆体タンパク質(hAPP)Tgマウス及びアポリポタンパク質E4対立遺伝子(APOE4)ノックインマウス)においてインビボで、ならびにインビトロスライス試験では別のマウスモデル(Tg CRND8マウス)で見出されている。しかしながら、他のADのマウスモデルでガンマ振動が変化するかどうか、それが疾患の進行の早期に生じるかどうか、及びガンマの乱れが疾患の進行に影響を与えるかどうかは不明である。
Experimental Data Gamma oscillations are reduced during hippocampal SWR early in disease in 5XFAD mice.
Gamma impairments have been observed in multiple brain regions in several neurological and psychiatric disorders, including decreased spontaneous gamma synchrony in human patients with AD. Interestingly, spontaneous gamma depression was also observed in two mouse models of AD (human amyloid precursor protein (hAPP) Tg mice and apolipoprotein E4 allele (APOE4) knock-in mice) in vivo and in in vitro slice studies. Found in another mouse model (Tg CRND8 mice). However, it is unclear whether gamma oscillations are altered in other mouse models of AD, whether they occur early in disease progression, and whether gamma perturbation affects disease progression.
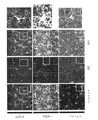
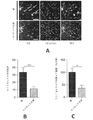
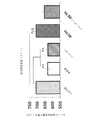
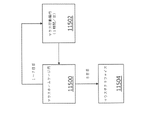
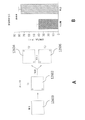
これらの問題に対処するため、覚醒行動5XFADマウス、すなわち、5つの家族性AD変異を有する確立されたADモデルからの神経活動を記録した。特に、5XFADマウスは、APP KM670/671NL(スウェーデン型)、APP I716V(フロリダ型)、APP V717I(ロンドン型)、PSEN1 M146L(A>C)、及びPSEN1 L286Vを含む家族性ADの5つの異なる対立遺伝子を発現する。従って、5XFADマウスを、ADのアミロイド病理のモデルとして用いた。いくつかの実施形態では、該神経活動は、ほぼ3か月齢のマウスから記録し、この時、それらはAβ値が上昇しているが、主要な斑の蓄積の開始ならびに学習及び記憶障害の発現の前である。図1は、いくつかの実施形態に従って、球状トレッドミル上の仮想直線迷路を走行するマウスを示す概略図である。摂食制限マウスは、球状トレッドミル上の仮想直線迷路を行き来することで報酬を得ることができる。 To address these issues, we recorded neural activity from awake-behavioral 5XFAD mice, an established AD model harboring five familial AD mutations. In particular, 5XFAD mice demonstrated five different alleles of familial AD, including APP KM670/671NL (Swedish), APP I716V (Florida), APP V717I (London), PSEN1 M146L (A > C), and PSEN1 L286V. express the gene. Therefore, 5XFAD mice were used as a model for the amyloid pathology of AD. In some embodiments, the neural activity is recorded from mice of approximately 3 months of age, when they have elevated Aβ levels, the onset of major plaque accumulation and the development of learning and memory deficits. before. FIG. 1 is a schematic diagram showing a mouse running a virtual linear maze on a spherical treadmill, according to some embodiments. Feed-restricted mice can be rewarded by traversing a virtual linear maze on a spherical treadmill.
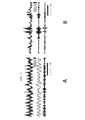
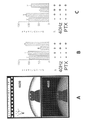
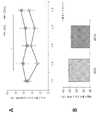
海馬小領域CA1から神経活動が記録され得る。図2A及び2Bは、いくつかの実施形態に従って、海馬CA1から記録された、シータ振動及び鋭波リップル(SWR)を示す電気トレースである。いくつかの実施形態では、CA1におけるガンマ振動は、図2Aに示すように、シータ振動(4~12Hz)が観察される走行中等の明らかな活動周期中、ならびに、図2Bに示すように、SWRが生じる静止及び探索行動中に存在し得る。 Neural activity can be recorded from hippocampal subregion CA1. 2A and 2B are electrical traces showing theta oscillations and sharp wave ripples (SWR) recorded from hippocampus CA1, according to some embodiments. In some embodiments, gamma oscillations in CA1 occur during periods of apparent activity such as during running when theta oscillations (4-12 Hz) are observed, as shown in FIG. 2A, and during SWR, as shown in FIG. 2B. may be present during resting and exploratory behavior where .
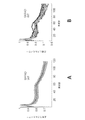
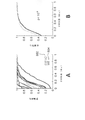
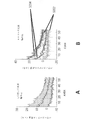
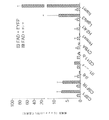
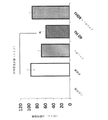
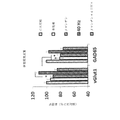
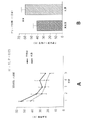
シータ振動中のパワースペクトル密度を調べたところ、5XFADマウスとWTの同腹仔間で低速ガンマパワー(20Hz~50Hzの範囲)において明らかな差は見られなかった。図3A及び3Bは、いくつかの実施形態に従って、3か月齢のTg 5XFAD及びWTマウスのシータ周期中の正規化されたパワースペクトルならびに正規化されたパワースペクトル密度の平均ならびに標準偏差を示すプロットである。図3Aは、3か月齢の5XFAD(n=6マウス)及びWT(n=6マウス)マウスのシータ周期中の正規化されたパワースペクトルの平均ならびに標準偏差を示す。いくつかの実施形態では、各動物のパワースペクトル密度は、そのピーク(シータ中)に正規化される場合がある。図3Bは、3か月齢の5XFAD(n=6マウス)及びWT(n=6マウス)マウスのシータ周期中の正規化されたパワースペクトル密度を示す。 Examination of the power spectral density during theta oscillations revealed no obvious difference in slow gamma power (ranging from 20 Hz to 50 Hz) between 5XFAD mice and WT littermates. 3A and 3B are plots showing the normalized power spectra and the mean and standard deviation of the normalized power spectral densities during the theta cycles of 3-month-old Tg 5XFAD and WT mice, according to some embodiments. be. FIG. 3A shows the mean and standard deviation of normalized power spectra during theta cycles of 3-month-old 5XFAD (n=6 mice) and WT (n=6 mice) mice. In some embodiments, each animal's power spectral density may be normalized to its peak (in theta). FIG. 3B shows normalized power spectral densities during theta cycles of 3-month-old 5XFAD (n=6 mice) and WT (n=6 mice) mice.
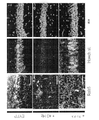
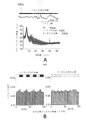
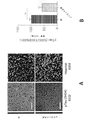
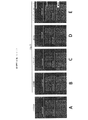
次のステップとして、いくつかの実施形態では、SWR中のガンマ振動、すなわち、約50~100ミリ秒続く150~250Hzの高周波振動を調べた。SWRは、スパイキング活動のパターンが海馬をわたってリプレイされる集団的活動のバーストと関連している。先行研究で、低速ガンマは、SWR中に上昇し、CA3とCA1の間同期していることが示されている。結果として、これらの海馬小領域をわたるニューロンは、ニューロンがガンマに位相同期されて発火する可能性が高いため、SWR中に共に発火する傾向にある。SWR(約150Hz~約250Hzであるリップルバンドにおけるパワーが平均の上側4標準偏差を超えた時の周期として定義される)を特定し、これらSWR中に周波数の範囲をわたるパワーを調べるためにスペクトログラムをプロットした。スペクトログラムにおいて、SWRの特徴である高周波振動を示す100Hzより上のパワーの上昇、ならびに、ガンマパワーの同時に起こる上昇を示す約50Hz未満のパワーの上昇が観察され得る。 As a next step, some embodiments investigated gamma oscillations during SWR, ie, high frequency oscillations of 150-250 Hz lasting about 50-100 milliseconds. SWR is associated with bursts of collective activity in which patterns of spiking activity are replayed across the hippocampus. Previous studies have shown that slow gamma rises during SWR and is synchronized between CA3 and CA1. As a result, neurons across these hippocampal subregions tend to fire together during SWR because neurons are more likely to fire phase-locked to gamma. Spectrogram to identify SWRs (defined as the period when the power in the ripple band, which is about 150 Hz to about 250 Hz, exceeds the upper four standard deviations of the mean) and examine the power over a range of frequencies during these SWRs. was plotted. In the spectrogram, an increase in power above 100 Hz indicative of the high frequency oscillations characteristic of SWR, as well as an increase in power below about 50 Hz indicative of a concomitant increase in gamma power can be observed.
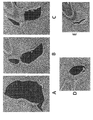
図4A及び4Bは、いくつかの実施形態に従って、WTマウス及び5XFADマウスのSWRを示すスペクトログラムである。図4Aは、1匹のWTマウスの平均SWRトリガスペクトログラムが、右側のプロットにおいて拡大された周波数80Hz未満のSWR404中、ガンマ帯域402の増加を示すことを示している。図4Bは、1匹の5XFADマウスの平均SWRトリガスペクトログラムが、SWR中にガンマ帯域の増加を示すが、この増加は、図4Aで示されるWTマウスにおけるよりも低いことを示している。
4A and 4B are spectrograms showing SWR of WT and 5XFAD mice, according to some embodiments. FIG. 4A shows that the average SWR-triggered spectrogram of one WT mouse shows an increase in the
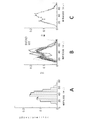
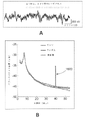
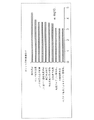
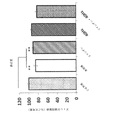
いくつかの実施形態では、本試験は、これらの低速振動(10~50Hzの範囲、本明細書でさらに説明される通り)の瞬時周波数が、40Hzを中心とする単峰型分布であることを見出した。図5A~5Cは、いくつかの実施形態に従って、SWR中の瞬時ガンマ周波数の分布を示すプロットである。図5Aは、40Hz付近の図4Aのピークで示された同じマウスのSWR中の瞬時ガンマ周波数の分布を示す(n=370SWR)。図5Bは、5XFAD及びWTマウスのSWR中の瞬時ガンマ周波数の分布が、各記録期間について40Hz付近の分布を示すことを示し、図5Cは、平均及び動物間の平均の標準誤差(SEM)を示す(6匹の5XFAD動物では、期間当たりガンマサイクルn=820、800、679、38、1875、57、及び6匹のWT動物では、期間当たりガンマサイクル181、1075、919、1622、51、1860、1903)。 In some embodiments, this test shows that the instantaneous frequencies of these slow oscillations (ranging from 10-50 Hz, as further described herein) have a unimodal distribution centered at 40 Hz. Found it. 5A-5C are plots showing the distribution of instantaneous gamma frequencies during SWR, according to some embodiments. FIG. 5A shows the distribution of instantaneous gamma frequencies during the SWR of the same mouse indicated by the peak in FIG. 4A around 40 Hz (n=370 SWR). FIG. 5B shows the distribution of instantaneous gamma frequencies during SWR of 5XFAD and WT mice showing a distribution around 40 Hz for each recording period, and FIG. (n = 820, 800, 679, 38, 1875, 57 gamma cycles per period in 6 5XFAD animals and 181, 1075, 919, 1622, 51, 1860 gamma cycles per period in 6 WT animals). , 1903).
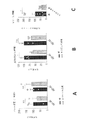
いくつかの実施形態では、WTマウスのSWR中のこれらガンマ振動を、その後5XFADの同腹仔におけるものと比較したところ、SWR中のガンマにおいて障害が見出された。5XFADマウスにおいてSWR中にベースラインからガンマパワーは増加したが、本明細書でさらに説明する通り、SWR中のガンマパワーは、5XFADでは、WTマウスより有意に小さかった。 In some embodiments, these gamma oscillations during SWR of WT mice were then compared to those in 5XFAD littermates and a disturbance in gamma during SWR was found. Although gamma power increased from baseline during SWR in 5XFAD mice, gamma power during SWR was significantly less in 5XFAD than in WT mice, as described further herein.
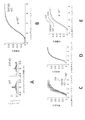
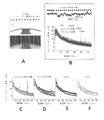
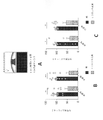
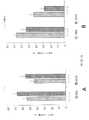
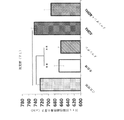
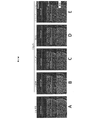
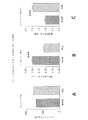
図6Aは、いくつかの実施形態に従って、それぞれ、5XFAD及びWTマウスにおけるSWRのピークからの時間の関数としてzスコアのガンマパワーを示す一連のグラフである。図6Aは、平均及びSEMを示し、SWR中のガンマパワーの増加をベースラインに対して示している。 FIG. 6A is a series of graphs showing gamma power of z-scores as a function of time from peak SWR in 5XFAD and WT mice, respectively, according to some embodiments. FIG. 6A shows the mean and SEM showing the increase in gamma power during SWR versus baseline.
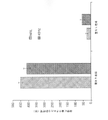
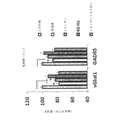
図6Bは、いくつかの実施形態に従って、5XFAD及びWTマウスにおけるSWR中のガンマパワーの累積分布を示すプロットである。SWR中のガンマパワーの累積分布は、5XFADにおいて、WTマウスよりも有意に小さい増加を示す(順位和検定、p<10-5、6匹の5XFADマウスでn=2166SWR及び6匹のWTマウスで3085SWR、5XFADマウスのzスコア中央値1.02(0.39~1.87、第一四分位数~第三四分位数)及びWTマウスのzスコア中央値1.18(0.53~2.15、第一四分位数~第三四分位数))。 FIG. 6B is a plot showing the cumulative distribution of gamma power during SWR in 5XFAD and WT mice, according to some embodiments. Cumulative distribution of gamma power during SWR shows a significantly smaller increase in 5XFAD than in WT mice (rank sum test, p<10 −5 , n=2166 SWR in 6 5XFAD mice and 6 SWR in 6 WT mice). 3085SWR, median z-score of 1.02 (0.39-1.87, first to third quartile) for 5XFAD mice and median z-score of 1.18 (0.53 ~2.15, 1st quartile to 3rd quartile)).
図6C及び6Dは、いくつかの実施形態に従って、WTマウス606及び5XFADマウス608のSWRのピークを中心にして100ミリ秒の間のzスコアのガンマパワーの累積分布を示すプロットならびに平均及び動物間のSEM(網掛け)である(6匹の5XFAD動物では、期間当たりSWR n=514、358、430、22、805、37及び6匹のWT動物では、期間当たりSWR82、311、370、776、18、710、818)。
6C and 6D are plots showing the cumulative distribution of z-score gamma power over 100 milliseconds centered around the peak of the SWR of
図6Eは、いくつかの実施形態に従って、WTマウス614及び5XFADマウス616における大きなSWRのピークを中心にして100ミリ秒の間のzスコアのガンマパワーの累積分布を示すプロットである(検知閾値は平均の上側6標準偏差を上回る)。本明細書でさらに説明する通り、正規分布しなかったデータに対して順位和検定を通して行った。図6Eは、WTマウス614及び5XFADマウス616において有意に小さい増加を示す(順位和検定、p<10-5、6匹の5XFADマウスではn=1000SWR及び6匹のWTマウスでは1467SWR)。
FIG. 6E is a plot showing the cumulative distribution of z-score gamma power over 100 milliseconds centered around the large SWR peak in
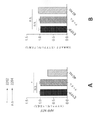
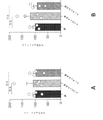
いくつかの実施形態では、スパイキングは、両群においてこれらのガンマ振動によって位相変調されたが、ガンマ位相によるスパイキングの変調は、5XFADではWT動物よりも弱かった。本試験は、変調の深さが、5XFADでWT動物よりも有意に小さい可能性があることを示した。 In some embodiments, spiking was phase modulated by these gamma oscillations in both groups, but modulation of spiking by gamma phase was weaker in 5XFAD than in WT animals. This study showed that the depth of modulation may be significantly less at 5XFAD than in WT animals.
いくつかの実施形態に従って、3か月齢の5XFAD(n=6マウス)及びWT(n=6マウス)マウスのSWR中、図7Aは、ガンマ振動位相の関数としてのスパイクの割合を示すプロットであり、図7Bは、ガンマ位相の関数としてのSWR中のスパイキングの変調の深さを示すプロットである(順位和検定、ブートストラップ法、p<10-5、これは多重比較の調節の際に重要である。5XFADスパイク-ガンマ位相分布n=2500及びWT分布3000、5XFADマウスの変調の深さの中央値0.35(0.21~0.44、第一四分位数~第三四分位数)ならびにWTマウスの変調の深さの中央値0.38(0.29~0.47、第一四分位数~第三四分位数))。エラーバーは、平均+/-SEMを示す。プロット704は、スパイキングの変調の深さのヒストグラムを示す。 FIG. 7A is a plot showing the percentage of spikes as a function of gamma oscillation phase during SWR of 3-month-old 5XFAD (n=6 mice) and WT (n=6 mice) mice, according to some embodiments. , FIG. 7B is a plot showing the depth of modulation of spiking during SWR as a function of gamma phase (rank sum test, bootstrap method, p<10 −5 , which upon adjustment for multiple comparisons 5XFAD spike-gamma phase distribution n=2500 and WT distribution 3000, median depth of modulation of 5XFAD mice 0.35 (0.21-0.44, 1st quartile to 34th quantile) and median depth of modulation in WT mice 0.38 (0.29-0.47, 1st quartile to 3rd quartile)). Error bars indicate mean +/- SEM. Plot 704 shows a histogram of spiking modulation depth.
図7C及び7Dは、いくつかの実施形態に従って、5XFAD及びWT動物の各動物についてのガンマ振動の位相の関数としてのSWR中の海馬CA1におけるスパイクの割合ならびに平均及び動物間のSEMを示すプロットである(6匹の5XFAD動物では、SWR中、期間当たりスパイクn=2475、1060、3092、25、6521、123及び6匹のWT動物では、SWR中、期間当たりスパイク360、4741、1564、2961、88、3058、4270)。 7C and 7D are plots showing the percentage of spikes in hippocampal CA1 during SWR and the mean and between-animal SEM as a function of the phase of gamma oscillations for each of the 5XFAD and WT animals, according to some embodiments. (n=2475, 1060, 3092, 25, 6521, 123 spikes per period during SWR in 6 5XFAD animals and 360, 4741, 1564, 2961 spikes per period during SWR in 6 WT animals; 88, 3058, 4270).
いくつかの実施形態に従って、3か月齢の5XFAD(n=6マウス)及びWT(n=6マウス)マウスの大きなSWR(検知閾値は平均の上側6標準偏差を上回る。本明細書でさらに説明される)中、図7Eは、ガンマ振動の位相の関数としてのスパイクの割合を示すプロットであり、図7Fは、スパイキングの変調の深さを示すプロットである(順位和検定、ブートストラップ法、1つのアスタリスクはp<10-10を示し、5XFADスパイク-ガンマ位相分布n=2500及びWT分布3000)。エラーバーは、平均+/-SEMを示す。 According to some embodiments, the large SWR (detection threshold above 6 standard deviations above the mean) of 3-month-old 5XFAD (n=6 mice) and WT (n=6 mice) mice is further described herein. 7E is a plot showing the fraction of spikes as a function of the phase of gamma oscillations, and FIG. 7F is a plot showing the depth of modulation of spiking (rank sum test, bootstrap method, One asterisk indicates p<10 −10 , 5XFAD spike-gamma phase distribution n=2500 and WT distribution 3000). Error bars indicate mean +/- SEM.
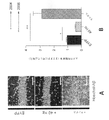
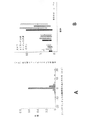
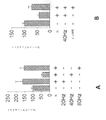
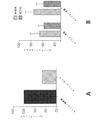
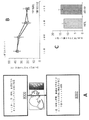
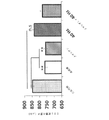
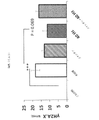
本試験はまた、非シータ周期において、5XFADマウスではWTと比較して時間当たりのSWRが少ない可能性があることも見出した(順位和検定、p<10-5、6匹の5XFADでは非シータ周期n=634及び6匹のWTマウスでは非シータ周期750、5XFADマウスの中央値0.07Hz(0~0.17、第一四分位数~第三四分位数)ならびにWTマウスの中央値0.12Hz(0~0.24、第一四分位数~第三四分位数))、上述したように、ガンマパワーが上昇する場合さらに該周期は減少する)。
The present study also found that 5XFAD mice may have less SWR per hour compared to WT in non-theta cycles (rank sum test, p<10 −5 , 6 5XFAD in non-theta cycles). Cycle n=634 and
図8A及び8Bは、いくつかの実施形態に従って、5XFADマウス802及びWTマウス804の動物で、各動物(図8A)及び合わせたすべての動物(図8B)に関する非シータ周期当たりのSWR率を示すプロットである(順位和検定、p<10-10、6匹の5XFAD動物では、期間当たり非シータ周期n=117、210、151、55、100、1及び6匹のWT動物では、期間当たり非シータ周期80、68、115、95、15、159、218)。これらの結果は、主要なアミロイド斑の蓄積の発達及び認知障害の証拠の前のADのマウスモデルにおいて、ガンマ振動及び海馬CA1スパイキングの変調の障害を明らかにする。
8A and 8B show the SWR rate per non-theta cycle for each animal (FIG. 8A) and all animals combined (FIG. 8B) in
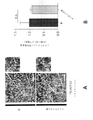
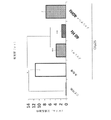
ガンマ周波数でのFS-PV介在ニューロンの光遺伝学的刺激は、海馬のCA1領域においてガンマ振動を駆動した。
ADの本マウスモデルにおける当該疾患の進行の初期のSWR中のガンマ障害の所見で、ガンマ振動がADの分子及び細胞病態生理に影響を与え得るかどうかという疑問が生じる。それを試験するため、2.5か月齢の5XFAD/PV-Cre二重トランスジェニックマウスの海馬CA1のFS-PV介在ニューロンにおいて、二重floxed逆方向オープン・リーディング・フレーム(DIO)ChR2-EYFPアデノ随伴ウイルス(AAV)を用い、Cre依存的にChR2を発現させることによって、ガンマ振動を光遺伝学的に駆動した。試験を実施し、マウスの海馬ガンマ振動の遺伝子誘導がADのマウスモデルの分子病理に影響を与えるかどうかを確認した。海馬ガンマ振動は、覚醒行動WT及び5XFADマウスにおいて遺伝子学的に誘導された。
Optogenetic stimulation of FS-PV interneurons at gamma frequencies drove gamma oscillations in the CA1 region of the hippocampus.
The observation of gamma disturbances during SWR early in the progression of the disease in this mouse model of AD raises the question whether gamma oscillations can influence the molecular and cellular pathophysiology of AD. To test it, we tested double-floxed inverted open reading frame (DIO) ChR2-EYFP adenoviruses in FS-PV interneurons of hippocampal CA1 of 2.5 month old 5XFAD/PV-Cre double transgenic mice. Gamma oscillations were optogenetically driven by expressing ChR2 in a Cre-dependent manner using an associated virus (AAV). Studies were performed to determine whether gene induction of hippocampal gamma oscillations in mice affects the molecular pathology of mouse models of AD. Hippocampal gamma oscillations were genetically induced in awake behavioral WT and 5XFAD mice.
EF1αプロモーターによって駆動される高感度黄色蛍光タンパク質(EYFP)に結合された二重floxed、逆方向オープン・リーディング・フレーム(DIO)ChR2を備えたアデノ随伴ウイルス(すなわち、AAV5ウイルス)を作製した。図9は、いくつかの実施形態に従って、対象の脳における特定の細胞型の活性化を調節するためのウイルスベクター(すなわち、AAV5-DIO-ChR2-EYFP)を示す概略図である。ウイルス発現は、細胞型特異的に海馬のCA1領域を標的とした。Creリコンビナーゼの存在下、2つの不和合性loxPバリアントのうちの1つが反転してChR2の発現を可能にする。 An adeno-associated virus (ie, AAV5 virus) was generated with a double-floxed, inverted open reading frame (DIO) ChR2 bound to an enhanced yellow fluorescent protein (EYFP) driven by the EF1α promoter. FIG. 9 is a schematic diagram showing a viral vector (ie, AAV5-DIO-ChR2-EYFP) for modulating activation of specific cell types in the brain of a subject, according to some embodiments. Viral expression targeted the CA1 region of the hippocampus in a cell type-specific manner. In the presence of Cre recombinase, one of the two incompatible loxP variants is inverted to allow expression of ChR2.
5XFADマウスの海馬のCA1領域は、ウイルス感染の正確な局所的標的化を可能にする定位ウイルス注入法を用い、AAV-DIO-ChR2-EYFPまたはEYFp単独構築物のいずれかで感染させた。1つの実施形態では、注入時、光ファイバーケーブル(白色バー)を含むフェルールを、標的とする脳領域の上側約0.3mmに設置した。マウスが回復し、PV細胞でウイルスが発現する時間を与えた2週間後、CA1介在ニューロンを、光遺伝学的に操作した。 The CA1 region of the hippocampus of 5XFAD mice was infected with either AAV-DIO-ChR2-EYFP or EYFp alone constructs using a stereotaxic viral injection method that allows precise local targeting of viral infection. In one embodiment, the ferrule containing the fiber optic cable (white bar) was placed approximately 0.3 mm above the targeted brain region during injection. Two weeks after mice had recovered and allowed time for virus expression in PV cells, CA1 interneurons were optogenetically manipulated.
図10A及び10Bは、いくつかの実施形態に従って、対象の海馬のCA1領域に対する信号送出を示す概略図である。図10Aでは、いくつかの実施形態に従って、海馬において光遺伝学によるガンマ刺激を受けながら、ボール上を走行して迷路を抜けるマウスが示されている。図10A及び10Bに示す矢印1000は、約40Hzで点滅して脳領域を活性化する青色光を示す。
10A and 10B are schematic diagrams showing signaling to the CA1 region of the hippocampus of a subject, according to some embodiments. FIG. 10A shows a mouse running on a ball and through a maze while receiving optogenetic gamma stimulation in the hippocampus, according to some embodiments.
この例では、200mWの493nmのDPSSレーザを、各端にファイバー・チャンネル/身体的接触コネクタを備えたパッチ・コードに接続した。実験中、約1mWの光刺激を約1時間送った。より具体的には、青色光(例えば、473nm)を、シータ(例えば、約8Hz)、ガンマ(例えば、約40Hz)を含む各種周波数で、また、ランダムに約40Hzで、海馬のCA1領域の直上に配置した光ファイバーを介して送った。いくつかの実施形態では、刺激条件を試験しなかった。いくつかの実施形態に従って、シータ条件は周波数対照の役割を果たし、ランダム条件は周期性の特異性を調整した。 In this example, a 200 mW 493 nm DPSS laser was connected to a patch cord with a fiber channel/physical contact connector on each end. Approximately 1 mW of light stimulus was delivered during the experiment for approximately 1 hour. More specifically, blue light (e.g., 473 nm) at various frequencies, including theta (e.g., about 8 Hz), gamma (e.g., about 40 Hz), and randomly at about 40 Hz, directly above the CA1 region of the hippocampus. was sent through an optical fiber placed in the In some embodiments, no stimulus conditions were tested. According to some embodiments, the theta condition served as a frequency control and the random condition adjusted for periodicity specificity.
1時間の刺激の完了後、脳組織を切断し、染色及び酵素結合免疫吸着アッセイ(ELISA)分析用に-80℃で凍結した。図11は、いくつかの実施形態に従って、ChR2及びDAPIを有する対象における神経組織の免疫染色を示す免疫蛍光画像である。この例では、図11は海馬においてDAPI(核)及びChR2染色を示している。 After completion of the 1 hour stimulation, brain tissue was sectioned and frozen at −80° C. for staining and enzyme-linked immunosorbent assay (ELISA) analysis. FIG. 11 is an immunofluorescence image showing immunostaining of neural tissue in a subject with ChR2 and DAPI, according to some embodiments. In this example, Figure 11 shows DAPI (nuclear) and ChR2 staining in the hippocampus.
図12Aは、いくつかの実施形態に従って、PV+介在ニューロンで発現されたChR2-EYFPを示す免疫蛍光画像である。図12Aは、ChR2-EYFPが、3か月齢の5XFAD/PV-CreマウスのCA1のPV+介在ニューロンで強く発現したことを示している(スケールバー=100μm)。図12Bは、EYFP発現をPV+細胞でのみ示す、AAV DIO ChR2-EYFPを発現する3か月齢の5XFAD/PV-Cre CA1における抗EYFP及び抗PV抗体による免疫組織化学を示す一連の免疫蛍光画像である(スケールバー=50μm)。5XFADとWTマウスを比較するため、ChR2を5XFAD陰性同腹仔のFS-PV介在ニューロンで発現させた。光刺激の非特異的な影響に対する対照のため、EYFPのみを含む、AAV-DIOを発現する5XFAD/PV-Cre二重トランスジェニックマウスを用いた。これらのマウスでは、同一の遺伝的背景及び光送達条件で、光送達は光遺伝学的刺激をもたらさない。いくつかの実施形態では、40HzでのFS-PV介在ニューロンを2つの理由で選択した。第一に、先行研究では、40HzでのFS-PV介在ニューロンの駆動が、最大のLFP反応を引き起こしたことが示されている。第二に、いくつかの実施形態では、SWR中のガンマ障害が見出され、図5A~5Cに示すように、SWR中の瞬時ガンマ周波数が、40Hzを中心とした分布を形成した。いくつかの実施形態では、電気生理学的記録用に、40Hzの刺激周期を、無刺激の周期または本明細書でさらに説明する40Hzを中心としたポアソン分布から選択されるランダム化間隔で送られる刺激の周期とともに交互配置した。 FIG. 12A is an immunofluorescence image showing ChR2-EYFP expressed in PV+ interneurons, according to some embodiments. FIG. 12A shows that ChR2-EYFP was strongly expressed in CA1 PV+ interneurons of 3-month-old 5XFAD/PV-Cre mice (scale bar=100 μm). FIG. 12B is a series of immunofluorescence images showing immunohistochemistry with anti-EYFP and anti-PV antibodies in 3-month-old 5XFAD/PV-Cre CA1 expressing AAV DIO ChR2-EYFP showing EYFP expression only in PV+ cells. (Scale bar = 50 µm). To compare 5XFAD and WT mice, ChR2 was expressed in FS-PV interneurons of 5XFAD-negative littermates. To control for non-specific effects of photostimulation, 5XFAD/PV-Cre double transgenic mice expressing AAV-DIO containing only EYFP were used. In these mice, with identical genetic backgrounds and light delivery conditions, light delivery does not result in optogenetic stimulation. In some embodiments, FS-PV interneurons at 40 Hz were chosen for two reasons. First, previous studies have shown that driving FS-PV interneurons at 40 Hz caused the greatest LFP responses. Second, in some embodiments, a gamma disturbance during SWR was found, with instantaneous gamma frequencies during SWR forming a distribution centered around 40 Hz, as shown in FIGS. 5A-5C. In some embodiments, for electrophysiological recordings, a stimulation period of 40 Hz is delivered at randomized intervals selected from periods of no stimulation or a Poisson distribution centered at 40 Hz as further described herein. are interleaved with the period of
図13A及び13Bは、いくつかの実施形態に従って、FS-PV介在ニューロンの試験の概略図、局所電場電位の電気トレース、及びパワースペクトル密度を含む。図13Aを参照すると、1302は、FS-PV介在ニューロンの40Hzの光遺伝学的駆動の前及び最中のCA1における局所電場電位の電気トレースである。プロット1304は、CA1におけるFS-PV介在ニューロンの40Hzの刺激、ランダム刺激(40Hzを中心としたポアソン分布から選択されるランダム化間隔での刺激)、または無刺激の間のパワースペクトル密度の平均と標準偏差を示す(5XFADマウスn=4及びWTマウス3)。図13Bは、各マウスについて、CA1におけるFS-PV介在ニューロンの40Hzの刺激1306、ランダム刺激1308、または無刺激1310の間のパワースペクトル密度を示す(5XFADマウスn=4、動物当たり169、130、240、73の40Hz、143、129、150、72のランダム、及び278、380、52、及び215の無刺激周期、ならびにWTマウスn=3、動物当たり65、93、91の40Hz、64、93、90のランダム、及び187、276、270の無刺激周期)。40Hzでの1ミリ秒の473nmの光パルスの送達で、図13A及び図13Bのプロット1306に示す通りLFPで40Hzでのパワーの増加をもたらした一方、ランダム刺激は、図13A及び図13Bのプロット1308に示す通り、40Hzでのパワーの増加をもたらさなかった。
Figures 13A and 13B include schematics of FS-PV interneuron studies, electrical traces of local field potentials, and power spectral densities, according to some embodiments. Referring to FIG. 13A, 1302 are electrical traces of local field potentials in CA1 before and during 40 Hz optogenetic driving of FS-PV interneurons.
さらに、いくつかの実施形態では、光パルスは、光開始から2~3ミリ秒後、効果的にスパイクを駆動し、パルス当たりのスパイクは、ランダム及び40Hzの条件の両方で同様であった。図14A及び14Bは、いくつかの実施形態に従って、1ミリ秒のレーザパルスの開始後の生の電気トレース、光遺伝学的刺激後のスパイクに対してフィルターをかけた後のトレース、及びスパイクの確率のプロットを含む。図14Aは、例示的な生のトレース1402及び光遺伝学的刺激1406の後のスパイク(300~6000Hz)1404に対してフィルターをかけたトレースを示す。プロット1408は、40Hzの刺激、ランダム刺激、または無刺激の間に、1ミリ秒のレーザパルスの開始後、パルス当たりのスパイクのヒストグラムを示す(4匹の5XFAD及び3匹のWTマウスにおいて、40Hzの刺激n=345762、ランダムパルス刺激301559、及び無刺激32350の回数、552の40Hzの刺激、543のランダム刺激、及び1681の無刺激周期から少なくとも500ミリ秒離す)。図14Bは、レーザパルス開始の約2~3ミリ秒後のスパイキングの増加を伴う40Hzの刺激1412、ランダム刺激1414、または無刺激1410に反応する1ミリ秒のレーザパルスの開始後のスパイクの確率を示す(5XFAD n=4、動物当たり87、130、8、73の40Hzの刺激、85、129、5、72のランダム刺激、及び251、379、15、215の無刺激周期、ならびにWT n=3、動物当たり65、93、91の40Hzの刺激周期、動物当たり64、93、90のランダム刺激周期、及び動物当たり187、277、270の無刺激周期)。エラーバーは平均+/-SEMを示す。
Furthermore, in some embodiments, light pulses effectively drove spikes 2-3 ms after light onset, and spikes per pulse were similar for both random and 40 Hz conditions. 14A and 14B show the raw electrical trace after the onset of the 1 ms laser pulse, the trace after filtering the spike after optogenetic stimulation, and the spike after the spike, according to some embodiments. Includes probability plots. FIG. 14A shows an exemplary
従って、CA1における40Hzの振動は、FS-PV介在ニューロンの光遺伝学的刺激によって効果的に駆動された。先行研究では、Aβペプチドのレベルが、神経活動の増加の後に上昇し、神経活動の静止の後に減少することが示されている。いくつかの実施形態では、該ランダム刺激条件を用いて、刺激が引き起こすスパイキング活動の全体的な変化を調整した。いくつかの実施形態では、マルチユニット発火率を、40Hzとランダム刺激の交互配置された周期中で比較し、これらの条件において、発火率に有意な差は見られなかった。 Thus, 40 Hz oscillations in CA1 were effectively driven by optogenetic stimulation of FS-PV interneurons. Previous studies have shown that levels of Aβ peptide rise after increased neuronal activity and decrease after cessation of neuronal activity. In some embodiments, the random stimulus conditions were used to adjust for global changes in stimulus-evoked spiking activity. In some embodiments, multi-unit firing rates were compared during interleaved cycles of 40 Hz and random stimulation, and no significant differences in firing rates were found in these conditions.
図15Aは、いくつかの実施形態に従って、40Hzの刺激周期とランダム刺激周期の間の発火率の差を示すヒストグラムである。図15Aは、両方のタイプの刺激が同様の量のスパイキング活動を誘発することを示す(中央値ゼロに対するウィルコクソンの符号順位検定、p>0.6、4匹の5XFAD及び3匹のWTマウスから刺激周期n=538、「n.s.」は有意でないことを示す)。すべてのマウスを合わせた40Hz及びランダム刺激中の発火率の差の分布の中央値ゼロに対するウィルコクソンの符号順位検定p>0.6:中央値-1.75×10⁻⁵Hz(-1.28-1.18Hz、第一四分位数~第三四分位数)刺激周期n=538。 FIG. 15A is a histogram showing the difference in firing rate between 40 Hz stimulation periods and random stimulation periods, according to some embodiments. FIG. 15A shows that both types of stimulation elicit similar amounts of spiking activity (Wilcoxon signed-rank test to median zero, p>0.6, 4 5XFAD and 3 WT mice from stimulation period n = 538, "n.s." indicates not significant). Wilcoxon signed-rank test p>0.6 for median zero distribution of firing rate differences during 40 Hz and random stimulation across all mice combined: median −1.75×10 −5 Hz (−1.28 −1.18 Hz, 1st quartile to 3rd quartile) stimulus period n=538.
図15Bは、各動物について、40Hzの刺激1512、ランダム刺激1514、及び無刺激1510周期当たりのマルチユニット発火率を示す棒グラフである(3匹のWT及び4匹の5XFADマウスの各動物に対する順位和検定、p>0.09、中央値と四分位数を図に示す、マウス当たりの40Hzの刺激周期n=87、130、8、65、93、91、73及びランダム刺激周期85、129、5、64、93、90、72)。箱ひげ図は、中央値(箱内の白線)及び四分位数(箱の上下)を示す。すべての動物で、40Hz及びランダム刺激間の発火率には有意な差はなく、このランダム刺激条件がスパイキング活動の対照としての役割を果たすことを示した(3匹のWT及び4匹の5XFADマウスの各動物に対する順位和検定、p>0.09、中央値と四分位数を図に示す、動物当たりの40Hzの刺激周期n=87、130、8、65、93、91、73及びランダム刺激周期85、129、5、64、93、90、72)。無刺激に対して40Hzの刺激がニューロンの活動過剰を引き起こすかどうかも調べた。ほとんどの動物で、40Hzまたはランダム刺激と無刺激の間の発火率に有意な差はない(2匹のWT及び2匹の5XFADの各動物に対する順位和検定、p>0.25、動物当たりの40Hzの刺激周期n=8、93、91、73及びベースライン周期15、277、270、215)か、または、40Hzもしくはランダム刺激中の発火率は、無刺激中よりも低く(1匹のWT及び1匹の5XFADの各動物に対する順位和検定、p<10-5、これは、多重比較の実施に対して補正された場合に有意であり、動物当たりの40Hzの刺激周期n=130、65及びベースライン周期379、187)、40Hzの刺激はニューロンの活動過剰を引き起こさなかったことを示した。1匹の動物において、40Hzまたはランダム刺激でベースライン中より活動が有意に高かった(1匹の5XFADマウスに対する順位和検定、p<10-5、動物当たりの40Hzの刺激周期n=87及びベースライン周期251)。従って、7匹中6匹の動物で、FS-PV介在ニューロンの40Hzの光遺伝学的刺激が活動過剰を引き起こす証拠はない。従って、いくつかの実施形態では、図15Aに示すように、このランダム条件はガンマ振動を誘導しなかったが、同様の量のマルチユニットスパイキング活動をもたらした。
FIG. 15B is a bar graph showing the multi-unit firing rate per 40
図16Aは、いくつかの実施形態に従って、対象の海馬のCA1領域における特定の細胞型の刺激の周波数特異的な増加の過程での対象の海馬から記録した電気トレースである。より具体的には、図16Aは、いくつかの実施形態に従って、FS-PV+(すなわち、ガンマ条件)の刺激の周波数特異的な増加の過程での対象の海馬から記録した。 FIG. 16A is an electrical trace recorded from a subject's hippocampus during a frequency-specific increase in stimulation of a particular cell type in the CA1 region of the subject's hippocampus, according to some embodiments. More specifically, FIG. 16A was recorded from a subject's hippocampus during a frequency-specific increase in stimulation of FS-PV+ (ie, gamma condition), according to some embodiments.
図16Bは、いくつかの実施形態に従って、対象の海馬のCA1領域における特定の細胞型の刺激における局所電場電位パワーの周波数特異的な増加を示すパワースペクトル密度のプロットである。特に、図16Bのパワースペクトル密度のグラフは、刺激の特異性を検証する。局所電場電位(LFP)パワーは、FS-PV+が40Hzの青色光パルスで活性化された場合に、ガンマ刺激条件中に40Hz帯域1600においてのみ高まった(1群当たりのマウスn=4)。ベースラインもランダム刺激条件もこの周波数1600での増強を示さなかった。
FIG. 16B is a power spectral density plot showing frequency-specific increases in local field potential power upon stimulation of specific cell types in the CA1 region of the hippocampus of a subject, according to some embodiments. In particular, the power spectral density graph of FIG. 16B verifies the stimulus specificity. Local field potential (LFP) power was enhanced only in the 40
ガンマ刺激は、海馬のCA1領域におけるAβ産生を低減した。
Aβの蓄積は、ADの病変に典型的な複数の神経毒性事象を引き起こすことがある。従って、いくつかの実施形態では、5XFADマウスの全般的なAβペプチドのレベルにおけるガンマ刺激の影響を調べた。3か月齢のマウスには、この段階で海馬に斑が存在しないためにこれらを用い、斑負荷と無関係の可溶性Aβの動態を調べられるようにした。いくつかの実施形態では、FS-PV介在ニューロンの1時間の刺激が、Aβ ELISA分析で測定した、海馬のCA1領域におけるEYFP対照群と比較して、40Hz群において、Aβ1-40を53.22%及びAβ1-42を44.62%低減したことが見出された。
Gamma stimulation reduced Aβ production in the CA1 region of the hippocampus.
Accumulation of Aβ can lead to multiple neurotoxic events typical of AD lesions. Therefore, in some embodiments, we examined the effect of gamma stimulation on the overall Aβ peptide levels in 5XFAD mice. Three-month-old mice were used due to the absence of hippocampal plaques at this stage, allowing us to examine the dynamics of soluble Aβ independent of plaque load. In some embodiments, 1 hour stimulation of FS-PV interneurons increased Aβ 1-40 by 53.5 in the 40 Hz group compared to the EYFP control group in the CA1 region of the hippocampus, as measured by Aβ ELISA assay. It was found to reduce Aβ 1-42 by 22% and Aβ 1-42 by 44.62%.
図17A及び17Bは、いくつかの実施形態に従って、すべてのマウスをまとめた一元配置分散分析による5XFAD/PV-Cre CA1の相対的Aβ1-40及びAβ1-42レベルを示す棒グラフである(Aβ1-40についてはEYFPマウスn=8及び40Hzマウス7、Aβ1-42については1群当たりのマウスn=4)。図17Aの棒グラフは、各刺激条件における5XFAD/PV-Cre CA1の相対的なAβ1-40のレベルを表す。棒グラフのバーに重ねられた円1702は、各群の個々のデータ点を示す(1群当たりの5XFAD/PV-Creマウス、EYFP n=8、40Hz n=7、8Hz n=4、ランダムn=6)。この図では、すべての棒グラフについて一元配置分散分析により、注記「n.s.」1704は有意でないことを示し、アスタリスク1706はp<0.05を示し、二重アスタリスク1708はp<0.01を示す。図17Bは、各刺激条件における5XFAD/PV-Cre CA1の相対的なAβ1-42のレベルを表す(1群当たりの5XFAD/PV-Creマウス、EYFP n=4、40Hz n=4、8Hz n=3、ランダムn=3)。図17A及び17Bは平均及びSEMを示す。
17A and 17B are bar graphs showing relative Aβ 1-40 and Aβ 1-42 levels in 5XFAD/PV-Cre CA1 by one-way ANOVA pooling all mice, according to some embodiments (Aβ EYFP mice n=8 and 7 40 Hz mice for 1-40 , n=4 mice per group for Aβ 1-42 ). The bar graph in FIG. 17A represents the relative Aβ 1-40 levels of 5XFAD/PV-Cre CA1 in each stimulation condition.
表1(下記)は、異なる条件を受ける同腹仔由来のマウスを比較した場合のスチューデントt検定による有意差があるp<0.05、生の濃度(pg/ml)の値を示す。表1は、各実験群について、ELISA希釈での生のAβ1-40及びAβ1-42のレベルを示す。
表1


Table 1
いくつかの実施形態では、包括的な一連の対照実験を実施し、効果が周波数、細胞型、及び/または周期性に対して特異的であるかどうかを判定した。周波数特異性を判定するため、8Hzにおける5XFAD/PV-Cre二重トランスジェニックマウスのFS-PV介在ニューロンを駆動したところ、Aβレベルの変化は認められなかった。次に、FS-PV介在ニューロンをランダムで駆動したところ、その効果は周期的刺激に特異的であった。実際、ランダム刺激後にアミロイドレベルは減少せず、それどころか、代わりにAβ1-40は230.1%増加し、Aβ1-42は133.8%増加した(例えば、図17A及び17B参照、すべてのマウスをまとめた一元配置分散分析によるp<0.01、Aβ1-40に対してEYFPマウスn=8及びランダムマウスn=4、Aβ1-42に対して1群当たりのマウスn=3。異なる条件を受けた同腹仔由来のマウスを比較したところ、スチューデントt検定による有意差があるp<0.01が認められた。 In some embodiments, a comprehensive set of control experiments was performed to determine whether effects were specific to frequency, cell type, and/or periodicity. To determine frequency specificity, driving FS-PV interneurons of 5XFAD/PV-Cre double transgenic mice at 8 Hz showed no changes in Aβ levels. FS-PV interneurons were then randomly driven and the effect was specific to periodic stimulation. Indeed, amyloid levels did not decrease after random stimulation, instead Aβ 1-40 increased by 230.1% and Aβ 1-42 increased by 133.8% (see, for example, Figures 17A and 17B, all p<0.01 by one-way ANOVA for pooling mice, n=8 EYFP mice vs. Aβ 1-40 and n=4 random mice, n=3 mice per group vs. Aβ 1-42 . Comparison of mice from littermates receiving different conditions showed a significant difference p<0.01 by Student's t-test.
最後に、5XFAD/αCamKII-Cre二重トランスジェニックマウスを用いた海馬CA1におけるCamKII+興奮性ニューロンでの8Hz及び40Hzの刺激による効果の細胞型特異性を試験した。図18A及び18Bは、いくつかの実施形態に従って、一元配置分散分析による5XFAD/αCamKII-Cre CA1の相対的なAβ1-40及びAβ1-42レベルを示す棒グラフである。図18Aは、各刺激条件における5XFAD/αCamKII-Cre CA1の相対的なAβ1-40レベルを表す。棒グラフのバーに重ねられた円1802は、各群の個々のデータ点を示す(1群当たりの5XFAD/αCamKII-Creマウス、40Hz n=6、8Hz n=3、ランダムn=3、一元配置分散分析により、注記「n.s.」1804は有意でないことを示し、アスタリスク1806はp<0.001を示す)。
Finally, we tested the cell-type specificity of the effects of 8 Hz and 40 Hz stimulation on CamKII+ excitatory neurons in hippocampal CA1 using 5XFAD/αCamKII-Cre double transgenic mice. 18A and 18B are bar graphs showing relative Aβ 1-40 and Aβ 1-42 levels in 5XFAD/αCamKII-Cre CA1 by one-way ANOVA, according to some embodiments. FIG. 18A represents the relative Aβ 1-40 levels of 5XFAD/αCamKII-Cre CA1 in each stimulation condition.
図18Bは、各刺激条件における5XFAD/αCamKII-Cre CA1の相対的なAβ1-42レベルを表す(1群当たりのαCamKII-Creマウスn=3)。いくつかの実施形態では、8Hzまたは40HzでCamKII+興奮性ニューロンを駆動することでは、Aβ1-40及びAβ1-42のレベルに有意差は生じないことが見出された(例えば、図18A及び18B参照、右、一元配置分散分析によるp>0.05、40Hzマウスn=6及び8Hzマウス3(Aβ1-40)、1群当たりのマウスn=3(Aβ1-42)。異なる条件を受けた同腹仔由来のマウスを比較した場合、それらはスチューデントt検定による有意差がないp>0.05である)。5XFAD/PV-Creマウスと同様に、ランダム刺激でのCamKII+ニューロンの駆動もまた、Aβ1-40の257.6%の増加及びAβ1-42の133.3%の増加をもたらした(例えば、図18A及び18B参照、右、一元配置分散分析によるp<0.001、Aβ1-40に対して40Hzマウスn=5及びランダムマウス3、Aβ1-42に対して1群当たりのマウスn=3。異なる条件を受けた同腹仔由来のマウスを比較した場合、Aβ1-40は、スチューデントt検定による有意差があるp<0.001であり、Aβ1-42は、スチューデントt検定によるp=0.13である)。 FIG. 18B depicts relative Aβ 1-42 levels in 5XFAD/αCamKII-Cre CA1 in each stimulation condition (αCamKII-Cre mice n=3 per group). In some embodiments, driving CamKII+ excitatory neurons at 8 Hz or 40 Hz was found to produce no significant difference in levels of Aβ 1-40 and Aβ 1-42 (e.g., FIG. 18A and See 18B, right, p>0.05 by one-way ANOVA, 40 Hz mice n=6 and 8 Hz mice 3 (Aβ 1-40 ), n=3 mice per group (Aβ 1-42 ). When comparing mice from receiving littermates, they are not significantly different by Student's t-test, p>0.05). Similar to 5XFAD/PV-Cre mice, driving CamKII+ neurons with random stimulation also resulted in a 257.6% increase in Aβ 1-40 and a 133.3% increase in Aβ 1-42 (eg, See FIGS. 18A and 18B, right, p<0.001 by one-way ANOVA, n=5 40 Hz mice against Aβ 1-40 and 3 random mice, n=mice per group against Aβ 1-42 . 3. Aβ 1-40 was significantly different p<0.001 by Student's t-test and Aβ 1-42 was p<0.001 by Student's t-test when comparing mice from littermates receiving different conditions. = 0.13).
従って、40Hzの刺激後のAβペプチドレベルの低下は、FS-PV介在ニューロンの駆動に特異的であり得る。いくつかの実施形態では、これらELISAの所見を免疫組織化学で確認するため、CA1におけるAPPと交差反応しないβアミロイドのC末端特異抗体を用いてAβの標識を実施した。 Therefore, the reduction in Aβ peptide levels after 40 Hz stimulation may be specific for driving FS-PV interneurons. In some embodiments, to confirm these ELISA findings with immunohistochemistry, labeling of Aβ was performed with a beta-amyloid C-terminal specific antibody that does not cross-react with APP in CA1.
図19Aは、いくつかの実施形態に従って、海馬CA1領域における抗Aβ及び抗EEA1抗体による免疫組織化学を示す一連の画像である。具体的には、図19Aは、EYFP、40Hz、及びランダム刺激条件における5XFAD/PV-Creの海馬のCA1領域での抗Aβ1902(D54D2)ならびに抗EEA1 1904(610457)抗体による免疫組織化学を示す一連の免疫蛍光画像である(スケールバー=50μm)。図19Bは、いくつかの実施形態に従って、EYFPに対して正規化されたAβの相対的免疫反応を示す一連の棒グラフである。具体的には、図19Bは、EYFPに対して正規化されたAβの相対的免疫反応性を示す(1群当たりのマウスn=4、一元配置分散分析により、1908はp<0.05を示し、1920はp<0.01を示す)。 FIG. 19A is a series of images showing immunohistochemistry with anti-Aβ and anti-EEA1 antibodies in the hippocampal CA1 region, according to some embodiments. Specifically, FIG. 19A is a series showing immunohistochemistry with anti-Aβ1902 (D54D2) and anti-EEA1 1904 (610457) antibodies in the CA1 region of the hippocampus of 5XFAD/PV-Cre in EYFP, 40 Hz, and random stimulation conditions. (Scale bar = 50 µm). FIG. 19B is a series of bar graphs showing relative immune responses of Aβ normalized to EYFP, according to some embodiments. Specifically, FIG. 19B shows the relative immunoreactivity of Aβ normalized to EYFP (n=4 mice per group, 1908 p<0.05 by one-way ANOVA). 1920 indicates p<0.01).
図20Aは、いくつかの実施形態に従って、5XFAD/PV-Creの海馬CA1領域における抗Aβ抗体による免疫組織化学を示す一連の免疫蛍光画像である。具体的には図20Aは、EYFP、40Hz、及びランダム刺激条件における5XFAD/PV-Creの海馬CA1領域での抗Aβ2002(12F4)抗体による免疫組織化学を示す一連の免疫蛍光画像である(スケールバー=50μm)。図20Bは、いくつかの実施形態に従って、EYFPに正規化されたAβの相対的免疫反応性を示す棒グラフである。具体的には、図20Bは、EYFPに対して正規化されたAβの相対的免疫反応性を示す(1群当たりのマウスn=4、一元配置分散分析により、2004はp<0.05を示し、2006はp<0.001を示す)。Aβ標識の強度は、EYFP群と比較した場合、3か月齢の5XFAD/PV-Cre二重トランスジェニックマウスにおけるFS-PV介在ニューロンの40Hzの刺激後に39.5%減少し、ランダム刺激後は有意に187.0%増加した(例えば、図19A、19B、20A、及び20B参照、一元配置分散分析によるp<0.05及びp<0.01、1群当たりのマウスn=4)。 FIG. 20A is a series of immunofluorescence images showing immunohistochemistry with anti-Aβ antibodies in the hippocampal CA1 region of 5XFAD/PV-Cre, according to some embodiments. Specifically, FIG. 20A is a series of immunofluorescence images showing immunohistochemistry with anti-Aβ2002 (12F4) antibody in the hippocampal CA1 region of 5XFAD/PV-Cre under EYFP, 40 Hz, and random stimulation conditions (scale bar = 50 μm). FIG. 20B is a bar graph showing relative immunoreactivity of Aβ normalized to EYFP, according to some embodiments. Specifically, FIG. 20B shows the relative immunoreactivity of Aβ normalized to EYFP (n=4 mice per group, 2004 p<0.05 by one-way ANOVA). 2006 indicates p<0.001). The intensity of Aβ labeling decreased by 39.5% after 40 Hz stimulation of FS-PV interneurons in 3-month-old 5XFAD/PV-Cre double transgenic mice when compared with the EYFP group, and was significant after random stimulation. 187.0% (see, eg, FIGS. 19A, 19B, 20A, and 20B, p<0.05 and p<0.01 by one-way ANOVA, n=4 mice per group).
脳のアミロイド濃度は、Aβの産生及びクリアランス率に依存し得る。いくつかの実施形態では、Aβペプチドは、APPのβ及びγセクレターゼによる一連のタンパク質分解的切断によって産生される。BACE1がAPPホロタンパク質を切断する場合、APPのCTF及びNTFが産生され得る。いくつかの実施形態では、40Hzの刺激がどのようにしてAβレベルを低減したかを明らかにするため、FS-PV介在ニューロンの刺激後、APPの切断中間体であるCTF及びNTFのレベルを測定することによりガンマに影響されたAPP切断を調べた。40Hzの刺激後、CTFの有意な減少が、EYFP群と比較して40Hzの刺激後18.6%、及びランダム群と比較して19.7%見られた(一元配置分散分析によるp<0.05及びp<0.01、1群当たりのマウスn=6)。 Brain amyloid concentrations may depend on the production and clearance rate of Aβ. In some embodiments, Aβ peptides are produced by sequential proteolytic cleavage of APP by β and γ secretases. When BACE1 cleaves the APP holoprotein, the CTFs and NTFs of APP can be produced. In some embodiments, levels of APP cleavage intermediates CTF and NTF are measured after stimulation of FS-PV interneurons to determine how 40 Hz stimulation reduced Aβ levels. Gamma-influenced APP cleavage was examined by After 40 Hz stimulation, a significant decrease in CTF was seen by 18.6% after 40 Hz stimulation compared to the EYFP group and 19.7% compared to the random group (p<0 by one-way ANOVA). .05 and p<0.01, n=6 mice per group).
図21Aは、いくつかの実施形態に従って、1レーン当たり1匹のマウス、各条件の2つの生物学的反復で、EYFP、ランダム、及び40Hzの刺激条件における、CA1でのAPP(CT695)、APP NTF(A8967)、APP CTF(CT695)、及びβアクチン(A5316)(負荷対照)のレベルを示す代表的なウェスタンブロットである。図21Bは、いくつかの実施形態に従って、APP CTFの相対的免疫反応性を示す棒グラフである。具体的には、図21Bは、EYFP及びランダム条件に対する40HzにおけるAPP CTFの相対的(アクチンに対して正規化)免疫反応性を示す(1群当たりのマウスn=6、一元配置分散分析により、1つのアスタリスク2102はp<0.05を示し、2つのアスタリスク2104はp<0.01を示す)。図21Cは、いくつかの実施形態に従って、CA1における完全長APP2106(CT695)、APP CTF2108(CT695)、及びβアクチン2112(A5316、負荷対照)のレベルを示す一連のウェスタンブロットである。具体的には、図21Cは、1レーン当たり1匹のマウス、各条件の2つの生物学的反復で、EYFP、ランダム、及び40Hzの刺激条件における、CA1での完全長APP2106(CT695)、APP CTF2108(CT695)、及びβアクチン2112(A5316、負荷対照)のレベルを示す。
FIG. 21A shows APP (CT695), APP at CA1 in EYFP, random, and 40 Hz stimulation conditions, one mouse per lane, two biological replicates of each condition, according to some embodiments. Representative Western blots showing levels of NTF (A8967), APP CTF (CT695), and β-actin (A5316) (loading control). FIG. 21B is a bar graph showing relative immunoreactivity of APP CTF, according to some embodiments. Specifically, FIG. 21B shows the relative (normalized to actin) immunoreactivity of APP CTF at 40 Hz to EYFP and random conditions (n=6 mice per group, one-way ANOVA; One
図22Aは、EYFP及びランダム条件に対する40HzにおけるAPP NTFの相対的(アクチンに対して正規化)免疫反応性を示す棒グラフである(1群当たりのマウスn=6、一元配置分散分析により、注記「n.s.」2204は有意でないことを示し、2202はp<0.05を示す)。図22Bは、EYFP、ランダム、及び40Hz条件における完全長APPの相対的(アクチンに対して正規化)免疫反応性を示す棒グラフである(一元配置分散分析による、1群当たりのマウスn=6)。 FIG. 22A is a bar graph showing the relative (normalized to actin) immunoreactivity of APP NTF at 40 Hz to EYFP and random conditions (n=6 mice per group, one-way ANOVA, note “ n.s." 2204 indicates not significant, 2202 indicates p<0.05). FIG. 22B is a bar graph showing relative (normalized to actin) immunoreactivity of full-length APP in EYFP, random, and 40 Hz conditions (n=6 mice per group by one-way ANOVA). .
いくつかの実施形態では、40Hzの刺激後、APP NTFレベルの有意な低下が、EYFP群と比較して28.5%、及びランダム群と比較して28.2%見られた(例えば、図21A、22A、及び21C参照、一元配置分散分析によるp<0.05、1群当たりのマウスn=6)。さらに、完全長APPのレベルは、様々な群間で類似しているようであり、Aβの低下は、前駆体レベルの変化によるものではないことを示した(例えば、図21A、22B、21C参照、APP実験の1群当たりのマウスn=6)。いくつかの実施形態では、本マウスモデルにおいて、その切断産物と比較して相対的に多量のAPPのため、完全長APPの変化は、検出が困難であり得る。 In some embodiments, a significant reduction in APP NTF levels was seen after 40 Hz stimulation by 28.5% compared to the EYFP group and 28.2% compared to the random group (e.g., Figure See 21A, 22A, and 21C, p<0.05 by one-way ANOVA, n=6 mice per group). Furthermore, levels of full-length APP appeared similar between the various groups, indicating that the decline in Aβ was not due to changes in precursor levels (see, e.g., Figures 21A, 22B, 21C). , n=6 mice per group in the APP experiment). In some embodiments, changes in full-length APP can be difficult to detect in this mouse model due to the relative abundance of APP compared to its cleavage products.
いくつかの実施形態では、APPのプロセシングは、小胞輸送経路内で行われ、先行研究では、活動刺激後、APPは回収エンドソームに輸送されることが示されている。さらに、AD患者由来の脳組織及びAD患者由来のヒトニューロンにおいて、拡大された初期エンドソームが認められている。いくつかの実施形態では、ガンマ刺激が実験動物においてエンドソームの存在量に影響を与えるかどうかを試験するため、2つのマーカー、すなわちEEA1(初期エンドソーム抗原1)及びRab5(RAB5A遺伝子がコードするRas関連タンパク質)を用いて、40Hz及びランダム刺激後のCA1における初期エンドソームが特徴づけられている。図23は、3か月齢の5XFAD/PV-CreマウスにおいてEYFP、40Hz、及びランダム刺激条件で、抗Rab5(ADI-KAp-GP006-E)抗体による免疫組織化学を示す一連の免疫蛍光画像である(スケールバー=50μm)。 In some embodiments, APP processing occurs within the vesicular trafficking pathway and previous studies have shown that APP is transported to collecting endosomes after activity stimulation. In addition, enlarged early endosomes have been found in brain tissue from AD patients and in human neurons from AD patients. In some embodiments, two markers, EEA1 (early endosomal antigen 1) and Rab5 (Ras-associated antigen encoded by the RAB5A gene), are used to test whether gamma stimulation affects endosomal abundance in experimental animals. protein) to characterize early endosomes in CA1 after 40 Hz and random stimulation. FIG. 23 is a series of immunofluorescence images showing immunohistochemistry with anti-Rab5 (ADI-KAp-GP006-E) antibody under EYFP, 40 Hz, and random stimulation conditions in 3-month-old 5XFAD/PV-Cre mice. (Scale bar = 50 μm).
図24Aは、いくつかの実施形態に従って、EYFPに対して正規化されたEEA1の相対的免疫反応性を表す棒グラフである(1群当たりのマウスn=4、一元配置分散分析により、1つのアスタリスク2402はp<0.05を示し、2つのアスタリスク2402はp<0.01を示す)。図24Bは、いくつかの実施形態に従って、EYFP、40Hz、及びランダム刺激条件下での5XFAD/PV-CreからのCA1の相対的Rab5強度レベルを示す棒グラフである(1群当たりのマウスn=3、一元配置分散分析により、3つのアスタリスク2408はp<0.001を示す)。いくつかの実施形態では、EEA1染色は、ニューロン細胞体において初期エンドソームに典型的な点状の細胞質及び膜近傍パターンを生じた(例えば、図19A参照)。いくつかの実施形態では、Rab5標識は、大部分細胞体及び原形質膜に限局されており、エンドソーム及び膜区画内に集中した小さいまばらな点で表される(例えば、図23参照)。全体として、CA1ニューロンの初期エンドソーム標識は、EYFP対照と比較して、40Hzの刺激後、EEA1(39.7%)及びRab5(40.1%)染色強度の両方に有意な低下を示した(例えば、図19A、23、24A参照、一元配置分散分析によるp<0.05及びp<0.001、1群当たり3匹のマウスから切片n=2)。対照的に、FS-PV介在ニューロンのランダム刺激は、EYFP対照と比較して、EEA1染色強度を122%増加させた(例えば、図19A及び24A参照、一元配置分散分析によりp<0.01、1群当たり3匹のマウスから切片n=2)。いくつかの実施形態では、EEA1染色強度の処理依存的な変化は、CA1のAβのそれに匹敵した(例えば、図19A~B、20A~B、23、及び24A~B参照、一元配置分散分析によりp<0.05、1群当たり3匹のマウスから切片n=2)。これらの結果は、CTFで認められた変化に加えて、40Hzの刺激がEEA1及びRab5を変化させること示唆し、一般的なエンドソームプロセシングの差を示している。
FIG. 24A is a bar graph depicting relative immunoreactivity of EEA1 normalized to EYFP (n=4 mice per group, one asterisk by one-way ANOVA), according to some embodiments. 2402 indicates p<0.05,
図25Aは、いくつかの実施形態に従って、対象の海馬のCA1領域の異なる型の刺激後のAβペプチドアイソフォームAβ1-40のレベルを示す棒グラフである。この実験では、約40HzでのFS-PV+の1時間の光遺伝学的刺激502が、海馬CA1におけるAβ1-40レベルを低下させた。8Hzでの興奮性錐体刺激506及び40Hzでの興奮性錐体刺激508は、Aβ1-40のレベルに有意な影響を及ぼさなかった。ランダムな40Hzの刺激504、及びとりわけランダムな興奮性錐体刺激510は、Aβ1-40のレベルを有意に増加させた(1群当たりの動物n=4~9)。
FIG. 25A is a bar graph showing levels of Aβ peptide isoform Aβ 1-40 following different types of stimulation of the CA1 region of the hippocampus of a subject, according to some embodiments. In this experiment, 1 hour
図25Bは、いくつかの実施形態に従うガンマ振動での対象の海馬のCA1領域における特定の細胞型の刺激後のAβペプチドアイソフォームAβ1-42の減少を示す棒グラフである。この実験では、約40HzでのFS-PV+の1時間の光遺伝学的刺激516が、海馬CA1におけるAβ1-42レベルを低下させた(1群当たりの動物n=2~4)。8Hzでの刺激520、40Hzでの興奮性錐体刺激522、及び8Hzでの興奮性錐体刺激524は、Aβ1-42のレベルを増加させた。ランダムな40Hzの刺激518、及びとりわけランダムな興奮性錐体刺激526は、Aβ1-42のレベルを有意に増加させた)。
FIG. 25B is a bar graph showing the reduction of Aβ peptide isoform Aβ 1-42 following stimulation of specific cell types in the CA1 region of the hippocampus of a subject with gamma oscillations, according to some embodiments. In this experiment, 1 hour optogenetic stimulation of FS-PV+ at approximately 40 Hz 516 reduced Aβ 1-42 levels in hippocampal CA1 (n=2-4 animals per group). Stimulation at 8 Hz 520, excitatory cone stimulation at 40 Hz 522, and excitatory cone stimulation at 8 Hz 524 increased levels of Aβ 1-42 .
図25Cは、いくつかの実施形態に従うガンマ振動での対象の海馬のCA1領域における特定の細胞型の刺激後の完全長APP528、534(アクチン532に対して正規化)のレベルの増加及びCTF(例えば、β-CTF)530、536(アクチン532に対して正規化)のレベルの低下を示す一連の画像である。ランダムな40Hzの対象条件と比較して、40HzでのFS-PV+刺激は、APPのβ-CTFレベルを低下させ、完全長APPレベルを増加させた(1群当たりの動物n=4~6)。β-CTFはBACE1によるAPPのアミロイド形成的切断の過程で生成するAPP誘導体であるため、β-CTFの高レベルは、Aβ産生の増加を表す。 FIG. 25C shows increased levels of full-length APP528, 534 (normalized to actin 532) and CTF ( For example, a series of images showing decreased levels of β-CTF) 530, 536 (normalized to actin 532). FS-PV+ stimulation at 40 Hz reduced β-CTF levels of APP and increased full-length APP levels compared to the random 40 Hz control condition (n=4-6 animals per group). . Since β-CTF is an APP derivative produced during the amyloidogenic cleavage of APP by BACE1, high levels of β-CTF represent increased Aβ production.
図26A~26Bは、いくつかの実施形態に従って、対象の海馬のCA1領域の異なる型の刺激後のエンドソームレベル(EEA1レベルに基づく)を示す免疫蛍光画像である。具体的には、免疫蛍光によって測定される、図26Bの図26Aに対する比較で、FS-PV+の40Hzの刺激を介したガンマ振動の誘導が、ランダムなFS-PV+の刺激900と比較して、EEA1レベル(エンドソームレベルのマーカー)を低減することが示される(1群当たりのマウスn=3、p=0.007)。これら細胞におけるエンドソームレベルの低下は、APPとβセクレターゼ間の相互作用の低下を示し、これがAPPの切断及びAβ産生の低下をもたらす。従って、本試験は、エンドソームレベルの増加がAPPプロセシング、ひいてはAβ産生の増加を示すことから、ガンマ振動がADマウスモデルにおいてAP産生を低減することを示した。
26A-26B are immunofluorescence images showing endosomal levels (based on EEA1 levels) after different types of stimulation of the CA1 region of the hippocampus of a subject, according to some embodiments. Specifically, in comparison of FIG. 26B to FIG. 26A, measured by immunofluorescence, the induction of gamma oscillations via FS-
図27は、いくつかの実施形態に従って、対象の海馬のCA1領域の異なる型の刺激後の図26A~26Bの免疫蛍光画像に対する平均強度値(FADに対して正規化)を示す棒グラフである。 FIG. 27 is a bar graph showing mean intensity values (normalized to FAD) for the immunofluorescent images of FIGS. 26A-26B after different types of stimulation of the CA1 region of the hippocampus of a subject, according to some embodiments.
ガンマ刺激はミクログリアの形態変換を誘導した。
いくつかの実施形態では、さらに40Hzの刺激の細胞及び分子効果を不偏的に検討するため、5XFAD/PV-Cre二重トランスジェニックマウスの40HzのFS-PV介在ニューロン刺激、または無刺激(EYFP)1時間後の海馬CA1組織のゲノムワイドRNA-seqを実施した。RNA-seq実験では、平均26,518,345のシーケンシングリードが3匹の刺激及び3匹の無刺激マウスから得られた。データのQC分析で、エクソン/イントロン比の平均値183、エクソン/遺伝子間比の平均値272、及びリボソームRNAリードのパーセンテージの平均値3.6%が明らかになった。この分析は、523の差次的に発現される遺伝子(DEG)を特定し、このうち130が40Hzの刺激に応答して上方制御され、393が下方制御された。
Gamma stimulation induced morphological transformation of microglia.
In some embodiments, 40 Hz FS-PV interneuron stimulation of 5XFAD/PV-Cre double transgenic mice, or no stimulation (EYFP), further unbiasedly examined the cellular and molecular effects of 40 Hz stimulation. Genome-wide RNA-seq of hippocampal CA1 tissue after 1 hour was performed. In RNA-seq experiments, an average of 26,518,345 sequencing reads were obtained from 3 stimulated and 3 unstimulated mice. QC analysis of the data revealed a mean exon/intron ratio of 183, a mean exon/intergenic ratio of 272, and a mean percentage of ribosomal RNA reads of 3.6%. This analysis identified 523 differentially expressed genes (DEGs), of which 130 were upregulated and 393 were downregulated in response to 40 Hz stimulation.
図28は、40Hzの刺激の有無でのマウス海馬CA1領域の全トランスクリプトームRNA-seqによって決定された差次的に発現される遺伝子を示すヒートマップである。正規化されたzスコア値を、各差次的に発現される遺伝子について算出した(列)。色は、遺伝子発現の低及び高レベルを相対的に表す。表2(下記)は、40HzのFS-PV介在ニューロンの刺激によって上方制御された130の遺伝子を示す(Cufflinks 2.2ソフトウェア(ワシントン大学Trapnell Lab、ワシントン州シアトルより入手可能、RNA-seq試料における転写産物の組み立て、それらの存在量の推定、ならびに差次的発現及び調節のための試験用)を用いてp<0.05)。
表2


Table 2
表3(下記)は、40HzのFS-PV介在ニューロンの刺激によって下方制御された393の遺伝子を示す(Cufflinks 2.2ソフトウェア(ワシントン大学Trapnell Lab、ワシントン州シアトルより入手可能)によりp<0.05)。
表3


Table 3 (below) shows 393 genes that were downregulated by stimulation of FS-PV interneurons at 40 Hz (p<0.00 by Cufflinks 2.2 software (available from Trapnell Lab, University of Washington, Seattle, WA). 05).
Table 3
いくつかの実施形態では、上方制御された遺伝子は、下方制御された遺伝子より一般に高い発現値を有していた。図29は、いくつかの実施形態に従うEYFP及び40Hz条件における上方ならびに下方制御された遺伝子のFPKM値を示す箱ひげ図である。箱は、中央値(箱内の黒線)及び四分位数(箱の上下)を示し、ひげは最小値及び最大値を表し、円は外れ値を表す。上方制御された遺伝子は、ミクログリアにおいて高度に濃縮された可能性がある。具体的には、すべての上方制御された遺伝子の約35%が、ミクログリアでそれらの最も高い発現を有していた(ニューロンで約19%、内皮細胞で約17%、星状細胞で約14%、髄鞘形成乏突起膠細胞で約9%、乏突起膠細胞前駆細胞で約5%、及び新たに形成された乏突起膠細胞で約1%)。 In some embodiments, upregulated genes generally had higher expression values than downregulated genes. FIG. 29 is a boxplot showing FPKM values of up- and down-regulated genes in EYFP and 40 Hz conditions according to some embodiments. Boxes indicate medians (black lines in boxes) and quartiles (above and below boxes), whiskers represent minimum and maximum values, and circles represent outliers. Upregulated genes may be highly enriched in microglia. Specifically, ~35% of all upregulated genes had their highest expression in microglia (~19% in neurons, ~17% in endothelial cells, ~14% in astrocytes). %, about 9% myelinated oligodendrocytes, about 5% oligodendrocyte progenitors, and about 1% newly formed oligodendrocytes).
図30は、いくつかの実施形態に従って、40Hzの刺激後の特定された上方制御された遺伝子の細胞型特異的発現パターンを示す円グラフである。遺伝子FPKM値は、星状細胞、内皮細胞、ミクログリア、髄鞘形成乏突起膠細胞(MO)、ニューロン、新たに形成された乏突起膠細胞(NFo)、及び乏突起膠細胞前駆細胞(OPC)を含む様々な脳細胞型からの公開されているRNA-seqデータから算出した。従って、RNA-seq分析は、FS-PV介在ニューロンの1時間の40Hzの刺激が、ミクログリアの細胞状態の変化を引き起こしたことを強く示唆しており、これは、これらの細胞がADの病変において役割を果たすという累積証拠を考慮すると重要である。 FIG. 30 is a pie chart showing cell type-specific expression patterns of identified upregulated genes following 40 Hz stimulation, according to some embodiments. Gene FPKM values were observed in astrocytes, endothelial cells, microglia, myelinating oligodendrocytes (MOs), neurons, newly formed oligodendrocytes (NFo), and oligodendrocyte progenitor cells (OPCs). was calculated from publicly available RNA-seq data from various brain cell types, including Thus, RNA-seq analysis strongly suggests that 1-hour 40-Hz stimulation of FS-PV interneurons caused changes in the cellular status of microglia, suggesting that these cells may be more active in AD lesions. important given the cumulative evidence that it plays a role.
いくつかの実施形態では、40Hzの刺激がミクログリアに与える潜在的影響をさらに検討するため、異なる化学的及び遺伝的摂動下でミクログリア、末梢マクロファージ、ならびにニューロンからの一連の公開されているRNA-seqデータセットを、遺伝子セットエンリッチメント解析を用いて、本明細書のいくつかの実施形態に記載の特徴づけからの遺伝子リストと比較した。表4(下記)は、40Hzの刺激による上方または下方制御された遺伝子と、異なる化学的及び遺伝的摂動下で公開されているニューロン、ミクログリア、及びマクロファージに特異的なRNA-seqデータの間の相関のGSEAに基づく統計的有意性を示す。
表4

In some embodiments, to further investigate the potential effects of 40 Hz stimulation on microglia, a series of published RNA-seq from microglia, peripheral macrophages, and neurons under different chemical and genetic perturbations. The dataset was compared to the gene list from the characterization described in some embodiments herein using gene set enrichment analysis. Table 4 (below) shows genes up- or down-regulated by 40 Hz stimulation and RNA-seq data specific to neurons, microglia, and macrophages published under different chemical and genetic perturbations. GSEA-based statistical significance of the correlation is shown.
Table 4
興味深いことに、40Hzの刺激後のトランスクリプトームの変化は、神経活動の増加(NMDA及びビククリンによる)によるものと似ており、静止活動(テトロドトキシンによる)によるものとあまり似ていなかった。これらの知見は、FS-PV介在ニューロンの40Hzの刺激がニューロンの活動を低下させないという観察をさらに支持する。さらに、ニューロンの活動によって上方制御されることが知られている前初期遺伝子Nr4a1、Arc、及びNpas4は、RNA-seq及びRT-qPCRの両方によって示される1時間の40Hzの刺激後に上昇した。図31は、いくつかの実施形態に従って、RNA-seqデータセットにおける特定の遺伝子標的のRT-qPCR検証を示す棒グラフである。この棒グラフは、EYFP3102、及び40Hzの刺激3104条件からの相対的なRNAレベル(発現比)を示す(スチューデントt検定により、1つのアスタリスクはp<0.05を示し、2つのアスタリスクはp<0.01を示し、3つのアスタリスクはp<0.001を示す。1群当たりのマウスn=3)。最大の下方制御された遺伝子は、Grin4及びCamk2dであった(例えば、図31参照、p<0.05、1群当たりのマウスn=3)。
Interestingly, transcriptome changes after 40 Hz stimulation resembled those due to increased neuronal activity (by NMDA and bicuculline) and less so to resting activity (by tetrodotoxin). These findings further support the observation that 40 Hz stimulation of FS-PV interneurons does not reduce neuronal activity. In addition, the immediate early genes Nr4a1, Arc, and Npas4, known to be upregulated by neuronal activity, were elevated after 1 hour of 40 Hz stimulation as shown by both RNA-seq and RT-qPCR. FIG. 31 is a bar graph showing RT-qPCR validation of specific gene targets in an RNA-seq dataset, according to some embodiments. This bar graph shows relative RNA levels (expression ratios) from EYFP3102 and 40
加えて、このトランスクリプトームの結果は、ミクログリアのより多くの食作用状態を示唆する。いくつかの実施形態では、上方制御された遺伝子は、いずれもミクログリアのAβの取り込みを促進することが知られているマクロファージコロニー刺激因子(MCSF)及び顆粒球マクロファージコロニー刺激因子(GMCSF)によって誘導されるゲノム変化と正の相関があった。図32A及び32Bは、いくつかの実施形態に従って、40Hzの光の点滅を見せている間に脳の上で再コード化された局所電場電位のパワースペクトル密度を示すプロットである。図32A及び32Bは、40Hzでのパワーの増加を示さず、従って、この効果は記録機器に対する光電効果や電気的雑音によるものではない(視覚野の記録を受ける3匹の5XFAD動物で4つの記録期ならびに海馬の記録を受ける2匹の5XFAD及び3匹のWTマウスで5つの記録期からの40Hzの点滅周期n=4、2、1、1、17、42、36、55、53)。記録間の平均(実線)及び標準偏差(網掛け領域)を左側(図32A)及び動物ごとのものを右側(図32B)に示す。3未満の点滅周期の記録3202は、より多いデータの記録3204よりも雑音の多いパワースペクトル密度となったが、どれも40Hzのピークの証拠を見せなかった。いくつかの実施形態では、RT-qPCRを実施し、既知のミクログリアの機能に関与する上方制御された遺伝子を検証した。ミクログリアの貪食に関連するCd68、B2m、Bst2、Icam1、及びLyz2等の遺伝子が、40Hzの刺激後、海馬CA1領域で上方制御されることが確認された。
In addition, this transcriptomic result suggests a more phagocytic state of microglia. In some embodiments, the upregulated gene is induced by macrophage colony-stimulating factor (MCSF) and granulocyte-macrophage colony-stimulating factor (GMCSF), both known to promote microglial Aβ uptake. There was a positive correlation with genomic alterations in 32A and 32B are plots showing the power spectral density of re-encoded local field potentials on the brain while exhibiting 40 Hz light blinks, according to some embodiments. Figures 32A and 32B show no increase in power at 40 Hz, thus this effect is not due to photoelectric effects or electrical noise to the recording equipment (four recordings in three 5XFAD animals undergoing visual cortex recordings). 40 Hz blink rate from 5 recording phases in 2 5XFAD and 3 WT mice receiving hippocampal recordings n=4, 2, 1, 1, 17, 42, 36, 55, 53). The mean (solid line) and standard deviation (shaded area) between recordings are shown on the left (Figure 32A) and per animal on the right (Figure 32B).
図33は、いくつかの実施形態に従って、RNA-seqデータセットにおける特定の遺伝子標的のRT-qPCR検証を示す棒グラフである。図33は、EYFP3302及び40Hzの刺激3304条件における相対的なRNAレベル(発現比)を示す(スチューデントt検定により1つのアスタリスクはp<0.05を示し、2つのアスタリスクはp<0.01を示し、1群当たりのマウスn=6)。他の注目に値する上方制御された遺伝子には、ミクログリアに富んだ転写調節因子Irf7、細胞接着及び遊走調節因子Spp1、ならびにミクログリア増殖マーカーCsf1r及びCsf2raが含まれる(例えば、図33参照、スチューデントt検定によりp<0.05及びp<0.01、1群当たりのマウスn=6)。RT-qPCRはまた、炎症性遺伝子Il6、Il1b(Il1-β)、Itgam(CD11-b)、及び抗炎症性遺伝子Igf1の発現レベルが変わらないことを示した(例えば、図33参照、スチューデントt検定によりp>0.05、1群当たりのマウスn=6)。従って、本明細書に記載のトランスクリプトームの結果は、40Hzのニューロン刺激が、ミクログリアを、取り込みを促進する状態に誘導したことを示唆している。
FIG. 33 is a bar graph showing RT-qPCR validation of specific gene targets in an RNA-seq dataset, according to some embodiments. Figure 33 shows relative RNA levels (expression ratios) in EYFP3302 and 40
40Hzの刺激が食作用関連遺伝子及び遊走/細胞接着関連遺伝子の両方を上方制御したという観察を考慮し、ミクログリア活性化の形態学的特徴を調べた。いくつかの実施形態では、1時間の40Hz、ランダム、または無刺激(EYFPマウス)後、5XFAD/PV-Creマウス由来の海馬CA1切片のミクログリアを標識するため、ミクログリアのマーカーIba1を認識する抗体を使用した。図34は、EYFP、40Hz、及びランダム刺激条件における5XFAD/PV-Creマウスの海馬CA1領域での抗Iba1 3402(019-19741)及び抗Aβ 3404(12F4)抗体による免疫組織化学を示す一連の免疫蛍光画像である。画像は、40倍の対物レンズで撮影した(スケールバー=50μm)。矢印は、細胞体中の+Iba1/+Aβシグナルを示す。 Given the observation that 40 Hz stimulation upregulated both phagocytosis-related genes and migration/cell adhesion-related genes, we investigated the morphological features of microglial activation. In some embodiments, antibodies recognizing the microglial marker Iba1 are used to label microglia in hippocampal CA1 sections from 5XFAD/PV-Cre mice after 1 hour of 40 Hz, random, or no stimulation (EYFP mice). used. FIG. 34 is a series of immunizations showing immunohistochemistry with anti-Iba1 3402 (019-19741) and anti-Aβ 3404 (12F4) antibodies in the hippocampal CA1 region of 5XFAD/PV-Cre mice under EYFP, 40 Hz, and random stimulation conditions. It is a fluorescence image. Images were taken with a 40x objective (scale bar = 50 μm). Arrows indicate +Iba1/+Aβ signals in cell bodies.
図35Aは、いくつかの実施形態に従って、EYFP及び40Hz条件でのミクログリアの数を示す棒グラフである(1群当たり4匹のマウスから切片n=2)。図35Bは、いくつかの実施形態に従って、EYFP、40Hz、及びランダム刺激条件におけるEYFPに対して正規化されたミクログリア細胞体の直径を示す棒グラフである(1群当たり4匹のマウスから切片n=2)。図35Cは、EYFP、40Hz、及びランダム刺激条件であるEYFP、40Hz、及びランダムにおけるEYFPに対して正規化されたミクログリアの一次過程または突起の平均長さを示す棒グラフである。図35Dは、いくつかの実施形態に従って、EYFP及び40Hzの刺激条件におけるAβ陽性でもあるIba1陽性(ミクログリア)細胞体の割合を示す棒グラフである(4匹のマウス群から切片n=2)。一元配置分散分析により、注記「n.s.」3502は有意でないことを示し、2つのアスタリスク3504はp<0.01を示し、3つのアスタリスク3506はp<0.001を示し、4つのアスタリスク3508はp<0.0001を示す。
FIG. 35A is a bar graph showing microglia numbers in EYFP and 40 Hz conditions (n=2 sections from 4 mice per group), according to some embodiments. FIG. 35B is a bar graph showing microglial cell body diameter normalized to EYFP in EYFP, 40 Hz, and random stimulation conditions (intersections n = 4 mice per group), according to some embodiments. 2). FIG. 35C is a bar graph showing the mean length of microglial primary processes or processes normalized to EYFP, 40 Hz, and EYFP in the random stimulation conditions EYFP, 40 Hz, and random. FIG. 35D is a bar graph showing the percentage of Iba1-positive (microglial) somata that are also Aβ-positive in EYFP and 40 Hz stimulation conditions (n=2 slices from groups of 4 mice), according to some embodiments. 3502 indicates not significant, 2
第一に、1条件当たり6匹の動物におけるIba1+ミクログリア数を数えたところ、未刺激のEYFP条件(ROI当たり平均8個のミクログリア細胞)(例えば、図34及び35A参照、一元配置分散分析によりp<0.01、1群当たり4匹のマウスから切片n=2)ならびにランダム条件(ROI当たり平均10個のミクログリア細胞)(例えば、図34及び35A参照、一元配置分散分析によりp<0.05、1群当たり4匹のマウスから切片n=2)と比較して、40Hz群で約2倍の数のミクログリア細胞が認められた(212.55μm×212.55μmの目的の領域(ROI)当たり15個のミクログリア細胞)。先行研究では、食細胞ミクログリアの2つの主な特徴は、細胞体のサイズの増加及び過程の長さの減少であることが示された場合があり、従って、これらの特徴がどのように40Hzの刺激によって影響を受けたかを調べた。いくつかの実施形態では、視野内の明確に標識されたIba1+細胞体の各々の直径を測定した。ミクログリア細胞体の直径は、40Hzの刺激後、無刺激と比較して135.3%増加し、ランダム条件と比較して138.7%増加したことが分かった(例えば、図34及び35B参照、一元配置分散分析によりp<0.0001、1群当たり4匹のマウスから切片n=2)。各条件におけるミクログリアの一次過程の長さを測定したところ、40Hzの刺激条件での一次ミクログリア過程の長さにおいてEYFP対照と比較して54.0%の減少及びランダム刺激と比較して38.5%の減少が観察された(例えば、図34及び35C参照、一元配置分散分析によりp<0.0001、1群当たり4匹のマウスから切片n=2)。これらの知見は、条件間でのIba1の発現の差が本明細書に記載の遺伝子発現分析で認められなかったことから、Iba1レベルによっては影響を受けなかった(例えば、表2及び3参照)。従って、40Hzの刺激後に観察された細胞体のサイズの増加及び過程の長さの減少は、これらミクログリアの貪食状態へのシフトと一致する形態学的変化である。Aβ抗体(12F4、これはAPPと交差反応しない)による共免疫染色時、ミクログリア内のAβの潜在的共局在化を、ミクログリアのAβの取り込みを評価する方法として評価した。Iba1+細胞が主に位置するCA1神経網において、細胞体のAβ/Iba1共局在化のミクログリアの数(ImageJ、Fuji共局在化プラグイン)のミクログリアの総数に対する比は、40Hzの刺激後、EYFPと比較して54.9%増加し、ランダム条件と比較して50.3%増加した(例えば、図34及び35C参照、一元配置分散分析によりp<0.01、1群当たり4匹のマウスから切片n=2)。ミクログリア過程におけるIba1/Aβシグナルの重なりは、潜在的にランダムな非貪食共局在化を含めることを避けるために除外した。 First, we counted the number of Iba1+ microglia in 6 animals per condition and found that the unstimulated EYFP condition (mean 8 microglial cells per ROI) (see, e.g., Figures 34 and 35A, one-way ANOVA showed p <0.01, n=2 sections from 4 mice per group) and random conditions (average 10 microglial cells per ROI) (see, e.g., Figures 34 and 35A, p<0.05 by one-way ANOVA). Approximately twice as many microglial cells were found in the 40 Hz group (per 212.55 μm x 212.55 μm region of interest (ROI) as compared to 40 Hz group, n = 2 sections from 4 mice per group). 15 microglial cells). Previous studies may have shown that the two main features of phagocytic microglia are an increase in cell body size and a decrease in process length, thus suggesting how these features are We investigated whether the stimuli affected In some embodiments, the diameter of each distinctly labeled Iba1+ cell body in the field was measured. It was found that the diameter of microglial somata increased by 135.3% after 40 Hz stimulation compared to no stimulation and by 138.7% compared to random conditions (see, e.g., Figures 34 and 35B, p<0.0001 by one-way ANOVA, n=2 sections from 4 mice per group). Microglial primary process length in each condition was measured and showed a 54.0% reduction in primary microglial process length in the 40 Hz stimulation condition compared to EYFP control and 38.5 compared to random stimulation. % reduction was observed (see, eg, FIGS. 34 and 35C, p<0.0001 by one-way ANOVA, n=2 slices from 4 mice per group). These findings were not influenced by Iba1 levels, as no differences in Iba1 expression between conditions were observed in the gene expression analysis described herein (see, e.g., Tables 2 and 3). . Thus, the increased cell body size and decreased process length observed after 40 Hz stimulation are morphological changes consistent with the shift of these microglia toward a phagocytic state. Potential co-localization of Aβ within microglia upon co-immunostaining with an Aβ antibody (12F4, which does not cross-react with APP) was evaluated as a way to assess microglial Aβ uptake. In the CA1 neuropil, where Iba1+ cells are predominantly located, the ratio of the number of soma Aβ/Iba1 colocalized microglia (ImageJ, Fuji colocalization plugin) to the total number of microglia after 40 Hz stimulation was There was a 54.9% increase compared to EYFP and a 50.3% increase compared to the random condition (see, e.g., Figures 34 and 35C, p<0.01 by one-way ANOVA, 4 animals per group). Sections from mice n=2). Overlapping Iba1/Aβ signals in microglial processes were excluded to avoid potentially including random non-phagocytic colocalization.
いくつかの実施形態では、ミクログリア内のAβシグナルの存在のより良好な解決法を提供するため、この組織からのミクログリアの3Dレンダリング及びこれらのレンダリングからの映像を形成した。図36は、いくつかの実施形態に従って、0度3602、Y軸の周りに-25度3604、及びX軸の周りに30度3606回転した図34の免疫蛍光画像を統合して形成された一連の3Dレンダリングである。画像は、40倍の対物レンズで撮影した(スケールバー=50μm)。全体として、遺伝子発現及び形態学的分析は、40Hzの刺激が、ミクログリア細胞の刺激部位への動員を増加させ、それらの貪食活性を高めることによってミクログリア活性に影響を与え、Aβとの結合の増加をもたらすことを示唆している。重要なことには、いくつかの実施形態では、Hoechstによる核染色を用いてCA1細胞層の厚さを測定することによるニューロンの損失の証拠は見られなかった。平均CA1体積は、EYFP及び40Hzの刺激群間で有意な差はなかった。 In some embodiments, 3D renderings of microglia from this tissue and images from these renderings were made to provide a better resolution of the presence of Aβ signal within microglia. FIG. 36 is a series formed by integrating the immunofluorescence images of FIG. is a 3D rendering of Images were taken with a 40x objective (scale bar = 50 μm). Overall, gene expression and morphological analyzes indicate that 40 Hz stimulation affects microglial activity by increasing the recruitment of microglial cells to stimulation sites, enhancing their phagocytic activity, and increasing binding to Aβ. It is suggested that the Importantly, in some embodiments, no evidence of neuronal loss was seen by measuring CA1 cell layer thickness using nuclear staining with Hoechst. Mean CA1 volumes were not significantly different between EYFP and 40 Hz stimulation groups.
図37Aは、いくつかの実施形態に従って、EYFP及び40Hzの刺激条件で、5XFAD/PV-Creの海馬CA1領域におけるHoechstによる免疫組織化学を示す一連の免疫蛍光画像である。図37Bは、いくつかの実施形態に従って、EYFP及び40Hzの刺激条件における5XFAD/PV-Creの推定されるCA1厚さを示す棒グラフである(1群当たりのマウスn=4、スチューデントt検定により、「n.s.」は有意でないことを示す)。 FIG. 37A is a series of immunofluorescence images showing Hoechst immunohistochemistry in the hippocampal CA1 region of 5XFAD/PV-Cre with EYFP and 40 Hz stimulation conditions, according to some embodiments. FIG. 37B is a bar graph showing estimated CA1 thickness of 5XFAD/PV-Cre in EYFP and 40 Hz stimulation conditions (n=4 mice per group, by Student's t-test; "n.s." indicates not significant).
次に、AAV-DIO-ChR2-EYFPに感染し、40HzのFS-PV+刺激(処理)または対照の刺激(CTRL)で刺激された5XFADマウスにおける差次的遺伝子発現を、いくつかの実施形態に従う1時間の刺激後の海馬CA1のゲノムワイドRNA-seqによって評価した。図38Aは、いくつかの実施形態に従って、処理またはCTRL時の海馬CA1のゲノムワイドRNA-seqによって決定された523の差次的に発現される遺伝子(DEG)を示すヒートマップである。図38Aの各列はDEGを表し、図38Aのカラムは、3匹の個々の対照動物及び3匹の個々の処理(40HzのFS=PV+刺激)動物のトランスクリプトーム的プロファイルを表す。 Differential gene expression in 5XFAD mice infected with AAV-DIO-ChR2-EYFP and stimulated with 40 Hz FS-PV+ stimulation (treated) or control stimulation (CTRL) was then analyzed according to some embodiments. Assessed by genome-wide RNA-seq of hippocampal CA1 after 1 hour of stimulation. FIG. 38A is a heatmap showing 523 differentially expressed genes (DEGs) determined by genome-wide RNA-seq of hippocampal CA1 upon treatment or CTRL, according to some embodiments. Each column in FIG. 38A represents a DEG and the columns in FIG. 38A represent the transcriptomic profiles of 3 individual control and 3 individual treated (40 Hz FS=PV+stimulation) animals.
図38Bは、いくつかの実施形態に従って、図38Aの処理条件において上方制御されたDEG間の重なりを示す図である。図38Bでは、FS-PV+の40Hzの刺激を介したガンマ振動の誘導が、免疫蛍光で測定して、ランダムなFS-PV+刺激と比較してIba1レベルを低減する(1群当たりのマウスn=3、p=0.006)。図38Bは、処理条件で上方制御された遺伝子が、抗炎症性ミクログリア活性化によって上方制御されたミクログリア遺伝子(すなわち、MCSF遺伝子)と有意に特異的に重複することを示す。遺伝子は、ミクログリア細胞で、星状細胞、内皮細胞、髄鞘形成乏突起膠細胞(MO)、ニューロン、新たに形成された乏突起膠細胞(NFO)、及び乏突起膠細胞前駆細胞(OPC)におけるよりも大きく上方制御された。表5(下記)は、上方制御された遺伝子のミクログリア/マクロファージ経路を示す。
表5

FIG. 38B illustrates overlap between upregulated DEGs in the process conditions of FIG. 38A, according to some embodiments. In FIG. 38B, induction of gamma oscillations via 40 Hz stimulation of FS-PV+ reduces Iba1 levels compared to random FS-PV+ stimulation as measured by immunofluorescence (n=10 mice per group). 3, p=0.006). FIG. 38B shows that genes upregulated in treatment conditions significantly and specifically overlap with microglial genes upregulated by anti-inflammatory microglial activation (ie, the MCSF gene). Genes are found in microglial cells, astrocytes, endothelial cells, myelinating oligodendrocytes (MOs), neurons, newly formed oligodendrocytes (NFOs), and oligodendrocyte progenitor cells (OPCs). was upregulated to a greater extent than in Table 5 (below) shows the microglial/macrophage pathway of upregulated genes.
Table 5
いくつかの実施形態に従って、RT-qPCRを実施し、RNA-seqデータセットから特定の遺伝子標的を検証した。図39は、いくつかの実施形態に従って、図38AのRNA-seqデータセットにおける特定の遺伝子標的のRT-qPCR検証を示す棒グラフである。具体的には、図39は、遺伝子CSF1、CSF1R、Il-6、Il1-Beta、CD11-b、CYBA、Hmox1、H2-K1、Lgals3、及びIcam1等の対照及び処理条件における特定の遺伝子標的の発現比(GAPDHに対して正規化)を示す。 According to some embodiments, RT-qPCR was performed to validate specific gene targets from RNA-seq datasets. FIG. 39 is a bar graph showing RT-qPCR validation of specific gene targets in the RNA-seq dataset of FIG. 38A, according to some embodiments. Specifically, FIG. 39 shows the performance of specific gene targets in control and treatment conditions, such as genes CSF1, CSF1R, Il-6, Il1-Beta, CD11-b, CYBA, Hmox1, H2-K1, Lgals3, and Icam1. Expression ratios (normalized to GAPDH) are shown.
図40は、いくつかの実施形態に従って、図38Aの上方制御された遺伝子が関連する生物学的過程を示すプロットである。重要なことには、図40の上方制御された遺伝子は、免疫関連の過程と特異的に関連している。上方制御された遺伝子は、リンパ球介在、適応免疫、及び免疫グロブリン介在過程を含めた免疫関連の生物学的過程に属していた。図41は、いくつかの実施形態に従って、図38Aの下方制御された遺伝子が関連する生物学的過程を示すプロットである。図41に示すように、下方制御された遺伝子は、細胞運動、細胞間シグナル伝達、シナプス伝達、運動器官の行動、及びニューロンの突起を含めた生物学的過程に属していた。 FIG. 40 is a plot showing biological processes associated with the upregulated genes of FIG. 38A, according to some embodiments. Importantly, the upregulated genes in Figure 40 are specifically associated with immune-related processes. The upregulated genes belonged to immune-related biological processes including lymphocyte-mediated, adaptive immunity, and immunoglobulin-mediated processes. FIG. 41 is a plot showing biological processes associated with the downregulated genes of FIG. 38A, according to some embodiments. As shown in Figure 41, the down-regulated genes belonged to biological processes including cell motility, cell-to-cell signaling, synaptic transmission, locomotory behavior, and neuronal projection.
図42Aは、いくつかの実施形態に従って、対象の海馬のCA1領域の異なる型の刺激後のIba1のレベルを示す一連の免疫蛍光画像である。図42Bは、いくつかの実施形態に従って、図42Aの免疫蛍光画像に対する平均強度値を示す棒グラフである。図42Aは、エンドソームレベルが、ガンマリズムの光遺伝学的増強によって低減されることを示す。FS-PV+の40Hzの刺激を介したガンマ振動の誘導が、免疫蛍光によって測定されるように、EEA1(エンドソームのマーカー)のレベルを低減した(1群当たりのマウスn=3、p=0.08)。この結果は、エンドソームレベルの増加はAPPのプロセシング、ひいてはAβの産生の増加を示すことから、ガンマ振動が、ADのマウスモデルにおいてAβの産生を低減することを示した。 FIG. 42A is a series of immunofluorescence images showing levels of Iba1 following different types of stimulation of the CA1 region of the hippocampus of a subject, according to some embodiments. FIG. 42B is a bar graph showing mean intensity values for the immunofluorescence images of FIG. 42A, according to some embodiments. FIG. 42A shows that endosomal levels are reduced by optogenetic enhancement of gamma rhythm. Induction of gamma oscillations via 40 Hz stimulation of FS-PV+ reduced levels of EEA1 (an endosomal marker) as measured by immunofluorescence (n=3 mice per group, p=0. 08). The results showed that gamma oscillations reduce Aβ production in a mouse model of AD, as increased endosomal levels indicate increased APP processing and thus Aβ production.
総合すれば、本試験の結果は、ADのマウスモデルにおいて、ガンマリズムの回復または誘導が分子病態を回復させることを示した。光遺伝学による細胞型特異的な及び時間的に正確なガンマ振動の再導入は、凝集してADの神経病理学に関与する多くの変性カスケードを開始するペプチドであるアイソフォームAβ1-40及びAβ1-42の生成を低減し、かつこれらのクリアランスを高めた。さらに、この処理は、神経変性に関連する免疫機構に対抗する抗炎症ミクログリアシグナル伝達経路を誘導した。 Taken together, the results of this study demonstrated that restoration or induction of gamma rhythm reverses molecular pathology in a mouse model of AD. Cell-type-specific and temporally precise reintroduction of gamma oscillations by optogenetics is associated with isoforms Aβ 1-40 , peptides that aggregate and initiate many degenerative cascades involved in the neuropathology of AD. It reduced the production of Aβ 1-42 and enhanced their clearance. Moreover, this treatment induced anti-inflammatory microglial signaling pathways that counter immune mechanisms associated with neurodegeneration.
いくつかの実施形態によれば、細胞型特異的で時間的に制御されたガンマ振動は、海馬、視覚野、バレル皮質、及び/または聴覚野において光遺伝学なしで誘導され得る。 According to some embodiments, cell type-specific, temporally controlled gamma oscillations can be induced without optogenetics in the hippocampus, visual cortex, barrel cortex, and/or auditory cortex.
ガンマ周波数での視覚刺激は、視覚野において非侵襲的にガンマ振動を駆動した。
40Hzでの光遺伝学的刺激によってAβレベルが強く低下したことで、脳において40Hzの振動を誘導する他の方法を探索し、この効果が光遺伝学的操作または侵襲的方法に何らかの形で特異的ではないことを確かめるに至った。光の点滅が視覚野において40Hzの振動を誘導する非侵襲的方法として使用できるかどうかを調べるため、いくつかの実施形態では、動物を暗周期と交互配置された40Hzまたはランダムな点滅、及び連続光の周期に曝露した。
Visual stimuli at gamma frequencies noninvasively drove gamma oscillations in the visual cortex.
The strong reduction in Aβ levels by optogenetic stimulation at 40 Hz prompted us to explore other ways of inducing 40 Hz oscillations in the brain, suggesting that this effect is somehow specific to optogenetic manipulation or invasive methods. I was able to confirm that it was not the target. To investigate whether light blinking can be used as a non-invasive method of inducing 40 Hz oscillations in the visual cortex, in some embodiments, animals were subjected to 40 Hz or random blinks interleaved with the dark period and continuous Exposure to light cycles.
図43Aは、いくつかの実施形態に従って、光の点滅刺激に曝露されたマウスを示す概略図である。この光の点滅がAβを変更するかどうかを判定するため、本明細書に記載のAβを減少させた光遺伝学的刺激の期間と一致する1時間、動物を40Hzの光の点滅に曝露した。光の点滅は、動物の視界全体を覆った。分子及び細胞アッセイの対照として、3か月齢の5XFADマウスを3日間恒暗に維持したか、1時間恒明もしくは20Hzの点滅光、または80Hzの点滅光で処理した(例えば、図43A参照)。 FIG. 43A is a schematic diagram showing a mouse exposed to a blinking light stimulus, according to some embodiments. To determine whether this light blink modifies Aβ, animals were exposed to 40 Hz light blinks for 1 hour, coinciding with the duration of the Aβ-lowering optogenetic stimulation described herein. . Flashes of light covered the animal's entire field of vision. As controls for molecular and cellular assays, 3-month-old 5XFAD mice were kept in constant darkness for 3 days or treated with 1 hour of constant light or 20 Hz flashing light, or 80 Hz flashing light (see, eg, Figure 43A).
図43Bは、いくつかの実施形態に従って、40Hzの光の点滅の前及び最中の視覚野における局所電場電位トレースならびにパワースペクトル密度のプロットを含む。パワースペクトル密度の平均(実線)及び標準偏差(網掛け領域)を、視覚野において40Hzの光の点滅4302、ランダムな光の点滅4304、または暗4306の期間中で示す(5つの記録期から5FXFADマウスn=4)。図43C~43Fは、いくつかの実施形態に従って、それぞれ40Hzの光の点滅、ランダムな光の点滅、恒暗、及び恒明の過程で、各マウスに対して各記録期の視覚野における局所電場電位のパワースペクトル密度を示すプロットである(47、51、61、49、16の40Hzの点滅、47、50、64、50、16のランダムな点滅、279、302、382、294、93の暗、及び47、50、64、49、15の明周期で、4匹の5XFADマウスからの記録n=5)。視覚野において、40Hzでの光の点滅は、40HzでLFPのパワーを増大させ(例えば、図43B及び43C参照)、一方、ランダム間隔の光の点滅及び暗黒は増大させない(例えば、図43B、43D、及び43E参照)ことが分かった。
FIG. 43B includes local field potential traces and power spectral density plots in the visual cortex before and during 40 Hz light blinking, according to some embodiments. Mean (solid line) and standard deviation (shaded area) of power spectral densities are shown during periods of 40 Hz
図44Aは、いくつかの実施形態に従って、4サイクルの40Hzの光の点滅に関する時間の関数及びランダムな光の点滅に関する同等の期間の関数としての視覚野におけるスパイクの割合を示す一連のヒストグラムである。図44Aは、4サイクルの40Hzの光の点滅に関する時間の関数4402またはランダムな光の点滅の同等の期間の関数4404としての視覚野におけるスパイクの割合のヒストグラムを示す(5つの記録期から5XFADマウスn=4、バーは平均を示し、エラーバーは動物間のSEMを示す)。上側のバーは、光がオン4406またはオフ4408の場合を示す。いくつかの実施形態では、スパイキングは光がオンとオフに点滅するにつれて増加及び減少し、40Hzの刺激の最中の40Hzの周波数に同期されたスパイキング位相をもたらした(図44Aのヒストグラム4402)が、ランダム刺激の最中には明らかな周波数は現れなかった(図44Aのヒストグラム4404)。
FIG. 44A is a series of histograms showing percent spikes in the visual cortex as a function of time for 4 cycles of 40 Hz light blinks and the equivalent duration for random light blinks, according to some embodiments. . FIG. 44A shows histograms of percent spikes in the visual cortex as a function of
図44Bは、いくつかの実施形態に従って、光の点滅の間の脳の上で記録された局所電場電位の一連の電気トレースである。いくつかの実施形態では、脳の直上の生理食塩水から記録した場合、40Hzの点滅の最中に40Hzのパワーに増加は見られず、この効果が光電効果や電気的雑音によるものではないことを示した(例えば、図32及び44B参照)。光遺伝学的刺激と同様、ランダムな点滅は、光の点滅による活性の全体的な変化用の対照を提供した。 FIG. 44B is a series of electrical traces of local field potentials recorded over the brain during light blinking, according to some embodiments. In some embodiments, there is no increase in 40 Hz power during 40 Hz blinks when recorded from saline just above the brain, indicating that this effect is not due to the photoelectric effect or electrical noise. (see, eg, FIGS. 32 and 44B). Similar to optogenetic stimulation, random blinking provided a control for global changes in activity due to blinking light.
図45Aは、いくつかの実施形態に従って、40Hzの光の点滅及びランダムな光の点滅の間の発火率の差を示すヒストグラムである(4匹の5XFADマウスにおける5つの記録期から刺激周期n=226)。図45Bは、いくつかの実施形態に従って、40Hzの光の点滅、ランダムな光の点滅、暗、及び明周期中の視覚野におけるマルチユニット発火率を示すプロットである。図45Bは、視覚野におけるマルチユニット発火率を示す。箱ひげ図は、中央値(箱内の白線)及び四分位数(箱の上下)を示す。すべての動物において、発火率は40Hzの点滅及びランダムな点滅条件の間に有意な差はなく、このランダム刺激条件がスパイキング活動の対照としての役割を果たすことを示した(4匹の5XFADマウスからの5つの記録期の各々に対する順位和検定、p>0.06、中央値と四分位数を図に示す。記録当たり40Hzの点滅周期n=47、51、64、49、16及びランダムな点滅周期47、50、64、50、16)。40Hzの点滅及び明条件間で発火率に有意な差はなく、40Hzの光の点滅は、概してニューロンの過剰興奮性を引き起こさなかったことを示した(4匹の5XFADマウスからの5つの記録期の各々に対する順位和検定、4つの記録期についてp>0.2、1つの記録期についてp<0.01、これは複数の比較の実施に対して補正された場合に有意でない。中央値と四分位数を図に示す。記録当たりの40Hz周期n=47、51、64、49、16及び明周期47、50、64、49、16)。1つの期において、40Hzの刺激で暗条件におけるより活動が多かった。40Hz及びランダムな点滅周期間のマルチユニット発火率の差は、ゼロに近い傾向があった(例えば、45A参照)。また、これらの周期を動物内で比較すると、有意な差は見られなかった(例えば、図45B参照。4匹の5XFADマウスからの5つの記録期の各々に関する順位和検定、p>0.06、中央値と四分位数を図に示す。記録当たりガンマ点滅周期n=47、51、64、49、16及びランダムな点滅周期47、50、64、50、16)。
FIG. 45A is a histogram showing the difference in firing rate between 40 Hz light blinking and random light blinking (stimulation period n = 226). FIG. 45B is a plot showing multi-unit firing rates in the visual cortex during 40 Hz light blinking, random light blinking, dark, and light cycles, according to some embodiments. FIG. 45B shows multiunit firing rates in the visual cortex. Boxplots show medians (white lines within boxes) and quartiles (above and below boxes). Firing rates were not significantly different between 40 Hz blinking and random blinking conditions in all animals, indicating that this random stimulus condition served as a control for spiking activity (four 5XFAD mice Rank sum test, p>0.06, median and quartiles for each of the five recording periods from 40 Hz blinking periods per recording n = 47, 51, 64, 49, 16 and
ガンマ周波数での視覚刺激は、視覚野においてAβレベルを低減する。
光遺伝学的方法の有効性を考慮して、翻訳的で非侵襲的なアミロイド低減処理を設計した。図46Aは、いくつかの実施形態に従う実験的パラダイムを示す概略図である。図46Aに示すように、ADモデルマウスの第一のサブセットを、40Hzの閃光灯を備えた第一のチャンバー4600に入れ、ADモデルマウスの第二のサブセットを、暗くしておいた第二のチャンバー4602に入れた。第一のチャンバー4600内の動物を約1時間、40Hzの閃光灯に曝露した。
Visual stimulation at gamma frequencies reduces Aβ levels in the visual cortex.
Given the efficacy of optogenetic methods, a translational, non-invasive amyloid-reducing treatment was designed. FIG. 46A is a schematic diagram showing an experimental paradigm according to some embodiments. As shown in FIG. 46A, a first subset of AD model mice was placed in a
図46B及び46Cは、いくつかの実施形態に従って、図46Aの実験的パラダイム後、それぞれ、AβペプチドアイソフォームAβ1-40及びAβ1-42のベースラインレベルの変化をさらに示すプロットである。図46Bは、5XFADマウスの視覚野V1における40Hzの光の曝露が有意にAβ1-40及びAβ1-42レベルを低下させたことを示す。Aβ1-40及びAβ1-42のレベルは、pg/mLとして示す(1群当たりの動物n=6)。 Figures 46B and 46C are plots further illustrating changes in baseline levels of Aβ peptide isoforms Aβ 1-40 and Aβ 1-42 , respectively, after the experimental paradigm of Figure 46A, according to some embodiments. FIG. 46B shows that 40 Hz light exposure significantly reduced Aβ 1-40 and Aβ 1-42 levels in visual cortex V1 of 5XFAD mice. Levels of Aβ 1-40 and Aβ 1-42 are presented as pg/mL (n=6 animals per group).
40Hzの光の点滅が40Hzの振動を一次視覚野で駆動し、40Hzの振動の光遺伝学的誘導が海馬のAβレベルを低下させたことを考慮すると、目的は、40Hzの光の点滅が視覚野においてAβレベルを低下させ得るかどうかを判定することとなった。これらの実験のため、いくつかの実施形態では、発症前の3か月齢の5XFADマウスを用いた。これらマウスを暗箱に入れ、40Hzの光の点滅、恒明オン(明)、または恒明オフ(暗)のいずれかに1時間曝露した。 Given that 40 Hz light blinking drove 40 Hz oscillations in the primary visual cortex, and that optogenetic induction of 40 Hz oscillations lowered hippocampal Aβ levels, the aim was to demonstrate that 40 Hz light blinking stimulates visual perception. It was decided to determine whether Aβ levels could be reduced in the field. For these experiments, in some embodiments, presymptomatic 3-month-old 5XFAD mice were used. The mice were placed in a dark box and exposed for 1 hour to either flashing 40 Hz light, constant light on (bright), or constant light off (dark).
図47A及び47Bは、いくつかの実施形態に従って、暗、明、40Hzの点滅、20Hzの点滅、80Hzの点滅、40Hzの点滅及びピクロトキシン(PTX)、ならびにランダムな点滅条件において、それぞれ、5XFADの視覚野におけるAβ1-40及びAβ1-42のベースラインレベルの変化を示す棒グラフである(暗については1群当たりのマウスn=12、明、40Hzの点滅、20Hzの点滅、80Hzの点滅、及びPTXについては1群当たりのマウスn=6、ランダムな点滅については1群当たりのマウスn=4、一元配置分散分析により、「n.s.」は有意でないことを示し、1つのアスタリスクはp<0.05を示し、2つのアスタリスクはp<0.01を示す)。図47及び47Bは、平均及びSEMを示す。棒グラフのバーに重ねられた円は、各群の個々のデータ点を示す。露光の1時間後、暗条件と比較して、視覚野におけるAβ1-40レベルは57.96%低下し、Aβ1-42レベルは57.97%低下したことが観察された(AβのELISAにより測定。例えば、図47A及び47B参照。一元配置分散分析によりp<0.05。1群当たりのマウスn=6)。明対照と比較して、40Hzの点滅1時間後では、アミロイドレベルは62.47%(Aβ1-40)及び68.55%(Aβ1-42)減少した(AβのELISAにより測定。例えば、図47参照。一元配置分散分析によりp<0.05。1群当たりのマウスn=6)。さらに、この効果は、20Hz、80Hz、またはランダムな点滅のいずれも暗及び明対照と比較して有意にAβレベルを低減しなかったことから、40Hzの点滅に特異的であった(例えば、図47参照。「n.s.」は有意でないことを示す。1群当たりのマウスn=6)。 FIGS. 47A and 47B show visual effects of 5XFAD in dark, bright, 40 Hz blink, 20 Hz blink, 80 Hz blink, 40 Hz blink and picrotoxin (PTX), and random blink conditions, respectively, according to some embodiments. Bar graph showing changes in baseline levels of Aβ 1-40 and Aβ 1-42 in the field (n=12 mice per group for dark, light, 40 Hz blinks, 20 Hz blinks, 80 Hz blinks, and n=6 mice per group for PTX, n=4 mice per group for random blinking, one-way ANOVA indicated "n.s." not significant, one asterisk for p <0.05, double asterisks indicate p<0.01). Figures 47 and 47B show the mean and SEM. Circles superimposed on bar graph bars indicate individual data points in each group. A 57.96% reduction in Aβ 1-40 levels and a 57.97% reduction in Aβ 1-42 levels in the visual cortex was observed after 1 hour of exposure compared to dark conditions (Aβ ELISA 47A and 47B, p<0.05 by one-way ANOVA, n=6 mice per group). Compared to light controls, amyloid levels were reduced by 62.47% (Aβ 1-40 ) and 68.55% (Aβ 1-42 ) after 1 hour of 40 Hz blinking (as determined by Aβ ELISA. See Figure 47. p<0.05 by one-way ANOVA, n=6 mice per group). Moreover, this effect was specific to 40 Hz blinking, as neither 20 Hz, 80 Hz, or random blinking significantly reduced Aβ levels compared to dark and light controls (e.g., Fig. See 47. "n.s." indicates not significant, n=6 mice per group).
いくつかの実施形態では、局所的な特異性を試験するため、体性感覚バレル皮質(BC)におけるAβレベルを調べたところ、有意な差は見られなかった。図48Aは、いくつかの実施形態に従って、暗及び40Hzの点滅条件下での5XFADのバレル皮質における相対的なAβ1-40及びAβ1-42のレベルを示す棒グラフである(1群当たりのマウスn=3。スチューデントt検定により「n.s.」は有意でないことを示す)。5XFADマウスを少量のGABA-Aアンタゴニスト(ピクロトキシン、0.18mg/kg、これはてんかん性活動を誘導しない)で前処理したところ、40Hzの点滅のAβレベルに対する効果は完全に無効になり、十中八九FS-PV介在ニューロンからのGABA作動性シグナル伝達が本効果に必要であることを示した(例えば、図47参照。「n.s.」は有意でないことを示す。1群当たりのマウスn=6)。 In some embodiments, to test for local specificity, Aβ levels in the somatosensory barrel cortex (BC) were examined and no significant differences were found. FIG. 48A is a bar graph showing relative Aβ 1-40 and Aβ 1-42 levels in the barrel cortex of 5XFAD under dark and 40 Hz blink conditions (mice per group), according to some embodiments. n=3. Student's t-test indicates "n.s." is not significant). Pretreatment of 5XFAD mice with a low dose of a GABA-A antagonist (picrotoxin, 0.18 mg/kg, which does not induce epileptic activity) completely abolished the effect of 40 Hz blinking on Aβ levels, leading to FS - showed that GABAergic signaling from PV interneurons is required for this effect (see, eg, Figure 47. "n.s." indicates non-significant. n = 6 mice per group). ).
この効果が5XFADマウスに特異的でないことを示すため、この結果を、異なるADモデルであるAPP/PS1マウス、すなわち、2つの家族性AD変異(APPスウェーデン型及びPSEN1デルタE9)を有する十分に検証されたモデルで再現した。図48Bは、いくつかの実施形態に従って、暗及び40Hzの点滅条件下でのAPP/PS1の視覚野におけるAβ1-40及びAβ1-42のベースラインレベルの変化を示す棒グラフである(暗条件については1群当たりのマウスn=5及び40Hzの点滅条件については1群当たりのマウスn=4。スチューデントt検定により「n.s.」は有意でないことを示し、1つのアスタリスクはp<0.05を示す)。 To show that this effect is not specific to 5XFAD mice, this result was fully validated in a different model of AD, APP/PS1 mice, with two familial AD mutations (APP Swedish and PSEN1 delta E9). It was reproduced with a model that was designed. FIG. 48B is a bar graph showing changes in baseline levels of Aβ 1-40 and Aβ 1-42 in the APP/PS1 visual cortex under dark and 40 Hz blink conditions (dark condition; n=5 mice per group for and n=4 mice per group for the 40 Hz flickering condition Student's t-test indicates "n.s." is not significant, one asterisk indicates p<0 .05).
図48Cは、いくつかの実施形態に従って、暗及び40Hzの点滅条件下でのWTの視覚野におけるAβ1-40及びAβ1-42のベースラインレベルの変化を示す棒グラフである(暗条件については1群当たりのマウスn=11及び40Hzの点滅条件については1群当たりのマウスn=9。スチューデントt検定により1つのアスタリスクはp<0.05を示す)。いくつかの実施形態では、40Hzの点滅処理後のAPP/PS1マウスにおいて、20.80%で有意に低下したAβ1-40及び37.68%で減少傾向のAβ1-42が見出されたが、後者は暗条件と有意差がなかった(例えば、図48B参照。スチューデントt検定によりAβ1-40 p<0.05、Aβ1-42 p<0.09、すなわち有意でない。暗条件については1群当たりのマウスn=5、40Hzの点滅については1群当たりのマウスn=4)。加えて、老齢WTマウスでは、40Hzの点滅1時間後に内因性のマウスAβ1-40の58.2%の低下が見られた(例えば、図48C参照。スチューデントt検定によりp<0.05。暗マウスn=11及び40Hzの点滅マウスn=9)。Aβ1-42は、これら動物の点滅及び対照群の両方で検出可能レベル未満であった。WT動物における内因性マウスAβ1-40の低下は、これらの結果がTgのAPP発現や変異型APPに限定されない可能性があることを明らかにし、むしろ、それらは、その内因性プロモーターが駆動する発現を伴うAPPから産生されるAβにまで及ぶ可能性がある。図48A~48Cは、平均及びSEMを示す。 FIG. 48C is a bar graph showing changes in baseline levels of Aβ 1-40 and Aβ 1-42 in WT visual cortex under dark and 40 Hz flicker conditions (no n=11 mice per group and n=9 mice per group for the blinking condition at 40 Hz, one asterisk indicates p<0.05 by Student's t-test). In some embodiments, 20.80% significantly decreased Aβ 1-40 and 37.68% decreased Aβ 1-42 were found in APP/PS1 mice after 40 Hz blinking treatment. However, the latter was not significantly different from the dark condition (see, for example, FIG. 48B. Aβ 1-40 p<0.05, Aβ 1-42 p<0.09 by Student's t-test, ie not significant.) n=5 mice per group for , n=4 mice per group for blinking at 40 Hz). In addition, aged WT mice showed a 58.2% reduction in endogenous mouse Aβ 1-40 after 1 hour of 40 Hz blinking (see, eg, FIG. 48C, p<0.05 by Student's t-test). Dark mouse n=11 and 40 Hz flashing mouse n=9). Aβ 1-42 was below detectable levels in both blinking and control groups of these animals. Reduction of endogenous murine Aβ 1-40 in WT animals reveals that these results may not be restricted to Tg APP expression or mutant APP, but rather they are driven by its endogenous promoter. It may extend to Aβ produced from APP with expression. Figures 48A-48C show the mean and SEM.
次に、いくつかの実施形態では、40Hzの点滅が視覚野においてミクログリア活性を変更するかどうかに関する調査を、40Hzの光遺伝学的なFS-PV介在ニューロンの刺激が海馬CA1のミクログリアを変更した方法と同じ方法で実施した。図49は、いくつかの実施形態に従って、暗及び40Hzの点滅条件下での5XFADの視覚野に抗Iba1(019-19741)及び抗Aβ4904(12F4)抗体による免疫組織化学を示す一連の免疫蛍光画像である。画像は、40倍の対物レンズで撮影した(スケールバー=50μm)。右:120倍ズーム、矢印は細胞体における+Iba1/+Aβシグナルを示す。 Next, in some embodiments, we investigated whether 40 Hz blinking altered microglial activity in the visual cortex, and 40 Hz optogenetic stimulation of FS-PV interneurons altered hippocampal CA1 microglia. It was performed in the same way as the method. FIG. 49 is a series of immunofluorescence images showing immunohistochemistry with anti-Iba1 (019-19741) and anti-Aβ4904 (12F4) antibodies in 5XFAD visual cortex under dark and 40 Hz blink conditions, according to some embodiments. is. Images were taken with a 40x objective (scale bar = 50 μm). Right: 120x zoom, arrow indicates +Iba1/+Aβ signal in the cell body.
図50Aは、いくつかの実施形態に従って、暗及び40Hzの点滅条件におけるミクログリア数を示す棒グラフである(1群当たり4匹のマウスから切片n=2。スチューデントt検定により「n.s.」は有意でないことを示す)。図50Bは、いくつかの実施形態に従って、暗及び40Hzの点滅条件における対照に対して正規化されたミクログリア細胞体の直径を示す棒グラフである(1群当たり4匹のマウスから切片n=2。スチューデントt検定により2つのアスタリスクはp<0.01を示す)。図50Cは、いくつかの実施形態に従って、暗及び40Hzの点滅条件における対照に対して正規化されたミクログリアの一次過程の平均長さを示す棒グラフである(1群当たり4匹のマウスから切片n=2。スチューデントt検定により4つのアスタリスクはp<0.0001を示す)。図50Dは、いくつかの実施形態に従って、暗及び40Hzの点滅条件下でのAβ陽性でもあるIba1陽性(ミクログリア)細胞体の割合を示す棒グラフである(1群当たり4匹のマウスから切片n=2。スチューデントt検定により2つのアスタリスクはp<0.01を示す)。図50A~50Dは平均及びSEMを示す。 FIG. 50A is a bar graph showing microglia numbers in dark and 40 Hz flicker conditions (n=2 intercepts from 4 mice per group. not significant). FIG. 50B is a bar graph showing microglial cell body diameter normalized to control in dark and 40 Hz blink conditions (n=2 sections from 4 mice per group), according to some embodiments. Double asterisks indicate p<0.01 by Student's t-test). FIG. 50C is a bar graph showing the mean length of primary microglial processes normalized to control in dark and 40 Hz flicker conditions (intersections n from 4 mice per group), according to some embodiments. = 2. Four asterisks indicate p<0.0001 by Student's t-test). FIG. 50D is a bar graph showing the percentage of Iba1-positive (microglial) cell bodies that are also Aβ-positive under dark and 40 Hz blinking conditions (sections from 4 mice per group; 2. Double asterisks indicate p<0.01 by Student's t-test). Figures 50A-50D show the average and SEM.
いくつかの実施形態では、Iba1を用いて40Hzの点滅または暗条件の1時間後、5XFADマウスの視覚野切片においてミクログリアを標識した(例えば、図49参照)。ミクログリアの数は暗及び40Hzの点滅条件間で差はなかった(例えば、図49及び50A参照。「n.s.」は有意でないことを示す。1群当たり4匹のマウスから切片n=2)が、ミクログリア細胞体の直径は、視覚野において40Hzの点滅後、暗対照と比較して65.8%増加した(例えば、図49及び50B参照。スチューデントt検定によりp<0.01。1群当たり4匹のマウスから切片n=2)。ミクログリアの一次過程の長さは、40Hzの点滅条件において暗対照と比較して37.7%減少した(例えば、図49及び50C参照。スチューデントt検定によりp<0.0001。1群当たり4匹のマウスから切片n=2)。視覚野のミクログリアは貪食活性の増強を示す形態を有することから、いくつかの実施形態では、Aβを有するミクログリアの数を調べた。本実験のため、視覚野の切片をIba1及びAβ(12F4)抗体で共標識した。細胞体内におけるAβ/Iba1の共局在化は、40Hzの点滅条件で33.5%増加し、これは、40Hzの点滅が暗対照条件より多くのAβを有するミクログリアをもたらすことを示した(例えば、図49及び50D参照。スチューデントt検定によりp<0.01。1群当たり4匹のマウスから切片n=2)。 In some embodiments, Iba1 was used to label microglia in visual cortex sections of 5XFAD mice after 1 hour of 40 Hz blinking or dark conditions (see, eg, FIG. 49). Numbers of microglia did not differ between dark and 40 Hz blink conditions (see, e.g., Figures 49 and 50A. "n.s." indicates not significant. n = 2 sections from 4 mice per group). ), but the diameter of microglial somata increased by 65.8% compared to dark controls after 40 Hz blinking in the visual cortex (see, eg, FIGS. 49 and 50B. p<0.01 by Student's t-test). Sections n=2 from 4 mice per group). Microglial primary process length was reduced by 37.7% compared to dark controls in the 40 Hz flicker condition (see, eg, Figures 49 and 50C. p<0.0001 by Student's t-test. 4 animals per group). mice n=2). Because visual cortex microglia have morphologies that exhibit enhanced phagocytic activity, in some embodiments, the number of microglia with Aβ was examined. For this experiment, sections of visual cortex were co-labeled with Iba1 and Aβ(12F4) antibodies. Colocalization of Aβ/Iba1 in the cell body was increased by 33.5% in the 40 Hz blink condition, indicating that 40 Hz blink resulted in microglia with more Aβ than the dark control condition (e.g. 49 and 50D, p<0.01 by Student's t-test, n=2 sections from 4 mice per group).
いくつかの実施形態では、ミクログリアにおける形態学的変化のより良好な解決法を提供するため、CLARITYを用いて視覚野の100μm切片からミクログリアの3Dレンダリングを形成し、これらのレンダリングから映像を形成した。図51は、0°5102、X軸の周りに45°5104、及びY軸の周りに45°5106回転したCLARITY処理された100μmの組織片からの暗及び40Hzの点滅条件下でのIba+ミクログリアの一連の3Dレンダリング(免疫蛍光画像から)である。画像は63倍の対物レンズで撮影した(スケールバー=15μm)。最後に、5XFADマウスでミクログリアが実際にAβを貪食することを示すため、5XFAD及びWT動物由来のミクログリアを、蛍光活性化細胞分類(FACS)を用いて精製し、AβレベルをELISAにより分析した。 In some embodiments, to provide a better resolution of the morphological changes in microglia, CLARITY was used to generate 3D renderings of microglia from 100 μm sections of the visual cortex and images were generated from these renderings. . FIG. 51 shows Iba+ microglia under dark and 40 Hz blink conditions from CLARITY-treated 100 μm sections rotated 0° 5102, 45° 5104 about the X-axis, and 45° 5106 about the Y-axis. A series of 3D renderings (from immunofluorescence images). Images were taken with a 63x objective (scale bar = 15 μm). Finally, to show that microglia indeed phagocytose Aβ in 5XFAD mice, microglia from 5XFAD and WT animals were purified using fluorescence activated cell sorting (FACS) and Aβ levels were analyzed by ELISA.
図52Aは、いくつかの実施形態に従って、蛍光活性化細胞分類(FACS)を用いて視覚野からミクログリアを単離する方法を示す流れ図である。視覚野を切断し、その後単一細胞を懸濁し、CD11b及びCD45抗体で標識した。続いて、細胞を蛍光活性化細胞分類(FACS)により分類し、溶解した。Aβ1-40レベルをELISAにより分析した。図52Bは、いくつかの実施形態に従って、図52Aの方法を用いて3か月齢の5XFAD及びWT対照動物の視覚野から単離されたミクログリアにおけるAβ1-40のレベルを示す棒グラフである(5XFADについては1群当たりのマウスn=8及びWTマウスについては1群当たりのマウスn=4。スチューデントt検定により1つのアスタリスクはp<0.05を示す)。棒グラフのバーに重ねられた円は、各群の個々のデータ点を示す。 FIG. 52A is a flow chart showing a method of isolating microglia from visual cortex using fluorescence-activated cell sorting (FACS), according to some embodiments. Visual cortex was sectioned and single cells were then suspended and labeled with CD11b and CD45 antibodies. Cells were subsequently sorted by fluorescence activated cell sorting (FACS) and lysed. Aβ 1-40 levels were analyzed by ELISA. FIG. 52B is a bar graph showing levels of Aβ 1-40 in microglia isolated from the visual cortex of 3 month old 5XFAD and WT control animals using the method of FIG. 52A (5XFAD n=8 mice per group for WT mice and n=4 mice per group for WT mice (single asterisk indicates p<0.05 by Student's t-test). Circles superimposed on bar graph bars indicate individual data points in each group.
図53Aは、いくつかの実施形態に従って、暗及び40Hzの点滅条件下での3か月齢の5XFADの視覚野におけるシナプトフィジンを検出するためのSVP38抗体による免疫組織化学を示す一連の免疫蛍光画像である。画像は、40倍の対物レンズで撮影した(スケールバー=50μm)。右:100倍の暗及び40Hzの点滅条件。図53Bは、いくつかの実施形態に従って、暗及び40Hzの点滅条件後の5XFADの視覚野の相対的なSVP38の強度レベルを示す棒グラフである(1群当たりのマウスn=4。スチューデントt検定により「n.s.」は有意でないことを示す)。 FIG. 53A is a series of immunofluorescence images showing immunohistochemistry with SVP38 antibody to detect synaptophysin in the visual cortex of 3-month-old 5XFAD under dark and 40 Hz blink conditions, according to some embodiments. . Images were taken with a 40x objective (scale bar = 50 μm). Right: 100x dark and 40Hz blinking conditions. FIG. 53B is a bar graph showing relative SVP38 intensity levels in 5XFAD visual cortex after dark and 40 Hz flicker conditions (n=4 mice per group. By Student's t-test), according to some embodiments. "n.s." indicates not significant).
Aβのミクログリア特異的レベルは、WT対照と比較して5XFAD動物で有意に高く、5XFADマウスでは27.2pg/104ミクログリアのレベルであり、WT対照マウスでは9.78pg/104ミクログリアのレベルであることが分かった(例えば、図52A及び52B参照。スチューデントt検定によりp<0.05。5XFADについてはn=8及びWTマウスについてはn=4)。Aβ1-42は、これら動物において点滅及び対照群の両方について検出可能レベル未満であった。全体として、40Hzの刺激が誘導する視覚野におけるミクログリアの形質転換は、海馬CA1において生じたそれと同様に見えた。さらに、シナプトフィジンレベルは暗条件と40Hzの点滅条件間で変化せず、ミクログリアの活性化がシナプスの貪食を有意に増加させないことを示した(例えば、図53A及び53B参照。「n.s.」は有意でないことを示す。1群当たり4匹のマウスから切片n=2)。総合すれば、本明細書に開示のデータは、感覚刺激を介して非侵襲的に誘導された40Hzの振動が、ADマウスモデルにおいて効果的にAβの存在量を低減し、ミクログリア/Aβ相互作用を促進し得ることを示している。さらに、40Hzの刺激は、2つの異なる脳回路においてAβを低減する可能性があり、このことが、ガンマ振動が様々な脳領域でアミロイドの存在量を低減し、ミクログリアの食作用を高める一般的機構を示唆している。 Microglia-specific levels of Aβ were significantly higher in 5XFAD animals compared to WT controls, with levels of 27.2 pg/104 microglia in 5XFAD mice and 9.78 pg/104 microglia in WT control mice. (See, eg, Figures 52A and 52B. p<0.05 by Student's t-test. n=8 for 5XFAD and n=4 for WT mice). Aβ 1-42 was below detectable levels for both blink and control groups in these animals. Overall, 40 Hz stimulation-induced microglial transformation in visual cortex appeared similar to that occurring in hippocampus CA1. Furthermore, synaptophysin levels did not change between dark and 40 Hz flickering conditions, indicating that microglial activation does not significantly increase synaptic phagocytosis (see, e.g., Figures 53A and 53B, n.s.). indicates not significant, n=2 sections from 4 mice per group). Taken together, the data disclosed herein demonstrate that 40 Hz oscillations induced non-invasively via sensory stimulation effectively reduced Aβ abundance in a mouse model of AD, leading to microglia/Aβ interactions. It shows that it can promote Furthermore, 40 Hz stimulation may reduce Aβ in two different brain circuits, suggesting that gamma oscillations reduce amyloid abundance in various brain regions and enhance microglial phagocytosis. suggesting a mechanism.
さらなる実験において、暗(光なし)、20Hzの閃光、40Hzの閃光、または80Hzの閃光への曝露1時間後、Aβ1-42レベルを評価した。ここで、20Hzと80Hzは40Hzの高調波である。しかしながら、40Hzの閃光の点滅のみがAβ1-42のレベルを有意に低減した。図54Aは、いくつかの実施形態に従うガンマ振動での対象の視覚野の刺激後のAβペプチドアイソフォームAβ1-42の減少を示す棒グラフである。 In further experiments, Aβ 1-42 levels were assessed after 1 hour exposure to dark (no light), 20 Hz flashes, 40 Hz flashes, or 80 Hz flashes. Here, 20 Hz and 80 Hz are harmonics of 40 Hz. However, only flashing flashes of 40 Hz significantly reduced the levels of Aβ 1-42 . FIG. 54A is a bar graph showing reduction of Aβ peptide isoform Aβ 1-42 following stimulation of a subject's visual cortex with gamma oscillations, according to some embodiments.
別の試験を実施し、Aβ1-42のレベルの低下のタイミングを評価した。1時間、マウスを光なしまたは40Hzの閃光のいずれかに曝露した。Aβ1-42のレベルを1時間の処理後、及び再度処理終了後24時間で測定した。図54Bは、いくつかの実施形態に従うガンマ振動での対象の視覚野の刺激後、及びさらに刺激後24時間のAβペプチドアイソフォームAβ1-42のレベルを示す棒グラフである。Aβレベルは処理後24時間で依然として低下していたが、この低下は処理直後より小さかった。 Another study was performed to assess the timing of the reduction in levels of Aβ 1-42 . Mice were exposed to either no light or a 40 Hz flash of light for 1 hour. Levels of Aβ 1-42 were measured after 1 hour of treatment and again 24 hours after the end of treatment. FIG. 54B is a bar graph showing levels of Aβ peptide isoform Aβ 1-42 after stimulation of a subject's visual cortex with gamma oscillations, and also 24 hours after stimulation, according to some embodiments. Aβ levels were still decreased 24 hours after treatment, but this decrease was smaller than immediately after treatment.
ガンマ周波数での視覚刺激は、海馬におけるAβのレベルに影響を与えなかった。
光の点滅による視覚刺激がADに関与する脳回路に影響を与えるかどうかを判定するため、いくつかの実施形態では、海馬、すなわち、ヒトにおいてADの経過の初期に影響を受ける脳領域の1つに対する光の点滅の影響を調べた。図55Aは、いくつかの実施形態に従って、40Hzの光の点滅5502の前及び最中での海馬における局所電場電位の電気トレースならびにパワースペクトル密度のプロットを含む。CA1における暗5504、40Hzの光の点滅5506、及びランダムな光の点滅5508の間のパワースペクトル密度の平均(実線)及び標準偏差(網掛け領域)(5XFADマウスn=2及びWTマウス3)。
Visual stimulation at gamma frequencies did not affect levels of Aβ in the hippocampus.
To determine whether visual stimulation by flashing lights affects brain circuits involved in AD, in some embodiments, hippocampus, one of the brain regions affected early in the course of AD in humans We investigated the effect of flashing lights on FIG. 55A includes electrical traces and power spectral density plots of local field potentials in the hippocampus before and during 40 Hz light blinks 5502, according to some embodiments. Mean (solid line) and standard deviation (shaded area) of power spectral densities during dark 5504, 40 Hz light blinks 5506, and
図55Bは、いくつかの実施形態に従って、それぞれ、4サイクルの40Hzの光の点滅に関する時間の関数5510及びランダムな光の点滅に関する同等の期間の関数5512としての海馬におけるスパイクの割合の一連のヒストグラムである(5XFADマウスn=2及びWTマウス3、バーは平均を示し、エラーバーは動物間のSEMを示す)。上側のバーは、光がオン(白)またはオフ(黒)の場合を示す。ランダム刺激については、スパイキングは、光のオンの開始と合わせ、さらなる光の周期は、グレーが示すランダムな間隔で行った。視覚野において本明細書に開示したCA1における光の点滅の効果を調べる方法と同じ方法を用いて、40Hzでの光の点滅が40Hzで記録されたLFPにおけるパワーを増加させる(例えば、図55A及び図55Bのグラフ5510参照)が、ランダムな間隔の光の点滅(ランダムな点滅)及び暗は増加させない(例えば、図50D、図43Cのグラフ4310参照)ことが見出された。スパイキングは、40Hzの刺激の間の40Hzの点滅周波数によっても変調されるが、しかしながら、この変調は、視覚野におけるよりも小さく見えた(例えば、図55B、海馬、図44A、視覚野参照)。
FIG. 55B shows a series of histograms of percent spikes in the hippocampus as a function of
図56Aは、いくつかの実施形態に従って、40Hzの光の点滅及びランダムな光の点滅の間の発火率の差を示すヒストグラムである(2匹の5XFAD及び3匹のWTマウスにおいて5つの記録期からの刺激周期最低n=168)。図56Bは、いくつかの実施形態に従って、40Hzの光の点滅5604、ランダムな点滅5605、暗5602、または明5608周期の間のCA1におけるマルチユニット発火率を示すプロットである。箱ひげ図は、中央値(箱内の白線)及び四分位数(箱の上下)を示す。すべての動物において、40Hzの点滅及びランダムな点滅条件の間の発火率に有意な差はなく、このランダム刺激条件がスパイキング活動の対照としての役割を果たすことを示した(2匹の5XFAD及び3匹のWT動物からの5つの記録期の各々に対する順位和検定、p>0.2、中央値と四分位数を図に示す。記録当たりの40Hzの点滅周期n=22、54、42、71、55及びランダムな点滅周期12、34、32、54、36)。40Hzの点滅及び明条件間で発火率に有意な差はなく、40Hzの光の点滅は、概してニューロンの過剰興奮性を引き起こさなかったことを示した(2匹の5XFAD及び3匹のWT動物からの5つの記録期の各々に対する順位和検定、p>0.3。中央値と四分位数を図に示す。記録当たりの40Hz周期n=22、54、42、71、55及び明周期12、34、32、54、35)。
FIG. 56A is a histogram showing the difference in firing rate between 40 Hz light blinking and random light blinking (5 recording periods in 2 5XFAD and 3 WT mice), according to some embodiments. (minimum n=168). FIG. 56B is a plot showing multi-unit firing rates in CA1 during 40 Hz light blinking 5604, random blinking 5605, dark 5602, or light 5608 cycles, according to some embodiments. Boxplots show medians (white lines within boxes) and quartiles (above and below boxes). There was no significant difference in firing rates between 40 Hz blinking and random blinking conditions in all animals, indicating that this random stimulus condition served as a control for spiking activity (5XFAD in two animals and Rank sum test, p>0.2, median and quartiles for each of the 5 recording phases from 3 WT animals, 40 Hz blink rate per recording n=22, 54, 42 , 71, 55 and
視覚野におけるように、40Hzとランダムな点滅周期の間のマルチユニット発火率の差はゼロに近い傾向があった(例えば、図56A参照)。また、これらの周期を動物内で比較すると、有意な差は見られなかった(例えば、図56B参照。4匹の5XFADマウスからの5つの記録期の各々に関する順位和検定、p>0.06、中央値と四分位数を図に示す。記録当たりの40Hzの点滅周期n=22、54、42、71、55及びランダムな点滅周期12、34、32、54、36)。
As in the visual cortex, the difference in multiunit firing rates between 40 Hz and random blinking periods tended to be close to zero (see, eg, FIG. 56A). Also, when these cycles were compared within animals, no significant differences were found (see, e.g., FIG. 56B. Rank sum test for each of the 5 recording phases from 4 5XFAD mice, p>0.06 , median and quartiles are shown in the figure, 40 Hz blink periods per recording n = 22, 54, 42, 71, 55 and
いくつかの実施形態では、視覚野において用いた方法と同じ方法を用いて、海馬におけるAβのレベルに対する視覚の光の点滅の影響を調べた。いくつかの実施形態に従って、図57Aは、5XFADの視覚野における相対的なAβ1-40のレベルを示す棒グラフであり、図57Bは、5XFADの視覚野における相対的なAβ1-42のレベルを示す棒グラフである(1群当たりのマウスn=4。「n.s.」は有意でないことを示す)。視覚野において観察されたこととは対照的に、CA1では、40Hzの点滅またはランダムな刺激の1時間後のAβ1-40及びAβ1-42のレベルに有意な差は見られなかった。40Hzの点滅またはランダムな点滅後のAβレベルは暗条件と有意差がなかった。Aβ1-40のレベルは、40Hz及びランダムな点滅後、暗条件のそれぞれ、108.4%及び96.82%であり、Aβ1-42のレベルは、40Hz及びランダムな点滅後、暗条件のそれぞれ、118.8%及び92.15%であった(例えば、図57A及び57B参照。「n.s.」は有意でないことを示す。1群当たりのマウスn=4)。従って、40Hzの光の点滅1時間では、海馬におけるAβのレベルを有意に低減しなかった。 In some embodiments, the same method used in the visual cortex was used to examine the effects of visual light blinking on levels of Aβ in the hippocampus. FIG. 57A is a bar graph showing relative Aβ 1-40 levels in 5XFAD visual cortex, and FIG. 57B shows relative Aβ 1-42 levels in 5XFAD visual cortex, according to some embodiments. Bar graph showing (n=4 mice per group; "n.s." indicates not significant). In contrast to what was observed in the visual cortex, CA1 showed no significant differences in levels of Aβ 1-40 and Aβ 1-42 one hour after 40 Hz flickering or random stimulation. Aβ levels after 40 Hz blinking or random blinking were not significantly different from the dark condition. Levels of Aβ 1-40 were 108.4% and 96.82% of dark conditions after 40 Hz and random blinks, respectively, and levels of Aβ 1-42 were 108.4% and 96.82% of dark conditions after 40 Hz and random blinks. 118.8% and 92.15%, respectively (see, eg, Figures 57A and 57B; "n.s." indicates not significant; n = 4 mice per group). Thus, one hour of 40 Hz light flashing did not significantly reduce the levels of Aβ in the hippocampus.
ガンマ周波数での長期的視覚刺激は、視覚野における斑負荷を減少させた。
40Hzの振動が光遺伝学的に、または光の点滅を介した視覚刺激によってのいずれかで駆動された場合に、前斑5XFADマウスにおいて影響を受けたアミロイド存在量を調べ、本明細書に開示してきた。次に、目的は、この処理がすでに斑負荷を示している動物に有効であるかどうかを判定することとなった。この目的で、いくつかの実施形態では、6か月齢の5XFADマウスを用いたが、これは、それらが視覚野を含む多くの脳領域において広範囲のアミロイド斑病変を発症するためである。非侵襲的ガンマ刺激後、進行したAβ関連の病変に何が起こるかを調べるための試験を実施した。40Hzの点滅1時間に反応したAβ減少の期間を調べるため、いくつかの実施形態では、Aβレベルを視覚野において、40Hzの点滅または暗条件1時間の4、12、及び24時間後に測定した。
Chronic visual stimulation at gamma frequencies decreased plaque load in the visual cortex.
Amyloid abundance was affected in anterior macular 5XFAD mice when 40 Hz oscillations were driven either optogenetically or by visual stimulation via flashing lights, disclosed herein. I've been The objective was then to determine whether this treatment would be effective in animals already exhibiting plaque burden. To this end, in some embodiments, 6-month-old 5XFAD mice were used, as they develop extensive amyloid plaque lesions in many brain regions, including the visual cortex. A study was conducted to see what happens to advanced Aβ-related lesions after non-invasive gamma stimulation. To examine the duration of Aβ reduction in response to 1 hour of 40 Hz blinking, in some embodiments, Aβ levels were measured in the visual cortex at 4, 12, and 24 hours after 40 Hz blinking or 1 hour of darkness.
図58A及び58Bは、いくつかの実施形態に従って、1時間の暗または40Hzの点滅処理後1、4、12、及び24時間での5XFADの視覚野における、それぞれ相対的なAβ1-40及びAβ1-42のレベルを示す棒グラフである(4及び12時間の待機については1群当たりのマウスn=4、1及び24時間の待機についてはn=6、暗処理についてはn=12。一元配置分散分析により「n.s.」は有意でないことを示し、1つのアスタリスクはp<0.05を示し、2つのアスタリスクはp<0.01を示す)。この結果は、4時間後、暗対照と比較して、Aβ1-40のレベルは63.4%低下し、Aβ1-42のレベルは63.2%低下したことを示した(例えば、図58参照。p<0.01。1群当たりのマウスn=4)。12時間までに、Aβ1-40のレベルは、50.9%減少した一方、Aβ1-42のレベルは、暗対照と有意差はなかった(例えば、図58参照。「n.s.」は有意でないことを示し、p<0.01。1群当たりのマウスn=4)。最後に、1時間の40Hzの点滅処理後24時間で、可溶性Aβ1-40及びAβ1-42のレベルは、暗対照条件と比較して、40Hzの点滅で有意差はなかった(例えば、図58参照。「n.s.」は有意でないことを示す。24時間について1群当たりのマウスn=6及び暗条件について1群当たりのマウスn=4)。これらの結果は、40Hzの点滅処理の効果が一時的であることを示している。 58A and 58B show relative Aβ 1-40 and Aβ, respectively, in 5XFAD visual cortex at 1, 4, 12, and 24 hours after 1 hour dark or 40 Hz blinking treatment, according to some embodiments. Bar graph showing levels of 1-42 (n=4 mice per group for 4 and 12 hour waits, n=6 for 1 and 24 hour waits, n=12 for dark treatment. 'n.s.' indicates not significant by ANOVA, one asterisk indicates p<0.05, two asterisks indicates p<0.01). The results showed that after 4 hours the levels of Aβ 1-40 were reduced by 63.4% and the levels of Aβ 1-42 were reduced by 63.2% compared to the dark control (eg, Figure 2). See 58. p<0.01, n=4 mice per group). By 12 hours, Aβ 1-40 levels had decreased by 50.9%, while Aβ 1-42 levels were not significantly different from dark controls (see, eg, Figure 58. n.s.). indicates not significant, p<0.01; n=4 mice per group). Finally, 24 hours after 1 hour of 40 Hz blink treatment, levels of soluble Aβ 1-40 and Aβ 1-42 were not significantly different in 40 Hz blinks compared to the dark control condition (e.g., Fig. 3). See 58. "n.s." indicates not significant, n=6 mice per group for 24 hours and n=4 mice per group for dark conditions). These results indicate that the effect of the 40 Hz blinking process is temporary.
従って、進行した斑病変を破壊するため、いくつかの実施形態では、マウスを毎日1時間で7日間、40Hzの点滅、または対照については暗条件で処理した。図59Aは、いくつかの実施形態に従って、1日当たり1時間の点滅に7日間曝露された6か月齢のマウスを示す概略図である。図59Bは、いくつかの実施形態に従って、1時間/日の暗または40Hzの点滅条件下での7日後の6か月齢の5XFADマウスの視覚野における相対的なAβ1-42のレベルを示す棒グラフである(1群当たりのマウスn=13。2つのアスタリスクはp<0.01を示し、3つのアスタリスクはp<0.001を示す。スチューデントt検定)。図59Cは、いくつかの実施形態に従って、1時間/日の暗条件または40Hzの点滅条件下での7日後の6か月齢の5XFADマウスの視覚野における相対的なAβ1-40のレベルを示す棒グラフである(1群当たりのマウスn=13。スチューデントt検定により、1つのアスタリスクはp<0.01を示し、2つのアスタリスクはp<0.01を示す)。図59B及び59Cは、平均及びSEMを示す。棒グラフのバーに重ねられた円は、各群の個々のデータ点を示す。 Therefore, to destroy advanced plaque lesions, in some embodiments, mice were treated with 40 Hz blinking for 1 hour daily for 7 days, or dark conditions for controls. FIG. 59A is a schematic diagram showing a 6-month-old mouse exposed to blinking for 1 hour per day for 7 days, according to some embodiments. FIG. 59B is a bar graph showing relative levels of Aβ 1-42 in the visual cortex of 6-month-old 5XFAD mice after 7 days under 1 hr/day dark or 40 Hz blink conditions, according to some embodiments. (n=13 mice per group. Double asterisks indicate p<0.01, three asterisks indicate p<0.001. Student's t-test). FIG. 59C shows relative levels of Aβ 1-40 in the visual cortex of 6-month-old 5XFAD mice after 7 days under 1 hr/day dark or 40 Hz blink conditions, according to some embodiments. Bar graph (n=13 mice per group. One asterisk indicates p<0.01, two asterisks indicate p<0.01 by Student's t-test). Figures 59B and 59C show the mean and SEM. Circles superimposed on bar graph bars indicate individual data points in each group.
7日の期間の終わりに、この視覚野をELISA及び免疫染色で分析した。いくつかの実施形態では、この組織をリン酸緩衝生理食塩水(PBS)中で溶解してPBS可溶性Aβ画分を抽出したところ、6か月齢の5XFADマウスにおいて、ELISAで測定して、1時間の40Hzの点滅7日間で、可溶性Aβ1-40及びAβ1-42のレベルは、それぞれ、60.5%及び51.7%減少したことが分かった(例えば、図59B及び59C参照。スチューデントt検定によりp<0.05及びp<0.01。1群当たりのマウスn=13)。組織をさらにグアニジン塩酸(HCl)で処理して、凝集したアミロイド斑を構成する不溶性のAβ1-40及びAβ1-42画分を抽出した。不溶性のAβ1-40及びAβ1-42のレベルは、それぞれ、43.7%及び57.9%減少し、40Hzの点滅が、6か月齢のマウスにおいてすでに形成された不溶性のAβ凝集物を破壊したことを示した(例えば、図59B及び59C参照。スチューデントt検定によりp<0.01及びp<0.001。1群当たりのマウスn=13)。 At the end of the 7-day period, the visual cortex was analyzed by ELISA and immunostaining. In some embodiments, the tissue was lysed in phosphate-buffered saline (PBS) to extract the PBS-soluble Aβ fraction, measured by ELISA in 6-month-old 5XFAD mice, 1 hour It was found that soluble Aβ 1-40 and Aβ 1-42 levels decreased by 60.5% and 51.7%, respectively (see, eg, Figures 59B and 59C. Student t p<0.05 and p<0.01 by test; n=13 mice per group). Tissues were further treated with guanidinium hydrochloride (HCl) to extract the insoluble Aβ 1-40 and Aβ 1-42 fractions that make up aggregated amyloid plaques. Levels of insoluble Aβ 1-40 and Aβ 1-42 were reduced by 43.7% and 57.9%, respectively, and 40 Hz blinking reduced already formed insoluble Aβ aggregates in 6-month-old mice. (See, eg, Figures 59B and 59C. p<0.01 and p<0.001 by Student's t-test. n=13 mice per group).
斑負荷がどのようにして特異的に影響を受けたかを判定するため、いくつかの実施形態では、免疫組織化学的な特徴づけを、Aβ抗体を用いて実施した(Cell Signaling Technology、D54D2)。図60Aは、いくつかの実施形態に従って、1時間/日の暗(上)または40Hzの点滅(下)条件下での7日後の6か月齢の5XFADマウスの視覚野における抗Aβ(D5452)抗体による免疫組織化学を示す一連の免疫蛍光画像である(スケールバー=50μm)。細胞内に見られるAβシグナルは除外した。図60Bは、いくつかの実施形態に従って、1時間/日の暗または40Hzの点滅条件下での7日後の6か月齢の5XFADマウスの視覚野におけるAβ陽性斑の沈着数を示す棒グラフである(1群当たりのマウスn=8。スチューデントt検定により、3つのアスタリスクはp<0.001を示す)。図60Cは、いくつかの実施形態に従って、1時間/日の暗または40Hzの点滅条件下での7日後の6か月齢の5XFADマウスの視覚野におけるAβ陽性斑の面積を示す棒グラフである(1群当たりのマウスn=8。マン・ホイットニー検定により、2つのアスタリスクはp<0.01を示す)。図60B及び60Cは、平均及びSEMを示す。 To determine how plaque load was specifically affected, in some embodiments immunohistochemical characterization was performed using Aβ antibodies (Cell Signaling Technology, D54D2). FIG. 60A shows anti-Aβ (D5452) antibodies in the visual cortex of 6-month-old 5XFAD mice after 7 days under 1 hr/day dark (top) or 40 Hz blinking (bottom) conditions, according to some embodiments. (Scale bar = 50 μm). Aβ signals found intracellularly were excluded. FIG. 60B is a bar graph showing the number of Aβ-positive plaque deposition in the visual cortex of 6-month-old 5XFAD mice after 7 days under 1 hr/day dark or 40 Hz blinking conditions, according to some embodiments. n=8 mice per group, three asterisks indicate p<0.001 by Student's t-test). FIG. 60C is a bar graph showing the area of Aβ-positive plaques in the visual cortex of 6-month-old 5XFAD mice after 7 days under 1 h/day dark or 40 Hz blink conditions (1 n=8 mice per group, double asterisks indicate p<0.01 by Mann-Whitney test). Figures 60B and 60C show the mean and SEM.
斑の存在量は、直径が10μm以上のAβ+沈着物数を数えることによって定量化した。40Hzの点滅は、斑の数を暗対照における33.5と比較して、11.0に低減した(例えば、図60A及び60B参照。スチューデントt検定によりp<0.01。1群当たりのマウスn=8)。さらに、1週間の40Hzの点滅処理後、斑のサイズ(緻密な斑領域の面積として測定)は、暗対照と比較して、約63.7%減少した(例えば、図60A及び60C参照。マン・ホイットニー検定によりp<0.01。1群当たりのマウスn=8)。総合すれば、これらの実験は、アミロイド斑の病変に強い影響を与える完全に非侵襲的な治療を特定した。 Plaque abundance was quantified by counting the number of Aβ+ deposits ≧10 μm in diameter. 40 Hz blinking reduced the number of plaques to 11.0 compared to 33.5 in dark controls (see, eg, Figures 60A and 60B. p<0.01 by Student's t-test. Mice per group). n=8). Furthermore, after 1 week of 40 Hz blinking treatment, plaque size (measured as the area of the dense plaque area) decreased by approximately 63.7% compared to the dark control (see, e.g., Figures 60A and 60C. • p<0.01 by Whitney test; n=8 mice per group). Taken together, these experiments identified a completely non-invasive treatment that impacts amyloid plaque lesions.
40Hzの点滅が別の重要なAD関連病変を改善するかどうかを判定するため、タウリン酸化を、TauP301Sタウオパチーマウスモデルを用いて調べた。細胞体に局在するリン酸化タウをこの月齢で示す4か月齢のTauP301S Tgマウスを40Hzの点滅または暗対照条件のいずれかで毎日1時間、7日間処理した。40Hzの点滅がタウリン酸化をどのように変化させたかを調べるため、視覚野の免疫組織化学的特徴づけを、pTauの3つの異なるエピトープ(S202、S396、及びS400/T403/S404;11834S、9632S、11837S)に対するpTau抗体及び樹状マーカーMAP2を対照として用いて行った。 To determine whether 40 Hz blinking ameliorates another important AD-related pathology, tau phosphorylation was examined using the TauP301S tauopathy mouse model. Four-month-old TauP301S Tg mice, which exhibit cell body-localized phosphorylated tau at this age, were treated with either 40 Hz blinking or dark control conditions for 1 h daily for 7 days. To investigate how 40 Hz blinking altered tau phosphorylation, immunohistochemical characterization of visual cortex was performed on three different epitopes of pTau (S202, S396, and S400/T403/S404; 11834S, 9632S, 11837S) and the dendritic marker MAP2 were used as controls.
図61Aは、いくつかの実施形態に従って、1時間/日の暗または40Hzの点滅条件下での7日後の4か月齢のP301Sマウスにおける抗pTau6102(S202)及び抗MAP2 6104抗体による免疫組織化学を示す一連の免疫蛍光画像である。画像は、40倍の対物レンズで撮影した(スケールバー=50μm。差し込み図は、暗及び40Hzの点滅条件下での代表的な細胞体の100倍のレンダリングを含む)。図61Bは、いくつかの実施形態に従って、1時間/日の暗及び40Hzの点滅条件下での7日後のP301Sの視覚野の相対的なpTau(S202)の強度レベルを示す棒グラフである(1群当たりのマウスn=8。スチューデントt検定により、1つのアスタリスクはp<0.05を示す)。図61Cは、いくつかの実施形態に従って、1時間/日の暗及び40Hzの点滅条件下での7日後のP301Sの視覚野の相対的なMAP2強度レベルを示す棒グラフである(1群当たりのマウスn=8。スチューデントt検定により、「n.s.」は有意でないことを示す)。図61B及び61Cは、平均及びSEMを示す。 FIG. 61A shows immunohistochemistry with anti-pTau6102 (S202) and anti-MAP2 6104 antibodies in 4 month old P301S mice after 7 days under 1 hr/day dark or 40 Hz blink conditions, according to some embodiments. 1 is a series of immunofluorescence images shown. Images were taken with a 40x objective (scale bar = 50 μm; inset contains 100x rendering of a representative cell body under dark and 40 Hz blinking conditions). FIG. 61B is a bar graph showing relative pTau (S202) intensity levels in the visual cortex of P301S after 7 days under 1 h/day dark and 40 Hz flicker conditions (1 n=8 mice per group, one asterisk indicates p<0.05 by Student's t-test). FIG. 61C is a bar graph showing relative MAP2 intensity levels in the visual cortex of P301S after 7 days under 1 hr/day dark and 40 Hz blink conditions (mice per group), according to some embodiments. n=8. Student's t-test indicates "n.s." is not significant). Figures 61B and 61C show the mean and SEM.
図62Aは、いくつかの実施形態に従って、1時間/日の暗及び40Hzの点滅条件下での7日後の4か月齢のP301Sマウスにおける抗pTau6202(S404)抗体による免疫組織化学を示す一連の免疫蛍光画像である(スケールバー=50μm)。図62Bは、いくつかの実施形態に従って、1時間/日の暗及び40Hzの点滅条件下での7日後のP301Sの視覚野の相対的な抗pTau(S400/T403/S404)の蛍光強度レベルを示す棒グラフである(1群当たりのマウスn=8。スチューデントt検定により、2つのアスタリスクはp<0.01を示す)。図62Bは平均及びSEMを示す。 FIG. 62A is an immunization series showing immunohistochemistry with anti-pTau6202 (S404) antibody in 4 month old P301S mice after 7 days under 1 hr/day dark and 40 Hz blink conditions, according to some embodiments. Fluorescence image (scale bar = 50 μm). FIG. 62B shows relative anti-pTau (S400/T403/S404) fluorescence intensity levels in P301S visual cortex after 7 days under 1 hr/day dark and 40 Hz blink conditions, according to some embodiments. Bar graph showing (n=8 mice per group; double asterisks indicate p<0.01 by Student's t-test). Figure 62B shows the mean and SEM.
図63Aは、いくつかの実施形態に従って、1時間/日の暗及び40Hzの点滅条件下での7日後の4か月齢のP301Sマウスにおける抗pTau6302(S396)抗体による免疫組織化学を示す一連の免疫蛍光画像である(スケールバー=50μm)。図63Bは、いくつかの実施形態に従って、1時間/日の暗及び40Hzの点滅条件下での7日後のP301Sの視覚野の相対的なpTau(S396)の蛍光強度レベルを示す棒グラフである(1群当たりのマウスn=8。スチューデントt検定により、4つのアスタリスクはp<0.0001を示す)。 FIG. 63A is an immunization series showing immunohistochemistry with anti-pTau6302 (S396) antibody in 4 month old P301S mice after 7 days under 1 hr/day dark and 40 Hz blink conditions, according to some embodiments. Fluorescence image (scale bar = 50 μm). FIG. 63B is a bar graph showing relative pTau(S396) fluorescence intensity levels in P301S visual cortex after 7 days under 1 hr/day dark and 40 Hz blink conditions, according to some embodiments. n=8 mice per group, four asterisks indicate p<0.0001 by Student's t-test).
その結果、40Hzの点滅条件では、暗対照と比較して、pTau(S202)のシグナル強度は、41.2%及びpTau(S400/T403/S404)は42.3%減少した(例えば、図61A~B、62A~B参照。スチューデントt検定により、p<0.01。1群当たり8匹のマウスから切片n=2)一方、MAP2レベルは変化しなかった(例えば、図61A及び61C参照。「n.s.」は有意でないことを示す。1群当たり4匹のマウスから切片n=2)。pTau(S396)に対する抗体での染色は、同じ方向に向くことを示した。すなわち、40Hzの点滅が、pTau(S396)レベルを暗対照と比較して14.4%低減した(例えば、図63A~B参照。「n.s.」は有意でないことを示す。1群当たり8匹のマウスから切片n=2)。さらに、暗対照と比較して、40Hzの点滅に反応したpTauシグナルの点状の細胞体局在化は少なかった。タウリン酸化において有意な変化は見られたが、40Hzの点滅処理及び暗対照群の間で、不溶性タウのレベルに識別できる差は認められなかった。 As a result, the signal intensity of pTau(S202) and pTau(S400/T403/S404) decreased by 41.2% and 42.3%, respectively, in the 40 Hz flickering condition compared to the dark control (e.g., FIG. 61A B, see 62A-B p<0.01 by Student's t-test, n=2 slices from 8 mice per group), whereas MAP2 levels were unchanged (see, eg, FIGS. 61A and 61C). "n.s." indicates not significant, n=2 sections from 4 mice per group). Staining with an antibody against pTau(S396) showed the same orientation. That is, 40 Hz blinking reduced pTau(S396) levels by 14.4% compared to dark controls (see, eg, Figures 63A-B. "n.s." indicates non-significant. per group). Sections from 8 mice n=2). Furthermore, there was less punctate somatic localization of the pTau signal in response to 40 Hz blinking compared to dark controls. Although there was a significant change in tau phosphorylation, there was no discernible difference in the levels of insoluble tau between the 40 Hz blink treatment and dark control groups.
TauP301Sマウスモデルのミクログリアに対する40Hzの点滅の結果を評価した。図64は、いくつかの実施形態に従って、1時間/日の暗及び40Hzの点滅条件下での7日後の4か月齢のP301Sマウスにおける抗Iba1(019-19741)抗体による免疫組織化学を示す一連の免疫蛍光画像である。画像は、40倍の対物レンズで撮影した(スケールバー=50μm。差し込み図は、EYFP及び40Hzの刺激条件での代表的なミクログリアの100倍のレンダリングを含む)。 The results of 40 Hz blinking on microglia in the TauP301S mouse model were evaluated. FIG. 64 is a series showing immunohistochemistry with anti-Iba1 (019-19741) antibody in 4 month old P301S mice after 7 days under 1 hr/day dark and 40 Hz blink conditions, according to some embodiments. is an immunofluorescence image of Images were taken with a 40x objective (scale bar = 50 μm; inset contains 100x rendering of representative microglia under EYFP and 40 Hz stimulation conditions).
図65Aは、いくつかの実施形態に従って、1時間/日の暗及び40Hzの点滅条件下での7日後のミクログリアの数を示す棒グラフである(1群当たりのマウスn=8。スチューデントt検定により、「n.s.」は有意でないことを示す)。図65Bは、いくつかの実施形態に従って、1時間/日の暗及び40Hzの点滅条件下での7日後の対照に対して正規化されたミクログリア細胞体の直径を示す棒グラフである(1群当たりのマウスn=8。スチューデントt検定により、4つのアスタリスクはp<0.0001を示す)。図65Cは、いくつかの実施形態に従って、1時間/日の暗及び40Hzの点滅条件下での7日後の対照に対して正規化されたミクログリアの一次過程の平均長さを示す棒グラフである(1群当たりのマウスn=8。スチューデントt検定により、4つのアスタリスクはp<0.0001を示す)。 FIG. 65A is a bar graph showing the number of microglia after 7 days under 1 hr/day dark and 40 Hz blink conditions (n=8 mice per group. By Student's t-test), according to some embodiments. , “n.s.” indicates not significant). FIG. 65B is a bar graph showing microglial cell body diameter normalized to control after 7 days under 1 hr/day dark and 40 Hz blink conditions (per group), according to some embodiments. mice (n=8. Four asterisks indicate p<0.0001 by Student's t-test). FIG. 65C is a bar graph showing the average length of primary microglial processes normalized to control after 7 days under 1 hr/day dark and 40 Hz blink conditions, according to some embodiments ( n=8 mice per group, four asterisks indicate p<0.0001 by Student's t-test).
いくつかの実施形態では、TauP301Sマウスの視覚野切片において抗Iba1抗体でミクログリアを1日1時間の40Hzの点滅または暗条件7日後に標識した(例えば、図64参照)。いくつかの実施形態では、暗対照と比較して、40Hzの点滅条件では、5XFADモデルで観察されたものと一致して(例えば、図50A参照)、ミクログリア数に29.50%増加する傾向が認められた(例えば、図64及び65A参照。「n.s.」は有意でないことを示す。1群当たりのマウスn=3)。さらに、ミクログリア細胞体の直径は、視覚野において40Hzの点滅後、暗対照と比較して、49.00%増加した(例えば、図64及び65B参照。スチューデントt検定により、p<0.0001。1群当たりのマウスn=3)。ミクログリアの一次過程の長さは、40Hzの点滅群で暗対照と比較して、39.08%低下した(例えば、図64及び65C参照。スチューデントt検定によりp<0.0001。1群当たりのマウスn=3)。 In some embodiments, microglia were labeled with anti-Iba1 antibody in visual cortex sections of TauP301S mice after 1 hour of 40 Hz blinking per day or 7 days in the dark (see, eg, FIG. 64). In some embodiments, compared to dark controls, the 40 Hz blinking condition tended to increase microglial numbers by 29.50%, consistent with what was observed in the 5XFAD model (see, e.g., Figure 50A). (See, eg, Figures 64 and 65A. "n.s." indicates not significant. n = 3 mice per group). Furthermore, the diameter of microglial cell bodies increased by 49.00% after 40 Hz blinking in the visual cortex compared to dark controls (see, eg, Figures 64 and 65B. p<0.0001 by Student's t-test). n=3 mice per group). The length of primary microglial processes was reduced by 39.08% in the 40 Hz blink group compared to the dark control (see, eg, Figures 64 and 65C. p<0.0001 by Student's t-test. mouse n=3).
総合すれば、AD病変の複数のモデルからの及びWT動物におけるこれらのデータは、40Hzの振動が、Aβレベルの低下によって測定される通り、アミロイド病変を軽減し得るとともにタウリン酸化を低下させ得ることを示している。さらに、40Hzの視覚点滅は、AD病変のアミロイドーシス及びタウオパチーモデルのいずれにおいてもミクログリアの明瞭な形態変換を駆動し得る。 Taken together, these data from multiple models of AD lesions and in WT animals demonstrate that 40 Hz oscillation can attenuate amyloid lesions and reduce tau phosphorylation, as measured by reduced Aβ levels. is shown. Moreover, 40 Hz visual blinking can drive distinct morphological transformations of microglia in both amyloidosis and tauopathy models of AD lesions.
別の実験において、老齢マウス(すなわち、6か月齢)のサブセットを視覚ガンマ刺激に7日間曝露した。残りのマウスは暗所に置いた。図66は、マウスの視覚野における可溶性Aβペプチド及び不溶性Aβペプチド(すなわち、斑)の両方のレベルを示すプロットである。図66に示すように、可溶性アイソフォームAβ1-40 6600、可溶性アイソフォームAβ1-42 6602、不溶性アイソフォームAβ1-40 6604、及び不溶性アイソフォームAβ1-42 6606の各々のレベルは、視覚ガンマ刺激に曝露したマウスにおいて有意に減少した。 In another experiment, a subset of aged mice (ie, 6 months old) were exposed to visual gamma stimulation for 7 days. The remaining mice were kept in the dark. Figure 66 is a plot showing levels of both soluble and insoluble Aβ peptide (ie, plaques) in the visual cortex of mice. As shown in Figure 66, the levels of each of the soluble isoform Aβ 1-40 6600, soluble isoform Aβ 1-42 6602, insoluble isoform Aβ 1-40 6604, and insoluble isoform Aβ 1-42 6606 were visually significantly decreased in mice exposed to gamma stimulation.
図67A~67Bは、いくつかの実施形態に従って、対象の経頭蓋ガンマ刺激の有無でのAβペプチドのレベルを示すプロットである。図67Aでは、全脳Aβペプチドレベルは、無刺激6700で現状維持であったが、1時間の経頭蓋ガンマ刺激6702後に低下した(1群当たりの動物n=1)。図67Bでは、いくつかの実施形態に従って、全脳Aβペプチドレベルは、40Hzの経頭蓋刺激後、5xFADマウスの海馬6704及び皮質6706で減少した。 Figures 67A-67B are plots showing levels of Aβ peptide in subjects with and without transcranial gamma stimulation, according to some embodiments. In FIG. 67A, total brain Aβ peptide levels remained unchanged at no stimulation 6700 but declined after 1 hour of transcranial gamma stimulation 6702 (n=1 animal per group). In FIG. 67B, according to some embodiments, total brain Aβ peptide levels decreased in hippocampus 6704 and cortex 6706 of 5xFAD mice after 40 Hz transcranial stimulation.
ガンマ振動は、長い間、高次の認知機能及び感覚反応と関連していると考えられてきた。いくつかの実施形態では、光遺伝学的方法を用いたFS-PV介在ニューロンの駆動がマウスにおいて40HzでLFPを増強した。本明細書に開示のように、いくつかの実施形態では、5XFADマウスモデルにおいて、光遺伝学または非侵襲的な光の点滅処理を用いた40Hzの振動及び位相同期スパイキングの駆動により、少なくとも2つの異なる脳領域でAβペプチドの顕著な減少がもたらされたことが示されている。この減少は、Aβペプチドレベルが、40Hzの振動を高めることなく同様の量のマルチユニットスパイキング活動を生じたランダム刺激条件より、40Hzの刺激に反応して有意に低かったことから、スパイキング活動の低下によるものではなかった。錐体細胞の発火率は、これらの条件間で異なり得るが、FS-PV介在ニューロンまたは他の細胞型はこの変化を隠した。いくつかの実施形態では、FS-PV介在ニューロンの直接の刺激の同量を与えたFS-PV介在ニューロンのランダムな光遺伝学的刺激は、依然としてアミロイドを低減しなかった。それどころか、光遺伝学的確率的刺激は、アミロイドレベルを3倍超にした一方、確率的視覚点滅は有意な変化をもたらさず、このことは、ランダム刺激のいくつかの側面が神経毒性効果を有することを示す可能性がある。いくつかの実施形態では、ランダム刺激はガンマパワーの増加をもたらさなかった一方、パワーの微増の傾向が、約20Hz~60Hz超までの広範囲の周波数において認められた。いくつかの実施形態では、20Hz~80Hzの光の点滅でアミロイドレベルの増加傾向が認められた。総合すれば、これらの結果は、40Hz以下または以上の一部の周波数における駆動活性がアミロイドレベルを増加させる可能性があることを示唆し得る。これらの結果は、スパイキング活動のパターンがどのように分子経路及び疾患病変に影響を与えるかを理解する必要性を指摘している。 Gamma oscillations have long been thought to be associated with higher cognitive functions and sensory responses. In some embodiments, driving FS-PV interneurons using optogenetic methods enhanced LFP at 40 Hz in mice. As disclosed herein, in some embodiments, driving 40 Hz oscillations and phase-synchronous spiking using optogenetics or non-invasive light blinking in a 5XFAD mouse model results in at least 2 It has been shown that three different brain regions resulted in significant reductions in Aβ peptides. This decrease was due to spiking activity because Aβ peptide levels were significantly lower in response to 40 Hz stimulation than in the random stimulation condition, which produced similar amounts of multi-unit spiking activity without enhancing 40 Hz oscillations. was not due to a decrease in Firing rates of pyramidal cells may differ between these conditions, but FS-PV interneurons or other cell types masked this change. In some embodiments, random optogenetic stimulation of FS-PV interneurons given the same amount of direct stimulation of FS-PV interneurons still did not reduce amyloid. On the contrary, optogenetic stochastic stimulation more than tripled amyloid levels, whereas stochastic visual blinking produced no significant changes, suggesting that some aspects of random stimulation have neurotoxic effects. may indicate that In some embodiments, random stimulation did not result in an increase in gamma power, while a trend toward a slight increase in power was observed over a wide range of frequencies from about 20 Hz to over 60 Hz. In some embodiments, a trend towards increased amyloid levels was observed between 20 Hz and 80 Hz light flashing. Taken together, these results may suggest that driving activity at some frequencies below or above 40 Hz may increase amyloid levels. These results point to the need to understand how patterns of spiking activity affect molecular pathways and disease pathology.
総アミロイドレベルの強い低下は、EEA1/Rab5陽性初期エンドソームの減少に関連するアミロイド形成の減少及びミクログリアによるアミロイドのエンドサイトーシスの増加の両方によって媒介される可能性が高い。重要なことには、本明細書に開示の遺伝子セットエンリッチメント解析(GSEA)統計分析(The Broad Institute、マサチューセッツ州ケンブリッジ)で、古典的マクロファージの炎症性M1または抗炎症性M2の細胞状態は、40Hzの振動によるニューロンの刺激後の上方または下方制御された遺伝子発現プロファイルのいずれとも相関しないことが示された。実際、炎症性遺伝子Il6、Il1b、Itgam、及び抗炎症性遺伝子Igf1の発現レベルは、刺激後に変化しなかった。代わりに、複数のミクログリアのプロ食作用遺伝子及び細胞接着/遊走調節因子Spp1は、40Hzの刺激で活性化された。従って、40Hzのガンマ振動の駆動は、ニューロンとミクログリアの両方を動員することによって、総合的な神経防護反応を誘導するように見える。GABA-Aアンタゴニスト処理がAβレベルの低下に対する40Hzの刺激の効果を完全に無効にしたという事実は、十中八九FS-PV介在ニューロンに関連するGABA作動性シグナル伝達がこれらの効果に不可欠であることを強く示唆している。さらに、いくつかの実施形態では、5XFADマウスに加えてAPP/PS1及びWTマウスを含めた複数のマウスモデルにおいて、40Hzの点滅刺激はAβを低減した。複数のマウスモデルにおけるこの再現は、これらの知見が、1つの動物モデルに特異的でない可能性があり、重要なことには、WT動物におけるように、APPがその生理学的プロモーターによって発現され、Aβが内因性APPから生じる状況にまで及ぶ可能性があることを示している。さらに、いくつかの実施形態では、40Hzの振動がタウオパチーのマウスモデル、TauP301SにおいてpTauを低減することが分かり、ガンマ刺激の防護効果が、他のマウスモデルだけでなく、他の病原性タンパク質にも一般化することを示した。要約すれば、本明細書に開示の知見は、ガンマ振動が媒介するこれまで知られていなかった細胞及び分子過程を明らかにし、脳のガンマリズム、ミクログリア機能、ならびにAD関連病変間の機能的結合を確立する。いくつかの実施形態では、ガンマ振動の障害の知見は、異なるADのマウスモデル(hAPP及びapoE4)におけるガンマ障害の証拠に収斂し、ガンマがADのヒトにおいて変更されることを報告する。Tg及びノックインモデルを含めた複数のADのマウスモデルから収斂する証拠を探すことで、これらの結果が、単に導入遺伝子の過剰発現または特に1つのモデルに対する他の副作用によるものではないことが示され得る。マウス及びヒトからのこれらの結果を合わせて、Aβ病変に寄与する複数の分子経路が収斂してADにおけるガンマ振動を変更することが示される。本明細書に開示の知見は、ADに対する新規な治療的介入を期待できる。 The strong reduction in total amyloid levels is likely mediated by both decreased amyloidogenesis associated with decreased EEA1/Rab5-positive early endosomes and increased endocytosis of amyloid by microglia. Importantly, in the Gene Set Enrichment Analysis (GSEA) statistical analysis disclosed herein (The Broad Institute, Cambridge, Mass.), the cellular status of classical macrophage inflammatory M1 or anti-inflammatory M2 was It was shown not to correlate with either up- or down-regulated gene expression profiles after stimulation of neurons with 40 Hz oscillation. In fact, the expression levels of the inflammatory genes Il6, Il1b, Itgam and the anti-inflammatory gene Igf1 did not change after stimulation. Instead, multiple microglial prophagocytic genes and the cell adhesion/migration regulator Spp1 were activated with 40 Hz stimulation. Thus, driving 40 Hz gamma oscillations appears to induce a global neuroprotective response by recruiting both neurons and microglia. The fact that GABA-A antagonist treatment completely abrogated the effects of 40 Hz stimulation on lowering Aβ levels suggests that GABAergic signaling associated with FS-PV interneurons is likely essential for these effects. strongly suggested. Moreover, in some embodiments, 40 Hz blink stimulation reduced Aβ in multiple mouse models, including APP/PS1 and WT mice in addition to 5XFAD mice. This recapitulation in multiple mouse models suggests that these findings may not be specific to one animal model, and importantly, as in WT animals, APP is expressed by its physiological promoter and Aβ can extend to situations arising from endogenous APP. Furthermore, in some embodiments, 40 Hz oscillation was found to reduce pTau in a mouse model of tauopathy, TauP301S, suggesting that the protective effects of gamma stimulation are not only seen in other mouse models, but also in other pathogenic proteins. showed that it generalizes. In summary, the findings disclosed herein reveal previously unknown cellular and molecular processes mediated by gamma oscillations, and functional connections between brain gamma rhythms, microglial function, and AD-related pathology. Establish In some embodiments, findings of impaired gamma oscillations converge with evidence of gamma impairment in different mouse models of AD (hAPP and apoE4), reporting that gamma is altered in humans with AD. A search for converging evidence from multiple mouse models of AD, including Tg and knock-in models, indicates that these results are not simply due to transgene overexpression or other side effects for one model in particular. obtain. Together, these results from mice and humans indicate that multiple molecular pathways contributing to Aβ pathology converge to alter gamma oscillations in AD. The findings disclosed herein hold promise for novel therapeutic interventions against AD.
ADの発病の1つの理論は、ミクログリアの機能不全、具体的には、ミクログリアによる病的な分子の除去不全を疾患進行の重要な機序として指摘している。従って、40Hzの刺激が行うように、ミクログリアをエンドサイトーシス状態に復帰させる介入が、強い治療可能性を有する。本明細書にさらに記載される実験では、光遺伝学的な、または光の点滅によるガンマ振動の駆動は、ニューロンの活動過剰を引き起こさなかった。この方法は先行のAD療法とは基本的に異なるため、かかるパターン化された神経活動を駆動して内因性修復を誘発することで、ADに対する新規な治療方法が提供されよう。 One theory of AD pathogenesis points to microglial dysfunction, specifically failure to clear pathological molecules by microglia, as an important mechanism of disease progression. Therefore, interventions that revert microglia to a state of endocytosis, as 40 Hz stimulation does, have strong therapeutic potential. In the experiments further described herein, optogenetic or flashing light driving of gamma oscillations did not cause neuronal hyperactivity. Because this method is fundamentally different from previous AD therapies, driving such patterned neural activity to induce intrinsic repair would provide a novel therapeutic method for AD.
ガンマ周波数での視覚刺激は、対象の行動に好ましい影響を与えた。
いくつかの実施形態に従うガンマ曝露及び/または投与が対象に何らかのストレスを引き起こすかどうかを調べるための試験を実施した。図68Aは、本試験を示す流れ図である。図68Aの6800に示すように、いくつかの実施形態に従って、WTマウスを連続7日間、すなわち1~7日目に、1日1時間、普通室内光(N=8)または40Hzの光の点滅(N=8)のいずれかに曝露した。6802に示す8日目、マウスから採血し、血漿を分離してコルチコステロンレベルを調べた。マウスでは、コルチコステロンは、ストレス反応に関与する主要な糖質コルチコイドである。
Visual stimuli at gamma frequencies had a positive effect on subject behavior.
A study was conducted to determine whether gamma exposure and/or administration according to some embodiments causes any stress in subjects. FIG. 68A is a flow diagram showing this test. As shown at 6800 in FIG. 68A, according to some embodiments, WT mice were exposed to either normal room light (N=8) or 40 Hz light blinking for 1 hour per day for 7 consecutive days, days 1-7. (N=8). On
図68Bは、普通室内光(NRL)に曝露された8匹のマウス及び40Hzの光の点滅(40Hz)に曝露された8匹のマウスから採取した血漿におけるコルチコステロン(CORT)のレベル(pg/ml)を示す棒グラフである。40Hzの光の点滅に曝露されたマウスにおいてコルチコステロンの増加は認められなかった。代わりに、40Hzの光の点滅に曝露されたマウスの群は、対照群と比較して、コルチコステロンのレベルが低かった。1群当たりN=8の独立した測定値について、コルチコステロンレベルのT分布及びp値は:
T(14)=0.827、p=0.422 (1)
と計算された。
FIG. 68B shows levels of corticosterone (CORT) (pg /ml). No increase in corticosterone was observed in mice exposed to 40 Hz light blinking. Instead, groups of mice exposed to 40 Hz light blinking had lower levels of corticosterone compared to controls. For N=8 independent measurements per group, the T-distribution and p-values of corticosterone levels were:
T(14) = 0.827, p = 0.422 (1)
was calculated.
いくつかの実施形態に従うガンマ曝露及び/または投与が対象の不安を低減するかどうかを調べるために別の試験を実施した。図69Aは、本試験を示す流れ図である。図69Aの6900に示すように、いくつかの実施形態に従って、WTマウスを連続7日間、すなわち1~7日目に、1日1時間、普通室内光(N=10)または40Hzの光の点滅(N=10)のいずれかに曝露した。6902に示す8日目、10分間の期間の高架式十字迷路を実施した。
Another study was conducted to determine whether gamma exposure and/or administration according to some embodiments reduces anxiety in subjects. FIG. 69A is a flow diagram showing this test. As shown at 6900 in FIG. 69A, according to some embodiments, WT mice were exposed to either normal room light (N=10) or 40 Hz light blinking for 1 hour per day for 7 consecutive days, days 1-7. (N=10). On
高架式十字迷路は、実験動物の不安を測るために用いられる試験である。この行動モデルは、げっ歯類の開放的空間に対する一般的な嫌悪に基づいており、これが走触性、すなわち、閉鎖空間にとどまるかまたは囲まれた空間のへりの近くの優先傾向につながる。図69Bは、高架式十字迷路装置を示す画像である。この装置は、2つの壁なし走路(垂直)及び2つの壁あり走路(水平)の十字形である。不安は、動物が壁あり走路でより長い時間を過ごすことで表現される。 The elevated plus maze is a test used to measure anxiety in laboratory animals. This behavioral model is based on a general aversion to open spaces in rodents, which leads to haptotaxis, a preference for staying in closed spaces or near the edges of enclosed spaces. FIG. 69B is an image showing an elevated plus maze apparatus. The device is a cruciform with two wallless tracks (vertical) and two walled tracks (horizontal). Anxiety is expressed by the animals spending more time on the walled track.
図69C及び69Dは、高架式十字迷路期間中の対象の代表的な軌跡を示す画像である。いくつかの実施形態に従って、図69Cでは、普通室内光に曝露されたマウスは、壁あり走路にとどまる傾向があり、より大きな不安を示したが、図69Dでは、40Hzの光の点滅に曝露されたマウスは、壁なし走路と壁あり走路の両方を探索し、比較的小さい不安を示した。 Figures 69C and 69D are images showing representative trajectories of subjects during the elevated plus maze. According to some embodiments, mice exposed to normal room light tended to stay on the walled runway and exhibited greater anxiety in FIG. Mice explored both open and walled tracks and displayed relatively little anxiety.
図70は、いくつかの実施形態に従って、普通室内光(NRL)に曝露された10匹のマウス及び40Hzの光の点滅(40Hz)に曝露された10匹のマウスが壁なし走路及び壁あり走路で探索に費やした合計時間を示す棒グラフである。いくつかの実施形態に従って、40Hzの光の点滅に曝露されたマウスは、壁あり走路でより少ない合計時間及び壁なし走路でより長い合計時間を費やし、対照群と比較して、より少ない不安を示した。1群当たりN=10の独立した測定値について、壁あり走路の探索に費やされた合計時間に関するT分布及びp値は:
T(18)=-1.652、p=0.11 (2)
と計算された。
FIG. 70 shows that 10 mice exposed to normal room light (NRL) and 10 mice exposed to 40 Hz flashing light (40 Hz) were shown to be in a non-walled and a walled runway, according to some embodiments. is a bar graph showing the total time spent searching in . According to some embodiments, mice exposed to 40 Hz blinking lights spent less total time on the walled runway and longer total time on the non-walled runway and experienced less anxiety compared to the control group. Indicated. For N=10 independent measurements per group, the T-distribution and p-value for the total time spent exploring the walled track is:
T(18) = -1.652, p = 0.11 (2)
was calculated.
1群当たりN=10の独立した測定値について、壁なし走路の探索に費やされた合計時間に関するT分布及びp値は:
T(18)=-2.136、p=0.047 (3)
と計算された。
For N=10 independent measurements per group, the T-distribution and p-value for the total time spent exploring the wallless track is:
T(18) = -2.136, p = 0.047 (3)
was calculated.
いくつかの実施形態に従うガンマ曝露及び/または投与が対象のストレス及び/または不安を低減するかどうかを調べるために別の試験を実施した。図71Aは、本試験を示す流れ図である。図71Aの7100に示すように、いくつかの実施形態に従って、WTマウスを連続7日間、すなわち1~7日目に、1日1時間、普通室内光(N=8)または40Hzの光の点滅(N=8)のいずれかに曝露した。7102に示す8日目、5分間のオープン・フィールド試験を実施した。
Another study was conducted to determine whether gamma exposure and/or administration according to some embodiments reduces stress and/or anxiety in subjects. FIG. 71A is a flow diagram showing this test. As shown at 7100 in FIG. 71A, according to some embodiments, WT mice were exposed to either normal room light (N=8) or 40 Hz light blinking for 1 hour per day for 7 consecutive days, days 1-7. (N=8). On
オープン・フィールド試験は、実験動物で一般的な自発運動レベル及び不安をアッセイするのに用いられる実験である。行動モデルは、明るく照らされた領域を避けるが、認識された脅威刺激を探索するげっ歯類の矛盾した動きによって生じる不安に基づいている。図71Bは、オープン・フィールド・アリーナを示す画像である。このオープン・フィールド・アリーナは、脱出を防ぐための壁を有し、グリッドでマークしても、ソフトウェアシステムと一体化した赤外線ビームまたはビデオカメラを用いて監視してもよい。いくつかの実施形態に従って、不安の増加は、自発運動の低下及びフィールドのヘリに対する優先傾向をもたらすが、不安の減少は、探索行動の増加につながる。 The open field test is an experiment used to assay general locomotion levels and anxiety in experimental animals. A behavioral model is based on anxiety produced by contradictory movements of rodents avoiding brightly lit areas but exploring perceived threat stimuli. FIG. 71B is an image showing an open field arena. This open field arena has walls to prevent escape and may be marked with a grid or monitored using infrared beams or video cameras integrated with the software system. According to some embodiments, increased anxiety leads to decreased locomotor activity and a preference for field helicopters, whereas decreased anxiety leads to increased exploratory behavior.
図71C及び71Dは、オープン・フィールド試験中の対象の代表的な軌跡を示す画像である。いくつかの実施形態に従って、図71Cでは、普通室内光に曝露されたマウスは、アリーナのへりを好む傾向があり、より大きなストレス及び/または不安を示したが、図71Dでは、40Hzの光の点滅に曝露されたマウスは、アリーナの中心を探索し、比較的小さいストレス及び/または不安を示した。 Figures 71C and 71D are images showing representative trajectories of subjects during open field testing. According to some embodiments, mice exposed to normal room light tended to prefer arena edges and exhibited greater stress and/or anxiety in FIG. 71C, whereas in FIG. Blink-exposed mice explored the center of the arena and displayed relatively little stress and/or anxiety.
図72A及び72Bは、いくつかの実施形態に従って、普通室内光(NRL)に曝露された8匹のマウス及び40Hzの光の点滅(40Hz)に曝露された8匹のマウスが、オープン・フィールド・アリーナの中心及び周囲で探索に費やした合計時間を示すグラフである。図72Aは、5分ごとのアリーナの中心で費やされた平均秒数のプロットである。図72Bは、分ごとに平均された、全5分間にアリーナの周囲で費やされた合計時間の棒グラフである。 Figures 72A and 72B show that 8 mice exposed to normal room light (NRL) and 8 mice exposed to 40 Hz flashing light (40 Hz) were exposed to open field lighting, according to some embodiments. Fig. 3 is a graph showing the total time spent exploring in and around the arena; Figure 72A is a plot of the average number of seconds spent in the center of the arena every 5 minutes. FIG. 72B is a bar graph of total time spent around the arena for the entire 5 minutes, averaged by minute.
いくつかの実施形態に従って、対照群と比較して、平均すると、40Hzの光の点滅に曝露されたマウスは、2分、4分、及び5分の間に有意にアリーナの中心でより長い時間を過ごし、ひいてはより小さいストレス及び/または不安を示したが、これはまた、高架式十字迷路の結果と一致する。反復測定分散分析(RM ANOVA)を実施した。1群当たりN=8の独立した測定値について、オープン・フィールド・アリーナを探索するのに費やされた平均時間に対するF分布及びp値は:
F(1,14)=4.860、p=0.045 (4)
と計算された。
According to some embodiments, on average, mice exposed to 40 Hz light blinking spent significantly more time in the center of the arena during 2, 4, and 5 minutes compared to controls. and thus showed less stress and/or anxiety, which is also consistent with the elevated plus maze results. A repeated measures analysis of variance (RM ANOVA) was performed. The F-distribution and p-value for the mean time spent exploring the open field arena for N=8 independent measurements per group are:
F(1,14) = 4.860, p = 0.045 (4)
was calculated.
いくつかの実施形態に従うガンマ曝露及び/または投与が対象の生得新奇探索行動を変更するかどうかを調べるために別の試験を実施した。図73A及び73Bは、新奇認識タスクを用いた本試験を示す概略図である。図73Aでは、2つの新奇物体を慣れ親しんだアリーナに設ける。図73Bでは、1つの慣れ親しんだ物体と1つの新奇物体を慣れ親しんだアリーナに設ける。いくつかの実施形態に従って、野生型マウスを連続7日間、すなわち1~7日目に、1日1時間、普通室内光(N=8)または40Hzの光の点滅(N=8)のいずれかに曝露した。 Another study was conducted to determine whether gamma exposure and/or administration according to some embodiments alters a subject's innate novel-seeking behavior. Figures 73A and 73B are schematics showing this test using the novelty recognition task. In Figure 73A, two novelty objects are placed in a familiar arena. In Figure 73B, one familiar object and one novel object are placed in the familiar arena. According to some embodiments, wild-type mice are exposed to either normal room light (N=8) or 40 Hz flashing light (N=8) for 1 hour per day for 7 consecutive days, ie days 1-7. exposed to
8日目に、これらのマウスを5分間、図73Aのシナリオ、すなわち、慣れ親しんだアリーナ内で2つの新奇物体に曝露した。図73Cは、いくつかの実施形態に従って、普通室内光(NRL)に曝露された8匹のマウス及び40Hzの光の点滅(40Hz)に曝露された8匹のマウスについて、新奇物体Bの探索に費やされた時間のパーセンテージに対して、新奇物体Aを探索するのに費やされた時間のパーセンテージを示す棒グラフである。図73Cに示すように、各群によって各物体に対して等しい優先傾向が見られた。すなわち、群間で、物体探索に差は認められなかった。
On
次に、これらマウスを5分間、図73Bのシナリオ、すなわち、慣れ親しんだアリーナ内で1つの慣れ親しんだ物体及び1つの新奇物体に曝露した。図74は、5分ごとの新奇物体を探索するのに費やされた平均秒数を示すプロットである。いくつかの実施形態に従って、対照群と比較して、平均すると、40Hzの光の点滅に曝露されたマウスは、特に1~3分及び5分の間、有意に長い時間を新奇物体の探索に費やし、ひいては、新奇探索行動の増加を示した。フリードマンのノンパラメトリックRM ANOVAを実施した。1群当たりN=8の独立した測定値について、新奇物体を探索するのに費やされた平均時間に対する検定統計量χ2及びp値は:
χ2(4,n=16)=16.088、p=0.003 (5)
と計算された。
The mice were then exposed for 5 minutes to the scenario of Figure 73B, ie, 1 familiar and 1 novel object in a familiar arena. FIG. 74 is a plot showing the average number of seconds spent searching for novel objects every 5 minutes. According to some embodiments, on average, mice exposed to 40 Hz blinking lights spend significantly longer time exploring novel objects, especially between 1-3 and 5 minutes, compared to controls. showed an increase in novelty-exploring behavior. Friedman's nonparametric RM ANOVA was performed. For N=8 independent measurements per group, the test statistic χ2 and the p - value for the mean time spent exploring the novel object is:
χ 2 (4, n=16)=16.088, p=0.003 (5)
was calculated.
3分の間に新奇物体を探索するのに費やされた平均時間に対してマン・ホイットニーU検定を実施した。1群当たりN=8の独立した測定値について、U値、Z値、及びp値は:
U=58.00、Z=2.731、p=0.005 (6)
と計算された。
A Mann-Whitney U test was performed on the average time spent exploring the novel object during 3 minutes. For N=8 independent measurements per group, the U-value, Z-value and p-value are:
U=58.00, Z=2.731, p=0.005 (6)
was calculated.
いくつかの実施形態に従うガンマ曝露及び/または投与が対象の学習及び記憶に影響を与えるかどうかを調べるために別の試験を実施した。図75Aは、恐怖条件付けパラダイムを用いた試験を示す流れ図である。図75Aに7500で示されるように、いくつかの実施形態に従って、WTマウスを連続7日間、すなわち1~7日目に、1日1時間、普通室内光または40Hzの光の点滅のいずれかに曝露した。7502で示される8日目、これらマウスを軽度の2トーン・ショック・ペアリングに供した。具体的には、マウスを第一のトーンと足のショックを組み合わせた新たなアリーナに入れた。これらのマウスは、文脈(すなわち、トーン)と嫌悪体験(すなわち、足のショック)を関連付けるように条件付けされた。この最初の文脈について、すくみに費やされた合計時間に対するT分布及びp値は:
T(24)=0.577、p=0.569 (7)
と計算された。
Another study was conducted to determine whether gamma exposure and/or administration according to some embodiments affects learning and memory in subjects. FIG. 75A is a flow diagram showing testing using the fear conditioning paradigm. According to some embodiments, WT mice were exposed to either normal room light or 40 Hz flashing light for 1 hour per day for 7 consecutive days, ie, days 1-7, as shown at 7500 in FIG. 75A. exposed. On
T(24) = 0.577, p = 0.569 (7)
was calculated.
7504で示される9日目、トーン試験を変更した文脈で実施した。図75Bは、第一のトーンの文脈7506、第一のトーンの文脈後7508、第二のトーンの文脈7510、及び第二のトーンの文脈後7512を含む、時間の関数としてトーン試験を示す刺激図である。本試験のため、マウスを、第一のトーンが足のショックと組み合わされたアリーナに戻した。第一のトーンの文脈7506を適用すると、40Hzの光の点滅に曝露されたマウスは、恐らく足のショックを予期して、ひいては記憶の尺度を示すすくみにより長い時間を費やした。40Hzの光の点滅に曝露されたマウスはまた、第二のトーンの文脈7510の間もすくみに対照群より長い時間を費やしたが、いずれのトーンの文脈後の間もすくみ時間は少なかった。
On
図76A及び76Bは、いくつかの実施形態に従って、記憶の強化を示す棒グラフである。いくつかの実施形態に従って、図76Aに示すように、第一のトーンの文脈7506及び第二のトーンの文脈7510の間のすくみに費やされた時間のパーセンテージは、対照群と比較して、40Hzの光の点滅に曝露されたマウスでより高く、記憶の連合の強化を示した。さらに、いくつかの実施形態に従って、40Hzの光の点滅に曝露されたマウスは、トーン提示後により強い消去を示した。図76Bに示すように、いくつかの実施形態に従って、第一のトーンの文脈7506後の間及び第二のトーンの文脈7510後の間にすくみに費やされた時間のパーセンテージは、40Hzの光の点滅に曝露されたマウスと比較して、対照群でより高く、記憶の特異性の強化を示した。 76A and 76B are bar graphs showing memory enhancement, according to some embodiments. According to some embodiments, as shown in FIG. 76A, the percentage of time spent freezing between the first tone context 7506 and the second tone context 7510 compared to the control group is: It was higher in mice exposed to 40 Hz light blinking, indicating enhanced memory associations. Furthermore, according to some embodiments, mice exposed to 40 Hz light blinking exhibited stronger extinction after tone presentation. As shown in FIG. 76B, according to some embodiments, the percentage of time spent freezing between after the first tone context 7506 and after the second tone context 7510 is showed enhanced memory specificity, which was higher in the control group compared to mice exposed to blinking.
トーンの文脈前について、RM ANOVAを群間で実施したところ、すくみに費やされた平均時間に対するF分布及びp値は:
F(1,24)=3.106、p=0.091 (8)
と計算された。
RM ANOVA was performed between groups for pre-context tones and the F-distribution and p-value for mean time spent freezing was:
F(1,24) = 3.106, p = 0.091 (8)
was calculated.
第一のトーンの文脈について、すくみに費やされた合計時間に対するT分布及びp値は:
T(24)=-2.155、p=0.041 (9)
と計算された。
For the context of the first tone, the T-distribution and p-value for the total time spent freezing is:
T(24) = -2.155, p = 0.041 (9)
was calculated.
第二のトーンの文脈について、すくみに費やされた合計時間に対するT分布及びp値は:
T(24)=-1.433、p=0.164 (10)
と計算された。
For the context of the second tone, the T-distribution and p-value for the total time spent freezing is:
T(24) = -1.433, p = 0.164 (10)
was calculated.
トーンの文脈について、RM ANOVAを群間で実施したところ、すくみに費やされた平均時間に対するF分布及びp値は:
F(1,24)=4.559、p=0.043 (11)
と計算された。
RM ANOVA was performed between groups for the context of tone and the F-distribution and p-value for the mean time spent freezing was:
F(1,24) = 4.559, p = 0.043 (11)
was calculated.
第一のトーンの文脈後について、すくみに費やされた合計時間に対するT分布及びp値は:
T(24)=1.874、p=0.073 (12)
と計算された。
After the context of the first tone, the T-distribution and p-value for the total time spent freezing is:
T(24) = 1.874, p = 0.073 (12)
was calculated.
第二のトーンの文脈後について、すくみに費やされた合計時間に対するT分布及びp値は:
T(24)=2.223、p=0.036 (13)
と計算された。
After the context of the second tone, the T-distribution and p-value for the total time spent freezing is:
T(24) = 2.223, p = 0.036 (13)
was calculated.
トーンの文脈後について、RM ANOVAを群間で実施したところ、すくみに費やされた平均時間に対するF分布及びp値は:
F(1,24)=6.646、p=0.017 (14)
と計算された。
RM ANOVA was performed between groups for post-context tones and the F-distribution and p-value for mean time spent freezing was:
F(1,24) = 6.646, p = 0.017 (14)
was calculated.
いくつかの実施形態に従うガンマ曝露及び/または投与が対象の記憶を改善するかどうかを調べるために別の試験を実施した。図77Aは、本試験を示す流れ図である。図77Aの7700で示すように、いくつかの実施形態に従って、WTマウスを連続7日間、すなわち1~7日目に、1日1時間、普通室内光または40Hzの光の点滅のいずれかに曝露した。7702で示される8日目、Morris水迷路試験を実施した。
Another study was conducted to determine whether gamma exposure and/or administration according to some embodiments improves memory in subjects. Figure 77A is a flow diagram showing this test. As shown at 7700 in FIG. 77A, according to some embodiments, WT mice are exposed to either normal room light or 40 Hz flashing light for 1 hour per day for 7 consecutive days, ie days 1-7. bottom. On
Morris水航行タスクまたは迷路は、実験動物で空間記憶及び学習を研究するために用いられる試験である。行動に関する手続きは、対象を目に見えないまたは見える台を備えた大きな円形のプールに入れることを含み、この台は、対象が、習慣的な方法(台に到着するのに必要な動きの想起)、走性的方法(台を見つける視覚的手がかりの使用)、または空間的方法(基準点として遠位の手がかりの使用)を用いて脱出するのを可能にする。図77Bは、Morris水迷路を示す図である。この迷路は、方向象限に分割された水の円形プール及び南西(SW)象限に隠された台7704を含む。
The Morris water navigation task or maze is a test used to study spatial memory and learning in experimental animals. The behavioral procedure involved placing the subject in a large circular pool with an invisible or visible platform that allowed the subject to perform a habitual process (remembering the movements required to reach the platform). ), tactical methods (use of visual cues to locate the platform), or spatial methods (use of distal cues as reference points) to allow escape. FIG. 77B shows the Morris water maze. The maze includes a circular pool of water divided into directional quadrants and a
弱い訓練については、Morris水迷路試験を連続4日間、すなわち、8~11日目に、1日2回繰り返した。図78Aは、いくつかの実施形態に従って、普通室内光(NRL)に曝露されたマウス及び40Hzの光の点滅(40Hz)に曝露されたマウスが台を見つけるまでの時間を示すプロットである。 For weak training, the Morris water maze test was repeated twice daily for 4 consecutive days, ie days 8-11. FIG. 78A is a plot showing time to find a platform for mice exposed to normal room light (NRL) and 40 Hz flashing light (40 Hz), according to some embodiments.
12日目、Morris水迷路から、隠された台を除去してプローブ試験を実施した。図77C及び77Dは、プローブ試験中の対象の代表的な軌跡を示す画像である。いくつかの実施形態に従って、図77Cでは、普通室内光に曝露されたマウスは、プール全体にわたって台を探したように見えるが、図77Dでは、40Hzの光の点滅に曝露されたマウスは、より系統的に、主にSW象限を探したように見える。図78Bは、目標象限(すなわち、SW象限)内で台を探すのに費やされた合計時間(各30秒間当たりの秒数)を示すプロットであり、図78Cは、逆の象限(すなわち、NE象限)内で台を探すのに費やされた合計時間(各30秒間当たりの秒数)を示すプロットである。いくつかの実施形態に従って、40Hzの光の点滅に曝露されたマウスは、目標象限を探すのに対照群より多くの時間を費やし、かつ逆の象限を探すのに対照群より少ない時間を費やし、空間記憶の強化を示した。
On
Morris水迷路試験及びプローブ試験から同じ群のマウスを用いて、逆転学習を実施した。図79Aは、本試験でSW象限に隠された台7900を備えたMorris水迷路を示す図である。図79Bは、逆転学習のため、逆のNE象限に隠された台7902を備えたMorris水迷路を示す図である。
Reversal learning was performed using the same groups of mice from the Morris water maze test and the probe test. FIG. 79A shows the Morris water maze with
弱い訓練については、逆転学習を連続4日間、すなわち、14~17日目、1日2回繰り返した。図79Cは、いくつかの実施形態に従って、普通室内光(NRL)に曝露されたマウス及び40Hzの光の点滅(40Hz)に曝露されたマウスが台を見つけるまでの時間を示すプロットである。7日目以降さらなる40Hzの曝露を受けていないにもかかわらず、40Hzの光の点滅に曝露されたマウスは、行動に関する柔軟性の増加を示した。
For weak training, reversal learning was repeated twice daily for 4 consecutive days, ie days 14-17. FIG. 79C is a plot showing time to find a platform for mice exposed to normal room light (NRL) and 40 Hz flashing light (40 Hz), according to some embodiments. Mice exposed to 40 Hz light blinking showed increased behavioral flexibility even though they received no further 40 Hz exposure after
いくつかの実施形態に従って、長期的なガンマ曝露及び/または投与が、対象の空間学習及び記憶に影響を与えるかどうかを調べるために別の試験を実施した。図80Aは、本試験を示す流れ図である。図80Aの8000で示すように、いくつかの実施形態に従って、C57BL/6マウスを、2週間、1日1時間、普通室内光(N=7)または40Hzの光の点滅(N=7)のいずれかに曝露した。8002で示される第3週の間、これらマウスを普通室内光または40Hzの光の点滅のいずれかに、毎朝1時間曝露し続け、その後毎日午後、同様にMorris水迷路試験に供した。
In accordance with some embodiments, another study was conducted to determine whether long-term gamma exposure and/or administration affects spatial learning and memory in subjects. FIG. 80A is a flow diagram showing this test. As shown at 8000 in FIG. 80A, according to some embodiments, C57BL/6 mice were exposed to either normal room light (N=7) or 40 Hz flashing light (N=7) for 1 hour per day for 2 weeks. exposed to either. During
図80Bは、第3週の1~4日目に、普通室内光(NRL)に曝露されたマウス及び40Hzの光の点滅(40Hz)に曝露されたマウスが台を見つけるまでの時間を示すプロットである。第3週の後、隠された台を取り除いてプローブ試験を実施した。図80Cは、プローブ試験中に目標象限内で台を探すのに費やされた合計時間(30秒の試験ごとの秒数)を示す棒グラフである。いくつかの実施形態に従って、1週間の処理と同様に、長期的な3週間の処理は、空間学習を強化した。
FIG. 80B is a plot showing the time to find a platform for mice exposed to normal room light (NRL) and 40 Hz flashing light (40 Hz) on days 1-4 of
図80A~80Cから同じ群のマウスを用いて逆転学習を実施した。図81Aは、拡張した試験を示す流れ図である。図81Aの8100に示すように、いくつかの実施形態に従って、C57BL/6マウスを、2週間、1日1時間、普通室内光または40Hzの光の点滅のいずれかに曝露した。8102で示される第3週の間、これらマウスを普通室内光または40Hzの光の点滅のいずれかに、毎朝1時間曝露し続け、その後毎日午後、同様にMorris水迷路試験に供した。8104で示される第4週の間、これらマウスを普通室内光または40Hzの光の点滅のいずれかに、毎朝1時間曝露し続け、その後毎日午後、同様にMorris水迷路再試験に供した。図81Bは、いくつかの実施形態に従って、第4週の1~4日目に、普通室内光(NRL)に曝露されたマウス及び40Hzの光の点滅(40Hz)に曝露されたマウスが台を見つけるまでの時間を示すプロットである。
Reversal learning was performed using the same groups of mice from Figures 80A-80C. FIG. 81A is a flow diagram showing an extended test. As shown at 8100 in FIG. 81A, according to some embodiments, C57BL/6 mice were exposed to either normal room light or 40 Hz flickering light for 1 hour per day for 2 weeks. During
第4週の後、隠された台を取り除いてプローブ試験を実施した。図82Aは,プローブ試験中に目標象限内で台を探すのに費やされた合計時間(30秒の試験ごとの秒数)を示す棒グラフである。図82Bは、プローブ試験中、逆の象限内で費やされた時間を示す棒グラフである。40Hzの光の点滅に曝露されたマウスは、強い認識の柔軟性を示した。 After the fourth week, the hidden platform was removed and probe testing was performed. FIG. 82A is a bar graph showing the total time (seconds per 30 second trial) spent searching for a platform within the target quadrant during the probe trial. FIG. 82B is a bar graph showing time spent in the opposite quadrant during probe testing. Mice exposed to 40 Hz light blinks showed strong cognitive flexibility.
ガンマ周波数での視覚刺激は、解剖学的、形態学、細胞的、及び分子的利益を与えた。
いくつかの実施形態に従って、対象の視覚野におけるDNA損傷ならびにニューロンの欠損に対するガンマ曝露及び/または投与の影響を調べるために試験を実施した。本試験のため、p25蓄積の誘導性マウスモデル(すなわち、クレアチンキナーゼカルボキシル末端断片p25Tgマウス(CK-p25Tgマウス))を用いた。CK-p25Tgマウスモデルは、前脳内の重大なニューロン損失、Aβペプチド産生増加、タウ病理、DNA損傷、及び重度の認知機能障害を含むADの重要な病理学的特徴を示す。本モデルでは、ニューロンの損失に先立ってAβペプチドレベルの上昇が認められ、さらに、Aβペプチド産生の低減はCK-p25Tgマウスモデルにおいて記憶障害を軽減することから、この事象がカルボキシル末端断片p25と相乗的に作用し、神経変性及び記憶障害の発現につながることを示している。
Visual stimulation at gamma frequencies conferred anatomical, morphological, cellular, and molecular benefits.
According to some embodiments, studies were conducted to examine the effects of gamma exposure and/or administration on DNA damage and neuronal loss in the visual cortex of subjects. For this study, an inducible mouse model of p25 accumulation was used, ie, creatine kinase carboxyl-terminal fragment p25Tg mice (CK-p25Tg mice). The CK-p25Tg mouse model exhibits key pathological features of AD including profound neuronal loss in the forebrain, increased Aβ peptide production, tau pathology, DNA damage, and severe cognitive impairment. This event is synergistic with the carboxyl-terminal fragment p25, as increased Aβ peptide levels precede neuronal loss in this model and reduced Aβ peptide production attenuates memory deficits in the CK-p25Tg mouse model. It has been shown to act as an antidote and lead to the development of neurodegeneration and memory impairment.
図83は、CK-p25Tgマウスにおける変化を示すスケジュール図8300である。2週間後8302、マウスはDNA損傷(例えば、バイオマーカーγH2AX)、Aβペプチドの増加、及びミクログリア活性化を示す。6週間後8304、マウスはシナプスの損失、ニューロンの損失、タウの高リン酸化、長期増強不全、及び記憶障害を示す。
Figure 83 is a schedule diagram 8300 showing changes in CK-p25Tg mice. After 2
異なる処理計画下でのマウスの群を比較するために試験を実施した。図84は、CK対照マウス8400、未処理CK-p25Tgマウス8402、メマンチンで処理された(毎日10mg/kg)CK-p25Tgマウス8404、いくつかの実施形態に従って40Hzの光の点滅に曝露された(6週間毎日1時間)CK-p25Tgマウス8406、ならびにメマンチンで処理され、さらに40Hzの光の点滅に曝露されたCK-p25Tgマウス8408を含む群の図である。メマンチンは、NMDA受容体を遮断し、それによりグルタミン酸系に作用することで重度のADを治療するのに使用される、ある程度の成功を収める薬剤である。
A study was conducted to compare groups of mice under different treatment regimens. FIG. 84 shows
いくつかの実施形態に従うガンマ曝露及び/または投与は、脳の解剖学的構造を保存及び/またはそれに関する変化を減少させることが示された。例えば、ガンマ曝露は、CKp-25誘導性の脳重量の減量を低減及び/または防止した。図85は、CK対照マウス、未処理CK-p25Tgマウス、メマンチンで処理されたCK-p25Tgマウス、いくつかの実施形態に従って40Hzの光の点滅に曝露されたCK-p25Tgマウス、ならびにメマンチン及び40Hzの光の点滅の両方で処理されたCK-p25Tgマウスにおける脳重量の変化を比較する棒グラフである。脳重量の減量は、未処理CK-p25Tgマウス、メマンチンで処理されたCK-p25Tgマウス、ならびにメマンチン及び40Hzの光の点滅の両方で処理されたCK-p25Tgマウスで顕著であった。しかしながら、いくつかの実施形態に従って、40Hzの光の点滅に曝露されたCK-p25Tgマウスは、より大きな脳重量を保っていた。 Gamma exposure and/or administration according to some embodiments has been shown to preserve and/or reduce changes in brain anatomy. For example, gamma exposure reduced and/or prevented CKp-25-induced brain weight loss. FIG. 85 shows CK control mice, untreated CK-p25Tg mice, CK-p25Tg mice treated with memantine, CK-p25Tg mice exposed to 40 Hz light blinks according to some embodiments, and memantine and 40 Hz Bar graph comparing changes in brain weight in CK-p25Tg mice treated with both flashing lights. Brain weight loss was noted in untreated CK-p25Tg mice, CK-p25Tg mice treated with memantine, and CK-p25Tg mice treated with both memantine and 40 Hz light blinking. However, according to some embodiments, CK-p25Tg mice exposed to 40 Hz light blinking retained greater brain weights.
いくつかの実施形態に従うガンマ曝露及び/または投与は、脳の形態を保存及び/またはそれに関する変化を減少させることが示された。例えば、ガンマ曝露は、対象のCKp-25誘導性の異常な側脳室拡張を低減及び/または防止した。図86は、CK対照マウス、未処理CK-p25Tgマウス、メマンチンで処理されたCK-p25Tgマウス、いくつかの実施形態に従って40Hzの光の点滅に曝露されたCK-p25Tgマウス、ならびにメマンチン及び40Hzの光の点滅の両方で処理されたCK-p25Tgマウスにおける側脳室拡張の比を、ベースラインとしてのCK対照マウスにおける拡張と比較する棒グラフである。側脳室の拡張は、未処理CK-p25Tgマウス、メマンチンで処理されたCK-p25Tgマウス、ならびにメマンチン及び40Hzの光の点滅の両方で処理されたCK-p25Tgマウスで顕著であった。いくつかの実施形態に従って、40Hzの光の点滅に曝露されたCK-p25Tgマウスの側脳室は、他のCK-p25Tgマウスの側脳室よりはるかに拡張が小さかった。 Gamma exposure and/or administration according to some embodiments has been shown to preserve and/or reduce changes in brain morphology. For example, gamma exposure reduced and/or prevented CKp-25-induced abnormal lateral ventricular dilatation in subjects. FIG. 86 shows CK control mice, untreated CK-p25Tg mice, CK-p25Tg mice treated with memantine, CK-p25Tg mice exposed to 40 Hz light blinks according to some embodiments, and memantine and 40 Hz Bar graph comparing the ratio of lateral ventricle dilatation in CK-p25Tg mice treated with both flashing lights to dilatation in CK control mice as baseline. Expansion of the lateral ventricle was noted in untreated CK-p25Tg mice, CK-p25Tg mice treated with memantine, and CK-p25Tg mice treated with both memantine and 40 Hz light blinking. According to some embodiments, the lateral ventricles of CK-p25Tg mice exposed to 40 Hz light blinking were much less dilated than those of other CK-p25Tg mice.
図87A~87Eは、各群における対象の代表的な側脳室を示す画像である。側脳室は未処理CK-p25Tgマウス(図87A)、メマンチンで処理されたCK-p25Tgマウス(図87B)、ならびにメマンチン及び40Hzの光の点滅の両方で処理されたCK-p25Tgマウス(図87C)において最大であった。図87Dに示すように、いくつかの実施形態に従って、40Hzの光の点滅に曝露されたCK-p25Tgマウスの側脳室は、拡張がはるかに小さかった。図87Eは、CK対照マウスにおけるベースラインの側脳室サイズの例である。 Figures 87A-87E are images showing representative lateral ventricles of subjects in each group. Lateral ventricles were exposed to untreated CK-p25Tg mice (FIG. 87A), CK-p25Tg mice treated with memantine (FIG. 87B), and CK-p25Tg mice treated with both memantine and 40 Hz light blinking (FIG. 87C). ) was the largest. As shown in FIG. 87D, according to some embodiments, the lateral ventricles of CK-p25Tg mice exposed to 40 Hz light blinking were much less dilated. FIG. 87E is an example of baseline lateral ventricular size in CK control mice.
図88A~88Cは、いくつかの実施形態に従って、分子の特徴づけのための目的の脳領域を示す脳解剖図である。図88Aは、視覚野(V1)8800、体性感覚皮質(SS1)8802、海馬8804、及び島皮質8806を含む。
88A-88C are brain anatomy diagrams showing brain regions of interest for molecular characterization, according to some embodiments. FIG. 88A includes visual cortex (V1) 8800, somatosensory cortex (SS1) 8802,
いくつかの実施形態に従うガンマ曝露及び/または投与は、視覚野の皮層及びニューロンの層を保存及び/またはそれらに関する変化を減少させることが示された。例えば、ガンマ曝露は、対象の視覚野におけるCKp-25誘導性の皮層及びニューロン層の損失を低減及び/または防止した。 Gamma exposure and/or administration according to some embodiments has been shown to preserve and/or reduce changes in the cortical and neuronal layers of the visual cortex. For example, gamma exposure reduced and/or prevented CKp-25-induced cortical and neuronal layer loss in the visual cortex of subjects.
皮層の損失は、Hoechst標識(すなわち、DNAを染色するために用いられる青色蛍光染料)による核染色を用いて測定した。ニューロンの層の損失は、NeuN、すなわち、ニューロンのバイオマーカーとして通常用いられるニューロンの核抗原を用いて測定した。図89は、各群におけるV1皮層の平均厚さを示す棒グラフであり、図90は、各群におけるV1-NeuN陽性細胞層の平均厚さを示す棒グラフである。 Cortical loss was measured using nuclear staining with the Hoechst label, a blue fluorescent dye used to stain DNA. Neuronal layer loss was measured using NeuN, a neuronal nuclear antigen commonly used as a neuronal biomarker. FIG. 89 is a bar graph showing the average thickness of the V1 cortical layer in each group, and FIG. 90 is a bar graph showing the average thickness of the V1-NeuN positive cell layer in each group.
図91A~91Eは、各群における対象の代表的なHoechst標識及び/またはNeuN標識を有する細胞を示す画像である。図91Aは、CK対照マウスにおけるベースラインのV1皮層(例えば、837±9μm)及びV1ニューロン層(例えば、725±7μm)の厚さの例である。 Figures 91A-91E are images showing cells with representative Hoechst and/or NeuN labeling of interest in each group. FIG. 91A is an example of baseline V1 cortical (eg, 837±9 μm) and V1 neuronal layer (eg, 725±7 μm) thickness in CK control mice.
V1皮層は、いくつかの実施形態に従って、40Hzの光の点滅に曝露されたCK-p25Tgマウス(図91D、例えば、855±9μM)、メマンチン及び40Hzの光の点滅の両方で処理されたCK-p25Tgマウス(図91E、例えば、821±22μM)、未処理CK-p25Tgマウス(図91B、例えば、792±13μM)、ならびにメマンチンで処理されたCK-p25Tgマウス(図91C、例えば、788±9μM)で次第に薄くなった。 According to some embodiments, the V1 cortex was CK-p25Tg mice exposed to 40 Hz light blinks (FIG. 91D, eg, 855±9 μM), CK-p25Tg mice treated with both memantine and 40 Hz light blinks. p25Tg mice (FIG. 91E, eg, 821±22 μM), untreated CK-p25Tg mice (FIG. 91B, eg, 792±13 μM), and CK-p25Tg mice treated with memantine (FIG. 91C, eg, 788±9 μM). gradually became thinner.
いくつかの実施形態に従って、40Hzの光の点滅に曝露されたCK-p25TgマウスにおけるV1ニューロン層は、CK対照マウスにおけるより実際に厚かった(図91D、例えば、743±9μM)が、その一方、メマンチン及び40Hzの光の点滅の両方で処理されたCK-p25Tgマウス(図91E、例えば、691±20μM)、未処理CK-p25Tgマウス(図91B、例えば、666±14μM)、ならびにメマンチンで処理されたCK-p25Tgマウス(図91C、例えば、660±7μM)で、CK対照マウスにおけるより次第に薄くなった。 According to some embodiments, the V1 neuronal layer in CK-p25Tg mice exposed to 40 Hz light blinking was actually thicker than in CK control mice ( FIG. 91D , eg, 743±9 μM), whereas CK-p25Tg mice treated with both memantine and 40 Hz light blinking (FIG. 91E, eg, 691±20 μM), untreated CK-p25Tg mice (FIG. 91B, eg, 666±14 μM), and memantine-treated CK-p25 Tg mice (FIG. 91C, eg, 660±7 μM) were progressively thinner than in CK control mice.
いくつかの実施形態に従うガンマ曝露及び/または投与は、体性感覚皮質において皮層ならびにニューロン層を保存及び/またはそれらに関する変化を減少させることが示された。例えば、ガンマ曝露は、対象の体性感覚皮質におけるCKp-25誘導性の皮層及びニューロン層の損失を低減及び/または防止した。 Gamma exposure and/or administration according to some embodiments has been shown to preserve and/or reduce changes in cortical and neuronal layers in the somatosensory cortex. For example, gamma exposure reduced and/or prevented CKp-25-induced cortical and neuronal layer loss in the subject's somatosensory cortex.
図92は、各群におけるSS1皮層の平均厚さを示す棒グラフであり、図93は、各群におけるSS1-NeuN陽性細胞層の平均厚さを示す棒グラフである。 FIG. 92 is a bar graph showing the average thickness of the SS1 cortex in each group, and FIG. 93 is a bar graph showing the average thickness of the SS1-NeuN positive cell layer in each group.
図94A~94Eは、各群における対象の代表的なHoechst標識及び/またはNeuN標識を有する細胞を示す画像である。図94Aは、CK対照マウスにおけるベースラインのSS1皮層(例えば、846±10μM)及びSS1ニューロン層(例えば、707±8μM)の厚さの例である。 Figures 94A-94E are images showing cells with representative Hoechst and/or NeuN labeling of interest in each group. FIG. 94A is an example of baseline SS1 cortical (eg, 846±10 μM) and SS1 neuronal layer (eg, 707±8 μM) thickness in CK control mice.
SS1皮層は、いくつかの実施形態に従って40Hzの光の点滅に曝露されたCK-p25Tgマウス(図94D、例えば、834±94μM)、メマンチン及び40Hzの光の点滅の両方で処理されたCK-p25Tgマウス(図94E、例えば、778±13μM)、未処理CK-p25Tgマウス(図94B、例えば、762±17μM)、ならびにメマンチンで処理されたCK-p25Tgマウス(図94C、例えば、756±11μM)で次第に薄くなった。 The SS1 cortex was CK-p25Tg mice exposed to 40 Hz light blinks according to some embodiments (FIG. 94D, eg, 834±94 μM), CK-p25Tg treated with both memantine and 40 Hz light blinks. in mice (FIG. 94E, eg, 778±13 μM), untreated CK-p25Tg mice (FIG. 94B, eg, 762±17 μM), and CK-p25Tg mice treated with memantine (FIG. 94C, eg, 756±11 μM). gradually thinned out.
いくつかの実施形態に従って40Hzの光の点滅に曝露されたCK-p25TgマウスにおけるSS1ニューロン層は、CK対照マウスにおける厚さとほぼ同じ厚さであった(図94D、例えば、705±15μM)。しかしながら、SS1ニューロン層は、メマンチン及び40Hzの光の点滅の両方で処理されたCK-p25Tgマウス(図94E、例えば、650±11μM)、未処理CK-p25Tgマウス(図94B、例えば、630±13μM)、ならびにメマンチンで処理されたCK-p25Tgマウス(図94C、例えば、629±9μM)で次第に薄くなった。 The SS1 neuronal layer in CK-p25Tg mice exposed to 40 Hz light blinking according to some embodiments was approximately the same thickness as in CK control mice (FIG. 94D, eg, 705±15 μM). However, the SS1 neuronal layer was significantly reduced in CK-p25Tg mice treated with both memantine and 40 Hz light blinking (Fig. 94E, e.g., 650 ± 11 μM), untreated CK-p25Tg mice (Fig. 94B, e.g., 630 ± 13 μM). ), as well as CK-p25Tg mice treated with memantine (FIG. 94C, eg, 629±9 μM).
いくつかの実施形態に従うガンマ曝露及び/または投与は、島皮質における皮層及びニューロン層を保存及び/またはそれらに関する変化を減少させることが示された。例えば、ガンマ曝露は、対象の島皮質におけるCKp-25誘導性の皮層及びニューロン層の損失を低減及び/または防止した。 Gamma exposure and/or administration according to some embodiments has been shown to preserve and/or reduce changes in cortical and neuronal layers in the insular cortex. For example, gamma exposure reduced and/or prevented CKp-25-induced cortical and neuronal layer loss in the insular cortex of subjects.
図95は、各群における島皮質の皮層の平均厚さを示す棒グラフであり、図96は、各群における島皮質のNeuN陽性細胞層の平均厚さを示す棒グラフである。 FIG. 95 is a bar graph showing the average thickness of the insular cortical layer in each group, and FIG. 96 is a bar graph showing the average thickness of the NeuN-positive cell layer in the insular cortex in each group.
図97A~97Eは、各群における対象の代表的なHoechst標識及び/またはNeuN標識を有する細胞を示す画像である。図97Aは、CK対照マウスにおける島皮質のベースラインの皮層(例えば、1134±10μM)及びニューロン層(例えば、1010±11μM)の厚さの例である。 Figures 97A-97E are images showing cells with representative Hoechst and/or NeuN labeling of interest in each group. FIG. 97A is an example of baseline cortical (eg, 1134±10 μM) and neuronal layer (eg, 1010±11 μM) thicknesses of the insular cortex in CK control mice.
皮層は、いくつかの実施形態に従って40Hzの光の点滅に曝露されたCK-p25Tgマウス(図97D、例えば、1079±20μM)、メマンチンで処理されたCK-p25Tgマウス(図97C、例えば、983±12μM)、メマンチン及び40Hzの光の点滅の両方で処理されたCK-p25Tgマウス(図97E、例えば、965±16μM)、ならびに未処理CK-p25Tgマウス(図97B、例えば、764±27μM)の島皮質で次第に薄くなった。 Cortical layers were exposed to 40 Hz light blinking according to some embodiments (Fig. 97D, e.g., 1079 ± 20 μM), CK-p25Tg mice treated with memantine (Fig. 97C, e.g., 983 ± 12 μM), islets of CK-p25Tg mice treated with both memantine and 40 Hz light blinking (FIG. 97E, eg, 965±16 μM), and untreated CK-p25Tg mice (FIG. 97B, eg, 764±27 μM). Gradually thinned in the cortex.
ニューロン層は、いくつかの実施形態に従って40Hzの光の点滅に曝露されたCK-p25Tgマウス(図97D、例えば、953±17μM)、未処理CK-p25Tgマウス(図97B、例えば、861±30μM)、メマンチンで処理されたCK-p25Tgマウス(図97C、例えば、850±18μM)、ならびにメマンチン及び40Hzの光の点滅の両方で処理されたCK-p25Tgマウス(図97E、例えば、848±15μM)の島皮質で次第に薄くなった。 The neuronal layer is quantified in CK-p25Tg mice exposed to 40 Hz light blinking (FIG. 97D, eg, 953±17 μM), untreated CK-p25Tg mice (FIG. 97B, eg, 861±30 μM), according to some embodiments. , CK-p25Tg mice treated with memantine (Fig. 97C, e.g., 850 ± 18 μM) and CK-p25Tg mice treated with both memantine and 40 Hz light blinking (Fig. 97E, e.g., 848 ± 15 μM). The insular cortex became progressively thinner.
いくつかの実施形態に従うガンマ曝露及び/または投与は、ニューロンの数及び/またはDNAの損傷を保存及び/またはそれらに関する変化を減少させることが示された。例えば、ガンマ曝露は、対象の視覚野におけるCKp-25誘導性のニューロンの損失及びDNA損傷を低減した。 Gamma exposure and/or administration according to some embodiments has been shown to preserve and/or reduce changes in neuronal number and/or DNA damage. For example, gamma exposure reduced CKp-25-induced neuronal loss and DNA damage in the visual cortex of subjects.
図98は、CK対照マウス、未処理CK-p25Tgマウス、メマンチンで処理されたCK-p25Tgマウス、いくつかの実施形態に従って40Hzの光の点滅に曝露されたCK-p25Tgマウス、ならびにメマンチン及び40Hzの光の点滅の両方で処理されたCK-p25Tgマウスについて、CK対照マウスにおけるNeuN陽性細胞のパーセンテージとしてのNeuN陽性細胞の量を比較する棒グラフである。従って、CK対照マウスのNeuN陽性細胞のパーセンテージはCK対照マウスで100%であるが、未処理CK-p25Tgマウスで約80%しかなく、CK-p25Tgマウスモデルにおけるニューロンの損失を裏付ける。メマンチンでの処理は、未処理群と比較してCK-p25Tgマウスにおいていくらかのニューロンの損失を防止した。いくつかの実施形態に従う40Hzの光の点滅への曝露は、CK-p25Tgマウスにおいてほとんどのニューロンの損失を防止した。従って、図98は、いくつかの実施形態に従う40Hzの視覚の点滅処理がどのようにして視覚野のニューロンを保存することができるかを示す。しかしながら、メマンチン及び40Hzの光の点滅への曝露の組合せは、等しくニューロンの損失を防ぐことができなかった。 Figure 98 shows CK control mice, untreated CK-p25Tg mice, CK-p25Tg mice treated with memantine, CK-p25Tg mice exposed to 40 Hz light flashes according to some embodiments, and memantine and 40 Hz FIG. 4 is a bar graph comparing the amount of NeuN-positive cells as a percentage of NeuN-positive cells in CK control mice for CK-p25Tg mice treated with both flashing lights. Thus, the percentage of NeuN positive cells in CK control mice is 100% in CK control mice, but only about 80% in untreated CK-p25Tg mice, confirming neuronal loss in the CK-p25Tg mouse model. Treatment with memantine prevented some neuronal loss in CK-p25Tg mice compared to the untreated group. Exposure to 40 Hz light blinking according to some embodiments prevented most neuronal loss in CK-p25Tg mice. FIG. 98 thus illustrates how 40 Hz visual blinking processing according to some embodiments can preserve neurons in the visual cortex. However, the combination of memantine and exposure to 40 Hz light flashing was equally unable to prevent neuronal loss.
DNA二重鎖切断(DSB)は、真核細胞におけるDNA損傷の一例であり、ゲノムの不安定性を引き起こし、腫瘍形成及び恐らくは老化促進につながる。リン酸化ヒストンH2AX(γH2AX)をDSBに対する細胞応答のバイオマーカーとして用いた。図99は、CK対照マウス、未処理CK-p25Tgマウス、メマンチンで処理されたCK-p25Tgマウス、いくつかの実施形態に従って40Hzの光の点滅に曝露されたCK-p25Tgマウス、ならびにメマンチン及び40Hzの光の点滅の両方で処理されたCK-p25TgマウスにおけるγH2AX陽性細胞の量を比較する棒グラフである。γH2AXに対して陽性の細胞は、CK対照マウスではほとんど存在しなかったが、未処理CK-p25Tgマウスでは非常に多く、大量のDSB及び他のDNA損傷を示した。メマンチンでの処理は未処理群と比較して、CK-p25TgマウスにおけるγH2AX陽性細胞の量を低減した。いくつかの実施形態に従う40Hzの光の点滅への曝露は、CK-p25TgマウスにおけるγH2AX陽性細胞のさらに大きな減少をもたらした。従って、図99は、いくつかの実施形態に従う40Hzの視覚の点滅処理がどのようにして視覚野におけるDNA損傷を低減することができるかを示す。しかしながら、メマンチン及び40Hzの光の点滅への曝露の組合せは、CK-p25TgマウスにおけるγH2AX陽性細胞の数を有意に増大した。 DNA double-strand breaks (DSBs) are an example of DNA damage in eukaryotic cells, causing genomic instability, leading to tumorigenesis and possibly accelerated senescence. Phosphorylated histone H2AX (γH2AX) was used as a biomarker of cellular response to DSB. Figure 99 shows CK control mice, untreated CK-p25Tg mice, CK-p25Tg mice treated with memantine, CK-p25Tg mice exposed to 40 Hz light flashes according to some embodiments, and memantine and 40 Hz Bar graph comparing the amount of γH2AX positive cells in CK-p25Tg mice treated with both flashing lights. Cells positive for γH2AX were few in CK control mice, but numerous in untreated CK-p25Tg mice, indicating extensive DSBs and other DNA damage. Treatment with memantine reduced the amount of γH2AX positive cells in CK-p25Tg mice compared to the untreated group. Exposure to 40 Hz light blinking according to some embodiments resulted in even greater reduction of γH2AX positive cells in CK-p25Tg mice. FIG. 99 therefore illustrates how 40 Hz visual blinking treatment according to some embodiments can reduce DNA damage in the visual cortex. However, the combination of memantine and exposure to 40 Hz blinking light significantly increased the number of γH2AX positive cells in CK-p25Tg mice.
図100は、Hoechst染色(皮質細胞を示す)、緑色蛍光タンパク質もしくはGFP(CK-p25を示す)、γH2AX(DSBを示す)、またはNeuN(ニューロンを示す)で標識した各群における対象の代表的な視覚野の試料を示す一連の画像である。 Figure 100 shows representative subjects in each group labeled with Hoechst staining (indicating cortical cells), Green Fluorescent Protein or GFP (indicating CK-p25), γH2AX (indicating DSBs), or NeuN (indicating neurons). 1 is a series of images showing a sample of a normal visual cortex.
ガンマ曝露はまた、対象の体性感覚皮質におけるCKp-25誘導性のニューロン損失及びDNA損傷も低減した。図101は、CK対照マウス、未処理CK-p25Tgマウス、メマンチンで処理されたCK-p25Tgマウス、いくつかの実施形態に従って40Hzの光の点滅に曝露されたCK-p25Tgマウス、ならびにメマンチン及び40Hzの光の点滅の両方で処理されたCK-p25Tgマウスについて、CK対照マウスにおけるNeuN陽性細胞のパーセンテージとしてのNeuN陽性細胞の量を比較する棒グラフである。従って、CK対照マウスのNeuN陽性細胞のパーセンテージは、CK対照マウスで100%であるが、未処理CK-p25Tgマウスではより80%に近く、CK-p25Tgマウスモデルにおけるニューロンの損失を裏付ける。CK-p25Tgマウスにおいてほとんどのニューロンの損失を防いだ40Hzの光の点滅への曝露との組合せ以外は、メマンチンでの処理は、未処理群と比較してCK-p25Tgマウスにおいてニューロンの損失を防止できなかった。従って、図101は、いくつかの実施形態に従う40Hzの視覚の点滅処理がどのようにして体性感覚皮質のニューロンを保存することができるかを示す。 Gamma exposure also reduced CKp-25-induced neuronal loss and DNA damage in the subject's somatosensory cortex. FIG. 101 shows CK control mice, untreated CK-p25Tg mice, CK-p25Tg mice treated with memantine, CK-p25Tg mice exposed to 40 Hz light blinks according to some embodiments, and memantine and 40 Hz FIG. 4 is a bar graph comparing the amount of NeuN-positive cells as a percentage of NeuN-positive cells in CK control mice for CK-p25Tg mice treated with both flashing lights. Thus, the percentage of NeuN positive cells in CK control mice is 100% in CK control mice but closer to 80% in untreated CK-p25Tg mice, confirming neuronal loss in the CK-p25Tg mouse model. Treatment with memantine prevented neuron loss in CK-p25Tg mice compared to the untreated group, except in combination with exposure to 40 Hz light blinking, which prevented most neuron loss in CK-p25Tg mice. could not. FIG. 101 thus illustrates how 40 Hz visual blinking processing according to some embodiments can preserve neurons of the somatosensory cortex.
図102は、CK対照マウス、未処理CK-p25Tgマウス、メマンチンで処理されたCK-p25Tgマウス、いくつかの実施形態に従って40Hzの光の点滅に曝露されたCK-p25Tgマウス、ならびにメマンチン及び40Hzの光の点滅の両方で処理されたCK-p25TgマウスにおけるγH2AX陽性細胞の量を比較する棒グラフである。γH2AXに対して陽性の細胞は、CK対照マウスでは存在しなかったが、未処理CK-p25Tgマウスでは非常に多く、大量のDSB及び他のDNA損傷を示した。メマンチンでの処理は未処理群と比較して、CK-p25TgマウスにおけるγH2AX陽性細胞の量を低減した。いくつかの実施形態に従う40Hzの光の点滅への曝露は、CK-p25TgマウスにおけるγH2AX陽性細胞のさらに大きな減少をもたらした。従って、図102は、いくつかの実施形態に従う40Hzの視覚の点滅処理がどのようにして体性感覚皮質におけるDNA損傷を低減することができるかを示す。しかしながら、メマンチン及び40Hzの光の点滅への曝露の組合せは、CK-p25TgマウスにおけるγH2AX陽性細胞の数を有意に増大した。 FIG. 102 shows CK control mice, untreated CK-p25Tg mice, CK-p25Tg mice treated with memantine, CK-p25Tg mice exposed to 40 Hz light blinks according to some embodiments, and memantine and 40 Hz Bar graph comparing the amount of γH2AX positive cells in CK-p25Tg mice treated with both flashing lights. Cells positive for γH2AX were absent in CK control mice but were numerous in untreated CK-p25Tg mice, indicating extensive DSBs and other DNA damage. Treatment with memantine reduced the amount of γH2AX positive cells in CK-p25Tg mice compared to the untreated group. Exposure to 40 Hz light blinking according to some embodiments resulted in even greater reduction of γH2AX positive cells in CK-p25Tg mice. FIG. 102 thus illustrates how 40 Hz visual blinking treatment according to some embodiments can reduce DNA damage in the somatosensory cortex. However, the combination of memantine and exposure to 40 Hz blinking light significantly increased the number of γH2AX positive cells in CK-p25Tg mice.
図103は、NeuN(ニューロンを示す)、γH2AX(DSBを示す)、GFP(CK-p25を示す)、及び/またはHoechst染色(皮質細胞を示す)で標識された各群における対象の代表的な体性感覚皮質の試料を示す一連の画像である。 Figure 103 shows representative subjects in each group labeled with NeuN (indicating neurons), γH2AX (indicating DSBs), GFP (indicating CK-p25), and/or Hoechst staining (indicating cortical cells). 4 is a series of images showing a sample of somatosensory cortex.
ガンマ曝露はまた、対象の島皮質におけるCKp-25誘導性のニューロン損失及びDNA損傷も低減した。図104は、CK対照マウス、未処理CK-p25Tgマウス、メマンチンで処理されたCK-p25Tgマウス、いくつかの実施形態に従って40Hzの光の点滅に曝露されたCK-p25Tgマウス、ならびにメマンチン及び40Hzの光の点滅の両方で処理されたCK-p25Tgマウスについて、CK対照マウスにおけるNeuN陽性細胞のパーセンテージとしてのNeuN陽性細胞の量を比較する棒グラフである。従って、CK対照マウスのNeuN陽性細胞のパーセンテージは、CK対照マウスで100%であるが、未処理CK-p25Tgマウスではより80%に近く、CK-p25Tgマウスモデルにおけるニューロンの損失を裏付ける。CK-p25Tgマウスにおいてニューロンの損失の防止が最小であった40Hzの光の点滅への曝露との組合せ以外は、メマンチンでの処理は、未処理群と比較してCK-p25Tgマウスにおいていくらかのニューロンの損失を防止した。従って、図104は、いくつかの実施形態に従う40Hzの視覚の点滅処理がどのようにして島皮質のニューロンを保存することができるかを示す。 Gamma exposure also reduced CKp-25-induced neuronal loss and DNA damage in the insular cortex of subjects. FIG. 104 shows CK control mice, untreated CK-p25Tg mice, CK-p25Tg mice treated with memantine, CK-p25Tg mice exposed to 40 Hz light blinks according to some embodiments, and memantine and 40 Hz FIG. 4 is a bar graph comparing the amount of NeuN-positive cells as a percentage of NeuN-positive cells in CK control mice for CK-p25Tg mice treated with both flashing lights. Thus, the percentage of NeuN positive cells in CK control mice is 100% in CK control mice but closer to 80% in untreated CK-p25Tg mice, confirming neuronal loss in the CK-p25Tg mouse model. Treatment with memantine reduced some neurons in CK-p25Tg mice compared to the untreated group, except in combination with exposure to 40 Hz light flashing, which minimally prevented neuronal loss in CK-p25Tg mice. prevented the loss of Thus, FIG. 104 illustrates how 40 Hz visual blinking processing according to some embodiments can preserve neurons in the insular cortex.
図105は、CK対照マウス、未処理CK-p25Tgマウス、メマンチンで処理されたCK-p25Tgマウス、いくつかの実施形態に従って40Hzの光の点滅に曝露されたCK-p25Tgマウス、ならびにメマンチン及び40Hzの光の点滅の両方で処理されたCK-p25TgマウスにおけるγH2AX陽性細胞の量を比較する棒グラフである。γH2AXに対して陽性の細胞は、CK対照マウスでは存在しなかったが、未処理CK-p25Tgマウスでは非常に多く、大量のDSB及び他のDNA損傷を示した。メマンチンでの処理は未処理群と比較して、CK-p25TgマウスにおけるγH2AX陽性細胞の量を低減した。いくつかの実施形態に従う40Hzの光の点滅への曝露は、CK-p25TgマウスにおけるγH2AX陽性細胞に同様の減少をもたらした。従って、図105は、いくつかの実施形態に従う40Hzの視覚の点滅処理がどのようにして島皮質におけるDNA損傷を低減することができるかを示す。しかしながら、メマンチン及び40Hzの光の点滅への曝露の組合せは、CK-p25TgマウスにおけるγH2AX陽性細胞の数を有意に増大した。 FIG. 105 shows CK control mice, untreated CK-p25Tg mice, CK-p25Tg mice treated with memantine, CK-p25Tg mice exposed to 40 Hz light blinks according to some embodiments, and memantine and 40 Hz Bar graph comparing the amount of γH2AX positive cells in CK-p25Tg mice treated with both flashing lights. Cells positive for γH2AX were absent in CK control mice but were numerous in untreated CK-p25Tg mice, indicating extensive DSBs and other DNA damage. Treatment with memantine reduced the amount of γH2AX positive cells in CK-p25Tg mice compared to the untreated group. Exposure to 40 Hz light blinking according to some embodiments resulted in a similar reduction in γH2AX positive cells in CK-p25Tg mice. FIG. 105 therefore illustrates how 40 Hz visual blinking treatment according to some embodiments can reduce DNA damage in the insular cortex. However, the combination of memantine and exposure to 40 Hz blinking light significantly increased the number of γH2AX positive cells in CK-p25Tg mice.
図106は、NeuN(ニューロンを示す)、γH2AX(DSBを示す)、GFP(CK-p25を示す)、またはHoechst染色(皮質細胞を示す)で標識された各群における対象の代表的な島皮質の試料を示す一連の画像である。 Figure 106. Representative insula cortices of subjects in each group labeled with NeuN (indicating neurons), γH2AX (indicating DSBs), GFP (indicating CK-p25), or Hoechst staining (indicating cortical cells). 1 is a series of images showing a sample of .
ガンマ曝露はまた、対象の海馬におけるCKp-25誘導性のニューロン損失及びDNA損傷も低減した。図107は、CK対照マウス、未処理CK-p25Tgマウス、メマンチンで処理されたCK-p25Tgマウス、いくつかの実施形態に従って40Hzの光の点滅に曝露されたCK-p25Tgマウス、ならびにメマンチン及び40Hzの光の点滅の両方で処理されたCK-p25Tgマウスについて、CK対照マウスにおけるNeuN陽性細胞のパーセンテージとしてのNeuN陽性細胞の量を比較する棒グラフである。従って、CK対照マウスのNeuN陽性細胞のパーセンテージは、CK対照マウスで100%であるが、未処理CK-p25Tgマウスではより80%に近く、CK-p25Tgマウスモデルにおけるニューロンの損失を裏付ける。40Hzの光の点滅への曝露の有無にかかわらず、メマンチンでの処理は、CK-p25Tgマウスにおいてニューロンの損失の防止が最小であった未処理群と比較して、CK-p25Tgマウスにおいていくらかのニューロンの損失を防止した。従って、図107は、いくつかの実施形態に従う40Hzの視覚の点滅処理がどのようにして海馬のニューロンを保存することができるかを示す。 Gamma exposure also reduced CKp-25-induced neuronal loss and DNA damage in the hippocampus of subjects. FIG. 107 shows CK control mice, untreated CK-p25Tg mice, CK-p25Tg mice treated with memantine, CK-p25Tg mice exposed to 40 Hz light blinks according to some embodiments, and memantine and 40 Hz FIG. 4 is a bar graph comparing the amount of NeuN-positive cells as a percentage of NeuN-positive cells in CK control mice for CK-p25Tg mice treated with both flashing lights. Thus, the percentage of NeuN positive cells in CK control mice is 100% in CK control mice but closer to 80% in untreated CK-p25Tg mice, confirming neuronal loss in the CK-p25Tg mouse model. Treatment with memantine, with or without exposure to 40 Hz light blinking, had some effect in CK-p25Tg mice compared to the untreated group, which minimally prevented neuronal loss in CK-p25Tg mice. Prevented loss of neurons. Thus, FIG. 107 illustrates how 40 Hz visual blink processing according to some embodiments can preserve hippocampal neurons.
図108は、CK対照マウス、未処理CK-p25Tgマウス、メマンチンで処理されたCK-p25Tgマウス、いくつかの実施形態に従って40Hzの光の点滅に曝露されたCK-p25Tgマウス、ならびにメマンチン及び40Hzの光の点滅の両方で処理されたCK-p25TgマウスにおけるγH2AX陽性細胞の量を比較する棒グラフである。γH2AXに対して陽性の細胞は、CK対照マウスでは存在しなかったが、未処理CK-p25Tgマウスでは非常に多く、大量のDSB及び他のDNA損傷を示した。メマンチンでの処理は未処理群と比較して、CK-p25TgマウスにおけるγH2AX陽性細胞の量を低減した。いくつかの実施形態に従う40Hzの光の点滅への曝露は、CK-p25TgマウスにおけるγH2AX陽性細胞のより良好な減少をもたらした。従って、図108は、いくつかの実施形態に従う40Hzの視覚の点滅処理がどのようにして海馬におけるDNA損傷を低減することができるかを示す。しかしながら、メマンチン及び40Hzの光の点滅への曝露の組合せは、CK-p25TgマウスにおけるγH2AX陽性細胞の数を有意に増大した。 FIG. 108 shows CK control mice, untreated CK-p25Tg mice, CK-p25Tg mice treated with memantine, CK-p25Tg mice exposed to 40 Hz light blinks according to some embodiments, and memantine and 40 Hz Bar graph comparing the amount of γH2AX positive cells in CK-p25Tg mice treated with both flashing lights. Cells positive for γH2AX were absent in CK control mice but were numerous in untreated CK-p25Tg mice, indicating extensive DSBs and other DNA damage. Treatment with memantine reduced the amount of γH2AX positive cells in CK-p25Tg mice compared to the untreated group. Exposure to 40 Hz light blinking according to some embodiments resulted in better reduction of γH2AX positive cells in CK-p25Tg mice. FIG. 108 therefore illustrates how 40 Hz visual blinking treatment according to some embodiments can reduce DNA damage in the hippocampus. However, the combination of memantine and exposure to 40 Hz blinking light significantly increased the number of γH2AX positive cells in CK-p25Tg mice.
図109は、Hoechst染色(皮質細胞を示す)、GFP(CK-p25を示す)、γH2AX(DSBを示す)、またはNeuN(ニューロンを示す)で標識した各群における対象の代表的な海馬の試料を示す一連の画像である。 Figure 109. Representative hippocampal samples of subjects in each group labeled with Hoechst staining (indicating cortical cells), GFP (indicating CK-p25), γH2AX (indicating DSB), or NeuN (indicating neurons). is a series of images showing
いくつかの実施形態に従うガンマ曝露及び/または投与は、シナプスを保存すること及び/またはシナプスの損失を低減することを示した。シナプス接続の変化は、グルタミン酸作動性シナプス(例えば、VGluT1、VGluT2、PSD95、及びGluR2)ならびにGABA作動性シナプス(例えば、GAD及びVGAT)に特異的なマーカーを用いて定量化され得る。 Gamma exposure and/or administration according to some embodiments has been shown to preserve synapses and/or reduce synaptic loss. Changes in synaptic connectivity can be quantified using markers specific for glutamatergic synapses (eg, VGluT1, VGluT2, PSD95, and GluR2) and GABAergic synapses (eg, GAD and VGAT).
例えば、ガンマ曝露は、対象の視覚野におけるCKp-25誘導性のシナプス損失を低減した。図110は、CK対照マウス、未処理CK-p25Tgマウス、メマンチンで処理されたCK-p25Tgマウス、いくつかの実施形態に従って40Hzの光の点滅に曝露されたCK-p25Tgマウス、ならびにメマンチン及び40Hzの光の点滅の両方で処理されたCK-p25Tgマウスについて、ベースラインのCK対照マウスのシナプスの点密度のパーセンテージとしてのグルタミン酸作動性シナプス(VGluT1を用いて)及びGABA作動性シナプス(GAD65を用いて)の点密度を比較する棒グラフである。 For example, gamma exposure reduced CKp-25-induced synaptic loss in the visual cortex of subjects. FIG. 110 shows CK control mice, untreated CK-p25Tg mice, CK-p25Tg mice treated with memantine, CK-p25Tg mice exposed to 40 Hz light blinks according to some embodiments, and memantine and 40 Hz Glutamatergic synapses (using VGluT1) and GABAergic synapses (using GAD65) as a percentage of the synaptic dot density of baseline CK control mice for CK-p25Tg mice treated with both light blinking. ) is a bar graph comparing the point densities of .
ガンマ曝露はまた、対象の体性感覚皮質におけるCKp-25誘導性のシナプスの損失を低減しただけでなく、シナプスの点密度を増大さえした。図111は、CK対照マウス、未処理CK-p25Tgマウス、メマンチンで処理されたCK-p25Tgマウス、いくつかの実施形態に従って40Hzの光の点滅に曝露されたCK-p25Tgマウス、ならびにメマンチン及び40Hzの光の点滅の両方で処理されたCK-p25Tgマウスについて、ベースラインのCK対照マウスのシナプスの点密度のパーセンテージとしてのグルタミン酸作動性シナプス(VGluT1を用いて)及びGABA作動性シナプス(GAD65を用いて)の点密度を比較する棒グラフである。 Gamma exposure also not only reduced CKp-25-induced synaptic loss in the subject's somatosensory cortex, but even increased synaptic dot density. FIG. 111 shows CK control mice, untreated CK-p25Tg mice, CK-p25Tg mice treated with memantine, CK-p25Tg mice exposed to 40 Hz light flashes according to some embodiments, and memantine and 40 Hz Glutamatergic synapses (using VGluT1) and GABAergic synapses (using GAD65) as a percentage of the synaptic dot density of baseline CK control mice for CK-p25Tg mice treated with both light blinking. ) is a bar graph comparing the point densities of .
ガンマ曝露は、対象の島皮質におけるCKp-25誘導性のシナプス損失を低減した。図112は、CK対照マウス、未処理CK-p25Tgマウス、メマンチンで処理されたCK-p25Tgマウス、いくつかの実施形態に従って40Hzの光の点滅に曝露されたCK-p25Tgマウス、ならびにメマンチン及び40Hzの光の点滅の両方で処理されたCK-p25Tgマウスについて、CK対照マウスにおけるベースラインのシナプスの点密度のパーセンテージとしてのグルタミン酸作動性シナプス(VGluT1を用いて)及びGABA作動性シナプス(GAD65を用いて)の点密度を比較する棒グラフである。 Gamma exposure reduced CKp-25-induced synaptic loss in the insular cortex of subjects. FIG. 112 shows CK control mice, untreated CK-p25Tg mice, CK-p25Tg mice treated with memantine, CK-p25Tg mice exposed to 40 Hz light blinks according to some embodiments, and memantine and 40 Hz Glutamatergic synapses (using VGluT1) and GABAergic synapses (using GAD65) as a percentage of baseline synaptic dot density in CK control mice for CK-p25Tg mice treated with both light blinking ) is a bar graph comparing the point densities of .
図113Aは、Hoechst染色(皮質細胞を示す)による代表的な試料を示す画像である。図113Bは、この代表的な試料におけるVGluT1(グルタミン酸作動性シナプスを示す)を示す画像である。図113Cは、この代表的な試料におけるGAD65(GABA作動性シナプスを示す)を示す画像である。図113Dは、この代表的な試料におけるHoechst染色、VGluT1、及びGAD65を示す統合した画像である。図113E及び113Fは、GAD65を用いた点の定量化方法を示す。図113Eは、図113Cから変換されたGAD65の二値画像である。図113Fに示すように、ImageJソフトウェア(米国国立衛生研究所、メリーランド州ベセスダより入手可能)を用いて、二値画像を定量化した。 FIG. 113A is an image showing a representative sample with Hoechst staining (showing cortical cells). FIG. 113B is an image showing VGluT1 (indicative of glutamatergic synapses) in this representative sample. FIG. 113C is an image showing GAD65 (indicative of GABAergic synapses) in this representative sample. FIG. 113D is a merged image showing Hoechst staining, VGluT1, and GAD65 in this representative sample. Figures 113E and 113F show the point quantification method using GAD65. FIG. 113E is a binary image of GAD65 transformed from FIG. 113C. Binary images were quantified using ImageJ software (available from the National Institutes of Health, Bethesda, Md.), as shown in FIG. 113F.
いくつかの実施形態に従うガンマ曝露及び/または投与が脳血管系に影響を与えるかどうかを調べるための試験を実施した。マウスを暗箱に入れ、40Hzの発光ダイオード(LED)の点滅、または恒明オフ(暗)のいずれかに1時間曝露した。刺激後、マウスをサクリファイスし、かん流させた。脳切片をフルオロフォアに結合したレクチンで染色し、血管を蛍光標識した。共焦点像を用いて、脈管構造のサイズ(すなわち、血管径)の変化を測定した。40HzのLED点滅の1時間後、血管拡張が認められた。 A study was conducted to determine whether gamma exposure and/or administration according to some embodiments affects the cerebral vasculature. Mice were placed in a dark box and exposed to either blinking 40 Hz light emitting diodes (LEDs) or constant light off (dark) for 1 hour. After stimulation, mice were sacrificed and perfused. Brain sections were stained with fluorophore-conjugated lectins to fluorescently label blood vessels. Confocal imaging was used to measure changes in vasculature size (ie, vessel diameter). Vasodilation was noted 1 hour after 40 Hz LED blinking.
図128Aは、いくつかの実施形態に従って、視覚野における拡大した脈管構造を示す一連の代表的な免疫蛍光画像である。図128Bは、視覚野における血管径を示し、いくつかの実施形態に従うガンマ曝露後の血管径の増大を示す棒グラフである。 FIG. 128A is a series of representative immunofluorescence images showing enlarged vasculature in the visual cortex, according to some embodiments. FIG. 128B is a bar graph showing vessel diameter in the visual cortex, showing an increase in vessel diameter after gamma exposure, according to some embodiments.
従って、ガンマ曝露及び/または投与は、解剖学的(例えば、脳重量の減量及び脈管構造の拡大の予防及び/または低減)、形態学(例えば、異常な脳室の拡張及び皮層の厚さの損失の予防及び/または低減)、細胞的(例えば、ニューロンの損失の予防及び/または低減)、ならびに分子的(例えば、DNA損傷及びシナプスの損失の予防及び/または低減)利益を与えることが示された。 Thus, gamma exposure and/or administration may affect anatomical (e.g., loss of brain weight and prevention and/or reduction of vasculature expansion), morphologic (e.g., abnormal ventricular dilation and cortical thickness). (e.g., prevention and/or reduction of loss of neurons), cellular (e.g., prevention and/or reduction of loss of neurons), and molecular (e.g., prevention and/or reduction of DNA damage and synaptic loss) benefits. shown.
さらに、ガンマ曝露及び/または投与には、神経保護作用があることが示された。ガンマ処理の後、CK-p25Tgマウスモデル、すなわち、さもなければAβペプチドレベルの上昇、顕著なニューロンの損失、DNA損傷、シナプスの損失、タウの高リン酸化、長期増強不全、及び重度の認知/記憶障害を示すモデルは、相対的なニューロン構造及び/または機能の保存(例えば、疾患の程度の維持/予防及び/または疾患進行の緩和/減退)を示し、いくつかの場合には、ニューロン構造及び/または機能の改善を示唆した。 Additionally, gamma exposure and/or administration has been shown to be neuroprotective. After gamma treatment, the CK-p25Tg mouse model, namely, otherwise elevated Aβ peptide levels, marked neuronal loss, DNA damage, synaptic loss, tau hyperphosphorylation, long-term potentiation failure, and severe cognition/ Models indicative of memory impairment show preservation of relative neuronal structure and/or function (e.g., maintenance/prevention of disease extent and/or mitigation/reduction of disease progression), and in some cases neuronal structure and/or suggested improved function.
ガンマ周波数での聴覚刺激は、対象のミクログリアの変化を非侵襲的に誘導した。
いくつかの実施形態では、ガンマ曝露及び/または投与は、聴覚刺激を含む。聴覚刺激は音波パルスまたはクリックを含み得る。音刺激は、1秒当たり約35回の音波パルスまたはクリック(クリック/秒)から約45クリック/秒のクリック・トレインを含み得る。図114は、いくつかの実施形態に従って、クリック・トレイン刺激を示す刺激図である。図114の刺激は、各クリック間が25ミリ秒でクリック頻度40クリック/秒を有し、各クリックが持続時間1ミリ秒を有する。
Auditory stimulation at gamma frequencies non-invasively induced microglial changes in subjects.
In some embodiments, gamma exposure and/or administration comprises auditory stimulation. Auditory stimuli may include sound pulses or clicks. Sound stimuli may include about 35 sound pulses or clicks per second (clicks/second) to about 45 clicks/second click trains. FIG. 114 is a stimulus diagram showing a click train stimulus, according to some embodiments. The stimulus in FIG. 114 has a click frequency of 40 clicks/sec with 25 ms between each click and each click has a duration of 1 ms.
いくつかの実施形態では、音刺激は、周波数約10Hz~約100kHz、約12Hz~約28kHz、約20Hz~約20kHz、及び/または約2kHz~約5kHzを有する。例えば、クリック・トレインの各音波パルスまたはクリックは、周波数約10kHzを有し得る。 In some embodiments, the sound stimuli have frequencies from about 10 Hz to about 100 kHz, from about 12 Hz to about 28 kHz, from about 20 Hz to about 20 kHz, and/or from about 2 kHz to about 5 kHz. For example, each sound pulse or click in a click train may have a frequency of approximately 10 kHz.
いくつかの実施形態では、音刺激は、音圧レベル約0dB~約85dB、約30dB~約70dB、及び/または約60dB~約65dBを有する。例えば、クリック・トレインの各音波パルスまたはクリックは、音圧レベル約65dBを有し得る。 In some embodiments, the sound stimulus has a sound pressure level of about 0 dB to about 85 dB, about 30 dB to about 70 dB, and/or about 60 dB to about 65 dB. For example, each sound pulse or click in a click train may have a sound pressure level of approximately 65 dB.
聴覚ガンマ刺激は、いくつかの実施形態に従って、対象のミクログリアの細胞状態の変化を誘導することが示された。いくつかの実施形態に従って、聴覚ガンマ曝露及び/または投与が対象の聴覚野におけるミクログリアの活性化を誘導するかどうかを調べるための試験を実施した。図114と同様の40Hzのクリック・トレイン刺激を用いた。この刺激は、クリック頻度約40クリック/秒を有し、各クリックはトーン約10kHz及び約60~65dBで約1ミリ秒の持続時間を有する。このクリック・トレイン刺激は、聴覚野におけるPV+介在ニューロンに同調し、それにより、聴覚野でガンマ振動を外因的に調節すると仮定された。 Auditory gamma stimulation has been shown to induce changes in the cellular state of microglia in subjects, according to some embodiments. In accordance with some embodiments, studies were conducted to determine whether auditory gamma exposure and/or administration induces activation of microglia in the auditory cortex of subjects. A 40 Hz click train stimulus similar to Figure 114 was used. This stimulus has a click frequency of about 40 clicks/second, with each click having a duration of about 1 millisecond with a tone of about 10 kHz and about 60-65 dB. This click train stimulus was hypothesized to entrain PV+ interneurons in the auditory cortex, thereby exogenously modulating gamma oscillations in the auditory cortex.
図115は、本試験を示す流れ図である。図115では、WTマウスをそれらのホームケージ11500に収容した。1日1時間、連続7日間(1~7日目)、これらマウスを行動箱(すなわち、防音室)11502に移動させた。行動箱11502の中で、第1群のマウスを静寂に曝露し、第2群のマウスをいくつかの実施形態に従ってクリック・トレイン刺激に曝露した。行動箱11502での毎時間後にマウスをそれらのホームケージ11500に戻した。8日目、これらマウスを組織の採取と染色11504のためにサクリファイスした。
FIG. 115 is a flow diagram showing this test. In FIG. 115, WT mice were housed in their
この組織を、ミクログリア細胞のレベル、ミクログリア細胞の形態学的変化、及び細胞サイズで示されるミクログリア活性化について調べた。図116Aは、クリック・トレイン刺激(刺激)に曝露されたマウスと比較した、静寂(無刺激)に曝露されたマウスにおけるミクログリアの平均数を示す棒グラフである。いくつかの実施形態に従って、クリック・トレイン刺激に曝露されたマウスで、より多くのミクログリア細胞が認められた。図116Bは、クリック・トレイン刺激(刺激)に曝露されたマウスと比較した、静寂(無刺激)に曝露されたマウスにおけるミクログリアの突起の長さの平均比を示す棒グラフである。ミクログリアの突起の長さの平均比は、いくつかの実施形態に従って、クリック・トレイン刺激に曝露されたマウスで有意に低かった。図116Cは、クリック・トレイン刺激(刺激)に曝露されたマウスと比較した、静寂(無刺激)に曝露されたマウスにおけるミクログリアの細胞サイズの平均比を示す棒グラフである。ミクログリアの細胞サイズの平均比は、クリック・トレイン刺激に曝露されたマウスにおいて有意に高く、いくつかの実施形態に従うより高いミクログリアの活性化を示した。 The tissue was examined for levels of microglial cells, morphological changes in microglial cells, and microglial activation as indicated by cell size. FIG. 116A is a bar graph showing the mean number of microglia in mice exposed to silence (no stimulation) compared to mice exposed to click train stimulation (stimulation). According to some embodiments, more microglial cells were found in mice exposed to click train stimulation. FIG. 116B is a bar graph showing the average ratio of microglial process lengths in mice exposed to silence (no stimulation) compared to mice exposed to click train stimulation (stimulation). The average ratio of microglial process lengths was significantly lower in mice exposed to click train stimulation, according to some embodiments. FIG. 116C is a bar graph showing the average ratio of microglial cell size in mice exposed to silence (no stimulation) compared to mice exposed to click train stimulation (stimulation). The average ratio of microglial cell size was significantly higher in mice exposed to click train stimulation, indicating higher microglial activation according to some embodiments.
図117Aは、静寂に曝露されたマウスにおけるミクログリア細胞の代表的な画像である。図117Bは、いくつかの実施形態に従って、クリック・トレイン刺激に曝露されたマウスにおけるミクログリア細胞の代表的な画像である。ミクログリアの突起及び細胞は、図117Aといくつかの実施形態に従う117Bの間で明らかに異なる。図118Aは、いくつかの実施形態に従って、クリック・トレイン刺激に曝露されたマウスからのミクログリア細胞の図117Bからの拡大画像である。ミクログリア細胞の1つの突起11800が強調表示されている。一方、図118Bは、静寂に曝露されたマウスからのミクログリア細胞の図117Aからの拡大画像である。ミクログリア細胞の1つの突起11802を強調表示し、いくつかの実施形態に従ってクリック・トレイン刺激に曝露されたマウスからのミクログリア細胞の比較的短い突起11800に対するその長さを示している。
FIG. 117A is a representative image of microglial cells in mice exposed to silence. FIG. 117B is a representative image of microglial cells in mice exposed to click train stimulation, according to some embodiments. Microglial processes and cells are clearly different between FIG. 117A and 117B according to some embodiments. FIG. 118A is a magnified image from FIG. 117B of microglial cells from a mouse exposed to click train stimulation, according to some embodiments. One
図119Aは、いくつかの実施形態に従って、クリック・トレイン刺激に曝露されたマウスからのミクログリア細胞の図117Bからの拡大画像である。このミクログリア細胞の細胞11900の場所が強調表示されている。一方、図119Bは、静寂に曝露されたマウスからのミクログリア細胞の図117Aからの拡大画像である。このミクログリア細胞の細胞11902の場所を強調表示して、クリック・トレイン刺激に曝露されたマウスからのミクログリア細胞の比較的大きい細胞11900に対するそのサイズを示し、ひいては、いくつかの実施形態に従うより高いミクログリア活性化を示している。
FIG. 119A is a magnified image from FIG. 117B of microglial cells from a mouse exposed to click train stimulation, according to some embodiments. The location of
聴覚ガンマ刺激は、いくつかの実施形態によれば、対象においてミクログリア活性化様表現型を誘導することが示された。図115の試験を、いくつかの実施形態に従って、5XFAD Tgマウスで繰り返した。この組織を、ミクログリア細胞のレベル、ミクログリア細胞の形態学的変化(例えば、突起の長さ)、及びミクログリア活性化(例えば、細胞サイズで示される)について調べた。図120Aは、クリック・トレイン刺激(刺激)に曝露されたマウスと比較した、静寂(無刺激)に曝露されたマウスにおける画像フィールド当たりの平均ミクログリア数を示す棒グラフである。いくつかの実施形態に従ってクリック・トレイン刺激に曝露されたマウスに有意に多くのミクログリア細胞が認められた。図120Bは、クリック・トレイン刺激(刺激)に曝露されたマウスと比較した、静寂(無刺激)に曝露されたマウスにおけるミクログリアの細胞サイズの平均比を示す棒グラフである。この細胞サイズの平均比は、クリック・トレイン刺激に曝露されたマウスで有意に高く、いくつかの実施形態に従って、より大きなミクログリア活性を示した。図120Cは、クリック・トレイン刺激(刺激)に曝露されたマウスと比較した、静寂(無刺激)に曝露されたマウスにおけるミクログリアの突起の長さの平均比を示す棒グラフである。この突起の長さの平均比は、いくつかの実施形態に従ってクリック・トレイン刺激に曝露されたマウスにおいて有意に低かった。 Auditory gamma stimulation has been shown to induce a microglial activation-like phenotype in subjects, according to some embodiments. The study of Figure 115 was repeated in 5XFAD Tg mice, according to some embodiments. The tissue was examined for microglial cell levels, microglial cell morphological changes (eg, process length), and microglial activation (eg, as indicated by cell size). FIG. 120A is a bar graph showing the average number of microglia per image field in mice exposed to silence (no stimulation) compared to mice exposed to click train stimulation (stimulation). Significantly more microglial cells were found in mice exposed to click train stimulation according to some embodiments. FIG. 120B is a bar graph showing the average ratio of microglial cell size in mice exposed to silence (no stimulation) compared to mice exposed to click train stimulation (stimulation). This average ratio of cell sizes was significantly higher in mice exposed to click train stimulation, indicating greater microglial activity, according to some embodiments. FIG. 120C is a bar graph showing the average ratio of microglial process lengths in mice exposed to silence (no stimulation) compared to mice exposed to click train stimulation (stimulation). The average ratio of this process length was significantly lower in mice exposed to click train stimulation according to some embodiments.
図121Aは、静寂に曝露されたマウスにおけるミクログリア細胞の代表的な画像である。図121Bは、いくつかの実施形態に従ってクリック・トレイン刺激に曝露されたマウスにおけるミクログリア細胞の代表的な画像である。このミクログリアの突起及び細胞は、図121Aと図121B間で明らかに異なり、いくつかの実施形態に従ってクリック・トレイン刺激に曝露されたマウスからのミクログリアにおいて相対的に突起の長さが短く、細胞サイズが大きい。 FIG. 121A is a representative image of microglial cells in mice exposed to silence. FIG. 121B is a representative image of microglial cells in mice exposed to click train stimulation according to some embodiments. The microglial processes and cells are distinctly different between FIGS. 121A and 121B, with relatively shorter process lengths and cell size differences in microglia from mice exposed to click train stimulation according to some embodiments. is large.
ガンマ周波数での聴覚刺激は、対象の聴覚野及び海馬においてAβを非侵襲的に低減する。
聴覚ガンマ刺激は、いくつかの実施形態によれば、対象のAβのレベルを減少させることが示された。図115の試験を、いくつかの実施形態に従って、6か月齢の5XFAD Tgマウスで繰り返した。8日目、この聴覚野及び海馬を切断した。ELISAを用いて、アイソフォームAβ1-40ペプチド及びアイソフォームAβ1-42ペプチドを含む可溶性及び不溶性のAβアイソフォームのレベルを測定した。不溶性のAβは、5MのグアニジンHClで3時間処理し、斑を可溶化した。
Auditory stimulation at gamma frequencies non-invasively reduces Aβ in the auditory cortex and hippocampus of subjects.
Auditory gamma stimulation has been shown to reduce levels of Aβ in subjects, according to some embodiments. The studies in Figure 115 were repeated in 6-month-old 5XFAD Tg mice, according to some embodiments. On
聴覚ガンマ刺激は、いくつかの実施形態によれば、対象の可溶性Aβのレベルを減少させることが示された。図122Aは、いくつかの実施形態に従って、静寂(無刺激)に曝露されたマウスの聴覚野における可溶性アイソフォームAβ1-42ペプチドのレベルに対して、クリック・トレイン刺激(刺激)に曝露されたマウスの聴覚野におけるはるかに小さいレベルの可溶性アイソフォームAβ1-42ペプチドを示す棒グラフである。 Auditory gamma stimulation has been shown to reduce levels of soluble Aβ in subjects, according to some embodiments. FIG. 122A shows levels of soluble isoform Aβ 1-42 peptide in the auditory cortex of mice exposed to silence (no stimulation) versus click train stimulation (stimulation), according to some embodiments. Bar graph showing much lower levels of soluble isoform Aβ 1-42 peptide in mouse auditory cortex.
図122Bは、いくつかの実施形態に従って、静寂(無刺激)に曝露されたマウスの聴覚野における可溶性アイソフォームAβ1-40ペプチドのレベルに対して、クリック・トレイン刺激(刺激)に曝露されたマウスの聴覚野における小さいレベルの可溶性アイソフォームAβ1-40ペプチドを示す棒グラフである。 FIG. 122B shows levels of soluble isoform Aβ 1-40 peptide in the auditory cortex of mice exposed to silence (no stimulation) versus click train stimulation (stimulation), according to some embodiments. 1 is a bar graph showing small levels of soluble isoform Aβ 1-40 peptide in mouse auditory cortex.
図122Cは、いくつかの実施形態に従って、静寂(無刺激)に曝露されたマウスの海馬における可溶性アイソフォームAβ1-42ペプチドのレベルに対して、クリック・トレイン刺激(刺激)に曝露されたマウスの海馬におけるはるかに小さいレベルの可溶性アイソフォームAβ1-42ペプチドを示す棒グラフである。 FIG. 122C shows levels of soluble isoform Aβ 1-42 peptide in the hippocampus of mice exposed to silence (no stimulation) vs. mice exposed to click train stimulation (stimulation), according to some embodiments. 1 is a bar graph showing much lower levels of soluble isoform Aβ 1-42 peptide in the hippocampus of 1999.
図122Dは、いくつかの実施形態に従って、静寂(無刺激)に曝露されたマウスの海馬における可溶性アイソフォームAβ1-40ペプチドのレベルに対して、クリック・トレイン刺激(刺激)に曝露されたマウスの海馬における小さいレベルの可溶性アイソフォームAβ1-40ペプチドを示す棒グラフである。 FIG. 122D shows levels of soluble isoform Aβ 1-40 peptide in the hippocampus of mice exposed to silence (no stimulation) versus mice exposed to click train stimulation (stimulation), according to some embodiments. 1 is a bar graph showing small levels of soluble isoform Aβ 1-40 peptide in the hippocampus of 100% of the population.
聴覚ガンマ刺激は、いくつかの実施形態によれば、対象の不溶性Aβのレベルを減少させることが示された。図123Aは、いくつかの実施形態に従って、静寂(無刺激)に曝露されたマウスの聴覚野における不溶性アイソフォームAβ1-42ペプチドのレベルに対して、クリック・トレイン刺激(刺激)に曝露されたマウスの聴覚野におけるはるかに小さいレベルの不溶性アイソフォームAβ1-42ペプチドを示す棒グラフである。 Auditory gamma stimulation has been shown to reduce levels of insoluble Aβ in subjects, according to some embodiments. FIG. 123A shows the levels of insoluble isoform Aβ 1-42 peptide in the auditory cortex of mice exposed to silence (no stimulation) versus click train stimulation (stimulation), according to some embodiments. Bar graph showing much lower levels of insoluble isoform Aβ 1-42 peptide in mouse auditory cortex.
図123Bは、いくつかの実施形態に従って、静寂(無刺激)に曝露されたマウスの聴覚野における不溶性アイソフォームAβ1-40ペプチドのレベルに対して、クリック・トレイン刺激(刺激)に曝露されたマウスの聴覚野における小さいレベルの不溶性アイソフォームAβ1-40ペプチドを示す棒グラフである。 FIG. 123B shows levels of insoluble isoform Aβ 1-40 peptide in the auditory cortex of mice exposed to silence (no stimulation) versus click train stimulation (stimulation), according to some embodiments. 1 is a bar graph showing small levels of insoluble isoform Aβ 1-40 peptide in mouse auditory cortex.
図123Cは、いくつかの実施形態に従って、静寂(無刺激)に曝露されたマウスの海馬における不溶性アイソフォームAβ1-42ペプチドのレベルに対して、クリック・トレイン刺激(刺激)に曝露されたマウスの海馬におけるはるかに小さいレベルの不溶性アイソフォームAβ1-42ペプチドを示す棒グラフである。 FIG. 123C shows levels of insoluble isoform Aβ 1-42 peptide in the hippocampus of mice exposed to silence (no stimulation) versus mice exposed to click train stimulation (stimulation), according to some embodiments. 1 is a bar graph showing much smaller levels of insoluble isoform Aβ 1-42 peptide in the hippocampus of 100% of the population.
図123Dは、いくつかの実施形態に従って、静寂(無刺激)に曝露されたマウスの海馬における不溶性アイソフォームAβ1-40ペプチドのレベルに対して、クリック・トレイン刺激(刺激)に曝露されたマウスの海馬における小さいレベルの不溶性アイソフォームAβ1-40ペプチドを示す棒グラフである。 FIG. 123D shows levels of insoluble isoform Aβ 1-40 peptide in the hippocampus of mice exposed to silence (no stimulation) versus mice exposed to click train stimulation (stimulation), according to some embodiments. 1 is a bar graph showing small levels of insoluble isoform Aβ 1-40 peptide in the hippocampus of 100% of the population.
図124Aは、いくつかの実施形態に従って、クリック・トレイン刺激に曝露された5XFADマウスにおけるミクログリア細胞の代表的な画像である。図124Bは、静寂に曝露された5XFADマウスにおけるミクログリア細胞の代表的な画像である。このミクログリアの突起及び細胞は、図124Aと図124B間で明らかに異なり、いくつかの実施形態に従ってクリック・トレイン刺激に曝露された5XFADマウスからのミクログリアにおいて相対的に突起の長さが短く、細胞サイズが大きい。 FIG. 124A is a representative image of microglial cells in 5XFAD mice exposed to click train stimulation, according to some embodiments. FIG. 124B is a representative image of microglial cells in silence-exposed 5XFAD mice. The microglial processes and cells are clearly different between FIGS. 124A and 124B, with relatively shorter process lengths and cell Large in size.
図124Cは、静寂に曝露されたWTマウスにおけるミクログリア細胞の代表的な画像である。図124Dは、いくつかの実施形態に従ってクリック・トレイン刺激に曝露されたWTマウスにおけるミクログリア細胞の代表的な画像である。このミクログリアの突起及び細胞は、図124Cと図124D間で明らかに異なり、いくつかの実施形態に従ってクリック・トレイン刺激に曝露されたWTマウスからのミクログリアにおいて相対的に突起の長さが短く、細胞サイズが大きい。 FIG. 124C is a representative image of microglial cells in WT mice exposed to silence. FIG. 124D is a representative image of microglial cells in WT mice exposed to click train stimulation according to some embodiments. The microglial processes and cells are distinct between FIGS. 124C and 124D, with relatively shorter process lengths and cells in microglia from WT mice exposed to click train stimulation according to some embodiments. Large in size.
従って、いくつかの実施形態によれば、ガンマ周波数での非侵襲的な聴覚刺激は、聴覚野及び海馬におけるガンマ振動ならびにAD関連病変の顕著な減少を促進した。 Thus, according to some embodiments, non-invasive auditory stimulation at gamma frequencies promoted a significant reduction in gamma oscillations and AD-related lesions in the auditory cortex and hippocampus.
ガンマ周波数での聴覚刺激は、対象の行動に好ましい影響を与えた。
聴覚ガンマ刺激は、いくつかの実施形態によれば、対象の認識を改善することが示された。図125Aは、いくつかの実施形態に従ってクリック・トレイン刺激に曝露された5XFADマウス及び静寂に曝露された5XFADマウスを用いて実施された新奇物体認識試験を示す流れ図である。この試験は、げっ歯類が慣れ親しんだ物体よりも新奇物体を探索するのにより多くの時間を費やす傾向に基づいて、対象が慣れ親しんだ物体から新奇物体を認識する能力(すなわち、認識記憶)を評価する。認識指数RIを用いて対象を比較した:

Auditory gamma stimulation has been shown to improve object recognition, according to some embodiments. FIG. 125A is a flow chart showing a novel object recognition test performed with 5XFAD mice exposed to click train stimulation and 5XFAD mice exposed to silence according to some embodiments. This test assesses a subject's ability to recognize novel objects from familiar objects (i.e., recognition memory) based on the tendency of rodents to spend more time exploring novel objects than familiar ones. do. Subjects were compared using the Recognition Index RI:
図125Aでは、5XFADマウスを環境12500に馴化させた。時間T1で、2つの新奇物体12502を導入した。その後時間T2で、1時間の休息後、これらマウスを1つの慣れ親しんだ物体及び1つの新奇物体12504、12506に1時間曝露した。図125Bは、クリック・トレイン刺激に曝露されたマウスがより高いRIを有していた新奇物体認識試験の結果を示す棒グラフであり、いくつかの実施形態に従って、クリック・トレイン刺激に曝露されたマウスが、より良好な認識記憶のために慣れ親しんだ物体より新奇物体で長い時間を費やしたことを示している。
In Figure 125A, 5XFAD mice were acclimated to
聴覚ガンマ刺激は、いくつかの実施形態によれば、対象の識別を改善することが示された。図126Aは、いくつかの実施形態に従ってクリック・トレイン刺激に曝露された5XFADマウス及び静寂に曝露された5XFADマウスを用いて実施された新奇位置認識試験を示す流れ図である。この試験は、げっ歯類が新奇に位置した物体を探索するのにより多くの時間を費やす傾向に基づいて、空間記憶及び/または識別を評価する。認識指数RIを用いて対象を比較した:

図126Aでは、5XFADマウスを環境12600に馴化させた。時間T1で、2つの物体を第一の位置12602に導入した。その後時間T2で、1時間の休息後、これらマウスをこれら物体のうちの1つをその最初の位置で、及び他の物体を新奇の第二の位置12604、12606で1時間曝露した。図126Bは、クリック・トレイン刺激に曝露されたマウスがより高いRIを有していた新奇位置認識試験の結果を示す棒グラフであり、いくつかの実施形態に従って、クリック・トレイン刺激に曝露されたマウスが、より良好な空間記憶及び/または識別のために同じ位置にとどまった物体より移動した物体で長い時間を費やしたことを示している。
In Figure 126A, 5XFAD mice were acclimated to
聴覚ガンマ刺激は、いくつかの実施形態によれば、対象の空間記憶を改善することが示された。Morris水迷路試験を、いくつかの実施形態に従ってクリック・トレイン刺激に曝露された5XFADマウス及び静寂に曝露された5XFADマウスを用いて実施した。上述したように、この試験は、オープン・スイミング・アリーナの周囲の開始位置から航行し、水没した逃避台の位置を見つけるための対象が用いる遠位の手がかりに基づいて、空間及び/または参照記憶を評価する。この試験は、反復試行を経て評価し、空間及び/または参照記憶は、台が存在しない場合の台の場所に対する優先傾向によって判定した。 Auditory gamma stimulation has been shown to improve spatial memory in subjects, according to some embodiments. The Morris water maze test was performed with 5XFAD mice exposed to click train stimulation and 5XFAD mice exposed to silence according to some embodiments. As described above, this test navigates from a starting position around an open swimming arena and uses spatial and/or reference memory based on distal cues used by the subject to locate submerged platforms. Evaluate. The test was evaluated over repeated trials, and spatial and/or reference memory was determined by preference for platform location when no platform was present.
図127Aは、いくつかの実施形態に従って、各日の静寂(無刺激)に曝露されたマウス及びクリック・トレイン刺激(刺激)に曝露されたマウスが台を見つけるまでの平均時間を示すプロットである。図127Bは、台が除去されたプローブ試験の結果を示す棒グラフである。クリック・トレイン刺激に曝露されたマウスは、目標象限において見当たらない台を探すのに、静寂に曝露されたマウスよりも多くの時間を費やし、ひいては、いくつかの実施形態に従って、クリック・トレイン刺激に曝露されたマウスが、より良好な空間及び/または参照記憶を有することを示した。 FIG. 127A is a plot showing the average time to find a platform for mice exposed to silence (no stimulus) and click train stimulus (stimulus) on each day, according to some embodiments. . FIG. 127B is a bar graph showing the results of the probe test with the platform removed. Mice exposed to the click train stimulus spent more time searching for missing pedestals in the target quadrant than mice exposed to silence and thus, according to some embodiments, responded to the click train stimulus. Exposed mice were shown to have better spatial and/or referential memory.
従って、いくつかの実施形態によれば、ガンマ周波数での非侵襲的な聴覚刺激は、ミクログリアの活性化を誘導し、AD関連(例えば、Aβ)病変を低減し、認知障害(例えば、認識、識別、及び空間記憶における)を有意に軽減した。簡単で利用しやすい投与の選択肢(自己投与を含む)のため、聴覚ガンマ刺激には、家庭用または携帯用(例えば、雑音消去ヘッドホンの使用)の用途が挙げられるがこれらに限定されない広大な商業的用途の可能性がある。自己投与の可能性に加えて、臨床医及び/または研究者が、いくつかの実施形態に従って、動物モデルからヒト患者に及ぶ対象に対して刺激パラダイムを投与してもよい。臨床医及び/または研究者は、聴覚ガンマ刺激と様々な種類の監視を組み合わせることが有用であることを見出し得る。例えば、治療期間は、対象を防音室に配置することを含んでもよいし、対象に雑音消去ヘッドホンもしくは干渉を制限する別の装置を供給することを含んでもよい。該対象は、刺激の間、例えば、機能的磁気共鳴画像法(fMRI)を用いて、有益な脳状態の変化を監視され得る。 Thus, according to some embodiments, non-invasive auditory stimulation at gamma frequencies induces microglial activation, reduces AD-related (e.g., Aβ) pathology, and reduces cognitive impairment (e.g., cognition, discrimination, and spatial memory). Because of the simple and accessible administration options (including self-administration), auditory gamma stimulation has a vast commercial potential including, but not limited to, home or portable (e.g., use of noise canceling headphones) applications. potential applications. In addition to the potential for self-administration, clinicians and/or researchers may administer stimulation paradigms to subjects ranging from animal models to human patients, according to some embodiments. Clinicians and/or researchers may find it useful to combine auditory gamma stimulation with various types of monitoring. For example, a treatment session may include placing the subject in a soundproof room, or providing the subject with noise-canceling headphones or another device that limits interference. The subject can be monitored for beneficial brain state changes during stimulation using, for example, functional magnetic resonance imaging (fMRI).
実験方法
動物
すべての動物実験は、比較医学部門の実験動物委員会(the Committee for Animal Care of the Division of Comparative Medicine)(マサチューセッツ工科大学、マサチューセッツ州ケンブリッジ)によって承認された。成体(3か月齢)雄二重Tg 5XFAD Creマウスは、5XFAD TgマウスをTg PVまたはCW2プロモーター駆動Cre系統とかけ合わせることによって産生した。成体(5か月齢)雄及び雌APP/PS1マウスは、Tonegawa Laboratory(マサチューセッツ工科大学、マサチューセッツ州ケンブリッジ)から寄贈された。成体(4か月齢)雄TauP301Sマウスは、Jackson Laboratoryより入手した。老齢WTマウス(8か月齢、C57Bl/6)は、Jackson Laboratory(メイン州バーハーバー)より入手した。マウスは、3~5の群で、標準的な12時間の明/12時間の暗サイクルにて飼育し、すべての実験は、明サイクルの間に実施した。餌と水は、他に記載のない限り不断に与えた。同腹仔は、実験者によって各条件にランダムに割り当てられた。実験者には、組織の処理ならびに電気生理学的記録及び分析中、動物の遺伝子型は分からなかった。分析から除外した動物はなかった。
Experimental Methods Animals All animal experiments were approved by the Committee for Animal Care of the Division of Comparative Medicine (Massachusetts Institute of Technology, Cambridge, MA). Adult (3 months old) male double Tg 5XFAD Cre mice were generated by crossing 5XFAD Tg mice with Tg PV or CW2 promoter-driven Cre strains. Adult (5 months old) male and female APP/PS1 mice were a gift from Tonegawa Laboratory (Massachusetts Institute of Technology, Cambridge, MA). Adult (4 months old) male TauP301S mice were obtained from Jackson Laboratory. Aged WT mice (8 months old, C57B1/6) were obtained from Jackson Laboratory (Bar Harbor, ME). Mice were housed in groups of 3-5 on a standard 12 h light/12 h dark cycle and all experiments were performed during the light cycle. Food and water were provided ad libitum unless otherwise stated. Littermates were randomly assigned to each condition by the experimenter. The experimenter was blinded to the genotype of the animals during tissue processing and electrophysiological recording and analysis. No animals were excluded from analysis.
AVVベクター
血清型5のアデノ随伴ウイルス粒子は、Vector Core Facility(ノースカロライナ大学、ノースカロライナ州チャペルヒル)から入手した。このAAV5ウイルスは、EF1αプロモーターによって駆動される高感度黄色蛍光タンパク質(EYFP)に融合された二重floxed、逆方向オープン・リーディング・フレーム(DIO)内のChR2を含んでいた(例えば、図9参照)。AAV DIO EYFP構築物は対照として用いた。
AVV Vectors Adeno-associated viral particles of
外科処置
3か月齢の5XFAD/PV-CreまたはCW2マウスは、ケタミン(1.1mg kg-1)及びキシラジン(0.16mg kg-1)の混合物の腹腔内注射で麻酔した。2.0mm後葉から泉門点まで及び1.8mm側葉から正中まで左側に小開頭を行った。ウイルスは、硬膜の小切開を介して、Quintessential Stereotaxic Injector(商標)(Stoelting Co.、イリノイ州ウッドデールより入手可能)に取り付けられたガラス製マイクロピペットで供給した。このガラス製マイクロピペットを脳表面の下1.2mmまで下ろした。ウイルス(AAV DIO ChR2-EYFPまたはAAV DIO EYFP、1ml当たり2X10¹²ウイルス分子)1μlのボーラスを、海馬のCA1領域に0.075μl分-1で注射した。ピペットは、注射後5分間その場に残し、その後脳から後退させた。片側光ファイバーインプラント(コア径300μm、Thorlabs Inc.、ニュージャージー州ニュートンより入手可能)をほぼ注射部位の脳表面の下0.9mmまで下ろした。手術部位の前縁及び後縁に固定した2つの小ネジを歯科用の接着剤で固着し、このインプラントを定位置に固定した。電気生理学的記録については、成体(3か月齢)雄5XFAD/PV-Cre二重トランスジェニックマウス及び5XFAD陰性同腹仔(CA1記録用)、または5XFAD及びそのWT同腹仔(視覚野記録用)マウスをイソフルランで麻酔し、定位フレームに入れた。頭皮を剃毛し、眼軟膏(例えば、Puralube(登録商標)Vet軟膏(Dechra Pharmaceuticals PLC、英国ノースウィッチ))を目に塗り、Betadine(登録商標)消毒剤(Purdue Products L.P.、コネチカット州スタンフォードより入手可能)及び70%エタノールを用いて手術領域を消毒した。CA1の記録については、開頭(mm単位で、泉門点から:-2A/P、1.8M/L)を行い、ウイルス1μLをCA1に供給した(上述の通り)。LFP記録のための標的開頭部位は、頭蓋骨上にマークし(mm単位で、泉門点から:CA1については-3.23A/P、0.98M/L及び視覚野については2.8A/P、2.5M/L)、3つのセルフタッピングネジ(例えば、F000CE094、Morris Precision Screws and Parts、マサチューセッツ州サウスブリッジより入手可能)をこの頭蓋骨に取り付け、カスタムステンレス鋼ヘッドプレートを歯科用セメント(例えば、C&B Metabond(登録商標)、Parkell Inc.、ニューヨーク州エッジウッドより入手可能)を用いて取り付けた。第一の記録期間の日に、歯科用ドリルを用い、第一に頭蓋骨を厚さ約100μmまで薄くし、その後30ゲージの針を用いて小開口を作ることによってLFP開頭術(例えば、300~400μm径)を行った。この開頭は、その後、滅菌シリコーンエラストマー(例えば、Kwik-Sil(商標)接着剤、World Precision Instruments,Inc.、フロリダ州サラソータより入手可能)で、その日の記録まで、及び記録期間の間、密封した。
Surgery Three-month-old 5XFAD/PV-Cre or CW2 mice were anesthetized with an intraperitoneal injection of a mixture of ketamine (1.1 mg kg −1 ) and xylazine (0.16 mg kg −1 ). A small craniotomy was performed 2.0 mm from the posterior lobe to the fontanelle point and 1.8 mm from the lateral lobe to the midline on the left side. Virus was delivered via a small incision in the dura with a glass micropipette attached to a Quintessential Stereotaxic Injector™ (available from Stoelting Co., Wooddale, IL). The glass micropipette was lowered 1.2 mm below the brain surface. A 1 μl bolus of virus (AAV DIO ChR2-EYFP or AAV DIO EYFP, 2×10 12 viral molecules per ml) was injected into the CA1 region of the hippocampus at 0.075 μl min −1 . The pipette was left in place for 5 minutes after injection and then withdrawn from the brain. A unilateral fiber optic implant (300 μm core diameter, available from Thorlabs Inc., Newton, NJ) was lowered approximately 0.9 mm below the brain surface at the injection site. Two machine screws fixed to the anterior and posterior margins of the surgical site were secured with dental glue to secure the implant in place. For electrophysiological recordings, adult (3 months old) male 5XFAD/PV-Cre double transgenic mice and 5XFAD-negative littermates (for CA1 recordings), or 5XFAD and their WT littermates (for visual cortex recordings) were used. They were anesthetized with isoflurane and placed in a stereotaxic frame. The scalp is shaved, ophthalmic ointment (e.g., Puralube® Vet ointment (Dechra Pharmaceuticals PLC, Northwich, UK)) is applied to the eyes, and Betadine® antiseptic (Purdue Products LP, Conn.) is applied to the eyes. available from Stanford) and 70% ethanol was used to disinfect the surgical area. For CA1 recordings, a craniotomy (in mm, from the fontanelle: −2 A/P, 1.8 M/L) was performed and 1 μL of virus was delivered to CA1 (as described above). Target craniotomy sites for LFP recording were marked on the skull (in mm, from fontanel point: −3.23 A/P, 0.98 M/L for CA1 and 2.8 A/P for visual cortex). , 2.5 M/L), three self-tapping screws (e.g., F000CE094, available from Morris Precision Screws and Parts, Southbridge, Mass.) are attached to the skull, and a custom stainless steel headplate is cemented with dental cement (e.g., C&B Metabond®, available from Parkell Inc., Edgewood, NY). On the day of the first recording period, an LFP craniotomy (e.g., 300-100 μm) is performed by first thinning the skull to approximately 100 μm in thickness using a dental drill and then making a small opening using a 30-gauge needle. 400 μm diameter) was performed. The craniotomy was then sealed with a sterile silicone elastomer (eg, Kwik-Sil™ adhesive, available from World Precision Instruments, Inc., Sarasota, Fla.) until and during the day's recording. .
光遺伝学的刺激プロトコル
マウスが回復し、電気生理学用の動物用の行動訓練を受けるための、及びウイルスがニューロンで発現するための時間を与える、ウイルス注射及びインプラント設置の2~4週間後に、海馬CA1ニューロンを光遺伝学的に操作した。200mWの4793nm DPSSレーザを、各端にファイバー・チャンネル/身体的接触コネクタを備えたパッチ・コードに接続した。実験中、1mW(ファイバーの端部から測定)の光刺激を1時間送った。分子及び生化学的分析用に、各動物は、3つの刺激プロトコル、すなわち、8Hz、40Hz、もしくはランダム刺激(光パルスは、平均周波数40Hzで、ポアソン過程により決定されたランダムな間隔で送った)のうちの1つを受けたか、または、電気生理学的記録については、各動物は、記録中、交互配置されたすべての刺激条件を受けた。
Optogenetic Stimulation Protocol Two to four weeks after virus injection and implant placement, which gives mice time to recover and undergo animal behavioral training for electrophysiology and for virus to express in neurons, Hippocampal CA1 neurons were optogenetically engineered. A 200 mW 4793 nm DPSS laser was connected to a patch cord with a fiber channel/physical contact connector on each end. During the experiment, a light stimulus of 1 mW (measured from the end of the fiber) was delivered for 1 hour. For molecular and biochemical analyses, each animal was subjected to one of three stimulation protocols: 8 Hz, 40 Hz, or random stimulation (light pulses were delivered at an average frequency of 40 Hz and at random intervals determined by the Poisson process). or, for electrophysiological recordings, each animal received all stimulus conditions alternating during the recording.
視覚刺激プロトコル
実験の15分前、5XFADマウスを生理食塩水(対照)またはピクロトキシン(0.18mg/kg)で処理した。分子及び生化学的分析用に、その後マウスを、LED電球によって照らされる暗室に入れ、5つの刺激条件、すなわち、暗、明、20Hzの点滅、40Hzの点滅、または80Hzの点滅(12.5ミリ秒の光オン、12.5ミリ秒の光オフ)1時間(例えば、図43A参照)のうちの1つに曝露した。電気生理学的記録については、各動物は、記録中、10秒のブロックで交互配置された、暗、明、40Hzの点滅、またはランダム(光パルスは、平均間隔40Hzで、ポアソン過程により決定されたランダムな間隔で送った)刺激条件を受けた。
Visual stimulation protocol 5XFAD mice were treated with saline (control) or picrotoxin (0.18 mg/kg) 15 minutes before the experiment. For molecular and biochemical analyses, mice were then placed in a dark chamber illuminated by LED bulbs and exposed to 5 stimulus conditions: dark, bright, blinking 20 Hz, blinking 40 Hz, or blinking 80 Hz (12.5 mm). seconds light on, 12.5 ms light off) for 1 hour (see, eg, FIG. 43A). For electrophysiological recordings, each animal was placed in dark, light, 40 Hz blinks, or random (light pulses were averaged at 40 Hz intervals, determined by the Poisson process), alternating in 10-second blocks during recording. (sent at random intervals) received stimulus conditions.
電気生理学用の行動訓練及び仮想現実環境(VR)
CA1の記録については、Harveyらに記載の通り、頭部を固定した動物を、エアクッションで支えられた8インチの球状トレッドミル上を仮想現実環境で走らせた。球状トレッドミルの動きは、光学式マウスで測定し、MATLAB(登録商標)コンピュータ環境(ソフトウェアバージョン2013b、MathWorks、マサチューセッツ州ナティックより入手可能)で実行中の仮想現実ソフトウェアに送った。この仮想環境は、直線トラックと、動物が向きを変えることができる端部の2つの小さな囲いからなる。動物は、トラックの各端への交互の訪問に対して、トラックの各端で、加糖練乳(1:2に水で希釈)の報酬を得た。動物は、約1週間以上、この仮想直線トラック上を走行することを学習した。これらの動物を1週間おいて手術から回復させ、1~2日間ハンドリングに馴らし、その後行動訓練を開始した。トレッドミルを操ること、及び試験環境に慣れることを学習するように、訓練の最初の2日間、動物は、仮想現実システムをオフにして球状トレッドミル上に置かれ、希釈されていない加糖練乳の報酬を得た。球状トレッドミル上での訓練の2日目に、動物の餌を制限し、走るための動機づけをした。動物を、その基準体重のせいぜい85%に制限し、通常はその基準体重の88%を超えた。3日目から訓練の終わりまで(通常5~7日)、動物を、時間を延長しつつ(30分~2時間)トレッドミル上に置き、VR直線トラックを走行させた。動物は、トラックの長さを横断した後、直線トラックの端で希釈(1:2)加糖練乳の報酬を得た。記録期間の間、動物は、行動能力を維持するために再訓練期間を与えられた。視覚野の記録については、動物に球状トレッドミル上を走行させ、その間に暗、明、または光の点滅条件(以下のデータ収集に記載)に曝露した。記録に先立って、動物は、球状トレッドミル上に置かれ(仮想現実システムをオフにして)、希釈されていない加糖練乳の報酬を得ることで、トレッドミルを操ること及び試験環境に慣れることを学習した。
Behavioral training and virtual reality environments (VR) for electrophysiology
For CA1 recording, head-fixed animals were run in a virtual reality environment on an 8-inch spherical treadmill supported by an air cushion, as described by Harvey et al. Movement of the spherical treadmill was measured with an optical mouse and sent to virtual reality software running in the MATLAB® computer environment (software version 2013b, MathWorks, available from Natick, Mass.). This virtual environment consists of a straight track and two small enclosures at the ends where the animals can turn. Animals were rewarded with sweetened condensed milk (diluted 1:2 with water) at each end of the track for alternate visits to each end of the track. Animals learned to run on this virtual straight track over about a week. The animals were allowed one week to recover from surgery and acclimated to handling for 1-2 days before beginning behavioral training. For the first two days of training, animals were placed on a spherical treadmill with the virtual reality system off and fed undiluted sweetened condensed milk to learn to maneuver the treadmill and become familiar with the testing environment. Got rewarded. On the second day of training on the spherical treadmill, animals were food restricted and motivated to run. Animals were restricted to no more than 85% of their baseline body weight and usually exceeded 88% of their baseline body weight. From
電気生理学データ収集
記録中のCA1の光遺伝学的刺激については、300μmコアの光ファイバーを、CA1へウイルスを供給するために用いた開頭を介して脳内に900μmの深さまで進めた。1ミリ秒及び1mW(ファイバーの端部から測定)の光パルスを473nmのDPSS(ダイオード励起固体)レーザを介して供給した(上述の通り)。光電アーチファクトを避けるため、神経活動はガラス電極で記録した。LFP電極は、ホウケイ酸ガラス製ピペット(例えば、Warner Instruments、コネチカット州ハムデンより入手可能)から、フィラメント系のマイクロピペットプラー(例えば、P-97 Flaming/Brown(商標)マイクロピペットプラー、Sutter Instrument Co.、カリフォルニア州ナバトより入手可能)にて引き延ばして微細な先端にし、これを次に手で折って直径約10~20μmに戻し、その後滅菌生理食塩水で満たした。CA1の記録については、このLFP電極を、LFP記録用開頭を介して、前頭面に対して後方に60度の角度及び水平面に対して下側45度で、海馬層の錐体層の明確な電気生理学的サイン(動物の走行中、約600~1000μVのシータ波、不動状態では明らかに区別できるSWR、150μVを超える複数のスパイク、例えば、図2A~2B参照)が認められるまで進めた。視覚野の記録については、LFP電極は、LFP記録用開頭を介して垂直に600~900μmの深さまで進め、150μVを超える複数のスパイクが認められた。データは、サンプリングレート20kHz及びバンドパスフィルター1Hz~1kHzで収集した。動物は、長期にわたって球状トレッドミル上を走行させたか、または休息させた。光遺伝学的刺激期間については、いずれかの刺激の開始前30分間データを記録した。その後、刺激をガンマ(40Hz)、ランダム(光遺伝学的刺激で記載)、またはシータ(8Hz)の周波数で10秒間の周期を10秒間のベースライン周期(無刺激)と交互配置して供給した。2匹の動物において、各タイプの刺激またはベースラインを10秒周期の代わりに5分周期で供給した。各30分間の刺激の記録の後、5~30分間の無刺激の記録を行った。視覚の光の点滅刺激期間については、10秒間の光オフの周期を交互配置して、動物ライト周囲のLEDストリップライトをガンマ(40Hz)、ランダム(視覚刺激プロトコルに上述)、シータ(8Hz)、または20Hzの周波数で10秒間の周期で点滅させたか、または、10秒間の連続オンの周期であった。光の点滅の間、脳表面の上でいくつかの記録を行い、記録中にこれらのライトが電気的または光電ノイズを生成しないことを保証した。記録期間は、約3~5時間後に終了させた。動物は、記録時、3~4か月齢であった。電気生理学的記録の分析
Electrophysiology Data Acquisition For optogenetic stimulation of CA1 during recording, a 300 μm core optical fiber was advanced to a depth of 900 μm into the brain through the craniotomy used to deliver virus to CA1. Light pulses of 1 ms and 1 mW (measured from the end of the fiber) were delivered via a 473 nm DPSS (diode-pumped solid-state) laser (as described above). Neural activity was recorded with glass electrodes to avoid photoelectric artifacts. The LFP electrode was pulled from a borosilicate glass pipette (eg, Warner Instruments, Hamden, Conn.) to a filament-based micropipette puller (eg, P-97 Flaming/Brown™ Micropipette Puller, Sutter Instrument Co.). (available from Nabat, Calif.) to a fine tip, which was then manually broken back to about 10-20 μm in diameter and then filled with sterile saline. For CA1 recordings, the LFP electrodes were placed through the LFP recording craniotomy at an angle of 60 degrees posterior to the frontal plane and 45 degrees inferior to the horizontal plane, in a clear line of the pyramidal layer of the hippocampal layer. Electrophysiological signatures (approximately 600-1000 μV theta waves while the animal is running, clearly distinguishable SWR in the immobile state, multiple spikes above 150 μV, see eg FIGS. 2A-2B) were observed. For visual cortex recordings, the LFP electrodes were advanced vertically through the LFP recording craniotomy to a depth of 600-900 μm and multiple spikes above 150 μV were observed. Data were collected with a sampling rate of 20 kHz and a bandpass filter of 1 Hz-1 kHz. Animals were allowed to run or rest on a spherical treadmill for extended periods of time. For the optogenetic stimulation period, data were recorded for 30 minutes prior to initiation of any stimulation. Stimuli were then delivered at gamma (40 Hz), random (described in Optogenetic Stimulation), or theta (8 Hz) frequencies alternating 10-second cycles with 10-second baseline cycles (no stimulation). . In two animals, each type of stimulus or baseline was delivered in 5 minute cycles instead of 10 second cycles. Each 30-minute stimulus recording was followed by 5-30 minutes of unstimulated recording. For visual light blinking stimulation periods, the LED strip lights around the animal lights were gamma (40 Hz), random (described above in the visual stimulation protocol), theta (8 Hz), staggered periods of light off for 10 seconds. or flashed at a frequency of 20 Hz for a period of 10 seconds, or a period of continuous on for 10 seconds. Several recordings were made above the brain surface during flashing lights to ensure that these lights did not generate electrical or photoelectric noise during recordings. The recording period was terminated after approximately 3-5 hours. Animals were 3-4 months old at the time of recording. Analysis of electrophysiological recordings
スパイク検出
スパイクは、300~6000Hzのバンドパスシグナルを閾値化することによって検出した。閾値は、スパイクによる標準偏差測定のコンタミネーションをさけるため、フィルターにかけられたシグナルの中央値プラスフィルターにかけられたシグナルの標準偏差のロバスト推定量の5倍(中央値/0.675)であった(例えば、Rossant et al.,“Spike Sorting for Large,Dense Electrode Arrays,”bioRxiv doi:dx_doi_org_10.1101_015198(Feb.16,2015)参照)。
Spike Detection Spikes were detected by thresholding the bandpass signal from 300-6000 Hz. The threshold was 5 times the median of the filtered signal plus a robust estimator of the standard deviation of the filtered signal (median/0.675) to avoid contamination of the standard deviation measurement with spikes. (See, for example, Rossant et al., "Spike Sorting for Large, Dense Electrode Arrays," bioRxiv doi: dx_doi_org_10.1101_015198 (Feb. 16, 2015)).
局所電場電位(LFP)
記録されたトレースを、2kHzに低解像度処理し、1~300Hz間でバンドパスフィルターにかけた。
local field potential (LFP)
Recorded traces were down-resolution processed to 2 kHz and bandpass filtered between 1 and 300 Hz.
シータ及びSWR検出
動物が走行や静止をすると、海馬のネットワークを通じた活動は顕著に変化し、これらの変化はしばしば異なるネットワーク状態と呼ばれる。これらのネットワーク状態は、異なる周波数帯域におけるLFP振動の有無によって明らかに区別できる。動物が走行した際、他が示したように、CA1において大きなシータ(4~12Hz)振動が認められた(例えば、図2A参照)。動物が静止した際、シータ振動はもはや見られず、SWR、すなわち、約50~100ミリ秒続き、集団的活動のバーストと関連する150~250Hzの高周波振動(例えば、図2B参照)が記録された。SWRは、フィルターにかけられたトレースのエンベロープ振幅が、少なくとも15ミリ秒に対する平均の上側4標準偏差を超えた時に検出された(例えば、図4A、4B、5A、5B、6A、6B、7B、及び8参照)。エンベロープ振幅は、フィルターにかけられたLFPのヒルベルト変換の絶対値を取って計算した。本明細書に開示の結果は、SWR検出のため、より高閾値、すなわち、より大きなSWRを検出する、平均の上側6標準偏差を用いた場合に有効であることが確認されている(例えば、図6C及び7C参照)。シータを検出するため(例えば、図3A及び3C参照)、FIR等リップルフィルターを用いて、LFPをシータ(4~12Hz)、デルタ(1~4Hz)、及びベータ(12~30Hz)についてバンドパスフィルターにかけた。デルタ及びベータに対するシータの比(「シータ比」)を、デルタ及びベータエンベロープ振幅の合計で除したシータエンベロープ振幅として計算した。シータ周期は、シータ比が少なくとも2秒間平均の上側1標準偏差を超え、この比が平均の上側少なくとも2標準偏差のピークに達した場合にそのように分類した。非シータ周期は、このシータ比が少なくとも2秒間1未満の場合にそのように分類した。SWR、シータ周期、及び非シータ周期を視覚的に検査し、これらの基準がそれぞれ、SWR、シータ周期、及び非シータ周期を正確に検出することを確認した。
Theta and SWR Detection Activity through the hippocampal network changes markedly when the animal runs or rests, and these changes are often referred to as different network states. These network states can be clearly distinguished by the presence or absence of LFP oscillations in different frequency bands. Large theta (4-12 Hz) oscillations were observed in CA1 when the animals ran, as shown by others (see, eg, FIG. 2A). When the animal was stationary, theta oscillations were no longer seen and SWR, ie, high frequency oscillations of 150-250 Hz lasting about 50-100 ms and associated with bursts of collective activity (see, eg, Figure 2B) were recorded. rice field. SWR was detected when the envelope amplitude of the filtered trace exceeded the upper four standard deviations of the mean for at least 15 ms (e.g., FIGS. 4A, 4B, 5A, 5B, 6A, 6B, 7B, and 8). Envelope amplitude was calculated by taking the absolute value of the Hilbert transform of the filtered LFP. The results disclosed herein have been found to be effective when using a higher threshold for SWR detection, i.e., the upper 6 standard deviations of the mean, which detects larger SWRs (e.g. 6C and 7C). To detect theta (see, for example, FIGS. 3A and 3C), the LFP was bandpass filtered for theta (4-12 Hz), delta (1-4 Hz), and beta (12-30 Hz) using FIR equiripple filters. I put it on. The ratio of theta to delta and beta (the "theta ratio") was calculated as the theta envelope amplitude divided by the sum of the delta and beta envelope amplitudes. A theta period was classified as such if the theta ratio exceeded 1 standard deviation above the mean for at least 2 seconds and the ratio reached a peak at least 2 standard deviations above the mean. A non-theta period was classified as such if the theta ratio was less than 1 for at least 2 seconds. SWR, theta and non-theta periods were visually inspected to confirm that these criteria accurately detected SWR, theta and non-theta periods, respectively.
パワースペクトル
スペクトル解析は、マルチテーパ法を用いて実施した(例えば、Mitra Lab in Cold Spring Harbor Laboratory、ニューヨーク州コールドスプリングハーバーより入手可能のChronuxのオープンソースソフトウェア、時間帯域幅積=3、テーパ数=5)。刺激なしのパワースペクトルを調べるため(例えば、図3A及び3C参照)、シータ周期のみを含めた。5秒の長さを超えるシータ周期を5秒の試験に分割し、平均パワースペクトル密度をこれらの試験にわたって各動物について計算した。光遺伝学的刺激(例えば、図13A及び6C参照)及び視覚刺激(例えば、図43B及び43C参照)中にパワースペクトルを調べるため、データは、各刺激条件またはベースライン周期の10秒試験に分割し、平均パワースペクトル密度をこれら試験にわたって各動物について計算した。
Power Spectrum Spectral analysis was performed using the multi-taper method (e.g., Chronux open source software available from Mitra Lab in Cold Spring Harbor Laboratory, Cold Spring Harbor, NY, time-bandwidth product = 3, number of tapers = 5). To examine the power spectrum without stimulation (see, eg, FIGS. 3A and 3C), only theta periods were included. Theta cycles greater than 5 seconds in length were divided into 5-second trials and the average power spectral density was calculated for each animal over these trials. To examine power spectra during optogenetic stimulation (see, for example, FIGS. 13A and 6C) and visual stimulation (see, for example, FIGS. 43B and 43C), data were divided into 10 second trials for each stimulus condition or baseline period. and the average power spectral density was calculated for each animal across these studies.
SWR中のガンマ
スペクトログラムは、マルチテーパ法を用いて計算した(例えば、Mitra Lab in Cold Spring Harbor Laboratory、ニューヨーク州コールドスプリングハーバーより入手可能のChronuxのオープンソースソフトウェア)。スペクトログラムは、SWRのピークの前後400ミリ秒の期間を含む各SWRについて計算した。その後、zスコアのスペクトログラムは、全記録期間にわたって計算したスペクトログラムの平均及び標準偏差を用いて各周波数帯域で計算し、標準偏差の単位でパワーの正規化された尺度を生成した(例えば、図4A、4B、5A、及び5B参照)。SWR中のガンマ振動の瞬時周波数は、LFPを10~50Hzに対してバンドパスフィルターにかけ、ヒルベルト変換をし、その後変換されたシグナルのピークの差の逆数をとって計算した(例えば、図4A、5A、及び6B参照)。SWRの前、最中、及び後のガンマパワーは、LFPを低ガンマ(20~50Hz)に対してフィルターにかけ、ヒルベルト変換のエンベロープ振幅を取ることで計算し、SWRピークを中心とした100ミリ秒のビンにおける平均ガンマパワーを得た。これは、全記録期間についてのエンベロープ振幅の平均及び標準偏差によって正規化し、各SWRの周囲の各ビンについてのzスコアのガンマパワーを得た(例えば、図6A及び7B参照)。SWR中のガンマによる位相変調は、LFPをガンマ(20~50Hz)に対してバンドパスフィルターにかけ、ヒルベルト変換をし、SWR中に生じた各スパイクに対して得られたシグナルの位相を決定することによって計算した(例えば、図7E参照)。5XFAD及びWT動物間で位相変調の差を測定するため、復元再抽出を用いた。すなわち、各記録から100スパイクのサブセットをランダムに選択して位相変調分布を作成し、これを各記録について500回繰り返した(例えば、図6C及び7A参照)。変調の深さは、その後、各分布に対するピークとトラフの和で除したピークとトラフの差を計算することによって、スパイク-ガンマ位相分布を測定した(例えば、図6C及び7A参照)。刺激中の発火の差:刺激によって誘発されたマルチユニット発火ヒストグラムをプロットするため、パルスの各光の開始後100ミリ秒について、スパイクを2.5ミリ秒のビンにし、各ビンにおけるスパイクの割合を計算した。平均及びSEMをその後周期のすべての光にわたって計算した。条件間のマルチユニット発火率の差を計算するため、発火率を各10秒間の刺激またはベースライン周期について計算した(周期の期間で除した合計スパイク数)。発火率の差は、関連のあるタイプの刺激の隣接する周期間で取った(光遺伝学的刺激についてはガンマ刺激周期マイナスベースラインまたはランダム周期の発火率、光の点滅刺激については、ガンマ刺激周期マイナスベースライン、連続オン、またはランダム周期の発火率)。すべての動物からの差をヒストグラムにプロットし(例えば、図14A及び44A参照)、動物当たりの差の中央値及び四分位数を箱ひげ図にプロットした(例えば、図13B及び44A参照)。
Gamma spectrograms during SWR were calculated using the multitaper method (eg Chronux open source software available from Mitra Lab in Cold Spring Harbor Laboratory, Cold Spring Harbor, NY). Spectrograms were calculated for each SWR including a period of 400 milliseconds before and after the SWR peak. A z-score spectrogram was then calculated in each frequency band using the mean and standard deviation of the spectrogram calculated over the entire recording period to produce a normalized measure of power in units of standard deviation (e.g., FIG. 4A , 4B, 5A, and 5B). The instantaneous frequency of gamma oscillations during the SWR was calculated by bandpass filtering the LFP to 10-50 Hz, taking the Hilbert transform, and then inverting the peak difference of the transformed signals (e.g., FIG. 4A, 5A and 6B). Gamma power before, during, and after SWR was calculated by filtering the LFP against low gamma (20-50 Hz) and taking the envelope amplitude of the Hilbert transform, 100 ms centered on the SWR peak. , the average gamma power in bins was obtained. This was normalized by the mean and standard deviation of the envelope amplitude for the entire recording period to obtain the z-scored gamma power for each bin around each SWR (see, eg, FIGS. 6A and 7B). Phase modulation by gamma during SWR is performed by bandpass filtering the LFP against gamma (20-50 Hz), performing the Hilbert transform, and determining the phase of the signal obtained for each spike occurring during SWR. (see, eg, FIG. 7E). Reconstruction resampling was used to measure phase modulation differences between 5XFAD and WT animals. That is, we randomly selected a subset of 100 spikes from each recording to generate the phase modulation distribution, which was repeated 500 times for each recording (see, eg, FIGS. 6C and 7A). Modulation depth was then measured for the spike-gamma phase distributions by calculating the peak-to-trough difference divided by the peak-to-trough sum for each distribution (see, eg, FIGS. 6C and 7A). Firing Differences During Stimulation: To plot the stimulus-evoked multi-unit firing histograms, spikes were binned into 2.5 ms bins for 100 ms after the onset of each light in the pulse, and the fraction of spikes in each bin. was calculated. The average and SEM were then calculated over all lights of the period. To calculate differences in multiunit firing rates between conditions, firing rates were calculated for each 10-second stimulus or baseline cycle (total number of spikes divided by cycle duration). Firing rate differences were taken between adjacent cycles of the relevant type of stimulus (gamma stimulus cycle minus baseline or random cycle firing rate for optogenetic stimuli, gamma stimulus Cycle minus baseline, continuous on, or random cycle firing rate). Differences from all animals were plotted on histograms (see, eg, FIGS. 14A and 44A), and median and quartiles of differences per animal were plotted on boxplots (see, eg, FIGS. 13B and 44A).
免疫組織化学
マウスは、深麻酔下で4%のパラホルムアルデヒドでかん流し、脳を4%のパラホルムアルデヒドで一夜後固定した。脳をビブラトーム(例えば、Leica VT100S、Leica Biosystems、イリノイ州バッファローグローブより入手可能)を用いて40μmで切片にした。切片を、室温で1時間、0.2%のTriton X-100及び10%の正常ロバ血清を含むPBSで透過処理及びブロックした。切片を一次抗体のPBS溶液中、4℃で0.2%Triton X-100及び10%正常ロバ血清とともに一夜インキュベートした。一次抗体は、抗EEA1(BD Transduction Laboratories(商標)EEA1(641057)、BD Biosciences、カリフォルニア州サンノゼより入手可能)、抗βアミロイド(例えば、βアミロイド(D54D2)XP(登録商標)、Cell Signaling Technology、マサチューセッツ州ダンバーズより入手可能)、抗Iba1(例えば、019-19741、Wako Chemicals、バージニア州リッチモンドより入手可能)、抗パルブアルブミン(例えば、ab32895、Abcam、マサチューセッツ州ケンブリッジより入手可能)、抗Rab5(ADI-KAp-GP006-E、Enzo Life Sciences Inc.、ニューヨーク州ファーミンデールより入手可能)であった。ELISA実験を確認するため、EEA1との同時標識を可能にすることから抗Aβ抗体D54D2を用い、APPと反応せず、この標識がAβに特異的かどうかについての判断を可能にすることから、抗Aβ抗体12F4を用いた。同時標識実験については、抗Aβ抗体12F4(805501、BioLegend、カリフォルニア州サンディエゴより入手可能)を用いた。一次抗体は、Alexa-Fluor 488及びAlex-Fluor 647二次抗体(Molecular Probes)、Hoechst 33342(94403、Sigma-Aldrich、ミズーリ州セントルイスより入手可能)でのニューロン核で可視化した。画像は、共焦点顕微鏡(LSM 710、Zeiss(商標))を用い、すべての条件に対して同一の設定で取得した。画像は、ImageJ 1.42qを用い、処理群が分からない実験者が定量化した。各実験条件に対して、少なくとも3匹の動物から少なくとも2つの冠状断面を定量化に用いた。海馬CA1画像化については、十分な細胞数を画像化するのに全視野が必要なIba1+細胞分析の場合を除いて、この分析を錐体細胞層に限定した。ImageJを用いて、Iba1+細胞体の直径を測定し、長さ測定の過程をトレースした。さらに、Coloc2プラグインを用いて、Iba1及びAβの共局在化を測定した。3-Dレンダリング用にImaris x64 8.1.2(Bitplane、英国ベルファストより入手可能)を用いた。「斑数」の計数に関しては、10μm以上の沈着物を含めた。
Immunohistochemistry Mice were perfused with 4% paraformaldehyde under deep anesthesia and brains were post-fixed with 4% paraformaldehyde overnight. Brains were sectioned at 40 μm using a vibratome (eg, Leica VT100S, available from Leica Biosystems, Buffalo Grove, IL). Sections were permeabilized and blocked with PBS containing 0.2% Triton X-100 and 10% normal donkey serum for 1 hour at room temperature. Sections were incubated overnight in primary antibody in PBS at 4° C. with 0.2% Triton X-100 and 10% normal donkey serum. Primary antibodies include anti-EEA1 (BD Transduction Laboratories™ EEA1 (641057), BD Biosciences, San Jose, Calif.), anti-beta amyloid (e.g., beta amyloid (D54D2) XP®, Cell Signaling Technology, Danvers, Mass.), anti-Iba1 (eg, 019-19741, available from Wako Chemicals, Richmond, Va.), anti-parvalbumin (eg, ab32895, available from Abcam, Cambridge, Mass.), anti-Rab5 (ADI -KAp-GP006-E, available from Enzo Life Sciences Inc., Farmindale, NY). To confirm the ELISA experiments, the anti-Aβ antibody D54D2 was used, since it allows co-labeling with EEA1 and does not react with APP, allowing a determination as to whether this label is specific for Aβ. Anti-Aβ antibody 12F4 was used. For co-labeling experiments, anti-Aβ antibody 12F4 (805501, available from BioLegend, San Diego, Calif.) was used. Primary antibodies were visualized in neuronal nuclei with Alexa-Fluor 488 and Alex-Fluor 647 secondary antibodies (Molecular Probes), Hoechst 33342 (94403, available from Sigma-Aldrich, St. Louis, Mo.). Images were acquired using a confocal microscope (LSM 710, Zeiss™) with identical settings for all conditions. Images were quantified using ImageJ 1.42q by an experimenter blinded to treatment group. At least two coronal sections from at least three animals were used for quantification for each experimental condition. For hippocampal CA1 imaging, the analysis was restricted to the pyramidal cell layer, except for the Iba1+ cell analysis, which required the full field of view to image sufficient cell numbers. ImageJ was used to measure the diameter of Iba1+ cell bodies and trace the length measurement process. In addition, colocalization of Iba1 and Aβ was measured using the Coloc2 plugin. Imaris x64 8.1.2 (available from Bitplane, Belfast, UK) was used for 3-D rendering. For "Peckle Number" counts, deposits larger than 10 μm were included.
CLARITY
固定した脳を1XPBS中、ビブラトーム(例えば、Leica VT100S、Leica Biosystems、イリノイ州バッファローグローブより入手可能)で100uMの冠状断面にスライスした。Allen Mouse Brain Atlasを参照して視覚野を含む切片を選択し、清澄用緩衝液(pH8.5~9.0、ドデシル硫酸ナトリウム200mM、水酸化リチウム一水和物20mM、ホウ酸4mMのddH2O溶液)中、55℃で振盪しながら2時間インキュベートした。清澄切片を1XPBST(0.1%Triton X-100/1XPBS)で3×10分間洗浄し、ブロッキング用溶液(2%ウシ血清アルブミン/1XPBST)に入れ、室温で一夜振盪した。次に、1XPBST中で、室温にて振盪しながら1時間の洗浄を3回実施した。切片をその後、1:100に1XPBSTで希釈した抗βアミロイド(805501、BioLegend、カリフォルニア州サンディエゴより入手可能)及び抗Iba1(Wako Chemicals、バージニア州リッチモンド、019-19741)一次抗体とともに振盪しながら4℃で2時間インキュベートした。さらに3×1時間の洗浄を1XPBST中で実施した後、切片を、1:100に1XPBSで希釈した二次抗体混合物中、室温にて振盪しながら9時間インキュベートした。断片化ロバ抗ウサギAlexa Fluor(登録商標)488(ab175694)及び抗マウス568(ab150101)二次抗体(いずれもAbcam、マサチューセッツ州ケンブリッジより入手可能)を用いて一次抗体標識を可視化した。このインキュベート期間の途中で、Hoechst33258(Sigma-Aldrich、94403)を各試料中に最終希釈1:250でスパイクした。切片をその後室温で振盪しながら1xPBS中で一夜洗浄した。画像化用にマウントする前に、スライスを、室温で振盪しながら、1時間、RIMS(屈折率整合溶液:Histodenz75g、0.1Mリン酸緩衝液20mL、ddH2O 60mL)中でインキュベートした。Fluoromount G Mounting Medium(Electron Microscopy Sciences、米国ペンシルベニア州ハットフィールド)を用い、カバースリップ(例えば、VistaVision(商標)、VWR International,LLC、ペンシルベニア州ラドナーより入手可能)とともに組織切片を顕微鏡のスライドにマウントした。画像を、Zen Black 2.1ソフトウェア(Carl Zeiss Microscopy、ドイツ、イエナ)付随のZeiss(商標)LSM 880顕微鏡で取得した。3-D復元に用いる断面の概観及び細胞レベルの画像をPlan-Apochromat63x/1.4 Oil DIC対物レンズを用いて撮影した。Imarisx64 8.1.2(Bitplane(商標)(スイス、チューリヒ))を3-Dレンダリング及び分析に用いた。
CLARITY
Fixed brains were sliced into 100 uM coronal sections in 1X PBS with a vibratome (eg, Leica VT100S, Leica Biosystems, available from Buffalo Grove, IL). Sections containing the visual cortex were selected with reference to the Allen Mouse Brain Atlas and treated with clearing buffer (pH 8.5-9.0,
ウェスタンブロット
海馬CA1全細胞溶解物は、3か月齢の雄5XFAD/PV-Creマウスの組織を用いて調製した。組織を手動式ホモジナイザー(Sigma-Aldrich(ミズーリ州セントルイス))を用いて1mlのRIPA(Tris HCl pH8.0 50mM、NaCl 150mM、Np-40 1%、デオキシコール酸ナトリウム0.5%、SDS0.1%)緩衝液中でホモジナイズし、氷上で15分間インキュベートし、4℃で30分間回転させた。14,000rpmで10分間の遠心分離により細胞残屑を単離し廃棄した。溶解物を、ナノドロップを用いて定量化し、25μgのタンパク質を10%アクリルアミドゲルにロードした。100Vで120分間、タンパク質をアクリルアミドゲルからPVDF膜(例えば、Invitrogen(商標)、Thermo Fisher Scientific、マサチューセッツ州ウォルサムより入手可能)に移した。TBS:Tweenで希釈したウシ血清アルブミン(5%w/v)を用いて膜をブロックした。膜を一次抗体中、4℃で一夜、及び二次抗体中、室温で90分間インキュベートした。一次抗体は、抗APP(Invitrogen(商標)PAD CT695、Thermo Fisher Scientific、マサチューセッツ州ウォルサムより入手可能)、抗APP(A8967、Sigma-Aldrich、ミズーリ州セントルイスより入手可能)、抗βアクチン(ab9485、Abcam、マサチューセッツ州ケンブリッジより入手可能)であった。二次抗体は、西洋ワサビペルオキシダーゼ結合(例えば、GE Healthcare、マサチューセッツ州モールバラより入手可能)であった。シグナル強度は、ImageJ 1.46aを用いて定量化し、βアクチンの値に対して正規化した。タウタンパク質の溶解性は、順次タンパク質抽出を用いて調べた。界面活性剤不溶性タウ画分は、Tau5に対する抗体(例えば、AHB0042、Thermo Fisher Scientific、マサチューセッツ州ウォルサムより入手可能)を用いてプローブした。
Western Blot Hippocampal CA1 whole cell lysates were prepared using tissue from 3 month old male 5XFAD/PV-Cre mice. Tissues were homogenized with 1 ml of RIPA (Tris HCl pH 8.0 50 mM,
ELISA
海馬CA1またはVCを雄のマウスから単離し、PBSまたは5MのグアニジンHClで溶解し、マウス/ヒトAβ1-40またはAβ1-42ELISAキット(例えば、Invitrogen(商標)、Thermo Fisher Scientific、マサチューセッツ州ウォルサムより入手可能)を用い、製造業者の取扱説明書に従ってAβ測定に供した。組織はリン酸緩衝生理食塩水(PBS)中で溶解し、PBS可溶性Aβ画分を抽出した。この可溶性Aβ画分は、恐らくモノマー及びオリゴマーのAβを含んでいた。組織をさらにグアニジン塩酸(HCl)で処理し、不溶性Aβ画分を抽出した。
ELISA
Hippocampal CA1 or VC were isolated from male mice, lysed with PBS or 5M guanidine HCl and analyzed using mouse/human Aβ 1-40 or Aβ 1-42 ELISA kits (eg, Invitrogen™, Thermo Fisher Scientific, MA). available from Waltham) and was subjected to Aβ measurements according to the manufacturer's instructions. Tissues were lysed in phosphate-buffered saline (PBS) and the PBS-soluble Aβ fraction was extracted. This soluble Aβ fraction presumably contained monomeric and oligomeric Aβ. The tissue was further treated with guanidine hydrochloride (HCl) to extract the insoluble Aβ fraction.
ゲノムワイドRNAシークエンシング
RNeasy(登録商標)キット(Qiagen、ドイツ、ヒルデンより入手可能)を用いて、海馬CA1単離物から全RNAを抽出した。BIOO NEXTflex(商標)キット(BIOO番号5138-08)を製造業者の取扱説明書の通りに用いるRNA-seqライブラリの調製用に、精製mRNAを用いた。簡潔には、全mRNA1μgを、ポリA精製、断片化、第一のフレックスストランド及び第二のストランド合成、DNA末端アデニル化、ならびにアダプターライゲーションの連続ワークフローに供した。これらライブラリは、15サイクルのPCR反応により濃縮し、Agencourt(登録商標)AMPure XP磁気ビーズ(Beckman Coulter Genomics、マサチューセッツ州ダンバーズより入手可能)で洗浄した。ライブラリの品質は、Advanced Analytical-fragment Analyzerを用いて評価した。バーコード化されたライブラリは、MIT BioMicro Center(マサチューセッツ工科大学、マサチューセッツ州ケンブリッジ)にて、Illumina HiSeq 2000プラットフォームの単一のレーンにおけるシークエンシングのため、均等に混合した。50塩基対シングルエンドシークエンシングリードの生fastqデータを、TopHat2.0ソフトウェア(ジョンズ/ホプキンス大学、メリーランド州ボルチモアの計算生物学センターより入手可能、RNA-seqリードを哺乳類サイズのゲノムに対して、超高スループットショートリードアライナBowtieを用いて整列させ、その後マッピングの結果を分析してエクソン間のスプライス部位を特定するため)を用いてマウスmm9参照ゲノムに対して整列させた。マッピングされたリードをCufflinks2.2ソフトウェア(ワシントン大学Trapnell Lab、ワシントン州シアトルより入手可能)により、UCSCmm9参照遺伝子注釈で処理し、転写物の存在量を推定し、差次的発現を調べた。転写物の相対的存在量は、マッピングされた100万断片当たりのエクソンのキロベース当たりの断片(FPKM)で測定した。処理及び未処理群間の遺伝子の差次的発現試験は、Cuffdiffモジュール(転写物の発現、スプライシング、及びプロモーターの使用における有意な変化を見つけるため。Cufflinks2.2ソフトウェア(ワシントン大学Trapnell Lab、ワシントン州シアトルより入手可能)の一部として含まれる)を用い、統計的有意性に対する調整p値<0.05で実施した(GEO登録:GSE77471)。
Genome-Wide RNA Sequencing Total RNA was extracted from hippocampal CA1 isolates using the RNeasy® kit (available from Qiagen, Hilden, Germany). Purified mRNA was used for RNA-seq library preparation using the BIOO NEXTflex™ kit (BIOO #5138-08) according to the manufacturer's instructions. Briefly, 1 μg of total mRNA was subjected to a sequential workflow of polyA purification, fragmentation, first flex-strand and second-strand synthesis, DNA terminal adenylation, and adapter ligation. These libraries were enriched by 15 cycles of PCR reactions and washed with Agencourt® AMPure XP magnetic beads (Beckman Coulter Genomics, Danvers, MA). Library quality was assessed using an Advanced Analytical-fragment Analyzer. Barcoded libraries were evenly mixed for sequencing in a single lane on an Illumina HiSeq 2000 platform at the MIT BioMicro Center (Massachusetts Institute of Technology, Cambridge, MA). Raw fastq data of 50 base-pair single-end sequencing reads were generated using TopHat 2.0 software (available from Center for Computational Biology, Johns/Hopkins University, Baltimore, Md.). Aligned using the ultra-high-throughput short-read aligner Bowtie, followed by analysis of the mapping results to identify splice sites between exons) against the mouse mm9 reference genome. Mapped reads were processed with UCSCmm9 reference gene annotation by Cufflinks 2.2 software (available from Trapnell Lab, University of Washington, Seattle, WA) to estimate transcript abundance and examine differential expression. Relative abundance of transcripts was measured in fragments per kilobase of exons per million fragments mapped (FPKM). Differential expression studies of genes between treated and untreated groups were performed using the Cuffdiff module (to find significant changes in transcript expression, splicing, and promoter usage. Cufflinks 2.2 software (Trapnell Lab, University of Washington, WA). available from Seattle) and was performed with an adjusted p-value <0.05 for statistical significance (GEO entry: GSE77471).
RNA-seqデータから細胞及び分子機序を理解するため、14の公開されているRNA-seqデータセットを細胞型特異的分析用に処理した。さらに、60の公開されている異なる化学的及び遺伝的摂動下でのニューロン、ミクログリア、ならびにマクロファージ特異的RNA-seqデータセットをダウンロードし、GSEA統計分析用に、TopHat Cufflinks2.2ソフトウェア(ワシントン大学Trapnell Lab、ワシントン州シアトルより入手可能)を用いて処理した。遺伝子セットエンリッチメント解析(GSEA)を用いて、RNA-seqデータからの定義された遺伝子セットが、特定の摂動試験からのランク付けされた遺伝子リストのいずれかの方向で有意に濃縮されるかどうかを判定した。公開されているRNA-seqデータセットにおいて検出された遺伝子を発現比(症例対対照)のlog2値によって正から負の値にランク付けした。定義された遺伝子セット(この場合、ガンマ処理での上方または下方制御された遺伝子)は、名目上のp値及びFDRのq値がいずれも0.05未満の場合、摂動に誘導されたトランスクリプトーム的変化(上方または下方制御のいずれか)と有意に相関すると考えられた。計算された正規化エンリッチメントスコア(NES)の符号は、遺伝子セットがランク付けされたリストの上位または下位で濃縮されるかどうかを示す。差次的に発現される遺伝子のヒートマップは、カスタムRスクリプトを用いて生成し、各遺伝子に対するすべてのライブラリににわたるzスコア値を、遺伝子FPKM値を基に計算した。細胞型特異性分析に対する箱ひげ図もまた、遺伝子FPKM値を基にRプログラムによって生成した。 To understand cellular and molecular mechanisms from RNA-seq data, 14 publicly available RNA-seq datasets were processed for cell type-specific analysis. In addition, neuron-, microglia-, and macrophage-specific RNA-seq datasets under 60 different published chemical and genetic perturbations were downloaded and analyzed using TopHat Cufflinks 2.2 software (University of Washington Trapnell) for GSEA statistical analysis. Lab, Seattle, WA). Using Gene Set Enrichment Analysis (GSEA), whether defined gene sets from RNA-seq data are significantly enriched in either direction of the ranked gene list from a particular perturbation test was judged. Genes detected in the public RNA-seq dataset were ranked from positive to negative by the log2 value of the expression ratio (cases versus controls). A defined set of genes (in this case, genes that were up- or down-regulated on gamma treatment) were found to have perturbation-induced transcripts if both the nominal p-value and the FDR q-value were less than 0.05. It appeared to correlate significantly with tomic changes (either up- or down-regulated). The sign of the calculated normalized enrichment score (NES) indicates whether the gene set is enriched at the top or bottom of the ranked list. A heatmap of differentially expressed genes was generated using a custom R script and z-score values across all libraries for each gene were calculated based on gene FPKM values. Box plots for cell type specificity analysis were also generated by the R program based on the gene FPKM values.
定量的RT-PCR
CA1は、3か月齢の雄5XFAD/PV-Creマウスの海馬から単離した。液体窒素を用いて組織を急速に凍結し、-80℃で保存し、製造業者のプロトコル(Qiagen(ドイツ、ヒルデン))に従ってRNeasyキットを用いてRNAを抽出した。RNA(3μg)をDNase Iで処理し(4U、Worthington Biochemical Corporation(ニュージャージー州レークウッド))、RNA Clean及びConcentrator-5キット(Zymo Research(カリフォルニア州アーバイン))を用い、製造業者の取扱説明書に従って精製し、14μlのDEPC処理水で溶出した。各試料について、ランダムヘキサマー混合物及びSuperscript III逆転写酵素(50U、Invitrogen(商標)、Thermo Fisher Scientific、マサチューセッツ州ウォルサムより入手可能)を含む20μlの反応体積中、50℃で1時間、1μgのRNAを逆転写した。第一ストランドcDNAを1:10に希釈し、1μlを、プライマー(0.2μM)を含む20μlの反応物(SsoFast(商標)EvaGreen(登録商標)Supermix、Bio-Rad)中でのRT-qPCR増幅に用いた。遺伝子発現の相対的変化を2-ΔΔCt法を用いて評価した。
Quantitative RT-PCR
CA1 was isolated from the hippocampus of 3-month-old male 5XFAD/PV-Cre mice. Tissues were rapidly frozen using liquid nitrogen, stored at −80° C., and RNA was extracted using the RNeasy kit according to the manufacturer's protocol (Qiagen, Hilden, Germany). RNA (3 μg) was treated with DNase I (4 U, Worthington Biochemical Corporation, Lakewood, NJ) using RNA Clean and Concentrator-5 kits (Zymo Research, Irvine, CA) according to the manufacturer's instructions. Purified and eluted with 14 μl of DEPC-treated water. For each sample, 1 μg of RNA was incubated at 50° C. for 1 hour in a 20 μl reaction volume containing a random hexamer mixture and Superscript III reverse transcriptase (50 U, available from Invitrogen™, Thermo Fisher Scientific, Waltham, MA). was reverse transcribed. First-strand cDNA was diluted 1:10 and 1 μl was RT-qPCR amplified in a 20 μl reaction (SsoFast™ EvaGreen® Supermix, Bio-Rad) containing primers (0.2 μM). used for Relative changes in gene expression were assessed using the 2- ΔΔCt method.
視覚野からのミクログリアの単離。V1領域を迅速に切断し、氷冷ハンクス平衡塩類溶液(HBSS)(Gibco(商標)14175-095、Life Technologiesより入手可能)に入れた。この組織を次に、製造業者のプロトコルにわずかな改変を加えて従い、神経組織解離キット(P)(130-092-628、Miltenyi Biotec、マサチューセッツ州ケンブリッジ)を用いて酵素的に消化した。具体的には、組織を35分間の代わりに15分間、37℃で酵素的に消化し、得られた細胞懸濁液を、MACS(登録商標)SmartStrainer、70μmの代わりに40μmの細胞濾過器(352340、Falcon Cell Strainers,Sterile、ニューヨーク州コーニング)を通した。得られた細胞懸濁液をその後アロフィコシアニン(APC)コンジュゲートCD11bマウスクローンM1/70.15.11.5(130-098-088、Miltenyi Biotec、マサチューセッツ州ケンブリッジ)及びフィコエリトリン(PE)コンジュゲートCD45抗体(例えば、BD Pharmingen(商標)、553081)を用いて染色した。蛍光活性化細胞分類(FACS)を次に用いてCD11b及びCD45陽性ミクログリア細胞を精製した。これらの細胞は直接1XPBSに分取した(例えば、図52A参照)。 Isolation of microglia from visual cortex. The V1 region was rapidly cut and placed in ice-cold Hank's Balanced Salt Solution (HBSS) (Gibco™ 14175-095, available from Life Technologies). This tissue was then enzymatically digested using the Neural Tissue Dissociation Kit (P) (130-092-628, Miltenyi Biotec, Cambridge, MA) following the manufacturer's protocol with minor modifications. Specifically, the tissue was enzymatically digested at 37° C. for 15 minutes instead of 35 minutes, and the resulting cell suspension was filtered through a MACS® SmartStrainer, 40 μm instead of 70 μm cell strainer ( 352340, Falcon Cell Strainers, Sterile, Corning, NY). The resulting cell suspension was then treated with allophycocyanin (APC)-conjugated CD11b mouse clone M1/70.15.11.5 (130-098-088, Miltenyi Biotec, Cambridge, MA) and phycoerythrin (PE)-conjugated CD45. Antibodies (eg, BD Pharmingen™, 553081) were used for staining. Fluorescence activated cell sorting (FACS) was then used to purify CD11b and CD45 positive microglial cells. These cells were sorted directly into 1XPBS (see, eg, Figure 52A).
統計
正規分布しなかった電気生理学的データについては、別段の記載がない限り、結果は中央値及び四分位数として示した。等しい中央値に対する両側ウィルコクソン順位和検定を実施し、分布が有意に異なるかどうかを判定したか、または、ウィルコクソン符号順位検定を実施し、これらが、データが正規分布していると仮定しない場合に分布がゼロから有意差があるかどうかを判定した。ばらつきは、統計的に比較された群間で同様であった。ボンフェローニの方法を用いて多重比較を補正した。分子及び生化学的結果を平均及びSEMで示す。本開示に記載のパーセンテージは群平均である。すべての統計分析は、Prism GraphPadソフトウェア(GraphPad software Inc.、カリフォルニア州ラ・ホーヤ)を用いて実施した。正規性はD’Agostino&Pearsonオムニバス正規性検定を用いて判定した。ばらつきは、統計的に比較された群間で同様であった。2群からなる正規分布したデータに対する比較データは、両側独立t検定によって分析した。3群以上からなる正規分布したデータに対する比較データは、一元配置分散分析に続いてテューキーの多重比較検定によって分析した。非正規分布データに関する比較データは、マン・ホイットニー検定を用いて行った。各実験についての統計検定、正確なP値、及びサンプルサイズ(n)を図の凡例に明記する。分子及び生化学的分析を、条件当たり最低3回の生物学的反復を用いて実施した。
Statistics For electrophysiological data that were not normally distributed, results were presented as medians and quartiles unless otherwise stated. A two-tailed Wilcoxon rank sum test for equal medians was performed to determine whether the distributions differed significantly, or a Wilcoxon signed rank test was performed to determine if the data were not normally distributed. It was determined whether the distribution was significantly different from zero. The variability was similar between statistically compared groups. Multiple comparisons were corrected using the method of Bonferroni. Molecular and biochemical results are presented as mean and SEM. Percentages given in this disclosure are group means. All statistical analyzes were performed using Prism GraphPad software (GraphPad software Inc., La Jolla, Calif.). Normality was determined using the D'Agostino & Pearson omnibus normality test. The variability was similar between statistically compared groups. Comparative data for two groups of normally distributed data were analyzed by two-tailed unpaired t-test. Comparative data for normally distributed data consisting of 3 or more groups were analyzed by one-way ANOVA followed by Tukey's multiple comparison test. Comparative data for non-normally distributed data were performed using the Mann-Whitney test. Statistical tests, exact P-values, and sample sizes (n) for each experiment are specified in the figure legends. Molecular and biochemical analyzes were performed using a minimum of 3 biological replicates per condition.
聴覚ガンマ刺激生成
MATLAB(登録商標)プログラミング言語(MathWorks、マサチューセッツ州ナティックより入手可能)に構成される以下のスクリプトは、いくつかの実施形態に従って聴覚クリック・トレイン刺激を生成する1つの方法を示す:

Auditory Gamma Stimulus Generation The following script, constructed in the MATLAB® programming language (MathWorks, available from Natick, MA), demonstrates one method of generating auditory click train stimuli according to some embodiments:
結論
様々な発明に関する実施形態を本明細書に記載及び説明してきたが、当業者には、本明細書に記載の機能を実行し、及び/またはその結果及び/または1つ以上の利点を獲得するための様々な他の方法及び/または構造が容易に想起されるとともに、かかる変化及び/または修正の各々は、本明細書に記載の本発明の実施形態の範囲内であると見なされる。より一般的には、当業者には、本明細書に記載のすべてのパラメータ、寸法、材料、及び構成が例示的であることを意図し、実際のパラメータ、寸法、材料、及び/または構成は、本発明の開示が用いられる特定の用途または複数の用途に依存するということが容易に理解されよう。当業者は、従来の実験だけを用いて、本明細書に記載の特定の発明に関する実施形態の多くの等価物を認識し、またはこれらを確認することができるであろう。従って、前述の実施形態が単なる例示として提示され、添付の特許請求の範囲及びその等価物の範囲内で、発明に関する実施形態が、具体的に記載され、請求される以外の方法で実施され得ることを理解されたい。本開示の発明に関する実施形態は、本明細書に記載の個々の特徴、システム、物品、材料、キット、及び/または方法に関する。さらに、かかる特徴、システム、物品、材料、キット、及び/または方法の2つ以上の組合せは、かかる特徴、システム、物品、材料、キット、及び/または方法が互いに矛盾しない限り、本開示の発明の範囲内に含まれる。
CONCLUSION While various inventive embodiments have been described and illustrated herein, it is apparent to those skilled in the art that the functions described herein may be performed and/or the results and/or advantages thereof obtained and/or obtained one or more of the advantages. Various other methods and/or structures for doing so are readily envisioned, and each such change and/or modification is considered within the scope of the embodiments of the invention described herein. More generally, it is intended to those skilled in the art that all parameters, dimensions, materials and configurations described herein are intended to be exemplary, and actual parameters, dimensions, materials and/or configurations may be It will be readily understood that the present disclosure will depend on the particular application or applications for which it is employed. Those skilled in the art will recognize, or be able to ascertain using no more than routine experimentation, many equivalents to the specific inventive embodiments described herein. Thus, the foregoing embodiments are presented by way of illustration only, and within the scope of the appended claims and equivalents thereof, embodiments of the invention may be practiced other than as specifically described and claimed. Please understand. Inventive embodiments of the present disclosure are directed to each individual feature, system, article, material, kit, and/or method described herein. Moreover, combinations of two or more of such features, systems, articles, materials, kits, and/or methods may not be combined within the scope of the presently disclosed invention unless such features, systems, articles, materials, kits, and/or methods contradict each other. included within the scope of
上記実施形態は、多くの方法のいずれかで実行することができる。例えば、本明細書に記載の実施形態は、ハードウェア、ソフトウェア、またはそれらの組合せを用いて実行してもよい。ソフトウェアで実行する場合、該ソフトウェアのコードは、単一のコンピュータに設けられていようと複数のコンピュータに分配されていようと、任意の適切なプロセッサまたは一群のプロセッサで実行することができる。 The above embodiments can be implemented in any of a number of ways. For example, embodiments described herein may be implemented using hardware, software, or a combination thereof. When implemented in software, the software code can be executed on any suitable processor or group of processors, whether located on a single computer or distributed among multiple computers.
さらに、コンピュータは、複数の形態のいずれか、例えば、ラックマウント型コンピュータ、デスクトップ型コンピュータ、ラップトップ型コンピュータ、またはタブレット型コンピュータで具体化され得ることを理解されたい。加えて、コンピュータは、個人用デジタル補助装置(PDA)、スマートフォン、または任意の他の適切な携帯用もしくは固定電子デバイスを含めた一般にはコンピュータと見なされないが適切な処理能力がある装置に埋め込まれてもよい。 Further, it should be appreciated that a computer may be embodied in any of a number of forms, such as a rack-mount computer, desktop computer, laptop computer, or tablet computer. Additionally, a computer may be embedded in any device not generally considered a computer but with suitable processing power, including a personal digital assistant (PDA), smart phone, or any other suitable portable or stationary electronic device. may be
また、コンピュータは、1つ以上の入力及び出力装置を有し得る。これらの装置を用いて、とりわけ、ユーザインタフェースを提供することができる。ユーザインタフェースを提供するために用いることができる出力装置の例としては、出力の視覚的提示用のプリンタまたは表示画面、及び出力の可聴提示用のスピーカまたは他の音声発生装置が挙げられる。ユーザインタフェースのために用いることができる入力装置の例としては、キーボード、ポインティング・デバイス、例えば、マウス、タッチパッド、及び離散化タブレットが挙げられる。別の例として、コンピュータは、入力情報を音声認識を介して、または他の可聴形式で受信してもよい。 Also, a computer may have one or more input and output devices. These devices can be used, among other things, to provide a user interface. Examples of output devices that can be used to provide the user interface include a printer or display screen for visual presentation of output and speakers or other sound producing devices for audible presentation of output. Examples of input devices that can be used for user interface include keyboards, pointing devices such as mice, touch pads, and discretizing tablets. As another example, a computer may receive input information via speech recognition or in other audible form.
かかるコンピュータは、ローカルエリア・ネットワークまたは広域ネットワーク、例えば、企業ネットワーク、及びインテリジェント・ネットワーク(IN)またはインターネットを含めた任意の適切な形態の1つ以上のネットワークで相互接続されてもよい。かかるネットワークは、任意の適切な技術に基づいていてもよく、任意の適切なプロトコルに従って作動してもよく、無線ネットワーク、有線ネットワーク、または光ファイバー・ネットワークを含んでもよい。 Such computers may be interconnected by one or more networks of any suitable form, including local or wide area networks, eg, enterprise networks, and intelligent networks (IN) or the Internet. Such networks may be based on any suitable technology, may operate according to any suitable protocol, and may include wireless networks, wired networks, or fiber optic networks.
本明細書で概説した様々な方法またはプロセスは、様々なオペレーティング・システムまたはプラットフォームのいずれか1つを使用する1つ以上のプロセッサで実行可能なソフトウェアとしてコード化され得る。さらに、かかるソフトウェアは、複数の適切なプログラミング言語及び/またはプログラミングもしくはスクリプト作成ツールのいずれかを用いて書かれてもよく、また、フレームワークもしくは仮想計算機上で実行される、実行可能な機械語コードまたは中間コードとしてコンパイルされ得る。 The various methods or processes outlined herein can be coded as software executable by one or more processors using any one of a variety of operating systems or platforms. In addition, such software may be written using any of a number of suitable programming languages and/or programming or scripting tools, and may be executable machine language code executed on a framework or virtual machine. It can be compiled as code or intermediate code.
また、様々な発明に関する概念は、例が提供されている1つ以上の方法として具体化されてもよい。該方法の一部として実行される行為は、任意の適切な方法で順序付けられ得る。従って、行為が説明されているものと異なる順序で実行される実施形態が構成されてもよく、これは、例示的な実施形態では連続的な行為として示されていても、いくつかの行為を同時に実行することを含んでもよい。 Additionally, various inventive concepts may be embodied in one or more methods, examples of which are provided. The acts performed as part of the method may be ordered in any suitable manner. Thus, embodiments may be constructed in which the acts are performed in a different order than described, which means that some acts are performed even though the exemplary embodiment shows them as sequential acts. It may include executing concurrently.
本明細書で言及するすべての刊行物、特許出願、特許、及びその他の参考文献は、参照することによりそれらの全体が組み込まれる。 All publications, patent applications, patents, and other references mentioned herein are incorporated by reference in their entirety.
本明細書で定義され使用されるすべての定義は、辞書的定義、参照により組み込まれる文書における定義、及び/または定義された用語の通常の意味を制御すると理解されたい。 All definitions defined and used herein are to be understood to control dictionary definitions, definitions in documents incorporated by reference, and/or ordinary meaning of the defined terms.
本明細書及び特許請求の範囲において使用される不定冠詞「a」ならびに「an」は、それと異なるように明確に示されない限り、「少なくとも1つ」を意味すると理解されたい。 As used in this specification and claims, the indefinite articles "a" and "an" are understood to mean "at least one," unless clearly indicated to the contrary.
本明細書及び特許請求の範囲において使用される「及び/または」という表現は、そのように結合された要素の「いずれかまたは両方」を意味すること、すなわち、ある場合には接続的に存在し、他の場合には離接的に存在する要素を意味することを理解されたい。「及び/または」とともに列挙される複数の要素は、同じように、すなわち、そのように結合された要素の「1つ以上」と解釈されるべきである。「及び/または」の節によって明確に同定された要素以外に、明確に同定されたそれらの要素と関連していても関連していなくても、他の要素が任意に含まれる場合がある。従って、非限定的な例として、「含む」等のオープンエンドの用語と併せて用いられた場合、「A及び/またはB」への言及は、1つの実施形態では、Aのみ(B以外の要素を任意に含む)、別の実施形態では、Bのみ(A以外の要素を任意に含む)、さらに別の実施形態では、AとBの両方(他の要素を任意に含む)、等を指すことができる。 As used herein and in the claims, the term "and/or" means "either or both" of the elements so conjoined; is understood to mean disjunctive elements in other cases. Multiple elements listed with "and/or" should be construed in the same fashion, ie, "one or more" of the elements so conjoined. Other elements may optionally be included other than the elements expressly identified by the "and/or" clause, whether related or unrelated to those elements expressly identified. Thus, as a non-limiting example, when used in conjunction with open-ended terms such as "comprising," a reference to "A and/or B" is, in one embodiment, A only (other than B). optionally including elements), in another embodiment only B (optionally including elements other than A), in yet another embodiment both A and B (optionally including other elements), etc. can point.
本明細書及び特許請求の範囲において使用される「または」は、上で定義した「及び/または」と同じ意味を有すると理解されたい。例えば、リスト内の項目を分離する場合、「または」もしくは「及び/または」は、包括的、すなわち、複数の要素または要素のリストの少なくとも1つであるが、同様に複数、及び任意にリストにないさらなる項目の包含として解釈されるものとする。それとは異なるように明確に示される限定用語、例えば、「1つだけの」もしくは「厳密に1つの」または、特許請求の範囲で使用される場合、「~からなる」は、例えば、複数の要素または要素のリストのうちの厳密に1つの要素の包含と見なす。一般に、本明細書で使用される「または」という用語は、排他的な用語、例えば、「いずれか」、「1つの」、「ただ1つの」、または「厳密に1つの」が先行する場合、排他的な選択肢(すなわち、「一方または他方であるが両方でない」)を示すと解釈されるのみとする。特許請求の範囲で使用される場合、「本質的に~からなる」は、特許法の分野で使用されるその通常の意味を有するものとする。 As used herein and in the claims, "or" should be understood to have the same meaning as "and/or" as defined above. For example, when separating items in a list, "or" or "and/or" is inclusive, i.e., at least one of a plurality of elements or a list of elements, but also a plurality, and optionally a list shall be construed as the inclusion of further items not found in A qualifier expressly indicated to the contrary, such as "only one" or "exactly one" or "consisting of" when used in the claims, is, for example, a plurality of Considers the containment of exactly one element in an element or list of elements. In general, the term "or" as used herein, when preceded by an exclusive term, e.g., "any", "one", "exactly one", or "exactly one" , shall only be construed to indicate exclusive alternatives (ie, "one or the other but not both"). As used in the claims, "consisting essentially of" shall have its ordinary meaning as used in the field of patent law.
本明細書及び特許請求の範囲において使用される、1つ以上の要素のリストを参照した「少なくとも1つ」という表現は、要素のリスト内の任意の1つ以上の要素から選択される少なくとも1つの要素であるが、必ずしも要素のリスト内に具体的に記載されたありとあらゆる要素の少なくとも1つを含まず、要素のリスト内の任意の要素の組合せを排除しないことを意味すると理解されたい。この定義はまた、「少なくとも1つ」という表現が言及する要素のリスト内で明確に同定された要素以外に、明確に同定された要素に関連しているか関連していないかにかかわらず、要素が任意に含まれる場合があることを許可する。従って、非限定的な例として、「A及びBのうちの少なくとも1つ」(または、同等に、「AまたはBのうちの少なくとも1つ」もしくは同等に「A及び/またはBのうちの少なくとも1つ」)は、1つの実施形態では、少なくとも1つの、任意に複数を含めて、AでBを含まず(任意にB以外の要素を含む)、別の実施形態では、少なくとも1つの、任意に複数を含めて、BでAを含まず(任意にA以外の要素を含む)、さらに別の実施形態では、少なくとも1つの、任意に複数を含めて、A及び少なくとも1つの、任意に複数を含めて、B(任意に他の要素を含む)、等を指すことができる。 As used herein and in the claims, the phrase "at least one" with reference to a list of one or more elements means at least one element selected from any one or more elements in the list of elements. It should be understood to mean one element, but not necessarily including at least one of every and every element specifically recited in the list of elements and not excluding any combination of any element in the list of elements. This definition also applies to elements other than those specifically identified in the list of elements to which the phrase "at least one" refers, whether or not they relate to the specifically identified elements. Allows for optional inclusion. Thus, as a non-limiting example, "at least one of A and B" (or equivalently "at least one of A or B" or equivalently "at least one of A and/or B "a") means, in one embodiment, at least one, optionally including a plurality, A and excluding B (optionally including elements other than B), and in another embodiment, at least one, (optionally including elements other than A) in B, optionally including a plurality, and in yet another embodiment, at least one, optionally including a plurality, of A and at least one, optionally Inclusive of plurals, it may refer to B (optionally including other elements), and the like.
特許請求の範囲において、ならびに上記明細書において、すべての移行句、例えば、「comprising(含む)」、「including(含む)」、「carrying(有する)」、「having(有する)」、「containing(含む)」、「involving(含む)」、「保持する」、「composed of(~からなる)」等は、オープンエンドである、すなわち、~を含むがこれに限定されないということを意味すると理解されるべきである。米国特許局特許審査便覧、第2111.03条に記載の通り、移行句「consisting of(~からなる)」及び「consisting essentially of(~から本質的になる)」のみが、クローズドまたはセミクローズドの移行句であるものとする。 In the claims, as well as in the above specification, all transitional phrases such as "comprising", "including", "carrying", "having", "containing" "including", "involving", "holding", "composed of", etc. are understood to mean open-ended, i.e., including but not limited to should. Only the transitional phrases "consisting of" and "consisting essentially of" are the only closed or semi-closed Shall be a transitional clause.
Claims (72)
前記装置は、
約35Hz~約45Hzの間の周波数で非侵襲的刺激を放出することができ、及び、
前記対象に前記非侵襲的刺激を投与して、前記対象の少なくとも1つの脳領域において、周波数約35Hz~約45Hzを有する同期ガンマ振動を誘導することにより、前記対象における認知症を治療することができる、
前記装置。 A device for treating dementia in a subject in need thereof, comprising:
The device comprises:
capable of emitting a non-invasive stimulus at a frequency between about 35 Hz and about 45 Hz; and
administering said non-invasive stimulus to said subject to induce synchronized gamma oscillations having a frequency of about 35 Hz to about 45 Hz in at least one brain region of said subject to treat dementia in said subject. can,
said device.
前記装置は、
約35Hz~約45Hzの間の周波数で刺激を放出することができ、及び、
前記対象に、前記対象の少なくとも1つの脳領域において周波数約35Hz~約45Hzを有する同期ガンマ振動を誘導するために少なくとも1つの刺激を投与して、前記対象の少なくとも1つの脳領域におけるアミロイドβ(Aβ)ペプチド量を維持又は低減し、それによって前記対象における認知症を治療することができる、
前記装置。 A device for treating dementia in a subject in need thereof, comprising:
The device comprises:
capable of emitting stimulation at a frequency between about 35 Hz and about 45 Hz; and
administering to said subject at least one stimulus to induce synchronous gamma oscillations having a frequency of about 35 Hz to about 45 Hz in at least one brain region of said subject; capable of maintaining or reducing Aβ) peptide levels, thereby treating dementia in said subject;
said device.
前記装置は、
前記対象に周波数約35Hz~約45Hzを有する視覚又は聴覚信号を非侵襲的に送出して、前記対象の少なくとも1つの脳領域において同期ガンマ振動を誘導することにより、前記対象におけるアルツハイマー病を治療することができる、
前記装置。 A device for treating Alzheimer's disease in a subject in need thereof, comprising:
The device comprises:
Treating Alzheimer's disease in said subject by non-invasively delivering visual or auditory signals having a frequency of about 35 Hz to about 45 Hz to said subject to induce synchronized gamma oscillations in at least one brain region of said subject be able to,
said device.
前記対象を複数の光パルスで刺激し、それにより前記対象の視覚野に同期ガンマ振動を誘導すること;又は前記対象を複数の音パルスで刺激し、それにより前記対象の海馬及び/又は聴覚野に前記同期ガンマ振動を誘導することを含む、請求項17に記載の装置。 sending said visual or auditory signal to said subject;
stimulating said subject with multiple light pulses, thereby inducing synchronous gamma oscillations in said subject's visual cortex; or stimulating said subject with multiple sound pulses, thereby causing said subject's hippocampus and/or auditory cortex. 18. The apparatus of claim 17, comprising inducing the synchronous gamma oscillations to .
信号を生成する信号生成器;及び
前記信号生成器に結合され、前記信号生成器により生成された前記信号に基づき、対象に刺激を非侵襲的に投与して、前記対象の少なくとも1つの脳領域において同期ガンマ振動を誘導する、放出体
を含む、請求項17~39のいずれかに記載の装置。 said device comprising:
a signal generator for generating a signal; and coupled to said signal generator for non-invasively administering stimulation to a subject based on said signal generated by said signal generator to cause at least one brain region of said subject. A device according to any one of claims 17 to 39, comprising an emitter for inducing synchronous gamma oscillations in the.
前記発光装置が、前記対象の少なくとも一方の目に対する周囲光を低減するための光閉塞装置を含み、前記光閉塞装置が、前記対象の前記少なくとも一方の目に前記視覚信号を放出して、前記対象の視覚野及び海馬の少なくとも1つに同期ガンマ振動を誘導するための発光ユニットを含み、かつ
前記放音装置が、前記対象の少なくとも一方の耳に対する周囲騒音を低減するための雑音消去装置を含み、前記雑音消去装置が、前記対象の前記少なくとも一方の耳に前記聴覚信号を放出し、前記対象の聴覚野及び海馬の少なくとも1つに同期ガンマ振動を誘導するためのスピーカーユニットを含む、
請求項41に記載の装置。 the emitter comprises at least one of a light emitting device and a sound emitting device;
The light emitting device includes a light occlusion device for reducing ambient light to at least one eye of the subject, the light occlusion device emitting the visual signal to the at least one eye of the subject, and a lighting unit for inducing synchronous gamma oscillations in at least one of a subject's visual cortex and hippocampus, and said sound emitting device comprises a noise cancellation device for reducing ambient noise to at least one ear of said subject. wherein the noise cancellation device includes a speaker unit for emitting the auditory signal to the at least one ear of the subject and inducing synchronized gamma oscillations in at least one of the subject's auditory cortex and hippocampus;
42. Apparatus according to claim 41.
a)前記対象の少なくとも1つの脳領域におけるアミロイドβ(Aβ)ペプチド量を維持又は低減すること;
b)前記対象の少なくとも1つの脳領域における、ミクログリア細胞数を増大すること;神経保護状態と一致する前記ミクログリア細胞の形態学的変化を誘導すること;及び前記ミクログリア細胞の活性を促進すること;及び
c)前記対象の少なくとも1つの脳領域におけるタウリン酸化を低減すること
の1又は2以上を含む、請求項40に記載の装置。 delivering said visual or auditory signal to said subject to treat Alzheimer's disease;
a) maintaining or reducing amyloid-β (Aβ) peptide levels in at least one brain region of said subject;
b) increasing the number of microglial cells in at least one brain region of said subject; inducing a morphological change in said microglial cells consistent with a neuroprotective state; and promoting activity of said microglial cells; and c) reducing tau phosphorylation in at least one brain region of said subject.
前記信号生成器に結合され、前記信号生成器により生成された前記信号に基づき、対象に刺激を非侵襲的に投与して、前記刺激に応答して前記対象の少なくとも1つの脳領域において同期ガンマ振動を誘導する、放出体を含む、アルツハイマー病及び/又は認知症の治療のための装置。 a signal generator that produces a signal having a frequency of about 35 Hz to about 45 Hz; and coupled to said signal generator for non-invasively administering stimulation to a subject based on said signal produced by said signal generator. , a device for the treatment of Alzheimer's disease and/or dementia, comprising emitters that induce synchronized gamma oscillations in at least one brain region of said subject in response to said stimulus.
信号を生成する信号生成器;及び
前記信号生成器に結合され、前記信号生成器により生成された前記信号に基づき、対象に前記非侵襲的刺激を非侵襲的に投与して、前記対象の少なくとも1つの脳領域において同期ガンマ振動を誘導する、放出体;
を含む、請求項45~50のいずれかに記載の装置。 said device comprising:
a signal generator for generating a signal; and coupled to the signal generator for non-invasively administering the non-invasive stimulus to a subject based on the signal generated by the signal generator to cause at least emitters that induce synchronous gamma oscillations in one brain region;
51. The apparatus of any of claims 45-50, comprising a
を含む、請求項61に記載の装置。 wherein said light emitter is a solid state light source and at least one light emitting diode (LED)
62. The apparatus of claim 61, comprising:
前記発光体を制御して、前記対象を前記非侵襲的刺激としての光刺激に曝露することができる、請求項67に記載の装置。 the emitter is a light emitter,
68. The device of claim 67, wherein the light emitters can be controlled to expose the subject to light stimuli as the non-invasive stimuli.
前記放音体を制御して、前記対象を前記非侵襲的刺激としての音刺激に曝露することができる、請求項67に記載の装置。 the emitter is a sound emitter,
68. Apparatus according to claim 67, wherein the sound emitter can be controlled to expose the subject to a sound stimulus as the non-invasive stimulus.
前記触覚装置を制御して、前記対象を前記非侵襲的刺激としての触覚刺激に曝露することができる、請求項67に記載の装置。 said emitter is a haptic device;
68. The device of claim 67, wherein the haptic device can be controlled to expose the subject to tactile stimulation as the non-invasive stimulus.
信号を生成する信号生成器;及び
前記信号生成器に結合され、前記信号生成器により生成された前記信号に基づき、対象に刺激を非侵襲的に投与して、前記対象の少なくとも1つの脳領域において同期ガンマ振動を誘導する、放出体
を含む、請求項1~16のいずれかに記載の装置。 said device comprising:
a signal generator for generating a signal; and coupled to said signal generator for non-invasively administering stimulation to a subject based on said signal generated by said signal generator to cause at least one brain region of said subject. A device according to any preceding claim, comprising an emitter for inducing synchronous gamma oscillations in the.
Priority Applications (1)
| Application Number | Priority Date | Filing Date | Title |
|---|---|---|---|
| JP2021188541A JP2022020829A (en) | 2015-11-24 | 2021-11-19 | Systems and methods for the prevention, mitigation, and / or treatment of dementia |
Applications Claiming Priority (3)
| Application Number | Priority Date | Filing Date | Title |
|---|---|---|---|
| US201562259187P | 2015-11-24 | 2015-11-24 | |
| US62/259,187 | 2015-11-24 | ||
| PCT/US2016/063536 WO2017091698A1 (en) | 2015-11-24 | 2016-11-23 | Systems and methods for preventing, mitigating, and/or treating dementia |
Related Child Applications (1)
| Application Number | Title | Priority Date | Filing Date |
|---|---|---|---|
| JP2021188541A Division JP2022020829A (en) | 2015-11-24 | 2021-11-19 | Systems and methods for the prevention, mitigation, and / or treatment of dementia |
Publications (3)
| Publication Number | Publication Date |
|---|---|
| JP2019502429A JP2019502429A (en) | 2019-01-31 |
| JP2019502429A5 JP2019502429A5 (en) | 2020-09-10 |
| JP7204192B2 true JP7204192B2 (en) | 2023-01-16 |
Family
ID=58720012
Family Applications (3)
| Application Number | Title | Priority Date | Filing Date |
|---|---|---|---|
| JP2018525754A Active JP7204192B2 (en) | 2015-11-24 | 2016-11-23 | Systems and methods for preventing, reducing, and/or treating dementia |
| JP2021188541A Pending JP2022020829A (en) | 2015-11-24 | 2021-11-19 | Systems and methods for the prevention, mitigation, and / or treatment of dementia |
| JP2023083776A Pending JP2023101026A (en) | 2015-11-24 | 2023-05-22 | Systems and methods for preventing, reducing, and/or treating dementia |
Family Applications After (2)
| Application Number | Title | Priority Date | Filing Date |
|---|---|---|---|
| JP2021188541A Pending JP2022020829A (en) | 2015-11-24 | 2021-11-19 | Systems and methods for the prevention, mitigation, and / or treatment of dementia |
| JP2023083776A Pending JP2023101026A (en) | 2015-11-24 | 2023-05-22 | Systems and methods for preventing, reducing, and/or treating dementia |
Country Status (11)
| Country | Link |
|---|---|
| US (6) | US10265497B2 (en) |
| EP (2) | EP4218916B1 (en) |
| JP (3) | JP7204192B2 (en) |
| KR (3) | KR102603963B1 (en) |
| CN (2) | CN115569282A (en) |
| AU (3) | AU2016361503B2 (en) |
| CA (1) | CA3003183A1 (en) |
| DK (1) | DK3383482T3 (en) |
| ES (1) | ES2943587T3 (en) |
| IL (3) | IL295071A (en) |
| WO (1) | WO2017091698A1 (en) |
Families Citing this family (79)
| Publication number | Priority date | Publication date | Assignee | Title |
|---|---|---|---|---|
| US12478833B2 (en) | 2012-08-31 | 2025-11-25 | Blue Goji Llc | System and method for targeted neurological therapy using brainwave entrainment with passive treatment |
| US11465013B2 (en) | 2012-08-31 | 2022-10-11 | Blue Goji Llc | System and method for targeted neurological therapy using brainwave entrainment |
| US11612786B2 (en) | 2012-08-31 | 2023-03-28 | Blue Goji Llc | System and method for targeted neurological therapy using brainwave entrainment with passive treatment |
| US10974078B2 (en) * | 2012-12-27 | 2021-04-13 | Brainsonix Corporation | Treating degenerative dementia with low intensity focused ultrasound pulsation (LIFUP) device |
| US10512794B2 (en) | 2016-12-16 | 2019-12-24 | Brainsonix Corporation | Stereotactic frame |
| US9061133B2 (en) | 2012-12-27 | 2015-06-23 | Brainsonix Corporation | Focused ultrasonic transducer navigation system |
| ES2943587T3 (en) | 2015-11-24 | 2023-06-14 | Massachusetts Inst Technology | Systems to prevent, mitigate and/or treat dementia |
| US10274712B2 (en) * | 2016-01-08 | 2019-04-30 | Optomak, Inc. | Microscope for fluorescence imaging with variable focus |
| WO2018039602A1 (en) | 2016-08-26 | 2018-03-01 | Wisconsin Alumni Research Foundation | Neuromodulation to modulate glymphatic clearance |
| US10905897B2 (en) * | 2016-10-20 | 2021-02-02 | Neuro-Laser Foundation, Inc. | Synergistic treatment methodologies using light therapy |
| US9950189B1 (en) * | 2016-10-20 | 2018-04-24 | Neuro-Laser Foundation Inc. | Treatment methodologies using light therapy |
| KR102612531B1 (en) | 2016-11-17 | 2023-12-12 | 코그니토 쎄라퓨틱스, 인코포레이티드 | A system for improving cognitive function |
| US20220008746A1 (en) * | 2016-11-17 | 2022-01-13 | Cognito Therapeutics, Inc. | Methods and systems for neural stimulation via visual stimulation |
| US20190359661A1 (en) * | 2016-11-25 | 2019-11-28 | Nanoscope Technologies, LLC | Method and device for pain modulation by optical activation of neurons and other cells |
| US11433253B2 (en) | 2017-02-15 | 2022-09-06 | The Regents Of The University Of California | Light therapy system and methods of use |
| JP7458786B2 (en) | 2017-02-15 | 2024-04-01 | ザ リージェンツ オブ ザ ユニバーシティ オブ カリフォルニア | Improved phototherapy systems and methods of use |
| US20190076670A1 (en) * | 2017-09-11 | 2019-03-14 | Alzheimer's Light Llc | Flashing Light Therapy with Image Presentation and Interaction for Treatment of Alzheimer's Disease and Dementia |
| CN111655319A (en) * | 2017-10-10 | 2020-09-11 | 麻省理工学院 | Synchronizing gamma oscillations in the brain with visual stimulation for dementia |
| US10960225B2 (en) * | 2017-10-10 | 2021-03-30 | Massachusetts Institute Of Technology | Systems and methods for preventing, mitigating, and/or treating dementia via visual stimulation that binds higher order brain regions, reduces neurodegeneration and neuroinflammation, and improves cognitive function |
| ES3058718T3 (en) * | 2017-10-10 | 2026-03-12 | Massachusetts Inst Technology | Systems for preventing, mitigating, and/or treating dementia |
| US10310959B2 (en) | 2017-11-07 | 2019-06-04 | Bank Of America Corporation | Pre-deployment validation system using intelligent databases |
| WO2019173847A1 (en) * | 2018-03-09 | 2019-09-12 | Georgia Tech Research Corporation | Systems and methods for driving neural activity to control brain signaling and gene expression |
| US20190388020A1 (en) * | 2018-06-20 | 2019-12-26 | NeuroPlus Inc. | System and Method for Treating and Preventing Cognitive Disorders |
| US12029579B2 (en) * | 2018-07-13 | 2024-07-09 | Pst Inc. | Apparatus for estimating mental/neurological disease |
| CN112533672A (en) * | 2018-08-01 | 2021-03-19 | 坪田实验室股份有限公司 | Device and method for controlling brain waves and cell activity based on light stimulation and device for improving, preventing or enhancing brain function |
| USD889677S1 (en) | 2018-10-24 | 2020-07-07 | Verilux, Inc. | Lamp with stand |
| US20220040366A1 (en) * | 2018-11-05 | 2022-02-10 | Aleddra Inc. | Multi-Mode Lighting Device |
| US10518063B1 (en) | 2018-11-07 | 2019-12-31 | Symbolics Inc. | Method for stimulating neural activity |
| KR102244367B1 (en) * | 2018-11-13 | 2021-04-27 | 고려대학교 산학협력단 | Methods for recovery of synaptic plasticity using optogenetic technique in Alzhimer’s disease |
| CN109621152A (en) * | 2019-01-28 | 2019-04-16 | 邹珍友 | A method of without Interventional intervening animal cognition conscious activity and behavior with high field pulse laser |
| KR102272858B1 (en) | 2019-05-22 | 2021-07-05 | 경희대학교 산학협력단 | Radiation system and method of use thereof for abnormality proteins in the brain |
| JP7355334B2 (en) * | 2019-08-10 | 2023-10-03 | 智夫 松田 | Dementia treatment device consisting of electronic flash sunglasses |
| US20220322993A1 (en) * | 2019-08-16 | 2022-10-13 | The Regents Of The University Of California | Neurofeedback Training to Promote Sharp Wave Ripples |
| CN110681029A (en) * | 2019-09-29 | 2020-01-14 | 广东省医疗器械研究所 | Alzheimer disease prevention and treatment device and implementation method thereof |
| CN114555166A (en) | 2019-10-18 | 2022-05-27 | 奥地利科学技术研究所 | Stimulation of neuronal plasticity |
| CN110639131A (en) * | 2019-11-07 | 2020-01-03 | 杭州崇正医疗科技有限公司 | Glasses type Alzheimer's disease sound and light therapy equipment |
| CN112791078B (en) | 2019-11-13 | 2022-12-06 | 润佳(苏州)医药科技有限公司 | Use of isotopically enriched 3-amino-1-propanesulfonic acid and derivatives thereof |
| KR102467533B1 (en) | 2019-11-18 | 2022-11-15 | 중앙대학교 산학협력단 | Photic modulation headset for Alzheimer's disease |
| US20210275827A1 (en) * | 2020-03-07 | 2021-09-09 | Reversal Solutions, Inc. | Systems and methodologies for treating or preventing psychiatric disorders, brain trauma, and addiction or dependence by light therapy with modulated frequency |
| WO2021216957A1 (en) * | 2020-04-23 | 2021-10-28 | Massachusetts Institute Of Technology | Systems, devices, and methods for gamma entrainment using sensory stimuli to alleviate cognitive deficits and/or neuroinflammation induced by chemotherapy agents |
| US11759661B2 (en) | 2020-05-20 | 2023-09-19 | Brainsonix Corporation | Ultrasonic transducer treatment device |
| WO2021257548A1 (en) | 2020-06-18 | 2021-12-23 | Diagnostyx, Inc. | Treatment of neurological abnormalities using dynamic electroencephalography |
| KR20240051882A (en) * | 2020-07-27 | 2024-04-22 | 코그니토 쎄라퓨틱스, 인코포레이티드 | Sensory gamma stimulation therapy maintains functional capacity and improves sleep quality in Alzheimer's disease patients |
| WO2022046764A1 (en) | 2020-08-24 | 2022-03-03 | Brainsonix Corporation | Systems and methods for neuromodulation of neuronal circuits using transcranial focused microwave pulses |
| US11730917B2 (en) | 2020-10-29 | 2023-08-22 | Optoceutics ApS | Gamma stimulation pulsing light source system with dosage adjustment for gaze angle |
| CN112569445A (en) * | 2020-12-09 | 2021-03-30 | 郑州布恩科技有限公司 | Brain function rehabilitation equipment |
| JP6994652B1 (en) | 2020-12-14 | 2022-01-14 | エクボ株式会社 | Gamma wave inducer |
| IT202100000776A1 (en) | 2021-01-18 | 2022-07-18 | Univ Degli Studi Di Brescia | NON-THERAPEUTIC METHOD OF STIMULATION WITH γ-TACS |
| CN115335102B (en) * | 2021-02-08 | 2024-06-04 | 张鸿勋 | Method, system and brain keyboard for generating feedback in the brain |
| EP4304479A4 (en) * | 2021-03-09 | 2025-04-23 | Cognito Therapeutics, Inc. | METHODS AND SYSTEMS FOR SLOWING BRAIN ATROPHY |
| WO2022212891A1 (en) * | 2021-04-02 | 2022-10-06 | The Board Of Trustees Of The Leland Stanford Junior University | Novel neural control signals for therapeutic behavioral modulation in eating-related disorders |
| CN113082193B (en) * | 2021-04-08 | 2022-04-01 | 上海南方模式生物科技股份有限公司 | Regulated endocrine-specific protein 18 and uses of its gene |
| US12249307B2 (en) * | 2021-04-18 | 2025-03-11 | Tony Jonathan Graber | Methods and systems of sound-stimulation practice |
| CN113368362A (en) * | 2021-04-20 | 2021-09-10 | 刘书朋 | Photoacoustic vibration wave device for resonating brain gamma rhythm vibration wave and application |
| US11948531B2 (en) | 2021-06-21 | 2024-04-02 | Industrial Technology Research Institute | Light source device and display device alternately emitting light beams |
| WO2022272093A1 (en) * | 2021-06-24 | 2022-12-29 | The Regents Of The University Of California | Virtual and augmented reality devices to diagnose and treat cognitive and neuroplasticity disorders |
| EP4399311A4 (en) * | 2021-09-10 | 2025-11-26 | Alnylam Pharmaceuticals Inc | APP-IRNA COMPOSITIONS AND METHOD FOR USE THEM FOR THE TREATMENT OR PREVENTION OF DISEASES MARKED BY ENLARGED ENDOSOMES |
| WO2023049467A1 (en) * | 2021-09-27 | 2023-03-30 | Cognito Therapeutics, Inc. | Entertainment device for promoting gamma oscillations |
| CN118354712A (en) * | 2021-09-27 | 2024-07-16 | 科格尼托治疗公司 | Ways to enhance neural stimulation during activity |
| WO2023108170A2 (en) * | 2021-12-10 | 2023-06-15 | Massachusetts Institute Of Technology | Systems, devices, and methods for enhancing the neuroprotective effects of non-invasive gamma stimulation with pharmacological agents |
| US20250041553A1 (en) * | 2021-12-23 | 2025-02-06 | Georgia Tech Research Corporation | Brain stimulation systems and methods |
| KR102400319B1 (en) * | 2021-12-31 | 2022-05-24 | (주)리솔 | Apparatus and Method for Stimulating a Brain by Entraining Synchronized Vibration in a Plurality of Brain Regions of a User |
| US20250099779A1 (en) * | 2022-01-10 | 2025-03-27 | Wenzhou Ventura Technology Co., Ltd. | Device and method for regulating release of adenosine in organism, and use |
| CN114209957B (en) * | 2022-01-21 | 2024-01-26 | 中国科学院电工研究所 | Wearable pulse modulation magneto-acoustic stimulation device for improving senile cognitive impairment |
| US12451249B2 (en) * | 2022-01-31 | 2025-10-21 | At&T Intellectual Property I, L.P. | Dynamic home themes for assisted early detection and treatment in healthcare |
| WO2023196610A1 (en) * | 2022-04-08 | 2023-10-12 | Cognito Therapeutics, Inc. | Methods for detecting and monitoring neurological disorders or conditions |
| US20260000910A1 (en) | 2022-06-10 | 2026-01-01 | Tsubota Laboratory, Inc. | Method for treating parkinson's disease through photostimulation, and device used in said method |
| CN115211813A (en) * | 2022-07-19 | 2022-10-21 | 军事科学院军事医学研究院环境医学与作业医学研究所 | System for inducing and monitoring gamma neural oscillation synchronization based on flash |
| WO2024071452A1 (en) * | 2022-09-26 | 2024-04-04 | (주)뉴로니어 | Head-mounted device for prevention and alleviation of dementia |
| WO2024081719A1 (en) * | 2022-10-11 | 2024-04-18 | Katherine Quittner | System and method for producing sound and light for therapeutic effect |
| CN116059531B (en) * | 2022-12-21 | 2024-11-05 | 重庆大学 | Nerve evaluation method and system for improving memory function of Alzheimer disease mice by deep brain stimulation |
| EP4680331A1 (en) * | 2023-03-13 | 2026-01-21 | Nuuron GmbH | Device for inducing high-frequency oscillations in a brain |
| US12168140B1 (en) | 2023-06-20 | 2024-12-17 | Photigen, Inc. | Apparatus for neural stimulation and method of use |
| US12544666B2 (en) * | 2023-06-22 | 2026-02-10 | King.Com Limited | Method and apparatus providing a computer implemented game |
| CN119653539A (en) | 2023-09-15 | 2025-03-18 | 台达电子工业股份有限公司 | LED driver and LED lighting system |
| US20250111800A1 (en) * | 2023-10-02 | 2025-04-03 | Mark Freeman | Methods for conducting memory therapy using facial recognition and vibrotactile stimulation with synchronized music |
| US12458817B2 (en) | 2023-11-21 | 2025-11-04 | Sanmai Technologies, PBC | Wearable closed loop TUS system |
| CN118059391A (en) * | 2024-01-17 | 2024-05-24 | 中国人民解放军军事科学院军事医学研究院 | Method for improving cognitive function by adjusting gamma rhythm oscillation through microwaves |
| WO2026003580A1 (en) * | 2024-06-25 | 2026-01-02 | Syntropic Medical Gmbh | Systems and methods for treating mental disorders |
Citations (1)
| Publication number | Priority date | Publication date | Assignee | Title |
|---|---|---|---|---|
| JP2015519096A (en) | 2012-04-06 | 2015-07-09 | ニューポート ブレイン リサーチ ラボラトリー インコーポレイテッド | Frequency-specific sensory stimulation |
Family Cites Families (216)
| Publication number | Priority date | Publication date | Assignee | Title |
|---|---|---|---|---|
| US4315502A (en) | 1979-10-11 | 1982-02-16 | Gorges Denis E | Learning-relaxation device |
| US4449047A (en) | 1981-10-26 | 1984-05-15 | Sunoco Energy Development Co., A Wholly-Owned Subsidiary Of Sun Company, Inc. | Airborne mineral exploration system |
| US4456910A (en) | 1982-08-12 | 1984-06-26 | General Electric Company | Non-complementary metal oxide semiconductor (MOS) driver for liquid crystal displays |
| JPS60194422A (en) | 1984-03-16 | 1985-10-02 | Tanaka Sangyo:Kk | Coupling struction of spectacle frame with endpiece |
| US5151687A (en) | 1990-07-16 | 1992-09-29 | Younger George G | Apparatus for logging electronic media-taped material |
| ATE386115T1 (en) | 1991-12-06 | 2008-03-15 | Max Planck Gesellschaft | USE OF PROTEIN KINASES FOR THE DIAGNOSIS AND TREATMENT OF ALZHEIMER'S DISEASE |
| US6071229A (en) * | 1992-05-05 | 2000-06-06 | Rubins; Tye | Video or compact disk encoder/decoder for brain wave synchronizer |
| US5534953A (en) | 1994-07-01 | 1996-07-09 | Schmielau; Fritz | Training device for the therapy of patients having perception defects |
| JP3648802B2 (en) | 1994-09-27 | 2005-05-18 | 松下電工株式会社 | High intensity light irradiation device for phototherapy |
| US5659287A (en) | 1995-03-21 | 1997-08-19 | General Signal Corporation | Strobe synchronization for averting convulsive reactions to strobe light |
| US5923398A (en) | 1995-06-15 | 1999-07-13 | Enlightened Technologies, Inc. | Interactive light field for non-visual stimulation |
| US6077545A (en) | 1995-10-30 | 2000-06-20 | Matrix Pharmaceuticals, Inc. | Process and composition for therapeutic cisplatin (CDDP) |
| US6206537B1 (en) | 1995-11-15 | 2001-03-27 | Lane T. Hauck | Electrically illuminated attention-attracting devices and method of using same |
| US6463328B1 (en) | 1996-02-02 | 2002-10-08 | Michael Sasha John | Adaptive brain stimulation method and system |
| US6066163A (en) | 1996-02-02 | 2000-05-23 | John; Michael Sasha | Adaptive brain stimulation method and system |
| US6113537A (en) | 1996-04-19 | 2000-09-05 | Castano; Jaime A. | Optical method and device for determining blood glucose levels |
| JP4076232B2 (en) | 1996-06-06 | 2008-04-16 | フラレックス・テラピューティクス・インコーポレーテッド | Electrotherapy device using low frequency magnetic pulses |
| US5934967A (en) | 1997-07-31 | 1999-08-10 | Blue Leaf Design, Inc. | Self-actuating spreading apparatus |
| WO1999034865A1 (en) | 1998-01-08 | 1999-07-15 | Levin Richard B | Eeg based consciousness-alert monitoring system |
| US6299632B1 (en) | 1998-11-30 | 2001-10-09 | Peter Jaillet | Method for changing critical brain activity using light and sound |
| US6231528B1 (en) | 1999-01-15 | 2001-05-15 | Jonathan J. Kaufman | Ultrasonic and growth factor bone-therapy: apparatus and method |
| UA81216C2 (en) * | 1999-06-01 | 2007-12-25 | Prevention and treatment of amyloid disease | |
| US6539263B1 (en) | 1999-06-11 | 2003-03-25 | Cornell Research Foundation, Inc. | Feedback mechanism for deep brain stimulation |
| US20010039012A1 (en) | 1999-06-14 | 2001-11-08 | Lapidus Stanley N. | Methods for diagnostic screening |
| US7446785B1 (en) | 1999-08-11 | 2008-11-04 | Texas Instruments Incorporated | High bit depth display with low flicker |
| GB0010565D0 (en) | 2000-05-02 | 2000-06-21 | Medical Res Council | Assay for acetylcholinesterase inhibitors |
| RU2202323C2 (en) | 2001-01-24 | 2003-04-20 | Савельев Борис Сергеевич | Method for applying wave biomechanotherapy |
| US20130211238A1 (en) | 2001-01-30 | 2013-08-15 | R. Christopher deCharms | Methods for physiological monitoring, training, exercise and regulation |
| US6733490B1 (en) | 2001-04-12 | 2004-05-11 | Iridex Corporation | Method and apparatus for controlling sub-clinical laser procedures with intra-operative monitoring of electrophysiological changes |
| US7010356B2 (en) * | 2001-10-31 | 2006-03-07 | London Health Sciences Centre Research Inc. | Multichannel electrode and methods of using same |
| CA2477488A1 (en) | 2002-02-04 | 2003-08-14 | Great Lake Biosciences, Llc | Treatment of neurological disorders using electrical stimulation |
| US8328420B2 (en) | 2003-04-22 | 2012-12-11 | Marcio Marc Abreu | Apparatus and method for measuring biologic parameters |
| KR100553516B1 (en) * | 2002-06-24 | 2006-02-20 | 정종필 | Alpha wave induction electric stimulator |
| DE10233960B4 (en) | 2002-07-29 | 2006-11-02 | Forschungszentrum Jülich GmbH | Device for the demand-controlled modulation of physiological and pathological neuronal rhythmic activity in the brain by means of sensory stimulation |
| US8579786B2 (en) | 2002-10-15 | 2013-11-12 | Medtronic, Inc. | Screening techniques for management of a nervous system disorder |
| US11082664B2 (en) | 2004-07-06 | 2021-08-03 | Tseng-Lu Chien | Multiple functions LED night light |
| US7798982B2 (en) | 2002-11-08 | 2010-09-21 | Engineering Acoustics, Inc. | Method and apparatus for generating a vibrational stimulus |
| US7998460B2 (en) * | 2003-04-17 | 2011-08-16 | The Board Of Trustees Of The Leland Stanford Junior University | Prevention of deficits in neurogenesis with anti-inflammatory agents |
| WO2004096343A2 (en) | 2003-04-28 | 2004-11-11 | Azna Health And Wellness, Inc. | Light and magnetic emitting mask |
| EP1624932A4 (en) | 2003-05-01 | 2010-02-10 | Flinders Technologies Pty Ltd | Apparatus for administering light stimulation |
| US8190248B2 (en) * | 2003-10-16 | 2012-05-29 | Louisiana Tech University Foundation, Inc. | Medical devices for the detection, prevention and/or treatment of neurological disorders, and methods related thereto |
| KR101049605B1 (en) | 2004-04-01 | 2011-07-14 | 윌리엄 씨. 토치 | Biosensors, communicators, and controllers that monitor eye movements and how to use them |
| US8177702B2 (en) | 2004-04-15 | 2012-05-15 | Neuronetics, Inc. | Method and apparatus for determining the proximity of a TMS coil to a subject's head |
| AU2005265033B2 (en) | 2004-06-18 | 2011-08-04 | Neuronetrix Solutions, Llc | Evoked response testing system for neurological disorders |
| DE102004048982A1 (en) * | 2004-10-01 | 2006-04-06 | Markus Klose | Eye attachment for a stimulation device for stimulating the central nervous system and the brain waves of a human |
| US9764135B2 (en) | 2004-10-21 | 2017-09-19 | Advanced Neuromodulation Systems, Inc. | Stimulation design for neuromodulation |
| US7645226B2 (en) | 2004-11-12 | 2010-01-12 | Biogenics Ii L.L.C. | Relaxation device and method |
| JP2008520280A (en) | 2004-11-15 | 2008-06-19 | デチャームス,クリストファー | Application of nerve tissue stimulation using light |
| US7769439B2 (en) | 2004-11-30 | 2010-08-03 | Infinite Z, Inc. | Brain balancing by binaural beat |
| ATE550912T1 (en) | 2004-12-07 | 2012-04-15 | Elumen Lighting Networks Inc | SYSTEM AND METHOD FOR CONTROLLING A MATRIX OF LEDS AND THE LIGHT PRODUCED THEREFROM |
| US7361074B1 (en) | 2005-02-18 | 2008-04-22 | Rapid Pro Manufacturing, Martin And Periman Partnership | Rotating light toy |
| AU2006230433A1 (en) | 2005-03-30 | 2006-10-05 | Novavision, Inc. | Method and device for delivering visual stimuli with head mounted display during vision training |
| US7569545B2 (en) * | 2005-05-20 | 2009-08-04 | Academia Sinica | Methods of increasing neurotrophic factor expression |
| CN101262863B (en) * | 2005-07-08 | 2016-08-31 | Dsmip资产公司 | Polyunsaturated fatty acids for the treatment of dementia and pre-dementia-related conditions |
| US20140336514A1 (en) | 2005-08-05 | 2014-11-13 | Gholam A. Peyman | Methods to regulate polarization and enhance function of cells |
| US20190030190A1 (en) | 2005-08-05 | 2019-01-31 | Gholam A. Peyman | Methods to regulate polarization and enhance function of cells |
| US9962558B2 (en) * | 2005-08-05 | 2018-05-08 | Gholam A. Peyman | Methods to regulate polarization and enhance function of cells |
| US20070225773A1 (en) | 2005-09-28 | 2007-09-27 | Yang Shen | Implantable transcranial pulse generator having a collapsible portion |
| US8868177B2 (en) * | 2009-03-20 | 2014-10-21 | ElectroCore, LLC | Non-invasive treatment of neurodegenerative diseases |
| WO2007062367A2 (en) * | 2005-11-21 | 2007-05-31 | The Curators Of The University Of Missouri | Light sensitivity meter and uses thereof |
| CN1991364A (en) * | 2005-12-26 | 2007-07-04 | 中国科学院上海生命科学研究院 | G-albumen coupling acceptor antagonist preventing and treating Alzheimer's disease |
| US7660636B2 (en) | 2006-01-04 | 2010-02-09 | Accelerated Care Plus Corp. | Electrical stimulation device and method for the treatment of dysphagia |
| US7801601B2 (en) | 2006-01-27 | 2010-09-21 | Cyberonics, Inc. | Controlling neuromodulation using stimulus modalities |
| US10357662B2 (en) * | 2009-02-19 | 2019-07-23 | Pthera LLC | Apparatus and method for irradiating a surface with light |
| JP5089060B2 (en) | 2006-03-14 | 2012-12-05 | 株式会社ソニー・コンピュータエンタテインメント | Entertainment system and game controller |
| US20070253561A1 (en) | 2006-04-27 | 2007-11-01 | Tsp Systems, Inc. | Systems and methods for audio enhancement |
| JP2008029804A (en) | 2006-06-27 | 2008-02-14 | Family Co Ltd | Massage machine |
| US20080004660A1 (en) * | 2006-06-28 | 2008-01-03 | Medtrode Inc. | Systems and methods for improving a cognitive function |
| CA2657762C (en) | 2006-07-25 | 2015-07-21 | Novavision, Inc. | Dynamic stimuli for visual field testing and therapy |
| CA2658802A1 (en) | 2006-08-08 | 2008-02-14 | Mony Paz | Combination dental hand tool |
| EP2050073A4 (en) | 2006-08-11 | 2009-12-30 | Thomson Licensing | EXACT MOVEMENT PORTRAIT FOR DISPLAY AND DIGITAL PROJECTORS |
| US7828434B2 (en) | 2006-08-31 | 2010-11-09 | Nike, Inc. | Zone switched sports training eyewear |
| US10786669B2 (en) | 2006-10-02 | 2020-09-29 | Emkinetics, Inc. | Method and apparatus for transdermal stimulation over the palmar and plantar surfaces |
| US20080181882A1 (en) | 2006-11-15 | 2008-07-31 | The University Of Pennsylvania | Neurgulin 1 (NRG1) - ErbB4 signaling as a target for the treatment of schizophrenia |
| US8700167B2 (en) | 2006-12-22 | 2014-04-15 | Ebs Technologies Gmbh | Apparatus and method for stimulating a brain of a person |
| US8894696B2 (en) | 2007-01-16 | 2014-11-25 | Katherine L Hurst | Suprachiasmatic nucleus inducing, melatonin suppressing light emitting device to enhance wake cycle |
| US8401609B2 (en) | 2007-02-14 | 2013-03-19 | The Board Of Trustees Of The Leland Stanford Junior University | System, method and applications involving identification of biological circuits such as neurological characteristics |
| WO2008106694A2 (en) | 2007-03-01 | 2008-09-04 | The Board Of Trustees Of The Leland Stanford Junior University | Systems, methods and compositions for optical stimulation of target cells |
| EP2129352B1 (en) | 2007-03-13 | 2016-03-09 | The Feinstein Institute for Medical Research | Treatment of inflammation by non-invasive stimulation |
| US20080255949A1 (en) | 2007-04-13 | 2008-10-16 | Lucid Systems, Inc. | Method and System for Measuring Non-Verbal and Pre-Conscious Responses to External Stimuli |
| US20140324138A1 (en) | 2007-05-09 | 2014-10-30 | Massachusetts Institute Of Technology | Wirelessly-powered illumination of biological tissue |
| CA2686929A1 (en) | 2007-05-11 | 2008-11-20 | Clarimedix Inc. | Visible light modulation of mitochondrial function in hypoxia and disease |
| KR20100039287A (en) | 2007-05-25 | 2010-04-15 | 토마스 제퍼슨 유니버시티 | Method of treatment to improve concentration and/or memory in a subject in need thereof |
| US20090005837A1 (en) * | 2007-06-29 | 2009-01-01 | Ruth Olmstead | Method and apparatus for stimulating the neurochemistry of the brain resulting in increased overall brain function, cognitive performance, and intelligence quota |
| AU2008283857A1 (en) | 2007-08-06 | 2009-02-12 | Great Lakes Biosciences, Llc | Methods and apparatus for electrical stimulation of tissues using signals that minimize the effects of tissue impedance |
| US20100217358A1 (en) | 2007-08-20 | 2010-08-26 | Universite Laval | Artificial light apparatus and its use for influencing a condition in a subject |
| US8380314B2 (en) | 2007-09-26 | 2013-02-19 | Medtronic, Inc. | Patient directed therapy control |
| US8121694B2 (en) | 2007-10-16 | 2012-02-21 | Medtronic, Inc. | Therapy control based on a patient movement state |
| US8577470B2 (en) | 2007-12-18 | 2013-11-05 | Souhile Assaf | Systems and methods for improving memory in Alzheimer's patients |
| GB0725124D0 (en) * | 2007-12-24 | 2008-01-30 | Carr Peter | Photic stimulation for eyes |
| US8396545B2 (en) * | 2008-02-25 | 2013-03-12 | Wisconsin Alumni Research Foundation | Electrophysiological screens for cognitive modulators |
| DE102008012669B8 (en) | 2008-03-05 | 2011-03-03 | Anm Adaptive Neuromodulation Gmbh | Apparatus and method for visual stimulation |
| DE102008015259B4 (en) | 2008-03-20 | 2010-07-22 | Anm Adaptive Neuromodulation Gmbh | Apparatus and method for auditory stimulation |
| EP2265328B1 (en) | 2008-03-20 | 2018-05-09 | EBS Technologies GmbH | An apparatus for automatic treatment adjustment after nervous system dysfunction |
| US8636640B2 (en) | 2008-04-11 | 2014-01-28 | Brain Symphony LLC | Method and system for brain entertainment |
| BRPI0911448A2 (en) * | 2008-04-23 | 2019-02-26 | The Board Of Trustees For The Leland Stanford Junior University | systems, methods and compositions for optical simulation of target cells |
| US20090270776A1 (en) | 2008-04-28 | 2009-10-29 | Hung-Chu Chang | Massage Chair With Function of Stress Relaxation and Sleep Inducing |
| US8070669B2 (en) | 2008-08-04 | 2011-12-06 | Gestion Ultra International Inc. | Wall integrated multisensory therapy device |
| JP4500369B2 (en) | 2008-09-19 | 2010-07-14 | パナソニック株式会社 | Distraction detection device, distraction detection method, and computer program |
| US20120065709A1 (en) * | 2008-09-30 | 2012-03-15 | The Regents Of The University Of Colorado | Methods and devices for visible light modulation of mitochondrial function in hypoxia and disease |
| US8022631B2 (en) | 2008-11-03 | 2011-09-20 | General Electric Company | Color control of light sources employing phosphors |
| US8355793B2 (en) | 2009-01-02 | 2013-01-15 | Cochlear Limited | Optical neural stimulating device having a short stimulating assembly |
| ITRM20090027A1 (en) | 2009-01-26 | 2010-07-27 | Alain Rocco | STIMULATION SYSTEM FOR PAIN TREATMENT AND ITS FUNCTIONING METHOD. |
| US8932218B1 (en) | 2009-02-19 | 2015-01-13 | Jeffrey D. Thompson | Methodology, use and benefits of neuroacoustic frequencies for assessing and improving the health and well-being of living organisms |
| US10232178B2 (en) | 2009-03-20 | 2019-03-19 | Electrocore, Inc. | Non-invasive magnetic or electrical nerve stimulation to treat or prevent dementia |
| US10220207B2 (en) | 2009-03-20 | 2019-03-05 | Electrocore, Inc. | Nerve stimulation methods for averting imminent onset or episode of a disease |
| WO2010113164A1 (en) | 2009-04-03 | 2010-10-07 | Neuronix Ltd. | Method and system for neurological treatment |
| US20100274329A1 (en) | 2009-04-24 | 2010-10-28 | Chris Bradley | System and method for skin care using light and microcurrents |
| US20120159656A1 (en) * | 2009-04-24 | 2012-06-21 | Galenea Corp. | Compositions and methods for evaluating cognitive defects |
| CA2765500C (en) | 2009-06-15 | 2019-07-30 | Brain Computer Interface Llc | A brain-computer interface test battery for the physiological assessment of nervous system health. |
| US8267851B1 (en) | 2009-06-16 | 2012-09-18 | James M Kroll | Method and apparatus for electrically generating signal for inducing lucid dreaming |
| US20120220905A1 (en) * | 2009-10-11 | 2012-08-30 | Ads & B Investment Fund L.P | Methods and protocols for providing artificially induced vibrations (aivs) to mammalian patients for therapeutic purposes |
| CN102791332A (en) | 2009-11-04 | 2012-11-21 | 代理并代表亚利桑那州立大学的亚利桑那董事会 | Devices and methods for modulating brain activity |
| US8541741B2 (en) | 2009-11-20 | 2013-09-24 | Perkinelmer Health Sciences, Inc. | Photonic measurement instrument using fiber optics |
| US8239030B1 (en) | 2010-01-06 | 2012-08-07 | DJ Technologies | Transcranial stimulation device and method based on electrophysiological testing |
| US8579793B1 (en) | 2010-01-27 | 2013-11-12 | James David Honeycutt | Apparatus to affect brainwave entrainment over premises power-line wiring |
| US9308254B2 (en) | 2010-02-17 | 2016-04-12 | Imperial Innovations Limited | Method for treatment of post operative cognitive dysfunction |
| US9770414B2 (en) | 2010-05-13 | 2017-09-26 | Pacira Pharmaceuticals, Inc. | Sustained release formulation of methotrexate as a disease-modifying antirheumatic drug (DMARD) and an anti-cancer agent |
| WO2011146777A2 (en) | 2010-05-19 | 2011-11-24 | Photothera, Inc. | Device and method for providing a synergistic combination of phototherapy and a non-light energy modality to the brain |
| WO2012024243A1 (en) | 2010-08-16 | 2012-02-23 | Photothera, Inc. | Minimally invasive low level light therapy for neurological disorders |
| US9622911B2 (en) | 2010-09-30 | 2017-04-18 | Cxl Ophthalmics, Llc | Ophthalmic treatment device, system, and method of use |
| JP6355335B2 (en) | 2010-11-05 | 2018-07-11 | ザ ボード オブ トラスティーズ オブ ザ レランド スタンフォード ジュニア ユニバーシティー | Optogenetic control of reward-related behavior |
| EP2635295B1 (en) * | 2010-11-05 | 2017-12-20 | The Board of Trustees of the Leland Stanford Junior University | Control and characterization of memory function |
| CN106947741A (en) * | 2010-11-05 | 2017-07-14 | 斯坦福大学托管董事会 | Photoactivation is fitted together to opsin and its application method |
| GB201103200D0 (en) | 2011-02-24 | 2011-04-13 | Isis Innovation | An optical device for the visually impaired |
| CN103392196A (en) | 2011-03-02 | 2013-11-13 | 皇家飞利浦有限公司 | Device and method for cognitive enhancement of a user |
| US20120253236A1 (en) | 2011-04-04 | 2012-10-04 | Snow Buddy L | Methods and apparatuses for delivering external therapeutic stimulation to animals and humans |
| US8892207B2 (en) | 2011-04-20 | 2014-11-18 | Medtronic, Inc. | Electrical therapy for facilitating inter-area brain synchronization |
| CN103501855B (en) | 2011-04-20 | 2015-12-23 | 美敦力公司 | Determination of electrotherapy parameters based on bioelectrical resonance responses |
| PL2709522T3 (en) | 2011-05-20 | 2017-03-31 | Nanyang Technological University | System for synergistic neuro-physiological rehabilitation and/or functional development |
| US20130021138A1 (en) | 2011-07-20 | 2013-01-24 | GM Global Technology Operations LLC | Method of evaluating structural integrity of a vehicle component with radio frequency identification tags and system for same |
| US9566426B2 (en) * | 2011-08-31 | 2017-02-14 | ElectroCore, LLC | Systems and methods for vagal nerve stimulation |
| US9268406B2 (en) | 2011-09-30 | 2016-02-23 | Microsoft Technology Licensing, Llc | Virtual spectator experience with a personal audio/visual apparatus |
| CN103889495A (en) | 2011-10-25 | 2014-06-25 | 学校法人金泽医科大学 | Light exposure device for improving cognitive symptoms and depression symptoms, chamber having light exposure device, and lighting equipment for improving cognitive symptoms and depression symptoms |
| EP2785377A4 (en) * | 2011-11-29 | 2015-07-08 | Baylor College Medicine | PROCESS FOR INCREASING COGNITION |
| US20130211277A1 (en) | 2012-02-10 | 2013-08-15 | Oyvind Berg | System And Method For Reducing Stress Levels Through A Biofeedback Mediated System Using Color, Sound, And Aroma Therapy |
| CA2864213A1 (en) | 2012-02-17 | 2013-08-22 | Frank M. WANCA | Method, system and apparatus for integrated dynamic neural stimulation |
| US9272118B1 (en) | 2012-03-02 | 2016-03-01 | George Acton | Methods for treating brain malfunctions |
| US9155473B2 (en) | 2012-03-21 | 2015-10-13 | Korea Electrotechnology Research Institute | Reflection detection type measurement apparatus for skin autofluorescence |
| US8918176B2 (en) * | 2012-04-23 | 2014-12-23 | Medtronic, Inc. | Assessing cognitive disorders based on non-motor epileptiform bioelectrical brain activity |
| RU2488388C1 (en) | 2012-05-24 | 2013-07-27 | Ооо "Валента Интеллект" | Pharmaceutical composition for preventing and treating mental, behaviour and cognitive disorders |
| US20150337030A1 (en) | 2012-05-31 | 2015-11-26 | The Trustees Of Columbia University In The City Of New York | Methods to treat alzheimer's disease using apoe inhibitors |
| US9095014B2 (en) | 2012-06-07 | 2015-07-28 | Wellsino Electric Co., Ltd | LED light string and control method thereof |
| EP2895970B1 (en) | 2012-09-14 | 2018-11-07 | InteraXon Inc. | Systems and methods for collecting, analyzing, and sharing bio-signal and non-bio-signal data |
| JP6046439B2 (en) * | 2012-10-01 | 2016-12-14 | トヨタ自動車株式会社 | Brain machine interface |
| US10537703B2 (en) | 2012-11-26 | 2020-01-21 | Thync Global, Inc. | Systems and methods for transdermal electrical stimulation to improve sleep |
| US9629976B1 (en) | 2012-12-21 | 2017-04-25 | George Acton | Methods for independent entrainment of visual field zones |
| US20150351655A1 (en) | 2013-01-08 | 2015-12-10 | Interaxon Inc. | Adaptive brain training computer system and method |
| US10293160B2 (en) | 2013-01-15 | 2019-05-21 | Electrocore, Inc. | Mobile phone for treating a patient with dementia |
| PL2948040T3 (en) | 2013-01-28 | 2023-09-25 | Lkc Technologies, Inc. | Visual electrophysiology device |
| KR20160008162A (en) | 2013-02-22 | 2016-01-21 | 틴크, 인크. | Methods and apparatuses for networking neuromodulation of a group of individuals |
| US20140303025A1 (en) | 2013-03-15 | 2014-10-09 | The Translational Genomics Research Institute | Methods for the diagnosis and prognosis of neurodegenerative diseases |
| CA3187490A1 (en) | 2013-03-15 | 2014-09-18 | Interaxon Inc. | Wearable computing apparatus and method |
| US20140303424A1 (en) | 2013-03-15 | 2014-10-09 | Iain Glass | Methods and systems for diagnosis and treatment of neural diseases and disorders |
| JP2016515432A (en) | 2013-04-01 | 2016-05-30 | モーション セラピューティックス インコーポレイテッド | Properceptive skin and body sensors that work in combination with brain function or sensory neuromotor system functions, methods and devices for mediating vision, vestibule and body sensations |
| WO2014162271A2 (en) | 2013-04-03 | 2014-10-09 | Branislav Nikolic | Light therapy device and method |
| US9872968B2 (en) | 2013-04-17 | 2018-01-23 | Sri International | Biofeedback virtual reality sleep assistant |
| WO2014179331A2 (en) * | 2013-04-29 | 2014-11-06 | The Board Of Trustees Of The Leland Stanford Junior University | Devices, systems and methods for optogenetic modulation of action potentials in target cells |
| US20150002025A1 (en) | 2013-06-28 | 2015-01-01 | General Electric Company | Lighting assembly, apparatus and associated method for maintaining light intensities |
| EP3041413A4 (en) | 2013-09-04 | 2017-04-19 | Question Mark Computing Limited | System and method for data anomaly detection process in assessments |
| MX384984B (en) | 2013-10-10 | 2025-03-14 | Beth Israel Deaconess Medical Ct Inc | Tm4sf1 binding proteins and methods of using same |
| EP3057654B1 (en) | 2013-10-18 | 2020-08-19 | Functional Neuromodulation Inc. | Brain stimulation system including diagnostic tool |
| US10625042B2 (en) * | 2013-11-04 | 2020-04-21 | Phoenix Neurostim Therapeutics, Llc | Treatment of central nervous system conditions using sensory stimulus |
| US10188342B2 (en) * | 2013-11-05 | 2019-01-29 | The University Of North Carolina At Chapel Hill | Methods, apparatuses and systems for transcranial stimulation |
| US11203783B2 (en) | 2013-11-21 | 2021-12-21 | Repertoire Genesis Incorporation | T cell receptor and B cell receptor repertoire analysis system, and use of same in treatment and diagnosis |
| US9511228B2 (en) | 2014-01-14 | 2016-12-06 | Cyberonics, Inc. | Implantable neurostimulator-implemented method for managing hypertension through renal denervation and vagus nerve stimulation |
| CN103854613B (en) | 2014-02-14 | 2016-04-13 | 北京京东方显示技术有限公司 | Light source control module, backlight module and driving method thereof, display device |
| WO2015149170A1 (en) | 2014-03-31 | 2015-10-08 | Functional Neuromodulation, Inc. | Systems and methods for determining a trajectory for a brain stimulation lead |
| CN103932701B (en) * | 2014-04-13 | 2015-09-23 | 北京师范大学 | An Individualized Brain Function Mapping Method Based on Cortical EEG High-frequency Gamma Neural Oscillation |
| US9955907B2 (en) | 2014-04-23 | 2018-05-01 | Case Western Reserve University | Low frequency non-invasive sensorial stimulation for seizure control |
| WO2016023126A1 (en) | 2014-08-14 | 2016-02-18 | Functional Neuromodulation, Inc. | Brain stimulation system including multiple stimulation modes |
| US20160067087A1 (en) | 2014-09-09 | 2016-03-10 | LumiThera, Inc. | Wearable devices and methods for multi-wavelength photobiomodulation for ocular treatments |
| WO2016044227A1 (en) | 2014-09-15 | 2016-03-24 | Abvitro, Inc. | High-throughput nucleotide library sequencing |
| JP2016072521A (en) | 2014-09-30 | 2016-05-09 | 富士フイルム株式会社 | Backlight unit, liquid crystal display device, and chromaticity control method |
| US11534608B2 (en) | 2015-01-04 | 2022-12-27 | Ist, Llc | Methods and apparatuses for transdermal stimulation of the outer ear |
| WO2016127183A1 (en) | 2015-02-06 | 2016-08-11 | Noothera Technologies, Llc | Systems and methods for directed energy therapeutics |
| KR102335562B1 (en) | 2015-03-16 | 2021-12-03 | 매직 립, 인코포레이티드 | Methods and systems for diagnosis and treatment of health conditions |
| KR102460393B1 (en) | 2015-04-30 | 2022-11-01 | 삼성전자주식회사 | Sound outputting apparatus, electronic apparatus, and control method therof |
| CN104783788A (en) * | 2015-05-05 | 2015-07-22 | 刘冬冬 | Brain wave induction control method and device |
| ITUB20153295A1 (en) | 2015-08-31 | 2017-03-03 | Marposs Spa | SYSTEM AND METHOD OF DATA PROCESSING AND TRANSMISSION |
| US10076632B2 (en) | 2015-09-11 | 2018-09-18 | International Business Machines Corporation | Sensory feedback system with active learning |
| US10197235B2 (en) | 2015-09-23 | 2019-02-05 | Jenesis International Inc. | Multiple light source artificial moving flame |
| CN105278387B (en) | 2015-11-17 | 2021-05-18 | 冼光 | Bracelet device with improve sleep and alleviate pain symptom |
| KR102349466B1 (en) | 2015-11-23 | 2022-01-10 | 사나 헬스, 인크. | Methods and systems for providing stimulation to the brain |
| ES2943587T3 (en) | 2015-11-24 | 2023-06-14 | Massachusetts Inst Technology | Systems to prevent, mitigate and/or treat dementia |
| US20190143119A1 (en) | 2016-03-28 | 2019-05-16 | Duke University | Systems and Methods for Brain Stimulation |
| RO131383A0 (en) | 2016-04-11 | 2016-09-30 | Bogdan Constantin Vlădilă | Electromagnetic equipment for improving the elasticity of tissues, for cosmetic use |
| TWI759301B (en) | 2016-05-24 | 2022-04-01 | 美商安美基公司 | Pegylated carfilzomib compounds |
| US10905897B2 (en) | 2016-10-20 | 2021-02-02 | Neuro-Laser Foundation, Inc. | Synergistic treatment methodologies using light therapy |
| KR102612531B1 (en) | 2016-11-17 | 2023-12-12 | 코그니토 쎄라퓨틱스, 인코포레이티드 | A system for improving cognitive function |
| US20220008746A1 (en) | 2016-11-17 | 2022-01-13 | Cognito Therapeutics, Inc. | Methods and systems for neural stimulation via visual stimulation |
| WO2018134823A1 (en) | 2017-01-20 | 2018-07-26 | Oridion Medical 1987 Ltd. | Dual sensor |
| JP7458786B2 (en) | 2017-02-15 | 2024-04-01 | ザ リージェンツ オブ ザ ユニバーシティ オブ カリフォルニア | Improved phototherapy systems and methods of use |
| US11433253B2 (en) | 2017-02-15 | 2022-09-06 | The Regents Of The University Of California | Light therapy system and methods of use |
| JP6837886B2 (en) | 2017-03-21 | 2021-03-03 | 株式会社日立ハイテク | Plasma processing equipment and plasma processing method |
| US10181241B2 (en) | 2017-04-04 | 2019-01-15 | Qualcomm Incorporated | Modulated warning lights for vehicles |
| US20200171267A1 (en) | 2017-05-17 | 2020-06-04 | Matthew D. Millard | Head worn device for treating neurodegenerative diseases |
| EP3675906A4 (en) | 2017-08-28 | 2021-05-26 | Angiex, Inc. | Anti-tm4sf1 antibodies and methods of using same |
| US20190076670A1 (en) | 2017-09-11 | 2019-03-14 | Alzheimer's Light Llc | Flashing Light Therapy with Image Presentation and Interaction for Treatment of Alzheimer's Disease and Dementia |
| ES3058718T3 (en) | 2017-10-10 | 2026-03-12 | Massachusetts Inst Technology | Systems for preventing, mitigating, and/or treating dementia |
| CN111655319A (en) | 2017-10-10 | 2020-09-11 | 麻省理工学院 | Synchronizing gamma oscillations in the brain with visual stimulation for dementia |
| US10960225B2 (en) | 2017-10-10 | 2021-03-30 | Massachusetts Institute Of Technology | Systems and methods for preventing, mitigating, and/or treating dementia via visual stimulation that binds higher order brain regions, reduces neurodegeneration and neuroinflammation, and improves cognitive function |
| CA3086907A1 (en) | 2018-01-08 | 2019-07-11 | Casper Sleep Inc. | Interactive portable lighting system |
| CA3011873A1 (en) | 2018-02-19 | 2019-08-19 | Millennium Healthcare Technologies, Inc. | Dental lasing device system and method |
| CN108725462B (en) | 2018-05-22 | 2024-04-30 | 中交四航局江门航通船业有限公司 | A roller trolley integrated system for synchronously moving giant components and its application method |
| CA3103265A1 (en) | 2018-06-12 | 2019-12-19 | Angiex, Inc. | Antibody-oligonucleotide conjugates |
| US20190388020A1 (en) | 2018-06-20 | 2019-12-26 | NeuroPlus Inc. | System and Method for Treating and Preventing Cognitive Disorders |
| WO2020041502A1 (en) | 2018-08-21 | 2020-02-27 | The Regents Of The University Of California | Transcutaneous electrical and/or magnetic spinal stimulation for bladder or bowel control in subjects without cns injury |
| US10518063B1 (en) | 2018-11-07 | 2019-12-31 | Symbolics Inc. | Method for stimulating neural activity |
| US20210030998A1 (en) | 2019-08-04 | 2021-02-04 | Well Being Digital Limited | Apparatus for improving mental well being, and a method thereof |
| WO2021216957A1 (en) | 2020-04-23 | 2021-10-28 | Massachusetts Institute Of Technology | Systems, devices, and methods for gamma entrainment using sensory stimuli to alleviate cognitive deficits and/or neuroinflammation induced by chemotherapy agents |
| WO2021221879A1 (en) | 2020-05-01 | 2021-11-04 | Albert Einstein College Of Medicine | Compositions and methods for using transplanted microglia as a vehicle for widespread delivery of cells and other biologic agents to the brain |
| KR20240051882A (en) | 2020-07-27 | 2024-04-22 | 코그니토 쎄라퓨틱스, 인코포레이티드 | Sensory gamma stimulation therapy maintains functional capacity and improves sleep quality in Alzheimer's disease patients |
| US20220151864A1 (en) | 2020-11-19 | 2022-05-19 | Massachusetts Institute Of Technology | Systems, Devices, and Methods for Gamma Entrainment using Tactile Stimuli |
| EP4304479A4 (en) | 2021-03-09 | 2025-04-23 | Cognito Therapeutics, Inc. | METHODS AND SYSTEMS FOR SLOWING BRAIN ATROPHY |
| WO2023108170A2 (en) | 2021-12-10 | 2023-06-15 | Massachusetts Institute Of Technology | Systems, devices, and methods for enhancing the neuroprotective effects of non-invasive gamma stimulation with pharmacological agents |
-
2016
- 2016-11-23 ES ES16869248T patent/ES2943587T3/en active Active
- 2016-11-23 JP JP2018525754A patent/JP7204192B2/en active Active
- 2016-11-23 KR KR1020227037169A patent/KR102603963B1/en active Active
- 2016-11-23 KR KR1020237039330A patent/KR102929434B1/en active Active
- 2016-11-23 KR KR1020187017689A patent/KR102460518B1/en active Active
- 2016-11-23 US US15/360,637 patent/US10265497B2/en active Active
- 2016-11-23 EP EP23150106.5A patent/EP4218916B1/en active Active
- 2016-11-23 CN CN202210905503.8A patent/CN115569282A/en active Pending
- 2016-11-23 DK DK16869248.1T patent/DK3383482T3/en active
- 2016-11-23 WO PCT/US2016/063536 patent/WO2017091698A1/en not_active Ceased
- 2016-11-23 CA CA3003183A patent/CA3003183A1/en active Pending
- 2016-11-23 IL IL295071A patent/IL295071A/en unknown
- 2016-11-23 EP EP16869248.1A patent/EP3383482B1/en active Active
- 2016-11-23 AU AU2016361503A patent/AU2016361503B2/en active Active
- 2016-11-23 CN CN201680075447.2A patent/CN108697889B/en active Active
- 2016-11-23 IL IL283779A patent/IL283779B/en unknown
-
2017
- 2017-07-11 US US15/647,157 patent/US10159816B2/en active Active
-
2018
- 2018-05-22 IL IL259533A patent/IL259533B/en active IP Right Grant
-
2019
- 2019-04-04 US US16/375,393 patent/US10682490B2/en active Active
-
2020
- 2020-06-15 US US16/901,592 patent/US12296106B2/en active Active
- 2020-06-15 US US16/901,628 patent/US12318549B2/en active Active
-
2021
- 2021-08-10 AU AU2021215128A patent/AU2021215128B2/en active Active
- 2021-11-19 JP JP2021188541A patent/JP2022020829A/en active Pending
-
2023
- 2023-05-22 JP JP2023083776A patent/JP2023101026A/en active Pending
-
2024
- 2024-02-01 AU AU2024200621A patent/AU2024200621A1/en active Pending
-
2025
- 2025-04-07 US US19/172,282 patent/US20250288771A1/en active Pending
Patent Citations (1)
| Publication number | Priority date | Publication date | Assignee | Title |
|---|---|---|---|---|
| JP2015519096A (en) | 2012-04-06 | 2015-07-09 | ニューポート ブレイン リサーチ ラボラトリー インコーポレイテッド | Frequency-specific sensory stimulation |
Non-Patent Citations (1)
| Title |
|---|
| 田中慶太,ほか2名,事象関連コヒーレンス解析を用いた脳磁界聴性40Hz応答の検討,電気学会論文誌C(電子・情報・システム部門誌),2005年,第125巻,第6号,pp.898-903 |
Also Published As
Similar Documents
| Publication | Publication Date | Title |
|---|---|---|
| JP7204192B2 (en) | Systems and methods for preventing, reducing, and/or treating dementia | |
| EP3694464B1 (en) | Systems for preventing, mitigating, and/or treating dementia | |
| Zhao et al. | Sleep restoration by optogenetic targeting of GABAergic neurons reprograms microglia and ameliorates pathological phenotypes in an Alzheimer’s disease model | |
| Tinston et al. | Forty‐hertz sensory entrainment impedes kindling epileptogenesis and reduces amyloid pathology in an Alzheimer disease mouse model | |
| KR20260035288A (en) | Systems and methods for preventing, mitigating, and/or treating dementia | |
| HK40086450A (en) | Systems and methods for preventing, mitigating, and/or treating dementia | |
| HK1261893B (en) | Systems and methods for preventing, mitigating, and/or treating dementia | |
| HK1261893A1 (en) | Systems and methods for preventing, mitigating, and/or treating dementia | |
| Hackett | The cholinergic system and pharmacological inhibition of MMP-9 in the McGill THY-1APP mouse model of Alzheimer's disease |
Legal Events
| Date | Code | Title | Description |
|---|---|---|---|
| A621 | Written request for application examination |
Free format text: JAPANESE INTERMEDIATE CODE: A621 Effective date: 20191125 |
|
| A521 | Request for written amendment filed |
Free format text: JAPANESE INTERMEDIATE CODE: A523 Effective date: 20200730 |
|
| A871 | Explanation of circumstances concerning accelerated examination |
Free format text: JAPANESE INTERMEDIATE CODE: A871 Effective date: 20200730 |
|
| A975 | Report on accelerated examination |
Free format text: JAPANESE INTERMEDIATE CODE: A971005 Effective date: 20201021 |
|
| A131 | Notification of reasons for refusal |
Free format text: JAPANESE INTERMEDIATE CODE: A131 Effective date: 20201102 |
|
| A601 | Written request for extension of time |
Free format text: JAPANESE INTERMEDIATE CODE: A601 Effective date: 20210120 |
|
| A601 | Written request for extension of time |
Free format text: JAPANESE INTERMEDIATE CODE: A601 Effective date: 20210330 |
|
| A521 | Request for written amendment filed |
Free format text: JAPANESE INTERMEDIATE CODE: A523 Effective date: 20210422 |
|
| A02 | Decision of refusal |
Free format text: JAPANESE INTERMEDIATE CODE: A02 Effective date: 20210719 |
|
| A521 | Request for written amendment filed |
Free format text: JAPANESE INTERMEDIATE CODE: A523 Effective date: 20211119 |
|
| C60 | Trial request (containing other claim documents, opposition documents) |
Free format text: JAPANESE INTERMEDIATE CODE: C60 Effective date: 20211119 |
|
| A521 | Request for written amendment filed |
Free format text: JAPANESE INTERMEDIATE CODE: A821 Effective date: 20211119 |
|
| C11 | Written invitation by the commissioner to file amendments |
Free format text: JAPANESE INTERMEDIATE CODE: C11 Effective date: 20211220 |
|
| A911 | Transfer to examiner for re-examination before appeal (zenchi) |
Free format text: JAPANESE INTERMEDIATE CODE: A911 Effective date: 20220121 |
|
| C21 | Notice of transfer of a case for reconsideration by examiners before appeal proceedings |
Free format text: JAPANESE INTERMEDIATE CODE: C21 Effective date: 20220124 |
|
| A912 | Re-examination (zenchi) completed and case transferred to appeal board |
Free format text: JAPANESE INTERMEDIATE CODE: A912 Effective date: 20220204 |
|
| C211 | Notice of termination of reconsideration by examiners before appeal proceedings |
Free format text: JAPANESE INTERMEDIATE CODE: C211 Effective date: 20220214 |
|
| C22 | Notice of designation (change) of administrative judge |
Free format text: JAPANESE INTERMEDIATE CODE: C22 Effective date: 20220411 |
|
| C13 | Notice of reasons for refusal |
Free format text: JAPANESE INTERMEDIATE CODE: C13 Effective date: 20220530 |
|
| A521 | Request for written amendment filed |
Free format text: JAPANESE INTERMEDIATE CODE: A523 Effective date: 20220824 |
|
| C23 | Notice of termination of proceedings |
Free format text: JAPANESE INTERMEDIATE CODE: C23 Effective date: 20221027 |
|
| C03 | Trial/appeal decision taken |
Free format text: JAPANESE INTERMEDIATE CODE: C03 Effective date: 20221121 |
|
| C30A | Notification sent |
Free format text: JAPANESE INTERMEDIATE CODE: C3012 Effective date: 20221121 |
|
| A61 | First payment of annual fees (during grant procedure) |
Free format text: JAPANESE INTERMEDIATE CODE: A61 Effective date: 20221221 |
|
| R150 | Certificate of patent or registration of utility model |
Ref document number: 7204192 Country of ref document: JP Free format text: JAPANESE INTERMEDIATE CODE: R150 |
|
| RD02 | Notification of acceptance of power of attorney |
Free format text: JAPANESE INTERMEDIATE CODE: R3D02 |
|
| R250 | Receipt of annual fees |
Free format text: JAPANESE INTERMEDIATE CODE: R250 |
|
| RD04 | Notification of resignation of power of attorney |
Free format text: JAPANESE INTERMEDIATE CODE: R3D04 |