JP7056002B2 - Blood pressure measuring device, method and program - Google Patents
Blood pressure measuring device, method and program Download PDFInfo
- Publication number
- JP7056002B2 JP7056002B2 JP2017050650A JP2017050650A JP7056002B2 JP 7056002 B2 JP7056002 B2 JP 7056002B2 JP 2017050650 A JP2017050650 A JP 2017050650A JP 2017050650 A JP2017050650 A JP 2017050650A JP 7056002 B2 JP7056002 B2 JP 7056002B2
- Authority
- JP
- Japan
- Prior art keywords
- blood pressure
- surge
- unit
- time
- pressure measuring
- Prior art date
- Legal status (The legal status is an assumption and is not a legal conclusion. Google has not performed a legal analysis and makes no representation as to the accuracy of the status listed.)
- Active
Links
Images


Classifications
-
- A—HUMAN NECESSITIES
- A61—MEDICAL OR VETERINARY SCIENCE; HYGIENE
- A61B—DIAGNOSIS; SURGERY; IDENTIFICATION
- A61B5/00—Measuring for diagnostic purposes; Identification of persons
- A61B5/02—Detecting, measuring or recording pulse, heart rate, blood pressure or blood flow; Combined pulse/heart-rate/blood pressure determination; Evaluating a cardiovascular condition not otherwise provided for, e.g. using combinations of techniques provided for in this group with electrocardiography or electroauscultation; Heart catheters for measuring blood pressure
- A61B5/021—Measuring pressure in heart or blood vessels
- A61B5/02108—Measuring pressure in heart or blood vessels from analysis of pulse wave characteristics
- A61B5/02116—Measuring pressure in heart or blood vessels from analysis of pulse wave characteristics of pulse wave amplitude
-
- A—HUMAN NECESSITIES
- A61—MEDICAL OR VETERINARY SCIENCE; HYGIENE
- A61B—DIAGNOSIS; SURGERY; IDENTIFICATION
- A61B5/00—Measuring for diagnostic purposes; Identification of persons
- A61B5/02—Detecting, measuring or recording pulse, heart rate, blood pressure or blood flow; Combined pulse/heart-rate/blood pressure determination; Evaluating a cardiovascular condition not otherwise provided for, e.g. using combinations of techniques provided for in this group with electrocardiography or electroauscultation; Heart catheters for measuring blood pressure
- A61B5/021—Measuring pressure in heart or blood vessels
- A61B5/02108—Measuring pressure in heart or blood vessels from analysis of pulse wave characteristics
-
- A—HUMAN NECESSITIES
- A61—MEDICAL OR VETERINARY SCIENCE; HYGIENE
- A61B—DIAGNOSIS; SURGERY; IDENTIFICATION
- A61B5/00—Measuring for diagnostic purposes; Identification of persons
- A61B5/02—Detecting, measuring or recording pulse, heart rate, blood pressure or blood flow; Combined pulse/heart-rate/blood pressure determination; Evaluating a cardiovascular condition not otherwise provided for, e.g. using combinations of techniques provided for in this group with electrocardiography or electroauscultation; Heart catheters for measuring blood pressure
- A61B5/021—Measuring pressure in heart or blood vessels
- A61B5/02141—Details of apparatus construction, e.g. pump units or housings therefor, cuff pressurising systems, arrangements of fluid conduits or circuits
-
- A—HUMAN NECESSITIES
- A61—MEDICAL OR VETERINARY SCIENCE; HYGIENE
- A61B—DIAGNOSIS; SURGERY; IDENTIFICATION
- A61B5/00—Measuring for diagnostic purposes; Identification of persons
- A61B5/02—Detecting, measuring or recording pulse, heart rate, blood pressure or blood flow; Combined pulse/heart-rate/blood pressure determination; Evaluating a cardiovascular condition not otherwise provided for, e.g. using combinations of techniques provided for in this group with electrocardiography or electroauscultation; Heart catheters for measuring blood pressure
- A61B5/021—Measuring pressure in heart or blood vessels
- A61B5/022—Measuring pressure in heart or blood vessels by applying pressure to close blood vessels, e.g. against the skin; Ophthalmodynamometers
-
- A—HUMAN NECESSITIES
- A61—MEDICAL OR VETERINARY SCIENCE; HYGIENE
- A61B—DIAGNOSIS; SURGERY; IDENTIFICATION
- A61B5/00—Measuring for diagnostic purposes; Identification of persons
- A61B5/72—Signal processing specially adapted for physiological signals or for diagnostic purposes
- A61B5/7235—Details of waveform analysis
- A61B5/7264—Classification of physiological signals or data, e.g. using neural networks, statistical classifiers, expert systems or fuzzy systems
-
- A—HUMAN NECESSITIES
- A61—MEDICAL OR VETERINARY SCIENCE; HYGIENE
- A61B—DIAGNOSIS; SURGERY; IDENTIFICATION
- A61B5/00—Measuring for diagnostic purposes; Identification of persons
- A61B5/74—Details of notification to user or communication with user or patient ; user input means
- A61B5/742—Details of notification to user or communication with user or patient ; user input means using visual displays
-
- A—HUMAN NECESSITIES
- A61—MEDICAL OR VETERINARY SCIENCE; HYGIENE
- A61B—DIAGNOSIS; SURGERY; IDENTIFICATION
- A61B5/00—Measuring for diagnostic purposes; Identification of persons
- A61B5/02—Detecting, measuring or recording pulse, heart rate, blood pressure or blood flow; Combined pulse/heart-rate/blood pressure determination; Evaluating a cardiovascular condition not otherwise provided for, e.g. using combinations of techniques provided for in this group with electrocardiography or electroauscultation; Heart catheters for measuring blood pressure
- A61B5/02007—Evaluating blood vessel condition, e.g. elasticity, compliance
-
- A—HUMAN NECESSITIES
- A61—MEDICAL OR VETERINARY SCIENCE; HYGIENE
- A61B—DIAGNOSIS; SURGERY; IDENTIFICATION
- A61B5/00—Measuring for diagnostic purposes; Identification of persons
- A61B5/48—Other medical applications
- A61B5/4806—Sleep evaluation
- A61B5/4818—Sleep apnoea
-
- A—HUMAN NECESSITIES
- A61—MEDICAL OR VETERINARY SCIENCE; HYGIENE
- A61B—DIAGNOSIS; SURGERY; IDENTIFICATION
- A61B5/00—Measuring for diagnostic purposes; Identification of persons
- A61B5/68—Arrangements of detecting, measuring or recording means, e.g. sensors, in relation to patient
- A61B5/6801—Arrangements of detecting, measuring or recording means, e.g. sensors, in relation to patient specially adapted to be attached to or worn on the body surface
- A61B5/6813—Specially adapted to be attached to a specific body part
- A61B5/6824—Arm or wrist
-
- A—HUMAN NECESSITIES
- A61—MEDICAL OR VETERINARY SCIENCE; HYGIENE
- A61B—DIAGNOSIS; SURGERY; IDENTIFICATION
- A61B5/00—Measuring for diagnostic purposes; Identification of persons
- A61B5/74—Details of notification to user or communication with user or patient ; user input means
- A61B5/746—Alarms related to a physiological condition, e.g. details of setting alarm thresholds or avoiding false alarms
Description
この発明は、血圧値を連続測定する血圧測定装置、方法及びプログラムに関する。 The present invention relates to a blood pressure measuring device, method and program for continuously measuring a blood pressure value.
生体情報を活用して早期に生体の異変を察知して治療に役立てることは、センサ技術の発展に伴い、高性能なセンサが容易に利用できる環境になり医療における重要性も次第に増してきている。
手首の橈骨動脈等の動脈が通る生体部位に圧力センサを直接接触させた状態で、この圧力センサにより検出される情報を用いて脈拍や血圧等の生体情報を測定することのできるトノメトリ方式による血圧測定装置が知られている(例えば特許文献1参照)。
With the development of sensor technology, it is becoming more and more important in medical treatment to use biometric information to detect abnormalities in the living body at an early stage and use it for treatment as it becomes an environment where high-performance sensors can be easily used. ..
Blood pressure by the tonometry method that can measure biological information such as pulse and blood pressure using the information detected by this pressure sensor with the pressure sensor in direct contact with the biological part through which the artery such as the radial artery of the wrist passes. Measuring devices are known (see, for example, Patent Document 1).
しかし、特許文献1に記載の血圧測定装置は、生体の血圧情報を取得できるにすぎず、血圧情報の異変を察知することはできない。 However, the blood pressure measuring device described in Patent Document 1 can only acquire blood pressure information of a living body, and cannot detect a change in blood pressure information.
この発明は上記事情に着目してなされたもので、血圧情報から、急激な血圧変動である血圧サージ(以下「サージ」という)に関する特徴量を抽出可能な血圧測定装置、方法及びプログラムを提供することを目的とする。 The present invention has been made by paying attention to the above circumstances, and provides a blood pressure measuring device, a method, and a program capable of extracting a feature amount related to a blood pressure surge (hereinafter referred to as "surge") which is a sudden blood pressure fluctuation from blood pressure information. The purpose is.
上記課題を解決するためにこの発明の第1の態様は、血圧測定装置であって、心拍に連動して変化する血圧値の時系列データを得る血圧測定部と、前記時系列データから1つのサージを含むサージ区間を1以上検出する検出部と、前記サージごとに1以上の特徴量を抽出する抽出部と、前記特徴量に基づいてサージを分類する分類部と、を備えるものである。 In order to solve the above problem, the first aspect of the present invention is a blood pressure measuring device, which is a blood pressure measuring unit that obtains time-series data of a blood pressure value that changes in association with a heartbeat, and one from the time-series data. It includes a detection unit that detects one or more surge sections including a surge, an extraction unit that extracts one or more feature amounts for each surge, and a classification unit that classifies surges based on the feature amounts.
この発明の第2の態様は、前記分類部は、前記特徴量の数以下で1以上を次元数とし、次元に対応する特徴量を軸とする前記次元数の空間に前記サージをマッピングするものである。 In the second aspect of the present invention, the classification unit maps the surge to the space of the number of dimensions centered on the feature quantity corresponding to the dimension, with one or more as the number of dimensions less than or equal to the number of the feature quantities. Is.
この発明の第3の態様は、前記抽出部は、前記サージが開始してから前記サージがピークになるまでの上昇時間と、前記サージがピークになってから前記サージが終了するまでの下降時間と、前記上昇時間において血圧が変動した量と、を前記特徴量として抽出する。 In the third aspect of the present invention, the extraction unit has an ascending time from the start of the surge to the peak of the surge and a descending time from the peak of the surge to the end of the surge. And the amount in which the blood pressure fluctuates during the rise time are extracted as the feature amount.
この発明の第4の態様は、前記検出部は、前記時系列データのうちの収縮期血圧の極大値をピーク点とし、前記ピーク点の直前の極小値を開始点とし、前記ピーク点の直後の極小値になる以前の点であり前記直後の極小値との差がある値以下になった点を終了点とする場合に、前記ピーク点での血圧値と前記開始点での血圧値の差が閾値より大きく、かつ、前記ピーク点と前回開始点との時間差がある第1期間より大きく、かつ、前記ピーク点と前記終了点との時間差がある第2期間よりも大きい場合に、前記開始点から前記ピーク点を挟み前記終了点までの区間がサージ区間であると検出するものである。 In a fourth aspect of the present invention, the detection unit uses the maximum value of systolic blood pressure in the time-series data as the peak point, the minimum value immediately before the peak point as the start point, and immediately after the peak point. The blood pressure value at the peak point and the blood pressure value at the start point are the points before the minimum value of When the difference is larger than the threshold value, the time difference between the peak point and the previous start point is larger than the first period, and the time difference between the peak point and the end point is larger than the second period. The section from the start point to the end point across the peak point is detected as a surge section.
この発明の第5の態様は、前記分類部が分類したサージを、特徴量を軸にして可視化する可視化部をさらに備えるものである。 A fifth aspect of the present invention further includes a visualization unit that visualizes surges classified by the classification unit with a feature amount as an axis.
この発明の第6の態様は、前記特徴量の統計量を算出する算出部をさらに備えるものである。 A sixth aspect of the present invention further includes a calculation unit for calculating the statistic of the feature amount.
この発明の第7の態様は、前記分類部が分類したサージを、前記特徴量の統計量を軸にして可視化する可視化部をさらに備えるものである。 A seventh aspect of the present invention further includes a visualization unit that visualizes the surge classified by the classification unit with the statistic of the feature amount as the axis.
この発明の第8の態様は、前記統計量に対応して予め設定された危険性と関連付けられている、統計量とを比較される閾値に基づいて生体の危険度を判定する判定部をさらに備えるものである。 Eighth aspect of the present invention further comprises a determination unit for determining the risk of a living body based on a threshold value compared with the statistic, which is associated with a preset risk corresponding to the statistic. To prepare.
この発明の第9の態様は、前記サージを前記危険度に応じて可視化する可視化部をさらに備え、前記閾値に対応する危険水準を設定してサージが危険かどうか区別するものである。 A ninth aspect of the present invention further includes a visualization unit that visualizes the surge according to the degree of danger, and sets a danger level corresponding to the threshold value to distinguish whether the surge is dangerous or not.
この発明の第10の態様は、投薬記録に基づいて、検出された前記サージが、投薬されている期間のものかを判定する判定部をさらに備えるものである。 A tenth aspect of the present invention further comprises a determination unit for determining whether the detected surge is for the period of dosing based on the dosing record.
この発明の第11の態様は、投薬されている期間かどうかで分けて前記サージを可視化する可視化部をさらに備えるものである。 The eleventh aspect of the present invention further comprises a visualization unit that visualizes the surge according to whether or not it is being administered.
この発明の第12の態様は、前記血圧測定部は、複数のユーザ分の時系列データを得て、前記可視化部は、ユーザごとに前記サージを可視化するものである。 In a twelfth aspect of the present invention, the blood pressure measuring unit obtains time-series data for a plurality of users, and the visualization unit visualizes the surge for each user.
この発明の第13の態様は、前記サージの発生頻度を算出する頻度算出部と、サージの発生頻度と無呼吸低呼吸指数との予め取得した関係から、前記発生頻度に基づいて無呼吸低呼吸指数を算出する指数算出部と、をさらに備えるものである。 A thirteenth aspect of the present invention is an apnea-hypopnea based on the occurrence frequency from the relationship obtained in advance between the frequency calculation unit for calculating the surge occurrence frequency and the surge occurrence frequency and the apnea-hypopnea index. It further includes an index calculation unit for calculating an index.
この発明の第1の態様によれば、血圧測定装置は、心拍に連動して変化する血圧値の時系列データを得て、時系列データから1つのサージを含むサージ区間を1以上検出し、サージごとに1以上の特徴量を抽出し、特徴量に基づいてサージを分類することにより、血圧値を取得した生体のサージに関する特徴を得ることができる。この特徴に基づいて、この生体に患者が対応する場合には、患者への投薬や精密検査の必要性を判定することができる。 According to the first aspect of the present invention, the blood pressure measuring device obtains time-series data of blood pressure values that change in conjunction with the heartbeat, and detects one or more surge sections including one surge from the time-series data. By extracting one or more feature amounts for each surge and classifying the surges based on the feature amounts, it is possible to obtain the characteristics related to the surge of the living body from which the blood pressure value has been acquired. Based on this feature, when the patient responds to this living body, it is possible to determine the need for medication or a detailed examination for the patient.
この発明の第2の態様によれば、分類部は、特徴量の数以下で1以上を次元数とし、次元に対応する特徴量を軸とする次元数の空間にサージをマッピングすることにより、そのサージの特徴が空間にマッピングされるので、その空間の領域によって異なる特徴が一目瞭然になり、サージの特徴を直ちに理解できるようになる。従って、サージを発生した生体の特徴も理解することができる。 According to the second aspect of the present invention, the classification unit sets the number of dimensions to 1 or more as less than or equal to the number of feature quantities, and maps the surge to the space of the number of dimensions centered on the feature quantity corresponding to the dimension. Since the characteristics of the surge are mapped to the space, the characteristics that differ depending on the area of the space become clear at a glance, and the characteristics of the surge can be understood immediately. Therefore, it is possible to understand the characteristics of the living body in which the surge is generated.
この発明の第3の態様によれば、抽出部は、サージが開始してからサージがピークになるまでの上昇時間と、サージがピークになってからサージが終了するまでの下降時間と、前記上昇時間において血圧が変動した量と、を特徴量として抽出することにより、上昇時間と下降時間を軸とした2次元空間上にサージをマッピングすることができる。従って、上昇時間及び下降時間でサージを分類することができ、生体のこの2つの指標に基づいて生体の特徴を理解することができる。さらに、変動量によって呼吸器にかかった負荷の程度も推定することができ、変動量も含めて3次元空間状にサージをマッピングすることもできる。この結果、生体のこの3つの指標に基づいて生体の特徴を理解することができる。 According to the third aspect of the present invention, the extraction unit has an ascending time from the start of the surge to the peak of the surge, a descending time from the peak of the surge to the end of the surge, and the above-mentioned. By extracting the amount of fluctuation of blood pressure during the ascending time as a feature amount, it is possible to map the surge on the two-dimensional space centered on the ascending time and the descending time. Therefore, the surge can be classified according to the ascending time and the descending time, and the characteristics of the living body can be understood based on these two indexes of the living body. Furthermore, the degree of load applied to the respiratory organ can be estimated from the fluctuation amount, and the surge can be mapped in a three-dimensional space including the fluctuation amount. As a result, the characteristics of the living body can be understood based on these three indexes of the living body.
この発明の第4の態様によれば、検出部は、時系列データのうちの収縮期血圧の極大値をピーク点とし、ピーク点の直前の極小値を開始点とし、ピーク点の直後の極小値になる以前の点でありこの直後の極小値との差がある値以下になった点を終了点とする場合に、ピーク点での血圧値と開始点での血圧値の差が閾値より大きく、かつ、ピーク点と開始点との時間差がある第1期間より大きく、かつ、ピーク点と終了点との時間差がある第2期間よりも大きい場合に、開始点からピーク点を挟み終了点までの区間がサージ区間であると検出することにより、血圧値のどういう時系列データをサージとするかが明確になり、血圧測定装置がサージを明確に分類することができる。 According to the fourth aspect of the present invention, the detection unit has the maximum value of the systolic blood pressure in the time series data as the peak point, the minimum value immediately before the peak point as the starting point, and the minimum value immediately after the peak point. When the end point is the point before the value and the difference from the minimum value immediately after this is less than or equal to the value, the difference between the blood pressure value at the peak point and the blood pressure value at the start point is from the threshold value. When the time difference between the peak point and the start point is larger than the first period and the time difference between the peak point and the end point is larger than the second period, the end point is sandwiched between the start point and the end point. By detecting that the section up to is a surge section, it becomes clear what kind of time-series data of the blood pressure value is used as the surge, and the blood pressure measuring device can clearly classify the surge.
この発明の第5の態様によれば、分類部が分類したサージを、特徴量を軸にして可視化するので、医師または患者が特徴量に基づいて分類されたサージを見ることができる。従って、一見してサージに関連する患者の状態を把握することができる。 According to the fifth aspect of the present invention, the surge classified by the classification unit is visualized with the feature amount as the axis, so that the doctor or the patient can see the surge classified based on the feature amount. Therefore, at first glance, the patient's condition related to the surge can be grasped.
この発明の第6の態様によれば、特徴量の統計量を算出するので、ある期間の全体の傾向を把握しやすくなる。 According to the sixth aspect of the present invention, since the statistic of the feature amount is calculated, it becomes easy to grasp the overall tendency of a certain period.
この発明の第7の態様によれば、統計量で可視化するので、ある期間の全体の傾向を一見して把握しやすくなる。 According to the seventh aspect of the present invention, since the visualization is performed by statistics, it becomes easy to grasp the overall tendency of a certain period at a glance.
この発明の第8の態様によれば、危険性と関連付けられている閾値と統計量とを比較して生体の危険度を判定することができるので、複数の患者について統計を取った場合に、それぞれの患者の危険度の目安が意見して分かりやすくなる。 According to the eighth aspect of the present invention, since the threshold value associated with the risk and the statistic can be compared to determine the risk level of the living body, when statistics are taken for a plurality of patients, the statistic can be obtained. It will be easier to understand the risk level of each patient by giving an opinion.
この発明の第9の態様によれば、危険度に応じて可視化され、危険水準を設定してサージが危険かどうか区別するので、サージごとに危険性を把握することができる。また、複数のユーザの場合にはユーザごとに危険性を把握することができる。 According to the ninth aspect of the present invention, it is visualized according to the degree of danger, and the danger level is set to distinguish whether the surge is dangerous or not, so that the danger can be grasped for each surge. Further, in the case of a plurality of users, the risk can be grasped for each user.
この発明の第10の態様によれば、検出されたサージが投薬された期間のものかどうか判定することができるので、サージの特徴量と投薬の有無とをリンクして考えることが可能になる。サージの特徴量により患者の状態が変化した場合には、投薬の有効性を判定することが可能になる。 According to the tenth aspect of the present invention, it is possible to determine whether or not the detected surge is for the period of administration, so that the feature amount of the surge and the presence or absence of administration can be linked and considered. .. When the patient's condition changes due to the feature amount of the surge, it becomes possible to determine the effectiveness of the medication.
この発明の第11の態様によれば、投薬されている期間かどうかで分けて前記サージを可視化するので、投薬期間かどうかでサージが変化するかどうかが判明する。従って投薬がサージに効果があるかどうか一見して判別することができる。 According to the eleventh aspect of the present invention, since the surge is visualized according to whether or not it is being administered, it is possible to determine whether or not the surge changes depending on whether or not it is being administered. Therefore, it is possible to determine at a glance whether the medication is effective for the surge.
この発明の第12の態様によれば、ユーザごとにサージを可視化するので、ユーザごとにサージの特徴を把握することができる。 According to the twelfth aspect of the present invention, since the surge is visualized for each user, the characteristics of the surge can be grasped for each user.
この発明の第13の態様によれば、血圧サージの発生頻度を算出し、血圧サージの発生頻度と無呼吸低呼吸指数との予め取得した関係から、発生頻度に基づいて無呼吸低呼吸指数を算出することにより、血圧サージを参照することによって無呼吸低呼吸指数を算出することができる。従って、血圧サージを分析することで、無呼吸低呼吸指数を算出することができるので、以前よりも容易にこの指数を得ることができる。 According to the thirteenth aspect of the present invention, the frequency of occurrence of blood pressure surge is calculated, and the apnea-hypopnea index is calculated based on the frequency of occurrence from the relationship obtained in advance between the frequency of occurrence of blood pressure surge and the apnea-hypopnea index. By calculating, the apnea-hypopnea index can be calculated by referring to the blood pressure surge. Therefore, the apnea-hypopnea index can be calculated by analyzing the blood pressure surge, and this index can be obtained more easily than before.
すなわちこの発明の各態様によれば、生体情報に基づいて生体の特徴を判定することができる血圧測定装置、方法及びプログラムを提供することができる。 That is, according to each aspect of the present invention, it is possible to provide a blood pressure measuring device, a method and a program capable of determining the characteristics of a living body based on biological information.
以下、図面を参照してこの発明に係る実施形態の血圧測定装置、方法及びプログラムを説明する。なお、以下の実施形態では、同一の番号を付した部分については同様の動作を行うものとして、重ねての説明を省略する。 Hereinafter, the blood pressure measuring device, the method, and the program according to the embodiment of the present invention will be described with reference to the drawings. In the following embodiments, the same operation is performed for the portions with the same number, and the description thereof will be omitted.
(第1の実施形態)
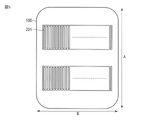
本実施形態に係る血圧測定装置100について図1乃至図5を参照して説明する。図1は、血圧測定装置100の機能ブロック図であり、時間的に連続して測定する血圧測定部101と、サージ区間検出部102と、サージ特徴量抽出部103と、特徴量分類部104と、記憶部105と、表示部106と、を示している。図2は、血圧測定部101の機能ブロック図であり、トノメトリ方式を採用して血圧を時間的に連続して一心拍ごとに測定することができるものである。図3は、血圧測定装置100が装着されるイメージ図であり、手のひらを横(手を広げた場合の指が並ぶ方向)から見た概略透視図である。図3は、圧力センサが橈骨動脈に交差して二列に配置されている一例を示している。図3は、血圧測定装置100が腕の手のひら側に載せられている状態を示しているが、実際の使用状態では血圧測定装置100は腕に巻き付けて固定している。
(First Embodiment)
The blood
図4は、血圧測定装置100が手首に装着されている状態でセンサ部201の位置での血圧測定装置100と手首Wの断面図である。図4では橈骨動脈RAが血圧測定装置100に押圧されていてその上部が扁平化されていることも示している。図5は、血圧測定装置100の生体に接触する側から見た図であり、この接触する面にセンサ部201が2列に平行に配置されている。センサ部201は、血圧測定装置100が手首Wに装着された状態で橈骨動脈が延伸している方向Aに交差する方向Bに1つのセンサが複数個並んでいる。
FIG. 4 is a cross-sectional view of the blood
血圧測定装置100は、図1に示すように、血圧測定部101、サージ区間検出部102、サージ特徴量抽出部103、特徴量分類部104、記憶部105、及び表示部106を含む。
As shown in FIG. 1, the blood
血圧測定装置100は例えば、環状になっていて、手首等にブレスレットのように巻き付き、生体情報から血圧を測定する。血圧測定装置100は、図2及び図3に示すように、センサ部201(例えば、圧力センサ)が橈骨動脈上に位置するように血圧測定装置100が配置される。また、血圧測定装置100は心臓の高さに合わせて配置することが好ましい。
The blood
血圧測定部101は例えば、心拍に連動して変化する血圧値の波形の時系列データを得るためのものであり、トノメトリ法によって時間的に連続した一心拍ごとの圧脈波の圧力を測定する。トノメトリ法は血管を圧力センサ(例えば、圧脈波センサ)で圧扁することにより圧脈波を計測し血圧を決定する手法である。血管の厚さが一様な円管と見なすと、血管内の血液の流れ、拍動の有無に関係なく血管壁を考慮してラプラスの法則に従い、血管の内圧(血圧)と血管の外圧(圧脈波の圧力)との関係式を導くことができる。この関係式で押圧面において血管が圧扁されている条件下では、血管の外壁及び内壁の半径を近似することにより、圧脈波の圧力と血圧とが等しいと近似できる。従って以降は、圧脈波の圧力は血圧と同一値になるとする。この結果、血圧測定部101は装着される生体の血圧値を一心拍ごとに測定することになる。
The blood
サージ区間検出部102は、血圧測定部101から取得した連続した血圧値の時系列データからサージ区間を検出する。サージとは、前述のように急激な血圧変動のことをいう。ここでは典型的にサージになる条件を満たす区間をサージ区間として特定する。換言すればサージとなる条件を厳密に定義することはここではしない。しかし、ここで記述するサージになる条件を単に他の条件に置き換えるだけで、本実施形態の血圧測定装置100はサージとなるどんな条件にも適用可能である。
The surge
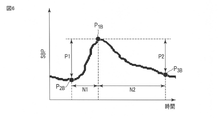
血圧値の時系列データの一部が典型的なサージとなる条件は、例えば以下のものが考えられる。以下の条件は収縮期血圧(SBP:systolic blood pressure)の値の変化で表現する。しかしながら、収縮期血圧、拡張期血圧、平均血圧、及び脈圧の内の少なくとも1つの値の変化で条件を表現してもよい。なお、実際のSBPの値は連続した値にはなってもスムーズな曲線にはならないので、以降の処理で扱いやすいように血圧値の時系列データにスムージング処理を施し、例えば連続して滑らかな微分可能な曲線に加工する。ここでは、血圧値の時系列データを表した曲線は滑らかで微分可能にスムージング処理されたものとする。以下、図6を参照して説明する。 The conditions under which a part of the time-series data of the blood pressure value becomes a typical surge can be considered, for example, as follows. The following conditions are expressed by changes in systolic blood pressure (SBP) values. However, the condition may be expressed by changes in at least one of systolic blood pressure, diastolic blood pressure, mean blood pressure, and pulse pressure. Since the actual SBP value does not form a smooth curve even if it becomes a continuous value, smoothing processing is applied to the time-series data of the blood pressure value so that it can be easily handled in the subsequent processing, for example, continuously smooth. Process into a differentiable curve. Here, it is assumed that the curve representing the time series data of the blood pressure value is smooth and differentiably smoothed. Hereinafter, it will be described with reference to FIG.
以上のスムージング処理を済ませた後、図6に示すように、SBPの時系列データで極大値をもつピーク点P1Bを選択する。通常このピーク点P1Bは複数発見される。次に、このピーク点P1Bよりも時間的に前に極小値をもつ極小点P2Bを探し、極小点P2Bが見つかった場合には、次の条件に進む。P1Bの血圧値とP2Bの血圧値との差分P1がある閾値(例えば、20mmHg)よりも大きいかを判定する。小さい場合にはサージではないと判定する。次に、ピーク点P1Bと極小点P2Bとの時間差N1がある期間(例えば、5心拍分の時間)よりも大きいかを判定し、大きい場合にはP2Bがサージの開始点であると判定する。次にピーク点P1Bよりも未来の時刻で微分値がある値(例えば、-0.2mmHg/秒)よりも大きくなる点P3Bを求める。次に、点P1Bと点P3Bとの時間差N2がある期間(例えば、7心拍分の時間)よりも大きいかを判定し、大きい場合には点P3Bがサージの終了点であると判定する。ここで大きい場合には、これら点P1B、点P2B、点P3Bでサージを形成すると判定する。この場合に、サージ区間検出部102は、点P2Bから点P3Bまでをサージ区間と見なす。
After completing the above smoothing process, as shown in FIG . 6, the peak point P1B having the maximum value is selected from the time series data of SBP. Usually, a plurality of peak points P1B are found. Next, the minimum point P 2B having the minimum value is searched for before the peak point P 1B , and if the minimum point P 2B is found, the process proceeds to the next condition. It is determined whether the difference P1 between the blood pressure value of P 1B and the blood pressure value of P 2B is larger than a certain threshold value (for example, 20 mmHg). If it is small, it is judged that it is not a surge. Next, it is determined whether the time difference N1 between the peak point P 1B and the minimum point P 2B is larger than a certain period (for example, the time for 5 heartbeats), and if it is larger, P 2B is the start point of the surge. judge. Next, a point P 3B having a differential value larger than a certain value (for example, −0.2 mmHg / sec) at a time in the future than the peak point P 1B is obtained. Next, it is determined whether the time difference N2 between the point P 1B and the point P 3B is larger than a certain period (for example, the time for 7 heartbeats), and if it is larger, it is determined that the point P 3B is the end point of the surge. do. If it is large here, it is determined that a surge is formed at these points P 1B , P 2B , and P 3B . In this case, the surge
サージ特徴量抽出部103は、検出されたサージの特徴量を抽出する。サージの特徴量としては図6に示す点P1B、P2B、及びP3Bの血圧値と時刻に関連する量が該当する。図6に示した量では例えば、P1、P2、N1、及びN2がある。P1は、サージのピーク点P1Bでの血圧値とサージの開始点P2Bでの血圧値との差である。P2は、サージのピーク点P1Bでの血圧値と、サージの終了点P3Bでの血圧値との差である(血圧変動量と称する)。N1は、サージのピーク点P1Bでの時刻とサージの開始点P2Bでの時刻との差であり、上昇時間と称す。N2は、サージのピーク点P1Bでの時刻とサージの終了点P3Bでの時刻との差であり、下降時間と称す。
本実施形態では、サージ特徴量抽出部103は上昇時間と下降時間をサージごとに抽出する。すなわち、サージ特徴量抽出部103は、サージ区間検出部102で検出されたサージ区間ごとに上昇時間と下降時間とを抽出する。
The surge feature
In the present embodiment, the surge feature
特徴量分類部104は、サージ特徴量抽出部103で抽出された特徴量に基づいてサージを分類する。特徴量分類部104は例えば、上昇時間と下降時間とを軸とする2次元平面に各サージをマッピングし、2次元平面の領域を設定し、サージを分類する。特徴量分類部104が分類することについては後に図9を参照して説明する。特徴量分類部104は、一般化すると、特徴量の種類数以下で1以上を次元数とし、それぞれの次元に対応する特徴量を軸とする次元数の空間にサージをマッピングしてサージを分類する。
The feature
記憶部105は、特徴量分類部104が分類した分類結果を記憶する。記憶部105は例えば、生体ごとに分類結果を対応付けて記憶しておく。
表示部106は、記憶部105に記憶されている分類結果を表示する。表示部106は例えば、無線部を介して血圧測定装置100とは異なる装置で分類結果を表示するようにしてもよい。
The
The
次に血圧測定部101について図2を参照して説明する。
血圧測定部101は、センサ部201、押圧部202、制御部203、記憶部204、操作部205、及び出力部206を含む。センサ部201は、圧脈波を時間的に連続して検出する。例えば、センサ部201は一心拍ごとに圧脈波を検出する。センサ部201は圧力を検出するセンサを含み、図3のように手のひら側に配置され、通常は図3のように腕の延伸方向に2列に平行して配置される。
Next, the blood
The blood
複数のセンサを含むセンサアレイのそれぞれの列は、腕の延伸方向に交差(ほぼ直交)して複数(例えば、46個)のセンサが配置されている。押圧部202は、ポンプ及び弁、圧力センサ、空気袋からなり、センサ部201のセンサ部分を空気袋がふくらむことによって手首に適切な圧力で押圧してセンサの感度を上げることができる。ポンプ及び弁によって空気袋に空気を入れ、圧力センサが空気袋内の圧力を検出し、制御部203が監視して制御することによって適切な圧力に調整する。制御部203は血圧測定部101の全体の制御を行い、センサ部201からは脈波の時系列データを受け取り、このデータを血圧値の時系列データに変換して記憶部204に記憶させる。
Each row of the sensor array containing the plurality of sensors intersects (almost orthogonally) in the extension direction of the arm, and a plurality of (for example, 46) sensors are arranged. The
記憶部204は血圧値の時系列データを格納し、制御部203からのリクエストに応じて所望のデータを渡す。操作部205はユーザ等からの入力をキーボード、マウス、及びマイク等から受け付けたり、外部のサーバ等からの指示を有線または無線で受け付ける。出力部206は、制御部203を介して記憶部204に格納されている血圧値の時系列データを受け取り血圧測定部101の外部へ渡す。
The
血圧測定装置100は、図3及び図4に示すように手首の手のひら側に配置され、血圧測定部101のセンサ部201が橈骨動脈RA上に位置するように配置される。図4の矢印で示すように押圧部202がセンサ部201を手首Wに押圧し橈骨動脈RAが圧扁する。なお、図3及び図4には示していないが、血圧測定装置100は環状になっていて、手首等にブレスレットのように巻き付き血圧を測定する。
The blood
次に、血圧測定装置100のセンサ部201について図5を参照して説明する。図5は、センサ部201の手首Wと接触する側の面を示している。図5に示すように、センサ部201は、1以上の(この例では2つの)センサアレイを備え、センサアレイの各々は、方向Bに配列された複数のセンサを有する。方向Bは、血圧測定装置100が被測定者に装着された状態において橈骨動脈の伸びる方向Aと交差する方向である。例えば、方向Aと方向Bは直交していてもよい。1つの列にセンサは例えば、46個(46チャンネルあると称す)配置されている。なお、ここではセンサはチャンネル番号が付与されている。また、センサの配置は図5に示す例に限定されない。
Next, the
各センサは、圧力を測定して圧力データを生成する。センサとしては、圧力を電気信号に変換する素子を用いることができる。図7に示すような圧力波形が圧力データとして得られる。圧脈波の測定結果は、センサの中から適応的に選択された1つのセンサ(アクティブチャンネル)から出力された圧力データに基づいて生成される。一心拍分の圧脈波の波形における最大値はSBPに対応し、一心拍分の圧脈波の波形における最小値は拡張期血圧(DBP:diastolic blood pressure)に対応する。 Each sensor measures pressure and produces pressure data. As the sensor, an element that converts pressure into an electric signal can be used. The pressure waveform as shown in FIG. 7 is obtained as pressure data. The pressure pulse wave measurement result is generated based on the pressure data output from one sensor (active channel) adaptively selected from the sensors. The maximum value in the waveform of the pressure pulse wave for one heartbeat corresponds to SBP, and the minimum value in the waveform of the pressure pulse wave for one heartbeat corresponds to diastolic blood pressure (DBP).
血圧データは、圧脈波の測定結果と共に、センサそれぞれから出力される圧力データを含むことができる。なお、脈波の測定結果は、血圧測定部101において生成されずに、血圧測定装置100内の情報処理部を含む制御部203によって圧力データに基づいて生成されてもよい。また、血圧測定装置100は、圧脈波の測定結果から血圧値の時系列データを算出し、脈波の測定結果に代えて、血圧値の時系列データを出力してもよい。
The blood pressure data can include the pressure data output from each sensor together with the measurement result of the pressure pulse wave. The measurement result of the pulse wave may not be generated by the blood
次に血圧測定部101が測定した圧脈波から算出した血圧の時系列データについて図7を参照して説明する。図7は、一心拍ごとの圧脈波の圧力を測定した際に圧脈波の圧力から算出した血圧の時系列データを示している。また、図7にはそのうちの1つの圧脈波に基づく血圧の波形700を示している。圧脈波に基づく血圧は、図7に示すような波形として一心拍ごとに検出され、それぞれの圧脈波に基づく血圧が連続して検出される。図7の波形700が一心拍の圧脈波に基づく血圧波形であり、701の圧力値がSBPに対応し702の圧力値がDBPに対応する。図7の圧脈波に対応する血圧の時系列に示されるように通常、一心拍ごとに血圧波形のSBP703及びDBP704は変動している。
Next, the time-series data of the blood pressure calculated from the pressure pulse wave measured by the blood
次に、血圧測定部101が検出した血圧値の時系列データにおいて、サージ区間検出部102が検出したサージ区間、サージ特徴量抽出部103が抽出した特徴量について図8を参照して説明する。
サージ区間検出部102がサージのピーク点を検出する。このピーク点は、時刻t2、t5、t8、t11で発見されていて、図8では長方形の内部がピーク点を示す。そして、サージ区間検出部102がサージの開始点を検出する。このサージの開始点は、時刻t1、t4、t7、t10で発見されている。さらにサージの終了点は、時刻t3、t6、t9、t12で発見されている。また、801及び802は参考に示したものであり、それぞれREM睡眠状態、覚醒反応を示し、他の検出装置で検出されたものである。なお、サージの開始点の発見方法は、例えば、ピーク点を見つけた後に、ピーク点よりも前の時刻で最小値となる点を探し、最小値の血圧値とピーク点での血圧値の差がある値以上の場合に、その最小値を有する点をサージの開始点とする方法がある。他のサージの開始点の発見方法は、ピーク点よりも前の時刻にあり、かつ、ピーク値よりも低くその差がある値になった点を開始点とする方法もある。一方、サージの終了点の発見方法は、例えば、サージの開始点を見つけた後に、ピーク点よりも後の時刻にあり、かつ、ピーク値よりも低くその差がある値になった点を終了点とする方法がある。
Next, in the time-series data of the blood pressure value detected by the blood
The surge
本実施形態では、サージ特徴量抽出部103がサージごとに上昇時間と下降時間とを取得し、特徴量分類部104がそれらの特徴量を分類する。図8の例では、サージごとの上昇時間と下降時間は、(上昇時間,下降時間)=(|t1-t2|,|t2-t3|)、(|t4-t5|,|t5-t6|)、(|t7-t8|,|t8-t9|)、及び(|t10-t11|,|t11-t12|)となる(なお||は絶対値の演算子である)。なお、特徴量として時間あたりのサージ発生頻度(SI:Surge Index)や、SIから推定したAHIを用いても良い。SIやAHIの推定については後述する。
In the present embodiment, the surge feature
次に、血圧測定部101が検出した血圧値の時系列データにおいて、サージ特徴量抽出部103が抽出した特徴量である上昇時間と下降時間とによって、特徴量分類部104が分類することについて図9を参照して説明する。
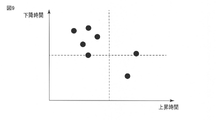
図9は、特徴量分類部104が上昇時間と下降時間とを2次元マッピングしたものである。図9に示されている各点はそれぞれ1つのサージに対応している。図9では特徴量分類部104が上昇時間及び下降時間がいずれもある閾値以上か以下で2通りに分けるので、2次元マップでは4つの領域に分類され特徴付けられる。
Next, in the time-series data of the blood pressure value detected by the blood
FIG. 9 is a two-dimensional mapping of the ascending time and the descending time by the feature
サージの上昇時間に対応する区間は自律神経系の調整力を表し、サージの下降時間に対応する区間は血圧調整力を表すと言われている。すなわち、上昇時間が長いほど自律神経調整力が強く、下降時間が短いほど血圧調整力が強いということを示す。それぞれの軸で閾値を設けこの指標に従うと、図9では、上昇時間及び下降時間が共に閾値以上である第1象限、上昇時間が閾値以下で下降時間が閾値以上である第2象限、上昇時間及び下降時間が共に閾値以下である第3象限、及び、上昇時間が閾値以上で下降時間が閾値以下である第4象限の4つに分類される。特徴量分類部104は、閾値を境界として、上昇時間の軸では自律神経調整力が弱いまたは強い、下降時間の軸では血圧調整力が強いまたは弱いと分類する。
It is said that the section corresponding to the surge rise time represents the regulation power of the autonomic nervous system, and the section corresponding to the surge fall time represents the blood pressure regulation power. That is, it is shown that the longer the ascending time, the stronger the autonomic nervous regulation ability, and the shorter the descending time, the stronger the blood pressure adjusting ability. According to this index when a threshold value is set for each axis, in FIG. 9, the first quadrant in which both the ascending time and the descending time are equal to or more than the threshold value, the second quadrant in which the ascending time is equal to or less than the threshold value and the descending time is equal to or more than the threshold value, and the ascending time And the third quadrant in which the descending time is both below the threshold value, and the fourth quadrant in which the ascending time is equal to or greater than the threshold value and the descending time is equal to or less than the threshold value. The feature
第1象限は、自律神経調整力は強いが血圧調整力は弱いことを示し、第2象限は、自律神経調整力は弱くさらに血圧調整力も弱いことを示し、第3象限は、自律神経調整力は弱いが血圧調整力は強いことを示し、第4象限は、自律神経調整力は強くさらに血圧調整力も強いことを示す。図9の例では境界付近のものを除くと、第1象限に0イベント、第2象限に4イベント、第4象限に1イベントであり、境界付近は第2象限と第3象限の間に1イベントと第1象限と第4象限の間に1イベントある。 The first quadrant indicates that the autonomic nervous system is strong but the blood pressure is weak, the second quadrant indicates that the autonomic nervous system is weak and the blood pressure is weak, and the third quadrant is the autonomic nervous system. Indicates weak but strong blood pressure regulation, and the fourth quadrant indicates that autonomic nerve regulation is strong and blood pressure regulation is also strong. In the example of FIG. 9, except for those near the boundary, there are 0 events in the 1st quadrant, 4 events in the 2nd quadrant, and 1 event in the 4th quadrant, and 1 event near the boundary between the 2nd quadrant and the 3rd quadrant. There is one event between the event and the first and fourth quadrants.
この生体は、第2象限のイベントが多いので、自律神経調整力も血圧調整力も弱い傾向にあることが図9の2次元マップから直ちに分かる。また、自律神経調整力で見ると、5つのイベントが弱い領域にあり2つのイベントが強い領域にある。また血圧調整力で見ると、境界領域を除くと、4つのイベントが弱い領域にあり1つのイベントが強い領域にある。また、発生割合を調べると、自律神経調整力が5/2で血圧調整力が4/1なので、血圧調整力が弱いことは自律神経調整力が弱いことよりも起こりやすいことが分かる。 Since this living body has many events in the second quadrant, it can be immediately seen from the two-dimensional map of FIG. 9 that the autonomic nerve regulation ability and the blood pressure regulation ability tend to be weak. In terms of autonomic nervous system coordination, 5 events are in the weak area and 2 events are in the strong area. In terms of blood pressure regulation, excluding the boundary region, four events are in the weak region and one event is in the strong region. Further, when the incidence rate is examined, it can be seen that since the autonomic nerve regulation power is 5/2 and the blood pressure regulation power is 4/1, weak blood pressure regulation power is more likely to occur than weak autonomic nerve regulation power.
次に血圧測定装置100の動作の一例について図10を参照して説明する。図10は血圧測定装置100の動作の典型的な一例を示すフローチャートである。
血圧測定部101が生体から血圧値の時系列データを取得し、サージ区間検出部102に渡す(ステップS1001)。血圧測定部101はこの時系列データを記憶部105に渡し、記憶部105はこの血圧値の時系列データを順次記録してゆく。
Next, an example of the operation of the blood
The blood
ステップS1002ではサージ区間検出部102が血圧値の時系列データからサージ区間を検出し、サージ区間の情報と共に時系列データをサージ特徴量抽出部103に渡す。
In step S1002, the surge
ステップS1003ではサージ特徴量抽出部103がサージ区間から特定されるサージごとにサージの特徴量を抽出する。図9の例ではサージ区間での上昇時間と下降時間とを特徴量として抽出するが、サージから抽出することができる特徴量であれば、何でもよい。
In step S1003, the surge feature
ステップS1004では特徴量分類部104が抽出された特徴量に基づいてサージを分類する。特徴量分類部104は特徴量の注目する種類に応じて多次元空間に特徴量に対応するサージをマッピングする。この場合、次元数は特徴量の種類以下で1以上に対応する。図9の例では、特徴量が上昇時間と下降時間の2種類であるので、2次元空間に2つの特徴量で特定されるサージに対応する点をマッピングすることになる。特徴量分類部104が多次元空間にマッピングしたデータは記憶部105に記憶される。
In step S1004, the feature
ステップS1005では表示部106が記憶部105に記憶された多次元空間にマッピングしたデータを受け取り、表示する。例えば、図9が表示される。生体ごとに各調整能力を表す特徴量を図9のように多次元空間上にマッピングすれば、どちらの部分に問題があるかが一目瞭然で、例えば、医師の治療方針に役立てることができる。
In step S1005, the
以上の第1の実施形態の血圧測定装置によれば、血圧値の時系列データから1つのサージを含むサージ区間を1以上検出し、サージごとに1以上の特徴量を抽出し、特徴量に基づいてサージを分類することにより、血圧値を取得した生体のサージに関する特徴を得ることができる。この特徴に基づいて生体の弱い点を簡易にスクリーニングすることができ、この生体に患者が対応する場合には、患者への投薬や精密検査の必要性を判定することができる。
また、特徴量を軸とする次元数の空間にサージをマッピングすることにより、そのサージの特徴が空間にマッピングされるので、その空間の領域によって異なる特徴が一目瞭然になり、サージの特徴を直ちに理解できるようになる。従って、サージを発生した生体の特徴も理解することができ、例えば、医師が治療方針に役立てることができる。
According to the blood pressure measuring device of the first embodiment described above, one or more surge sections including one surge are detected from the time series data of the blood pressure value, and one or more feature amounts are extracted for each surge and used as the feature amount. By classifying the surge based on it, it is possible to obtain the characteristics related to the surge of the living body from which the blood pressure value is acquired. Based on this feature, weak points in the living body can be easily screened, and when the patient responds to this living body, the need for medication to the patient or a detailed examination can be determined.
In addition, by mapping the surge to a space with a number of dimensions centered on the feature quantity, the characteristics of the surge are mapped to the space, so that the characteristics that differ depending on the area of the space become clear at a glance, and the characteristics of the surge can be understood immediately. become able to. Therefore, it is possible to understand the characteristics of the living body in which the surge is generated, and for example, a doctor can use it for the treatment policy.
(第2の実施形態)
本実施形態の血圧測定装置について図11を参照して説明する。図11は第2の実施形態の血圧測定装置のブロック図である。第2の実施形態の血圧測定装置は、第1の実施形態の血圧測定装置からさらに、サージ統計量を算出していることが異なる。さらに、第2の実施形態の血圧測定装置では、投薬記録を考慮しそれによって可視化も変更する。
本実施形態の血圧測定装置1100は、血圧測定部101、サージ検出部1110、可視化条件受付部1101、サージ検出結果データベース(DBとも称す)1102、検出結果データ取得部1103、サージ統計量算出部1104、投薬記録DB1105、投薬前後判定部1106、サージ統計量DB1107、危険閾値DB1108、及び可視化部1109を含む。
(Second embodiment)
The blood pressure measuring device of this embodiment will be described with reference to FIG. FIG. 11 is a block diagram of the blood pressure measuring device of the second embodiment. The blood pressure measuring device of the second embodiment is different in that the surge statistics are further calculated from the blood pressure measuring device of the first embodiment. Further, in the blood pressure measuring device of the second embodiment, the dosing record is taken into consideration and the visualization is also changed accordingly.
The blood
サージ検出部1110は、サージ区間検出部102とサージ特徴量抽出部103とを合わせたものである。すなわち、サージ検出部1110は、血圧測定部101から取得した連続した血圧値の時系列データからサージ区間を検出する。そして、サージ検出部1110は、検出されたサージの特徴量を抽出する。サージの特徴量としては図6に示す点P1B、P2B、及びP3Bの血圧値と時刻に関連する量が該当する。具体的にはサージの特徴量は、血圧変動量、上昇時間、下降時間がある。血圧変動量は、上昇時間において血圧が変動した量であり、呼吸器にかかった負荷の程度を表すと言われている。血圧変動量が大きいほど負荷が大きい。なお、上昇時間及び下降時間は、第1の実施形態で説明した通りである。
The
可視化条件受付部1101は、サージの特徴量のうちのどの特徴量を変数として、どんな内容を可視化する(例えば、表示画面に表示する)かを示す可視化条件を受け付ける。可視化する態様は、例えば、サージインデックス(SIとも称す)を変数として1次元プロット、上昇時間と下降時間とを変数とした2次元プロット等がある。ここでサージインデックスとは1時間当たりのサージの発生回数である。表示する内容としては例えば、ある一人のユーザの一つの機会での結果を集約したものがある。一つの機会は1機会と称し、被験者の連続血圧測定開始から測定終了までの1回のことを示す。ここでは、1機会とは一晩を想定する。本実施形態では、サージ検出部1110が以下の4つの内容のうちのいずれかを受け付けるとして、(第1例)1人1機会の結果を集約したプロット、(第2例)1人複数機会の結果を集約したプロット、(第3例)1人1機会の全結果プロット、及び(第4例)各被験者の1機会の結果を集約し全員分プロットを例として挙げる。
The visualization
サージ検出結果DB1102は、血圧測定部101及びサージ検出部1110で検出した特徴点及び特徴量のデータを記録する。本実施形態では、記録を取る対象は、個人の1機会、個人の複数機会、被験者全員の1機会がある。特徴点及び特徴量は、第1の実施形態で説明したものと同様である。サージ検出結果DB1102が記憶するデータの一例は後に図12を参照して説明する。
The surge
検出結果データ取得部1103は、可視化条件受付部1101からの可視化条件に基づいてサージ検出結果DB1102から検出結果データを取得する。
The detection result
サージ統計量算出部1104は、検出結果データ取得部1103が取得した検出結果データのサージの統計量を算出する。サージの統計量は、例えば、サージインデックス、上昇時間平均、下降時間平均、血圧変動量平均、及びそれらの標準偏差(SDとも称す)がある。
The surge
投薬記録DB1105は、被験者ごとにいつどんな薬を投薬したかのデータを記録する。投薬記録DB1105には例えば、投薬開始日や薬についての情報が記録されている。投薬記録DB1105が記憶するデータの一例は後に図15を参照して説明する。
The
投薬前後判定部1106は、サージ統計量算出部1104からのサージ統計量(すなわち、検出されたサージ)が投薬前のものか投薬後のものかを投薬記録DB1105を参照して判定する。ここで投薬前とは投薬を開始する以前のことであり投薬はしていない状態であり、投薬後とは投薬を開始した後のことであり投薬し続けている状態である。
The pre- and
サージ統計量DB1107は、被験者ごとにサージ統計量算出部1104で算出されたサージ統計量を記録する。サージ統計量DB1107が記憶するデータの一例は図13を参照して説明する。
The surge
危険閾値DB1108は、サージ統計量に対応する、危険性と関連付けられている閾値を予め記憶している。また、検出結果データ取得部1103が複数機会を取得している場合には、危険閾値DB1108は、ある被験者のサージ統計量の平均からの偏差を基準に閾値を設定して記憶していてもよい。例えば、平均値から1標準偏差を閾値として、平均値から1標準偏差以上離れると危険と判定する。危険閾値DB1108が記憶するデータの一例は後に図14を参照して説明する。閾値とサージ統計量との比較は例えば、可視化部1109が行ってもよい。
The
可視化部1109は、サージ特徴量を1軸以上に変数として1次元以上のプロットとして可視化する。被験者ごと、薬剤ごと、投薬前後で色を変えて識別可能なように表示する。
The
次に、サージ検出結果DB1102、サージ統計量DB1107、危険閾値DB1108、及び投薬記録DB1105に格納されるデータの一例について図12、図13、図14、及び図15を参照して説明する。
サージ検出結果DB1102に記憶されるサージ検出結果データは、図12のように例えば、被験者ID、サージ開始時刻、サージピーク時刻、サージ終了時刻、変動量、上昇時間である。
サージ統計量DB1107に記憶されるサージ統計量データは、図13のように例えば、被験者ID、測定日、SI、変動量平均、変動量標準偏差、上昇時間平均、上昇時間標準偏差がある。サージ統計量データは、(第1例)である1人1機会と、(第2例)である1人1機会全データとでは1行になる。(第2例)である1人複数機会の場合では測定した機会分の行数になる。(第4例)である複数人1機会は被験者数分の行数になる。
Next, an example of the data stored in the surge
The surge detection result data stored in the surge
As shown in FIG. 13, the surge statistic data stored in the surge
危険閾値DB1108に記憶される危険閾値データは、図14のように例えば、変動量、上昇時間、下降時間がある。以下に示す例では1種類のみの閾値を想定しているが、複数の危険度レベルの閾値があってもよい。
投薬記録DB1105に記憶される投薬記録データは、図15に示すように例えば、投薬日、薬剤、1機会服用量、投薬期間がある。以下に示す例では1種類のみを想定しているが複数の薬剤情報を保存してもよい。
As shown in FIG. 14, the danger threshold data stored in the
As shown in FIG. 15, the dosing record data stored in the
(第1例)
次に第1例について図16、図17、及び図18を参照して説明する。第1例は、1人1機会の結果を集約してプロットする場合である。
可視化条件受付部1101が、1人1機会を受け付け、ある被験者について一晩のサージ検出について可視化する旨を検出結果データ取得部1103に渡す(ステップS1601)。検出結果データ取得部1103が1人1機会に従ったデータを、サージ検出結果DB1102から取得する(ステップS1602)。
(1st example)
Next, the first example will be described with reference to FIGS. 16, 17, and 18. The first example is a case where the results of one person and one opportunity are aggregated and plotted.
The visualization
サージ統計量算出部1104が、サージ検出結果データからサージ統計量を算出する(ステップS1603)。サージ統計量算出部1104が例えば、図17、図18に示すサージインデックス、下降時間、及び上昇時間に関する統計量を算出してサージ統計量DB1107に記録する。1人1機会では一晩のみのデータなので、投薬前後判定部1106は判定しない。
The surge
可視化部1109が、サージ統計量DB1107から取得したサージ統計量と、危険閾値DB1108から取得した危険閾値とを可視化する(ステップS1604)。可視化部1109は、例えば、図17及び図18のようにプロットする。ここでは1次元と2次元のプロットを示したが、合せて3次元のプロットでもよい。他に血圧変動量も含めて多次元でプロットしてもよい。
The
(第2例)
次に第2例について図19、及び図20を参照して説明する。第2例は、1人複数機会の結果を集約してプロットする場合である。
可視化条件受付部1101が1人複数機会を受け付け、ある被験者について複数の夜間のサージ検出について可視化する旨を検出結果データ取得部1103に渡す(ステップS1901)。検出結果データ取得部1103が1人複数機会に従ったデータをサージ検出結果DB1102から取得する(ステップS1902)。
(2nd example)
Next, the second example will be described with reference to FIGS. 19 and 20. The second example is a case where the results of multiple opportunities for one person are aggregated and plotted.
The visualization
サージ統計量算出部1104がサージ検出結果データからサージ統計量を算出する(ステップS1903)。投薬前後判定部1106が、サージ統計量算出部1104が算出したサージ統計量が投薬する前または投薬した後であるかを投薬記録DB1105を参照して判定して、判定結果を含めたサージ統計量をサージ統計量DB1107に記録する(ステップS1904)。
The surge
可視化部1109が、サージ統計量DB1107から取得したサージ統計量と、投薬前後を判定した結果と、危険閾値DB1108から危険閾値とを取得して可視化する(ステップS1905)。可視化部1109が可視化した一例が図20に示してある。図20によれば、投薬前と投薬後を比較することができ、投薬後が下降時間が投薬前よりも小さくなっていることが分かる。下降時間が小さいほど血圧調整力が優れている可能性が高いので、薬による効果があった可能性が高いと解釈できる。
このように、1機会複数機会の結果によれば、治療を開始してからの推移や投薬の効果が分かる。
The
In this way, the results of one opportunity and multiple opportunities show the transition from the start of treatment and the effect of medication.
(第3例)
次に第3例について図21及び図22を参照して説明する。第3例は、1人1機会での全ての結果を集約してプロットする場合である。全ての結果とは統計量だけではなく、サージごとの特徴量も含める結果である。
可視化条件受付部1101が、1人1機会の全結果の指示を受け付け、ある被験者について一晩のサージ検出について統計量だけではなく各サージの特徴量も可視化する旨を検出結果データ取得部1103に渡す(ステップS2101)。検出結果データ取得部1103が、1人1機会の指示に従ったデータをサージ検出結果DB1102から取得する(ステップS2102)。
(3rd example)
Next, a third example will be described with reference to FIGS. 21 and 22. The third example is a case where all the results of one person and one opportunity are aggregated and plotted. All results include not only statistics but also features for each surge.
The visualization
サージ統計量算出部1104が、取得したサージ検出結果データからサージ統計量を算出し、算出したサージ統計量をサージ統計量DB1107に記録する(ステップS2103)。可視化部1109が、サージ統計量DB1107から取得したサージ統計量と、危険閾値DB1108から取得した危険閾値と、サージ検出結果DB1102から取得したサージごとの特徴量とを取得し可視化する(ステップS2104)。可視化部1109は、例えば、図22のようにプロットし、各サージの特徴量(ここでは上昇時間及び下降時間)と、サージ統計量である代表値(例えば、平均、中央値)を表示させる。なお、第1例と同様に1人1機会では一晩のみのデータなので、投薬前後判定部1106は判定しない。
The surge
この第3例によれば、一晩における全サージをプロットしているので、統計量だけでなくサージそれ自体の分布も確認することができる。この結果、サージの特徴量の変動が正規分布に従わないかどうかを把握することができる。 According to this third example, since the total surge in one night is plotted, not only the statistic but also the distribution of the surge itself can be confirmed. As a result, it is possible to grasp whether or not the fluctuation of the feature amount of the surge does not follow the normal distribution.
(第4例)
次に第4例について図23及び図24を参照して説明する。第4例は、被験者ごとの1機会の結果を集約し全員分をプロットする場合である。被験者ごとに危険度が推定でき、他者との比較が容易になる。被験者全体の傾向を確認することができる。
(4th example)
Next, the fourth example will be described with reference to FIGS. 23 and 24. The fourth example is a case where the results of one opportunity for each subject are aggregated and the results for all are plotted. The degree of risk can be estimated for each subject, making it easy to compare with others. The tendency of the entire subject can be confirmed.
可視化条件受付部1101が、1人1機会の結果を全員分の指示を受け付け、被験者全員について一晩のサージ検出について統計量を可視化する旨を検出結果データ取得部1103に渡す(ステップS2301)。検出結果データ取得部1103が、1人1機会の結果を全員分の指示に従ったデータを、サージ検出結果DB1102から取得する(ステップS2302)。さらに検出結果データ取得部1103がユーザごとにデータを分類して、ユーザごとのサージ検出結果をサージ統計量算出部1104に渡す(ステップS2303)。サージ統計量算出部1104が、サージ検出結果を受け取りユーザごとにサージ統計量を算出する(ステップS2304)。サージ検出結果DB1102では、被験者が複数の場合は異なる被験者IDが複数記録されることになる。
The visualization
可視化部1109が、ユーザごとのサージ統計量と、危険閾値DB1108からの閾値とに基づいて、危険度が高い被験者を判定する、例えば、最も危険度が高い(最も危険そうな)被験者を特定する(ステップS2305)。さらに可視化部1109が、図24のように各被験者と、最も危険度が高い被験者とを可視化する(ステップS2306)。可視化部1109は、サージを前記危険度に応じて可視化し、閾値に対応する危険水準を設定してサージが危険かどうか区別する。
The
以上の第2の実施形態の血圧測定装置によれば、第1の実施形態の効果に加え、サージの統計量を取得し、投薬状況のデータも考慮することで、治療を開始してからの推移、投薬が患者への有効性を判定することができる。複数の患者のデータをプロットするので、患者ごとの危険度を可視化することができる。従って、患者全体の傾向を把握することができる。 According to the blood pressure measuring device of the second embodiment described above, in addition to the effect of the first embodiment, by acquiring the statistics of the surge and considering the data of the medication status, after the treatment is started. The transition and medication can determine the efficacy for the patient. Since the data of multiple patients are plotted, the degree of risk for each patient can be visualized. Therefore, it is possible to grasp the tendency of the entire patient.
(第3の実施形態)
本実施形態に係る血圧測定装置2500は、第2の実施形態に係る血圧測定装置1100に、SI(サージインデックス:Surge Index)算出部2501、AHI(無呼吸低呼吸指数:Apnea Hypopnea Index)算出部2502、及びAHI-SI相関DB2503を追加したものである。これら3つの追加の装置の他は動作も含めて第2の実施形態と同様である。つまり、SIや推定したAHIを特徴量として用いて可視化してもよいということである。なお、AHIはSASの症状と密接に関連し、AHIが大きいほどSASは重症といえる。
(Third embodiment)
The blood
血圧測定装置2500について図25及び図26を参照して説明する。図25は、血圧測定装置2500のブロック図である。図26は、ユーザごとに、AHIとSIとを計測し、図示したものである。AHIは、本実施形態の装置とは異なる例えば、PSG(Polysomnography;睡眠ポリグラフ検査)で測定する。
The blood
SI算出部2501は、サージ検出結果DB1102のデータから1時間当たりの血圧サージ発生頻度(例えば、1時間当たりの血圧サージ発生回数)であるサージインデックスをユーザごとに求める。
The
AHI算出部2502は、SI算出部2501からのサージインデックスと、AHI-SI相関DB2503に格納されている相関データとに基づいて、AHIを求める。AHIは、無呼吸低呼吸指数であり、睡眠1時間当たりの無呼吸と低呼吸との合計回数である。なお、低呼吸とは、動脈血管酸素飽和度(SpO2)が3-4%以上低下した状態、もしくは覚醒を伴う状態を示す。
The
AHI-SI相関DB2503は、AHIとSIとの相関を示すデータを格納している。予め図26に示すようなユーザごとにAHIとSIとのデータをプロットし、そこから導かれた相関関係を示すデータがAHI-SI相関DB2503に格納されている。
The AHI-
図26に示したようなデータを収集し、このデータに基づいてAHIとSIとの相関を算定する。図26に示した例では、相関係数が0.59となり中程度の相関があるとの結果になる。従ってAHIとSIの相関があるので、図26に示したデータに基づいて、SIだけを使って重症度指標として層別観点に加えてもよいし、AHIを推定してもよい。 Data as shown in FIG. 26 is collected and the correlation between AHI and SI is calculated based on this data. In the example shown in FIG. 26, the correlation coefficient is 0.59, which means that there is a moderate correlation. Therefore, since there is a correlation between AHI and SI, SI alone may be used and added to the stratified viewpoint as a severity index based on the data shown in FIG. 26, or AHI may be estimated.
次に、図25の血圧測定装置2500の動作について図27を参照して説明する。
図23のステップS2303から分岐して、ステップS2701及びステップS2702を経由して、図23ステップS2305で第2の実施形態の(第4例)の動作に合流する。
Next, the operation of the blood
It branches from step S2303 in FIG. 23, passes through steps S2701 and S2702, and joins the operation of the second embodiment (fourth example) in step S2305 of FIG. 23.
ステップS2701では、ステップS2303で検出し記憶された血圧サージ検出結果のデータを参照して、SI算出部2501がサージインデックスを算出する。次のステップS2702では、AHIとサージインデックスとの相関情報を格納しているAHI-SI相関DB2503を参照し、ステップS2701で求めたサージインデックスからAHIを算出する。
In step S2701, the
以上の第3の実施形態によれば、これによって、発生頻度とAHIに相関があることがわかっていることを使用すると、血圧サージを計測するだけでAHIを判定することができるので、SASの重症度が容易に分かる可能性がある。 According to the third embodiment described above, if it is known that there is a correlation between the frequency of occurrence and AHI, AHI can be determined only by measuring the blood pressure surge. The severity may be easily known.
次に、血圧測定装置100、1100のハードウェア構成の一例について図28を参照して説明する。
血圧測定装置100、1100は、CPU2801、ROM2802、RAM2803、入力装置2804、出力装置2805、及び血圧測定部101を備え、これらがバスシステム2806を介して互いに接続されている。血圧測定装置100、1100の上述した機能は、CPU2801がコンピュータ読み取り可能な記録媒体(ROM2802)に記憶されたプログラムを読み出し実行することにより実現されることができる。RAM2803は、CPU2801によってワークメモリとして使用される。この他に補助記憶装置(図示せず)は例えば、ハードディスクドライブ(HDD)またはソリッドステートドライブ(SDD)を備え、記憶部105、サージ検出結果DB1102、投薬記録DB1105、サージ統計量DB1107、危険閾値DB1108、及びAHI-SI相関DB2503として使用され、さらにプログラムを記憶してもよい。
Next, an example of the hardware configuration of the blood
The blood
入力装置2804は、例えば、キーボード、マウス、及びマイクロフォンを含み、ユーザからの操作を受け付ける。入力装置2804には例えば、血圧測定部101に測定を開始させるための操作ボタン、校正を行うための操作ボタン、通信を開始または停止するための操作ボタンがある。出力装置2805は、例えば、液晶表示装置などの表示装置及びスピーカを含む。血圧測定部101は、例えば通信装置で他のコンピュータとの間で信号の送受信を行い、例えば血圧測定装置から測定データを受信する。通信装置は、近距離で互いにデータをやり取りできる通信方式を利用することが多く、例えば、近距離無線通信方式を使用し、具体的にはブルートゥース(登録商標)、トランスファイージェット(登録商標)、ジグビー(登録商標)、アイアールディーエイ(登録商標)などの通信方式がある。
The
また、上述の実施形態では、血圧測定部101は例えば、被測定部位(例えば、左手首)を通る橈骨動脈の圧脈波を検出する(トノメトリ方式)。しかしながら、これに限られるものではない。血圧測定部101は、被測定部位(例えば、左手首)を通る橈骨動脈の脈波をインピーダンスの変化として検出してもよい(インピーダンス方式)。血圧測定部101は、被測定部位のうち対応する部分を通る動脈へ向けて光を照射する発光素子と、その光の反射光(または透過光)を受光する受光素子とを備えて、動脈の脈波を容積の変化として検出してもよい(光電方式)。また、血圧測定部101は、被測定部位に当接された圧電センサを備えて、被測定部位のうち対応する部分を通る動脈の圧力による歪みを電気抵抗の変化として検出してもよい(圧電方式)。さらに、血圧測定部101は、被測定部位のうち対応する部分を通る動脈へ向けて電波(送信波)を送る送信素子と、その電波の反射波を受信する受信素子とを備えて、動脈の脈波による動脈とセンサとの間の距離の変化を送信波と反射波との間の位相のずれとして検出してもよい(電波照射方式)。なお、血圧を算出することができる物理量を観測することができれば、これらの以外の方式を適用してもよい。
Further, in the above-described embodiment, the blood
また、上述したサージ区間検出部102、サージ特徴量抽出部103、特徴量分類部104、可視化条件受付部1101、検出結果データ取得部1103、サージ統計量算出部1104、投薬前後判定部1106、可視化部1109が行う動作を実行するためのプログラムが上記のROM2802または補助記憶装置に記憶され、CPU2801がそのプログラムを実行してもよい。これとは異なり血圧測定装置100とは別のサーバ等にプログラムが記憶されて、サーバ等のCPUがプログラムを実行してもよい。この場合は、血圧測定部101が測定した圧脈波の時系列データ(もしくは血圧値の時系列データ)をサーバに送信してサーバで処理を行い、信頼度を求めることができる。この場合にはサーバで処理を行うため、処理速度が上がる可能性がある。さらにサージ区間検出部102、サージ特徴量抽出部103、及び特徴量分類部104の装置部分が血圧測定装置100から除去されるので、血圧測定装置100の大きさ及び質量が小さくなりセンサを正確に測定できる位置に容易に配置することができる。この結果、ユーザへの負担が下がり、簡易に正確な血圧測定を行うことができるようになる。
Further, the above-mentioned surge
本発明の装置は、コンピュータとプログラムによっても実現でき、プログラムを記録媒体に記録することも、ネットワークを通して提供することも可能である。
また、以上の各装置及びそれらの装置部分は、それぞれハードウェア構成、またはハードウェア資源とソフトウェアとの組み合せ構成のいずれでも実施可能となっている。組み合せ構成のソフトウェアとしては、予めネットワークまたはコンピュータ読み取り可能な記録媒体からコンピュータにインストールされ、当該コンピュータのプロセッサに実行されることにより、各装置の機能を当該コンピュータに実現させるためのプログラムが用いられる。
The apparatus of the present invention can also be realized by a computer and a program, and the program can be recorded on a recording medium or provided through a network.
In addition, each of the above devices and their device portions can be implemented in either a hardware configuration or a combination configuration of hardware resources and software. As the combined software, a program is used that is installed in a computer in advance from a network or a computer-readable recording medium and executed by the processor of the computer to realize the functions of each device in the computer.
なお、この発明は、上記実施形態そのままに限定されるものではなく、実施段階ではその要旨を逸脱しない範囲で構成要素を変形して具体化できる。また、上記実施形態に開示されている複数の構成要素の適宜な組み合せにより種々の発明を形成できる。例えば、実施形態に示される全構成要素から幾つかの構成要素を削除してもよい。さらに、異なる実施形態に亘る構成要素を適宜組み合せてもよい。 It should be noted that the present invention is not limited to the above-described embodiment as it is, and at the implementation stage, the components can be modified and embodied within a range that does not deviate from the gist thereof. In addition, various inventions can be formed by an appropriate combination of the plurality of components disclosed in the above-described embodiment. For example, some components may be removed from all the components shown in the embodiments. In addition, components from different embodiments may be combined as appropriate.
また、上記の実施形態の一部又は全部は、以下の付記のようにも記載されうるが、以下には限られない。 In addition, some or all of the above embodiments may be described as in the following appendix, but are not limited to the following.
(付記1)
ハードウェアプロセッサとメモリとを備える血圧測定装置であって、
前記ハードウェアプロセッサは、
心拍に連動して変化する血圧値の時系列データを得、
前記時系列データから1つのサージを含むサージ区間を1以上検出し、
前記サージごとに1以上の特徴量を抽出し、
前記特徴量に基づいてサージを分類するように構成され、
前記メモリは、
分類されたサージを記憶する記憶部と、を備える血圧測定装置。
(Appendix 1)
A blood pressure measuring device equipped with a hardware processor and memory,
The hardware processor is
Obtain time-series data of blood pressure values that change in conjunction with heart rate,
One or more surge sections containing one surge are detected from the time series data, and
One or more features are extracted for each surge.
It is configured to classify surges based on the features.
The memory is
A blood pressure measuring device including a storage unit for storing classified surges.
(付記2)
少なくとも1つのハードウェアプロセッサを用いて、心拍に連動して変化する血圧値の時系列データを得、
少なくとも1つのハードウェアプロセッサを用いて、前記時系列データから1つのサージを含むサージ区間を1以上検出し、
少なくとも1つのハードウェアプロセッサを用いて、前記サージごとに1以上の特徴量を抽出し、
少なくとも1つのハードウェアプロセッサを用いて、前記特徴量に基づいてサージを分類することを備える血圧測定方法。
(Appendix 2)
Using at least one hardware processor, time-series data of blood pressure values that change in synchronization with the heart rate can be obtained.
Using at least one hardware processor, one or more surge sections containing one surge are detected from the time series data.
Using at least one hardware processor, one or more features were extracted for each surge.
A blood pressure measurement method comprising classifying surges based on the features using at least one hardware processor.
100、1100…血圧測定装置
101…血圧測定部
102…サージ区間検出部
103…サージ特徴量抽出部
104…特徴量分類部
105…記憶部
106…表示部
201…センサ部
202…押圧部
203…制御部
204…記憶部
205…操作部
206…出力部
700…波形
1101…可視化条件受付部
1102…サージ検出結果データベース
1103…検出結果データ取得部
1104…サージ統計量算出部
1105…投薬記録DB
1106…投薬前後判定部
1107…サージ統計量DB
1108…危険閾値DB
1109…可視化部
1110…サージ検出部
2500…血圧測定装置
2501…SI算出部
2502…AHI算出部
2503…AHI-SI相関DB
2801…CPU
2802…ROM
2803…RAM
2804…入力装置
2805…出力装置
2806…バスシステム
100, 1100 ... Blood
1106 ... Pre- and
1108 ... Danger threshold DB
1109 ...
2801 ... CPU
2802 ... ROM
2803 ... RAM
2804 ...
Claims (15)
前記時系列データにおいて、前記収縮期血圧、前記拡張期血圧、または前記平均血圧が上昇しその後に下降する時間区間をサージ区間として1以上検出する検出部と、
前記サージ区間ごとに1以上の特徴量を抽出する抽出部と、
前記特徴量に基づいてサージ区間を分類する分類部と、
を備え、
前記抽出部は、前記サージ区間と、前記サージ区間において血圧が変動した量とを前記特徴量として抽出する血圧測定装置。 A blood pressure measuring unit that obtains time-series data of systolic blood pressure, diastolic blood pressure, or mean blood pressure value for each heartbeat that changes in conjunction with the heartbeat.
In the time-series data , a detection unit that detects one or more of the systolic blood pressure, the diastolic blood pressure, or the time interval in which the mean blood pressure rises and then falls as a surge section.
An extraction unit that extracts one or more features for each surge section,
A classification unit that classifies surge sections based on the features, and
Equipped with
The extraction unit is a blood pressure measuring device that extracts the surge section and the amount of fluctuation of blood pressure in the surge section as the feature amount.
前記可視化部は、ユーザごとに前記サージ区間を可視化する請求項5、7、9、11のいずれか1項に記載の血圧測定装置。 The blood pressure measuring unit obtains time-series data for a plurality of users and obtains time-series data.
The blood pressure measuring device according to any one of claims 5, 7, 9, and 11, wherein the visualization unit visualizes the surge section for each user.
サージ区間の発生頻度と無呼吸低呼吸指数との予め取得した関係から、前記発生頻度に基づいて無呼吸低呼吸指数を算出する指数算出部と、をさらに備える請求項1乃至11のいずれか1項に記載の血圧測定装置。 A frequency calculation unit that calculates the frequency of occurrence of the surge section,
Any one of claims 1 to 11 further comprising an index calculation unit that calculates the apnea-hypopnea index based on the occurrence frequency from the relationship obtained in advance between the occurrence frequency of the surge section and the apnea-hypopnea index. The blood pressure measuring device according to the section.
前記時系列データにおいて、前記収縮期血圧、前記拡張期血圧、または前記平均血圧が上昇しその後に下降する時間区間をサージ区間として1以上検出し、
前記サージ区間ごとに1以上の特徴量を抽出し、
前記特徴量に基づいてサージ区間を分類し、
前記特徴量を抽出することは、前記サージ区間と、前記サージ区間において血圧が変動した量とを前記特徴量として抽出する血圧測定方法。 Obtain time-series data of systolic, diastolic, or mean blood pressure values for each heartbeat that change in conjunction with the heartbeat.
In the time-series data , one or more time intervals in which the systolic blood pressure, the diastolic blood pressure, or the mean blood pressure rises and then falls are detected as surge sections.
One or more features are extracted for each surge section,
Surge sections are classified based on the features, and
Extracting the feature amount is a blood pressure measuring method for extracting the surge section and the amount of fluctuation in blood pressure in the surge section as the feature amount.
Priority Applications (5)
| Application Number | Priority Date | Filing Date | Title |
|---|---|---|---|
| JP2017050650A JP7056002B2 (en) | 2017-03-15 | 2017-03-15 | Blood pressure measuring device, method and program |
| DE112018001363.4T DE112018001363T5 (en) | 2017-03-15 | 2018-03-12 | BLOOD PRESSURE MEASUREMENT DEVICE, METHOD AND PROGRAM |
| PCT/JP2018/009579 WO2018168807A1 (en) | 2017-03-15 | 2018-03-12 | Blood pressure measurement device, method, and program |
| CN201880017461.6A CN110402104B (en) | 2017-03-15 | 2018-03-12 | Blood pressure measurement device, method, and program |
| US16/561,728 US20190387979A1 (en) | 2017-03-15 | 2019-09-05 | Blood pressure measurement apparatus, method, and program |
Applications Claiming Priority (1)
| Application Number | Priority Date | Filing Date | Title |
|---|---|---|---|
| JP2017050650A JP7056002B2 (en) | 2017-03-15 | 2017-03-15 | Blood pressure measuring device, method and program |
Publications (3)
| Publication Number | Publication Date |
|---|---|
| JP2018153269A JP2018153269A (en) | 2018-10-04 |
| JP2018153269A5 JP2018153269A5 (en) | 2020-04-02 |
| JP7056002B2 true JP7056002B2 (en) | 2022-04-19 |
Family
ID=63522092
Family Applications (1)
| Application Number | Title | Priority Date | Filing Date |
|---|---|---|---|
| JP2017050650A Active JP7056002B2 (en) | 2017-03-15 | 2017-03-15 | Blood pressure measuring device, method and program |
Country Status (5)
| Country | Link |
|---|---|
| US (1) | US20190387979A1 (en) |
| JP (1) | JP7056002B2 (en) |
| CN (1) | CN110402104B (en) |
| DE (1) | DE112018001363T5 (en) |
| WO (1) | WO2018168807A1 (en) |
Families Citing this family (4)
| Publication number | Priority date | Publication date | Assignee | Title |
|---|---|---|---|---|
| JP7256049B2 (en) * | 2019-03-25 | 2023-04-11 | オムロンヘルスケア株式会社 | Blood pressure-related information display device, blood pressure-related information display method, and program |
| JP7253419B2 (en) * | 2019-03-25 | 2023-04-06 | オムロンヘルスケア株式会社 | Blood pressure-related information display device, blood pressure-related information display method, and program |
| KR102112699B1 (en) * | 2019-06-12 | 2020-05-19 | 주식회사 뷰노 | Method for visualizing time series signal and apparatus using the same |
| JP2021040969A (en) * | 2019-09-11 | 2021-03-18 | オムロンヘルスケア株式会社 | Method for generating determination algorithm, determination algorithm, determination system, determination method, program, and recording medium |
Citations (13)
| Publication number | Priority date | Publication date | Assignee | Title |
|---|---|---|---|---|
| US3754545A (en) | 1968-08-01 | 1973-08-28 | Bio Medical Sciences Inc | Blood pressure recording device with improved record |
| US20040193061A1 (en) | 2003-01-21 | 2004-09-30 | Omron Healthcare Co., Ltd. | Apparatus and method for detecting pulse wave |
| JP2005066087A (en) | 2003-08-26 | 2005-03-17 | Matsushita Electric Works Ltd | Circulatory organ function determining device |
| JP2006212218A (en) | 2005-02-03 | 2006-08-17 | Toshiba Corp | Device, system, method, and program for health care |
| JP2006280392A (en) | 2005-03-31 | 2006-10-19 | Terumo Corp | Blood pressure measuring system |
| JP2010540127A (en) | 2007-10-03 | 2010-12-24 | オタワ ヘルス リサーチ インスティチュート | Method and apparatus for monitoring changes in physiological parameters over time in one or more organs |
| US20130023776A1 (en) | 2009-12-28 | 2013-01-24 | Gambro Lundia Ab | Monitoring a property of the cardiovascular system of a subject |
| JP2013099505A (en) | 2011-10-19 | 2013-05-23 | Panasonic Corp | Circulatory dynamics measurement apparatus |
| JP2013202123A (en) | 2012-03-27 | 2013-10-07 | Tohoku Univ | Autonomic nerve function measurement device |
| WO2014002418A1 (en) | 2012-06-27 | 2014-01-03 | 日産自動車株式会社 | Stressed condition estimation device, and stressed condition estimation method |
| US20150342473A1 (en) | 2010-05-21 | 2015-12-03 | Nihon Kohden Corporation | Blood pressure measuring apparatus and blood pressure measuring method |
| JP2016064125A (en) | 2014-09-19 | 2016-04-28 | シナノケンシ株式会社 | Onset risk forecasting system for cerebrovascular disease |
| US20160360980A1 (en) | 2015-06-15 | 2016-12-15 | Vital Labs, Inc. | Method and system for cardiovascular disease assessment and management |
Family Cites Families (15)
| Publication number | Priority date | Publication date | Assignee | Title |
|---|---|---|---|---|
| JP3530888B2 (en) * | 1995-12-20 | 2004-05-24 | コーリンメディカルテクノロジー株式会社 | Blood pressure monitoring device |
| JP3583495B2 (en) * | 1995-03-06 | 2004-11-04 | コーリンメディカルテクノロジー株式会社 | Myocardial ischemia evaluation system |
| JPH09215664A (en) * | 1996-02-13 | 1997-08-19 | Nippon Colin Co Ltd | Evaluator of autonomic nerve function |
| JP4096376B2 (en) * | 1996-07-09 | 2008-06-04 | セイコーエプソン株式会社 | Relaxation instruction equipment |
| JPH10295657A (en) * | 1997-04-24 | 1998-11-10 | Matsushita Electric Ind Co Ltd | Blood pressure measuring device |
| JPH11318841A (en) * | 1998-03-09 | 1999-11-24 | Nippon Colin Co Ltd | Blood pressure monitoring device |
| DE10243265A1 (en) * | 2002-09-17 | 2004-03-25 | Andreas Nuske | Heart condition diagnosis method is based on analysis of bioelectrical signals recorded using a measurement glove that has a pulse sensor and electronics with an evaluation algorithm stored in ROM |
| AU2005204433B2 (en) * | 2004-01-16 | 2010-02-18 | Compumedics Medical Innovation Pty Ltd | Method and apparatus for ECG-derived sleep disordered breathing monitoring, detection and classification |
| CN1698535A (en) * | 2004-05-18 | 2005-11-23 | 香港中文大学 | Method for measuring blood pressure change rate |
| US8668649B2 (en) * | 2010-02-04 | 2014-03-11 | Siemens Medical Solutions Usa, Inc. | System for cardiac status determination |
| JP5738673B2 (en) * | 2011-05-24 | 2015-06-24 | オムロンヘルスケア株式会社 | Blood pressure measurement device |
| JP6003487B2 (en) * | 2012-09-28 | 2016-10-05 | オムロンヘルスケア株式会社 | Blood pressure measuring device, blood pressure measuring method, blood pressure measuring program |
| US20150196209A1 (en) * | 2014-01-15 | 2015-07-16 | Microsoft Corporation | Cardiovascular risk factor sensing device |
| US10610113B2 (en) * | 2014-03-31 | 2020-04-07 | The Regents Of The University Of Michigan | Miniature piezoelectric cardiovascular monitoring system |
| CN105147268A (en) * | 2015-06-15 | 2015-12-16 | 辛勤 | Method and device for monitoring health |
-
2017
- 2017-03-15 JP JP2017050650A patent/JP7056002B2/en active Active
-
2018
- 2018-03-12 DE DE112018001363.4T patent/DE112018001363T5/en active Pending
- 2018-03-12 WO PCT/JP2018/009579 patent/WO2018168807A1/en active Application Filing
- 2018-03-12 CN CN201880017461.6A patent/CN110402104B/en active Active
-
2019
- 2019-09-05 US US16/561,728 patent/US20190387979A1/en not_active Abandoned
Patent Citations (13)
| Publication number | Priority date | Publication date | Assignee | Title |
|---|---|---|---|---|
| US3754545A (en) | 1968-08-01 | 1973-08-28 | Bio Medical Sciences Inc | Blood pressure recording device with improved record |
| US20040193061A1 (en) | 2003-01-21 | 2004-09-30 | Omron Healthcare Co., Ltd. | Apparatus and method for detecting pulse wave |
| JP2005066087A (en) | 2003-08-26 | 2005-03-17 | Matsushita Electric Works Ltd | Circulatory organ function determining device |
| JP2006212218A (en) | 2005-02-03 | 2006-08-17 | Toshiba Corp | Device, system, method, and program for health care |
| JP2006280392A (en) | 2005-03-31 | 2006-10-19 | Terumo Corp | Blood pressure measuring system |
| JP2010540127A (en) | 2007-10-03 | 2010-12-24 | オタワ ヘルス リサーチ インスティチュート | Method and apparatus for monitoring changes in physiological parameters over time in one or more organs |
| US20130023776A1 (en) | 2009-12-28 | 2013-01-24 | Gambro Lundia Ab | Monitoring a property of the cardiovascular system of a subject |
| US20150342473A1 (en) | 2010-05-21 | 2015-12-03 | Nihon Kohden Corporation | Blood pressure measuring apparatus and blood pressure measuring method |
| JP2013099505A (en) | 2011-10-19 | 2013-05-23 | Panasonic Corp | Circulatory dynamics measurement apparatus |
| JP2013202123A (en) | 2012-03-27 | 2013-10-07 | Tohoku Univ | Autonomic nerve function measurement device |
| WO2014002418A1 (en) | 2012-06-27 | 2014-01-03 | 日産自動車株式会社 | Stressed condition estimation device, and stressed condition estimation method |
| JP2016064125A (en) | 2014-09-19 | 2016-04-28 | シナノケンシ株式会社 | Onset risk forecasting system for cerebrovascular disease |
| US20160360980A1 (en) | 2015-06-15 | 2016-12-15 | Vital Labs, Inc. | Method and system for cardiovascular disease assessment and management |
Also Published As
| Publication number | Publication date |
|---|---|
| CN110402104A (en) | 2019-11-01 |
| JP2018153269A (en) | 2018-10-04 |
| CN110402104B (en) | 2023-02-28 |
| US20190387979A1 (en) | 2019-12-26 |
| DE112018001363T5 (en) | 2019-11-21 |
| WO2018168807A1 (en) | 2018-09-20 |
Similar Documents
| Publication | Publication Date | Title |
|---|---|---|
| AU2010239127B2 (en) | Discrimination of Cheyne -Stokes breathing patterns by use of oximetry signals | |
| JP7056002B2 (en) | Blood pressure measuring device, method and program | |
| TWI725255B (en) | Wearable device capable of detecting sleep apnea and signal analysis method thereof | |
| US9615781B2 (en) | Systems and methods for monitoring depth of consciousness | |
| US10512429B2 (en) | Discrimination of cheyne-stokes breathing patterns by use of oximetry signals | |
| JP6766710B2 (en) | Blood pressure measuring device, method and program | |
| JP6813837B2 (en) | Activity rhythm judgment method and activity rhythm judgment device | |
| JP6766708B2 (en) | Information processing equipment, methods and programs | |
| JP6547838B2 (en) | Diagnosis support apparatus, diagnosis support method, diagnosis support program | |
| EP4251032A1 (en) | Systems and methods for measuring hemodynamic parameters with wearable cardiovascular sensing | |
| KR20200099248A (en) | Estimation method of blood vessel elasticity and arrhythmia using skin image | |
| JP6372824B2 (en) | CVHR shape measuring device | |
| WO2018168808A1 (en) | Blood pressure data processing device, blood pressure data processing method, and program | |
| WO2022147271A1 (en) | Health monitoring and management system using ectopic beats as early cardiac health marker | |
| US20220071495A1 (en) | Blood pressure-related information display device, blood pressure-related information display method, and a non-transitory computer-readable computer medium | |
| Hossen | A novel method for identification of obstructive sleep apnea | |
| TWI575474B (en) | Micro physiological vibration detection system for human organs and method thereof | |
| WO2020170826A1 (en) | Blood pressure-related information processing device, blood pressure-related information processing method, and program | |
| JP6927492B2 (en) | Method and device for creating indicators to determine sleep disorders | |
| AU2013221962C1 (en) | Discrimination of Cheyne-Stokes Breathing Patterns by Use of Oximetry Signals | |
| WO2022117392A1 (en) | Monitoring shivering and sweating episodes |
Legal Events
| Date | Code | Title | Description |
|---|---|---|---|
| A711 | Notification of change in applicant |
Free format text: JAPANESE INTERMEDIATE CODE: A711 Effective date: 20170807 |
|
| A521 | Request for written amendment filed |
Free format text: JAPANESE INTERMEDIATE CODE: A523 Effective date: 20200221 |
|
| A621 | Written request for application examination |
Free format text: JAPANESE INTERMEDIATE CODE: A621 Effective date: 20200221 |
|
| A131 | Notification of reasons for refusal |
Free format text: JAPANESE INTERMEDIATE CODE: A131 Effective date: 20201104 |
|
| A521 | Request for written amendment filed |
Free format text: JAPANESE INTERMEDIATE CODE: A523 Effective date: 20201224 |
|
| A131 | Notification of reasons for refusal |
Free format text: JAPANESE INTERMEDIATE CODE: A131 Effective date: 20210608 |
|
| A601 | Written request for extension of time |
Free format text: JAPANESE INTERMEDIATE CODE: A601 Effective date: 20210803 |
|
| A521 | Request for written amendment filed |
Free format text: JAPANESE INTERMEDIATE CODE: A523 Effective date: 20211001 |
|
| TRDD | Decision of grant or rejection written | ||
| A01 | Written decision to grant a patent or to grant a registration (utility model) |
Free format text: JAPANESE INTERMEDIATE CODE: A01 Effective date: 20220308 |
|
| A61 | First payment of annual fees (during grant procedure) |
Free format text: JAPANESE INTERMEDIATE CODE: A61 Effective date: 20220321 |
|
| R150 | Certificate of patent or registration of utility model |
Ref document number: 7056002 Country of ref document: JP Free format text: JAPANESE INTERMEDIATE CODE: R150 |