JP7030819B2 - Physiological monitoring judgment support system that combines capnometry and oxygen saturation - Google Patents
Physiological monitoring judgment support system that combines capnometry and oxygen saturation Download PDFInfo
- Publication number
- JP7030819B2 JP7030819B2 JP2019537827A JP2019537827A JP7030819B2 JP 7030819 B2 JP7030819 B2 JP 7030819B2 JP 2019537827 A JP2019537827 A JP 2019537827A JP 2019537827 A JP2019537827 A JP 2019537827A JP 7030819 B2 JP7030819 B2 JP 7030819B2
- Authority
- JP
- Japan
- Prior art keywords
- index
- spo
- capnography
- patient
- calculated
- Prior art date
- Legal status (The legal status is an assumption and is not a legal conclusion. Google has not performed a legal analysis and makes no representation as to the accuracy of the status listed.)
- Active
Links
Images


Classifications
-
- A—HUMAN NECESSITIES
- A61—MEDICAL OR VETERINARY SCIENCE; HYGIENE
- A61B—DIAGNOSIS; SURGERY; IDENTIFICATION
- A61B5/00—Measuring for diagnostic purposes; Identification of persons
- A61B5/08—Detecting, measuring or recording devices for evaluating the respiratory organs
- A61B5/083—Measuring rate of metabolism by using breath test, e.g. measuring rate of oxygen consumption
- A61B5/0836—Measuring rate of CO2 production
-
- A—HUMAN NECESSITIES
- A61—MEDICAL OR VETERINARY SCIENCE; HYGIENE
- A61B—DIAGNOSIS; SURGERY; IDENTIFICATION
- A61B5/00—Measuring for diagnostic purposes; Identification of persons
- A61B5/145—Measuring characteristics of blood in vivo, e.g. gas concentration, pH value; Measuring characteristics of body fluids or tissues, e.g. interstitial fluid, cerebral tissue
- A61B5/1455—Measuring characteristics of blood in vivo, e.g. gas concentration, pH value; Measuring characteristics of body fluids or tissues, e.g. interstitial fluid, cerebral tissue using optical sensors, e.g. spectral photometrical oximeters
- A61B5/14551—Measuring characteristics of blood in vivo, e.g. gas concentration, pH value; Measuring characteristics of body fluids or tissues, e.g. interstitial fluid, cerebral tissue using optical sensors, e.g. spectral photometrical oximeters for measuring blood gases
-
- A—HUMAN NECESSITIES
- A61—MEDICAL OR VETERINARY SCIENCE; HYGIENE
- A61B—DIAGNOSIS; SURGERY; IDENTIFICATION
- A61B5/00—Measuring for diagnostic purposes; Identification of persons
- A61B5/74—Details of notification to user or communication with user or patient ; user input means
- A61B5/746—Alarms related to a physiological condition, e.g. details of setting alarm thresholds or avoiding false alarms
-
- A—HUMAN NECESSITIES
- A61—MEDICAL OR VETERINARY SCIENCE; HYGIENE
- A61B—DIAGNOSIS; SURGERY; IDENTIFICATION
- A61B5/00—Measuring for diagnostic purposes; Identification of persons
- A61B5/02—Detecting, measuring or recording pulse, heart rate, blood pressure or blood flow; Combined pulse/heart-rate/blood pressure determination; Evaluating a cardiovascular condition not otherwise provided for, e.g. using combinations of techniques provided for in this group with electrocardiography or electroauscultation; Heart catheters for measuring blood pressure
- A61B5/0205—Simultaneously evaluating both cardiovascular conditions and different types of body conditions, e.g. heart and respiratory condition
-
- A—HUMAN NECESSITIES
- A61—MEDICAL OR VETERINARY SCIENCE; HYGIENE
- A61B—DIAGNOSIS; SURGERY; IDENTIFICATION
- A61B5/00—Measuring for diagnostic purposes; Identification of persons
- A61B5/08—Detecting, measuring or recording devices for evaluating the respiratory organs
- A61B5/082—Evaluation by breath analysis, e.g. determination of the chemical composition of exhaled breath
-
- A—HUMAN NECESSITIES
- A61—MEDICAL OR VETERINARY SCIENCE; HYGIENE
- A61B—DIAGNOSIS; SURGERY; IDENTIFICATION
- A61B5/00—Measuring for diagnostic purposes; Identification of persons
- A61B5/74—Details of notification to user or communication with user or patient ; user input means
- A61B5/742—Details of notification to user or communication with user or patient ; user input means using visual displays
Landscapes
- Health & Medical Sciences (AREA)
- Life Sciences & Earth Sciences (AREA)
- Physics & Mathematics (AREA)
- Biomedical Technology (AREA)
- Medical Informatics (AREA)
- Veterinary Medicine (AREA)
- Public Health (AREA)
- Biophysics (AREA)
- Pathology (AREA)
- Engineering & Computer Science (AREA)
- General Health & Medical Sciences (AREA)
- Heart & Thoracic Surgery (AREA)
- Animal Behavior & Ethology (AREA)
- Molecular Biology (AREA)
- Surgery (AREA)
- Physiology (AREA)
- Pulmonology (AREA)
- Emergency Medicine (AREA)
- Obesity (AREA)
- Spectroscopy & Molecular Physics (AREA)
- Optics & Photonics (AREA)
- Measurement Of The Respiration, Hearing Ability, Form, And Blood Characteristics Of Living Organisms (AREA)
Description
以下は、概して、カプノグラフィの技術分野、医療モニタリングの技術分野、及び関連する技術分野に関する。 The following generally relates to the technical fields of capnography, medical monitoring, and related technical fields.
カプノグラフィデバイスは、呼吸気体中の二酸化炭素(CO2)の濃度又は分圧をモニタリングする。カプノグラフィは、一般的には、呼吸器系状態を評定するために、機械的に人工換気されている患者に関連して使用される。熟練した麻酔専門医は通常、呼吸器健康状態を評定するために、カプノグラム(すなわち、カプノグラフデバイスによって測定されるものとしてのCO2傾向線)を評価することができる。 The capnography device monitors the concentration or partial pressure of carbon dioxide (CO 2 ) in the respiratory gas. Capnography is commonly used in connection with patients who are mechanically ventilated to assess respiratory status. A skilled anesthesiologist can usually evaluate a capnogram (ie, a CO 2 trend line as measured by a capnograph device) to assess respiratory health.
カプノグラフィは、患者健康状態を評定するためのより一般的なバイタルサインとしてますます使用されている。例えば、カプノグラフィは、専用のサンプリングポンプと協働する鼻カニューレを介して呼吸空気がサンプリングされるサイドストリームカプノグラフデバイス構成を使用して、自発的に呼吸しており、機械的人工換気を受けていない患者をモニタリングするために使用される。これらのより広いコンテキストにおいて、麻酔学における技能が限定されている医療従業者は、カプノグラフデータに基づいて呼吸器健康状態を評定する必要がある。これを容易にするために、カプノグラフデバイスが、標準的な導出パラメータ、特に呼吸速度(RR)及び呼気終末CO2(etCO2)を出力するようにプログラムされることが一般的である。RRは、カプノグラム波形の(擬似)周期性として定量化される呼吸速度である。etCO2は、呼気相の終端における分圧である。しかしながら、呼気CO2は通常、呼気相の終端において最も高いため、etCO2は一般的に、呼吸サイクルにわたる最大観測CO2分圧として定義される。 Capnography is increasingly being used as a more common vital sign for assessing patient health. For example, capnography uses a sidestream capnography device configuration in which breathing air is sampled via a nasal cannula that works with a dedicated sampling pump to breathe spontaneously and receive mechanical ventilation. Used to monitor patients who are not. In these broader contexts, healthcare workers with limited skills in anesthesiology need to assess respiratory health based on capnograph data. To facilitate this, it is common for capnograph devices to be programmed to output standard derivation parameters, particularly respiratory rate (RR) and end-expiratory CO 2 (etCO 2 ). RR is the respiratory rate quantified as the (pseudo) periodicity of the capnogram waveform. etCO 2 is the partial pressure at the end of the expiratory phase. However, since exhaled CO 2 is usually highest at the end of the expiratory phase, etCO 2 is generally defined as the maximum observed CO 2 partial pressure over the respiratory cycle.
RR及びetCO2は有用なパラメータであるが、それらはカプノグラム波形の豊富な情報内容を捕捉するものではない。この目的のために、熟練の麻酔専門医によって実施され得る臨床分析を模倣するように設計された、自動カプノグラム波形分析を実施することも知られている。例えば、Colmanらの米国特許第8,412,655号明細書及びColmanらの米国特許第8,414,488号明細書は、中断を無呼吸事象と相関づけること、カプノグラム波形の長い下方勾配を部分気道閉塞の可能性と相関づけること、低いカプノグラム波形を心拍出量が低い可能性があることと相関づけること、曲線的なカプノグラム波形を鼻カニューレに問題がある可能性があることと相関づけることなどのような、カプノグラム波形分析を開示している。そのような波形分析に基づいて、カプノグラフデバイスは、「気道を確保してください」、「気道を確認してください」、「心拍出量が低い可能性があります」、「カニューレインターフェースを確認してください」などのような情報メッセージを提供する。 Although RR and etCO 2 are useful parameters, they do not capture the rich information content of the capnogram waveform. To this end, it is also known to perform automated capnogram waveform analysis designed to mimic clinical analysis that can be performed by a seasoned anesthesiologist. For example, Colman et al. US Pat. No. 8,421,655 and Colman et al., US Pat. No. 8,414,488 correlate interruptions with an aspiratory event, with a long downward gradient of the capnogram waveform. Correlate with the possibility of partial airway obstruction, correlate low capnogram waveforms with possible low heart rate output, correlate with curvilinear capnogram waveforms with possible nasal cannula problems It discloses capnogram waveform analysis, such as attaching. Based on such waveform analysis, the capnograph device can be "open airway", "check airway", "may have low cardiac output", "cannula interface". Provide an informational message such as "Please check".
カプノグラム波形分析は、カプノグラムからより豊富な情報を提供するが、呼吸循環の検出、振幅及び周期正規化、並びに、各呼吸サイクル内のカプノグラム波形の領域のセグメント化のような、複雑な処理を伴う。これらの複雑な分析は、不正確な波形セグメント化及び正規化動作中の情報損失のような、多数のエラーメカニズムの可能性を導入する。 Capnogram waveform analysis provides more information from the capnogram, but involves complex processing such as respiratory circulation detection, amplitude and periodic normalization, and segmentation of the region of the capnogram waveform within each respiratory cycle. .. These complex analyzes introduce the possibility of numerous error mechanisms, such as inaccurate waveform segmentation and information loss during normalization operations.
いくつかの追加の背景となる参考文献は、以下を含む。 Some additional background references include:
2016年7月7日に公開されたWO2016/108121A1は、他の態様の中でも、患者に対する物理インターフェースから得られるサンプル気体流中の選択される気体の濃度を検出するように構成されているプロセッサを含む気体濃度モニタリングシステムを開示している。複数のデータ点を含むデータセットが形成され、各データ点は、サンプリング時間の間の、サンプル気体流内の選択される気体の検出濃度に対応する。データセットは様々に利用される。例えば、データ点は、サンプリング時間内のデータ点の発生頻度に従ってグループ化される。データ点のグループ間の相対特性に基づいて、信号確度及び/又は信号品質が決定される。WO2016/108121A1は、2014年12月31日に出願された米国特許出願第62/098,367号に対する優先権を主張する。WO2016/108121A1及び米国特許出願第62/098,367号は各々、参照によりその全体が本明細書に組み込まれる。 Published July 7, 2016, WO2016 / 108121A1 is a processor configured to detect the concentration of selected gas in a sample gas stream obtained from a physical interface to a patient, among other embodiments. The gas concentration monitoring system including is disclosed. A dataset containing multiple data points is formed, and each data point corresponds to the detection concentration of the selected gas in the sample gas stream during the sampling time. Data sets are used in various ways. For example, the data points are grouped according to the frequency of occurrence of the data points within the sampling time. Signal accuracy and / or signal quality is determined based on the relative characteristics between groups of data points. WO2016 / 108121A1 claims priority to US Patent Application No. 62 / 098,367 filed December 31, 2014. WO 2016/108121A1 and US Patent Application No. 62 / 098,367, respectively, are incorporated herein by reference in their entirety.
2016年7月7日に公開されたWO2016/108127A1は、他の態様の中でも、カプノグラフィシステムを開示している。コントローラが、患者の物理インターフェースからサンプル気体流を得るように構成されている。サンプリング時間間隔中のサンプル気体流の特性の変化が決定される。サンプリング時間間隔中のサンプル気体流の特性の変化が対応する閾値以上であるか否かが決定される。サンプル気体流の特性の変化が閾値以上であると決定されるときは、酸素補給が提供されると決定される。サンプル気体流の特性の変化が未満であると決定されるときは、酸素補給は提供されないと決定される。WO2016/108127A1は、2014年12月30日に出願された米国特許出願第62/097,946号に対する優先権を主張する。WO2016/108127A1及び米国特許出願第62/097,946号は各々、参照によりその全体が本明細書に組み込まれる。 WO 2016/108127A1, published July 7, 2016, discloses a capnography system, among other aspects. The controller is configured to obtain a sample gas stream from the patient's physical interface. Changes in the characteristics of the sample gas flow during the sampling time interval are determined. It is determined whether the change in the characteristics of the sample gas flow during the sampling time interval is greater than or equal to the corresponding threshold. When it is determined that the change in the characteristics of the sample gas flow is greater than or equal to the threshold, it is determined that oxygen supplementation is provided. When it is determined that the change in the properties of the sample gas flow is less than, it is determined that oxygen supplementation is not provided. WO2016 / 108127A1 claims priority over US Patent Application No. 62 / 097,946 filed December 30, 2014. WO 2016/108127A1 and US Patent Application No. 62 / 097,946, respectively, are incorporated herein by reference in their entirety.
2015年8月11日に出願された「Capnography with Decision Support System Architecture」と題する米国特許出願第62/203,416号は、参照によりその全体が本明細書に組み込まれる。米国特許出願第62/203,416号は、他の態様の中でも、二酸化炭素測定コンポーネントと、時間の関数として測定される二酸化炭素レベルサンプル値を含むカプノグラムを生成するようにプログラムされている電子プロセッサとを含むカプノグラフデバイスを開示している。呼気終末二酸化炭素(etCO2)がカプノグラムから決定され、etCO2パラメータ品質指標(etCO2 PQI)が、カプノグラムから計算される1つ又は複数の定量的カプノグラム波形測定基準を使用して計算される。呼吸速度(RR)値もカプノグラムから決定され、RR PQIが、RR値及びetCO2 PQIを使用して計算される。etCO2値及びRR値並びにetCO2 PQI値及びRR PQI値から、呼吸健康状態指標(RWI)が計算される。いくつかの実施形態において、1つ又は複数のカプノグラム波形測定基準が、カプノグラムから生成されるカプノグラムヒストグラムから計算される。 US Patent Application No. 62/203,416, entitled "Capnography with Decision Support System Architecture" filed August 11, 2015, is incorporated herein by reference in its entirety. U.S. Patent Application No. 62 / 203,416, among other aspects, is an electronic processor programmed to generate a capnogram containing a carbon dioxide measurement component and a carbon dioxide level sample value measured as a function of time. It discloses a capnograph device including. Expiratory carbon dioxide (etCO 2 ) is determined from the capnogram and the etCO 2 parameter quality index (etCO 2 PQI) is calculated using one or more quantitative capnogram waveform metrics calculated from the capnogram. Respiratory rate (RR) values are also determined from the capnogram, and RR PQI is calculated using the RR value and etCO 2 PQI. A respiratory health index (RWI) is calculated from the etCO 2 and RR values and the etCO 2 PQI and RR PQI values. In some embodiments, one or more capnogram waveform metrics are calculated from the capnogram histogram generated from the capnogram.
以下は、上記で参照した課題などに対処する新規の改善されたシステム及び方法を開示する。 The following discloses new and improved systems and methods to address the issues referred to above.
1つの開示される態様において、患者モニタリングデバイスは、カプノグラフデバイスと、パルスオキシメータと、電子プロセッサとを備え、電子プロセッサは、カプノグラフデバイスによって測定されるカプノグラムから患者健康状態を示すカプノグラフィ指標を生成し、患者健康状態を示す動脈血酸素飽和度(SpO2)指標を、パルスオキシメータによって測定されるSpO2から生成し、カプノグラフィ指標及びSpO2指標から患者安全指標を計算し、患者安全指標に少なくとも部分的に基づいて決定される1つ又は複数の臨床警告を計算するようにプログラムされている。ディスプレイコンポーネントは、計算されている1つ又は複数の臨床警告のうちの少なくとも1つを表示するように構成される。 In one disclosed embodiment, the patient monitoring device comprises a capnography device, a pulse oximeter, and an electronic processor, which is a capnography showing patient health from a capnogram measured by the capnography device. Generate an index, generate an arterial oxygen saturation (SpO 2 ) index indicating the patient's health condition from SpO 2 measured by a pulse oximeter, calculate a patient safety index from the capnography index and SpO 2 index, and calculate patient safety. It is programmed to calculate one or more clinical warnings that are determined based at least in part on the indicators. The display component is configured to display at least one of the calculated clinical alerts.
別の開示される態様において、非一時的記憶媒体は、患者モニタリングを実施するために電子プロセッサによって可読かつ実行可能である命令を記憶し、患者モニタリングは、カプノグラフデバイスによって測定されるカプノグラムから患者健康状態を示すカプノグラフィ指標を生成することと、患者健康状態を示す動脈血酸素飽和度(SpO2)指標を、パルスオキシメータによって測定されるSpO2(72)から生成することと、カプノグラフィ指標及びSpO2指標から患者安全指標を計算することとを含む。 In another disclosed embodiment, the non-temporary storage medium stores instructions that are readable and executable by the electronic processor to perform patient monitoring, and patient monitoring is from the capnography measured by the capnography device. Generating a capnography index to indicate patient health, and generating an arterial oxygen saturation (SpO 2 ) index to indicate patient health from SpO 2 (72) measured by a pulse oximeter, and the capnography index and Includes calculating the patient safety index from the SpO 2 index.
1つの利点は、その出力が患者呼吸健康状態をより効果的に評定するカプノグラフデバイスが提供されることにある。 One advantage is that it provides a capnograph device whose output more effectively assesses patient respiratory health.
別の利点は、カプノグラム波形の呼吸検出又はセグメント化を必要とすることなく、詳細なカプノグラム波形を特性化する導出パラメータを出力するカプノグラフデバイスが提供されることにある。 Another advantage is that a capnograph device is provided that outputs derived parameters that characterize the detailed capnogram waveform without the need for respiratory detection or segmentation of the capnogram waveform.
別の利点は、カプノグラムデータからの呼吸器系状態情報がより正確であることにある。 Another advantage is that the respiratory status information from the capnogram data is more accurate.
別の利点は、カプノグラフィ情報とパルスオキシメトリ情報とを相乗的に組み合わせる臨床判断支援が提供されることにある。 Another advantage is that it provides clinical judgment support that synergistically combines capnography information and pulse oximetry information.
別の利点は、各構成モニタリングモダリティによって生成される臨床警告のランク付けリストを提供する、カプノグラフィ情報とパルスオキシメトリ情報の両方を利用する臨床判断支援が提供されることにある。 Another advantage is that it provides clinical decision support that utilizes both capnographic and pulse oximetry information to provide a ranking list of clinical warnings generated by each configuration monitoring modality.
所与の実施形態は、上記の利点のうちの幾つかを提供することができ、且つ/又は、本開示の読解及び理解を受けて当業者に明らかになる他の利点を提供することができる。 A given embodiment may provide some of the above advantages and / or other advantages that will be apparent to those of skill in the art upon reading and understanding of the present disclosure. ..
本発明は、様々なコンポーネント及びコンポーネントの構成並びに様々なステップ及びステップの構成の形態をとることができる。図面は、好ましい実施形態を例示することのみを目的としており、本発明を限定するものとして解釈されるべきではない。 The present invention can take the form of various components and component configurations as well as various steps and step configurations. The drawings are intended only to illustrate preferred embodiments and should not be construed as limiting the invention.
本明細書において開示されるいくつかの実施形態において、カプノグラムから評価される呼吸速度(RR)及び呼気終末CO2(etCO2)の信頼性を定量的に評定するために、パラメータ品質指標が計算される。etCO2パラメータ品質指標(etCO2 PQI)及びRRパラメータ品質指標(RR PQI)に部分的に基づいて、呼吸健康状態指標(RWI)を計算することもできる。これらのパラメータ品質指標は、医療従事者が、従来のツール、特にRR及びetCO2を使用してカプノグラムを解釈し、ただし、医療従事者が臨床判断を行うためにRR及びetCO2が信頼できるデータであるか否かを評定するのを補助するための測定基準(品質管理指標)を提供することを可能にする。 In some embodiments disclosed herein, parameter quality indicators are calculated to quantitatively assess the reliability of respiratory rate (RR) and terminal exhalation CO 2 (etCO 2 ) as assessed from the capnogram. Will be done. A respiratory health index (RWI) can also be calculated based in part on the etCO 2 parameter quality index (etCO 2 PQI) and the RR parameter quality index (RR PQI). These parameter quality indicators allow healthcare professionals to interpret capnograms using traditional tools, especially RR and etCO 2 , but data that healthcare professionals can rely on to make clinical decisions. It makes it possible to provide a measurement standard (quality control index) to assist in assessing whether or not it is.
さらに、いくつかの実施形態において、パラメータ品質指標は、少なくとも部分的に、CO2値カウント対(ビニングされた)CO2レベルのヒストグラムを使用して計算される。このヒストグラムは、数回の呼吸を包含する時間間隔にわたって計算される。例えば、ヒストグラムは、1つの例示的な実施形態においては30秒の時間間隔にわたって取得され、これは、3~5秒/呼吸の通常の成人患者の呼吸間隔の場合の約6~10回の呼吸(毎分12~20回の呼吸)に対応し、最大で、急速に呼吸する幼児の場合の30回の呼吸(毎分60回の呼吸の呼吸速度)に対応する。 Further, in some embodiments, the parameter quality index is calculated using a histogram of CO 2 value counts vs. (binned) CO 2 levels, at least in part. This histogram is calculated over a time interval that includes several breaths. For example, a histogram is obtained over a time interval of 30 seconds in one exemplary embodiment, which is about 6-10 breaths for a normal adult patient breathing interval of 3-5 seconds / breath. It corresponds to (12 to 20 breaths per minute), and corresponds to 30 breaths (breathing rate of 60 breaths per minute) in the case of an infant who breathes rapidly at the maximum.
有利には、カプノグラムヒストグラムは、波形を複数の異なる領域(例えば、吸気、呼気)にセグメント化することなく、且つ、個々の呼吸サイクルをセグメント化することなく(すなわち、呼吸検出器を用いずに)計算される。カプノグラムヒストグラムは、CO2レベルが吸気相の間はゼロに近く、呼気相の間はその最大値に近い(すなわち、患者のetCO2に近い)典型的なカプノグラムパターンに起因して、正常に呼吸する患者の「標準的」な形状を有することが有利である。これらの2つの相は、開示されるカプノグラムヒストグラムのそれぞれの低い領域及び高い領域を規定し、それらの間には、第3の遷移ヒストグラム領域がある。カプノグラム波形を複数の呼吸サイクルにセグメント化し、これがその後さらに吸気及び呼気時間間隔にセグメント化されるという、困難な、そして多くの場合不正確な作業に依拠することなく、カプノグラム波形に関する豊富な情報を、カプノグラムヒストグラムから抽出することができる。 Advantageously, the capnogram histogram uses a respiratory detector without segmenting the waveform into multiple different regions (eg, inspiratory, expiratory) and without segmenting individual respiratory cycles. Not calculated). The capnogram histogram is due to a typical capnogram pattern in which CO 2 levels are close to zero during the inspiratory phase and close to their maximum during the expiratory phase (ie, close to the patient's etCO 2 ). It is advantageous to have a "standard" shape for the patient who breathes normally. These two phases define the lower and higher regions of each of the disclosed capnogram histograms, with a third transition histogram region between them. Rich information about capnogram waveforms without resorting to the difficult and often inaccurate task of segmenting the capnogram waveform into multiple respiratory cycles, which are then further segmented into inspiratory and expiratory time intervals. , Can be extracted from the capnogram histogram.
特に、etCO2パラメータ品質指標(PQI)は、主に又は全体的に、ヒストグラムを使用して計算される。いくつかの実施形態において、etCO2 PQIは、カプノグラムを吸気及び呼気領域にセグメント化することなく定量化することができるカプノグラム特性にさらに基づいて計算される。RRは呼吸サイクルと密接に関連付けられる(事実、呼吸サイクルによって規定される)ため、etCO2 PQIの例示的な実施形態は、呼吸検出及びカプノグラム波形セグメント化に依拠する。しかしながら、RR PQIは、任意選択的に、etCO2 PQIにさらに基づき、それによって、カプノグラムヒストグラムからの波形情報を組み込む。 In particular, the etCO 2 Parameter Quality Index (PQI) is calculated primarily or globally using histograms. In some embodiments, the etCO 2 PQI is further calculated based on capnogram properties that allow the capnogram to be quantified without segmentation into the inspiratory and expiratory regions. An exemplary embodiment of etCO 2 PQI relies on respiratory detection and capnogram waveform segmentation, as RR is closely associated with the respiratory cycle (in fact, defined by the respiratory cycle). However, the RR PQI optionally further bases on the etCO 2 PQI, thereby incorporating waveform information from the capnogram histogram.
RWIは、etCO2値及びRR値に基づいて、且つ、etCO2 PQI及びRR PQIにさらに基づいて計算される。PQI値をRWIに組み込むことによって、不良なカプノグラム波形がカプノグラフ測定問題を指示するものではなく、多くの場合、不良な呼吸健康状態の指標であるという、本明細書における認識が得られる。 The RWI is calculated based on the etCO 2 and RR values, and further based on the etCO 2 PQI and RR PQI. Incorporating PQI values into the RWI provides recognition herein that poor capnographic waveforms do not indicate a capnographic measurement problem and are often an indicator of poor respiratory health.
図1を参照すると、例示的なカプノグラフデバイス10が、図解例における鼻カニューレ14のような、適切な患者装具によって、又は、気道アダプタなどによって、患者12と接続される。患者装具14は、任意選択的に、エアフィルタ、ウォータトラップなど(図示せず)のような、1つ又は複数の補助部品を含んでもよい。例示的なカプノグラフ10において、呼気は、患者装具14からカプノグラフ吸気口16へと、及び、空気ポンプ22によって二酸化炭素(CO2)測定コンポーネント又はセル20を通じて引き込まれる。空気はその後、カプノグラフ10の排気口24を介して大気へと放出され、又は、例示的な実施形態におけるように、大気へと放出される前に排気口24を通じて、吸入された麻酔剤若しくは他の吸入された薬剤を除去するために掃気システム26へと放出される。CO2測定コンポーネント又はセル20は、例えば、患者装具14から引き込まれる呼気中の二酸化炭素が赤外光源/検出器アセンブリによって検出される吸収を引き起こす、赤外光吸収セルを含んでもよい。
Referring to FIG. 1, the
例示のカプノグラフデバイス10は、呼気がポンプ22を使用してカプノグラフデバイス10へと引き込まれ、CO2測定セル20がカプノグラフデバイス10の内部に位置するサイドストリーム構成を有する。すなわち、サイドストリームカプノグラフデバイス10は、ユニットとして、二酸化炭素測定コンポーネント20、電子プロセッサ30、及び、二酸化炭素測定コンポーネント20を通じて呼気を引き込むように接続されているポンプ22を含む。サイドストリーム構成は、自発的に呼吸している患者、すなわち、人工呼吸器の補助なしに自身で呼吸している患者に対して適切に使用される。メインストリーム構成(図示せず)として知られている代替的な構成において、CO2測定セルは、典型的には患者の「主流」気道流へと挿入されるCO2測定セル患者装具として、カプノグラフデバイスハウジングの外部に位置する。そのようなメインストリーム構成は、例えば、機械的に人工換気されている患者に関連して利用され、CO2測定セル患者装具は、換気ユニットの付属レセプタクルに嵌合するように設計され、又は、換気装置につながる気道ホース上に設置される。パラメータ品質及び患者呼吸健康状態を定量的に評定するための開示されている手法は、サイドストリームカプノグラフデバイス(図1の図解例にあるような)又はメインストリームカプノグラフデバイスのいずれかとともに容易に適用される。
The
引き続き図1を参照すると、カプノグラフデバイス10(例示のサイドストリーム構成又は代替的なメインストリーム構成のいずれかにある)は、CO2測定セル20及び(サイドストリーム構成においては)ポンプ22に電力を供給し、それらの動作を制御するカプノグラフ電子装置30を含む。電力及び制御リンクは、図式的な図1には示されていないことに留意されたい。カプノグラフ電子装置30は、加えて、図1に図式的に示され、本明細書において説明されているような、CO2測定セル20によって出力されるCO2信号の処理を実施する。カプノグラフ10によって出力される臨床データは、ディスプレイコンポーネント32上に表示され、電子カルテ(EMR)などに記憶され、又は他の様態で利用される。ディスプレイコンポーネント32は、カプノグラフのコンポーネントであってもよく、又は、図1に示すように、ディスプレイコンポーネント32は、カプノグラフ10に接続されている外部ディスプレイコンポーネントであってもよい。例えば、外部ディスプレイコンポーネント32は、多機能ベッドサイド患者モニタ及び/又はナースステーション患者モニタなどであってもよい。カプノグラフは、圧力計、流量計などのような、簡略化された図式的な図1には示されていない多数の他のコンポーネントことがさらに理解されよう。
Continuing with reference to FIG. 1, the capnography device 10 (either in the exemplary sidestream configuration or an alternative mainstream configuration) powers the CO 2 measuring cell 20 and the pump 22 (in the sidestream configuration). Includes a capnography
カプノグラフ電子装置30は、例えば、カプノグラフ10のマイクロプロセッサ又はマイクロコントローラなど、適切なプログラムされた電子プロセッサなどによって、様々に実装されてもよい。単一の電子ユニット30が示されているが、代替的に、電子装置の様々な組み合わせを利用することが企図され、例えば、ポンプ、電源、赤外光源及び検出器、電源(CO2測定セル20のための)、アナログ-デジタル変換回路(CO2測定セル20の赤外光検出器をサンプリングするための)などを実装するために、種々の電子コンポーネントが動作可能に相互接続されてもよい。またさらに、カプノグラフデータ処理を実施する電子装置が、カプノグラフデバイス自体の外部に配置されることが企図される。例えば、カプノグラフデータ処理は、別のデバイス(例えば、測定セル20からCO2信号を受信するか又はカプノグラフデバイスによって生成されるカプノグラムを受信し、さらなる処理を実施するナースステーションのコンピュータ)内の電子装置によって実施されてもよい。カプノグラフ電子装置30によって実施されるものとしての本明細書において開示されているカプノグラフデータ処理は、マイクロプロセッサ、マイクロコントローラ、又は開示されているカプノグラフデータ処理を実施するための他の電子プロセッサによって読み取り可能且つ実行可能である命令を記憶する非一時的記憶媒体によって具現化することができることがさらに理解されよう。そのような非一時的記憶媒体は、非限定的な例示として、ハードディスクドライブ又は他の磁気記憶媒体、フラッシュメモリ、読み出し専用メモリ(ROM)又は他の電子記憶媒体、光ディスク又は他の光学機億媒体、それらの様々な組み合わせなどを含んでもよい。
The capnograph
引き続き図1を参照し、さらに図2を参照すると、カプノグラフ電子装置30によって(又は、代替的に、全体的に若しくは部分的に、ナースステーションモニタ、ベッドサイド患者モニタ、若しくは適切にプログラムされた電子データプロセッサを有する他のデバイスによって)実施されるカプノグラフデータ処理の例示的な実施形態が、図1に図式的に示されている。カプノグラム40を生成するために、CO2信号がサンプリングされ、任意選択的に、干渉ガス(例えば、亜酸化窒素)の存在、大気圧などのようなファクタについて補正される。カプノグラム40は、図2において時間の関数として[CO2]に示されている、二酸化炭素の分圧又は濃度を表す信号である。図式的な図2は、カプノグラム40を健康な患者の理想化された波形として示しており、すべての呼吸が、理想的であり、吸気相中のゼロに近い[CO2]、及び、呼気相にわたって漸進的に上昇し、呼気終末CO2に対応する最大[CO2]において終端する明確に規定される最大[CO2]を呈し、etCO2はすべての呼吸について同じである。実際には、不均一な呼吸、会話、咳、不健康な患者の場合の慢性的な肺の問題の可能性などのような多数の要因に起因して、現実の患者のカプノグラム40は通常、この理想化された曲線から大幅に逸脱することが理解されよう。現実の患者のカプノグラムにおいて、etCO2は呼吸ごとに変動する可能性がある。図2の図解の理想化された例は、呼吸速度が一定であるとさらに仮定している。ここでも、現実の患者においては、RRは一般的に一定ではなく、RRは、興奮若しくは労作に起因して大幅に増大する可能性があり、休息期間中は減速する場合があり、睡眠時無呼吸エピソード中は完全に停止する場合があり、及び/又は、一般的に、様々な呼吸器疾患若しくは他の医学的条件に起因して非常に大幅に変動する場合がある。
Continuing with reference to FIG. 1 and further with reference to FIG. 2, a nurse station monitor, a bedside patient monitor, or an appropriately programmed electron by the capnograph electronic device 30 (or, alternatively, in whole or in part). An exemplary embodiment of capnograph data processing performed (by another device having a data processor) is graphically shown in FIG. To generate the
引き続き図1及び図2を参照すると、カプノグラフ電子装置30は、カプノグラム40からカプノグラムヒストグラム42を計算するようにプログラムされている。カプノグラムヒストグラム42は、CO2サンプル値(y軸)対CO2レベル(x軸)のヒストグラムである。カプノグラムヒストグラム42は、30秒の持続時間のスライディングウィンドウにわたって計算される(例示的な図2について、好ましくは数回の呼吸を包含するのに十分に長い持続時間の他のウィンドウサイズが企図される)。例示的な実例として、CO2測定セル20が10ミリ秒間隔(毎秒100サンプル)においてサンプルを取得し、且つウィンドウが30秒である場合、30秒ウィンドウ(3000個の点から成る)内の各カプノグラムサンプルについて、その点のCO2値に対応するビンが増分される。典型的なカプノグラムのカプノグラムヒストグラムにおいては、吸気中により低いベースライン領域があり、呼気中に上昇したCO2領域がある。これら2つの領域の間に、カプノグラムの立ち上がり及び立ち下がりエッジを構成する点のセットがある。より詳細には、図2に描かれているように、3つの領域R1、R2、R3を規定することができる。ヒストグラム42の領域R1は、呼吸の吸気相の間にCO2測定セル20によって測定されるカプノグラム40内の点を含む。図2の例示的な実例において、領域R1は、0~3mmHgのビンを含む。ヒストグラム42の領域R2は、カプノグラム40内の立ち上がり及び立ち下がりエッジを形成するカプノグラム40からのすべての点を含む。図2の例示的な実例において、領域R2は、4~30mmHgのビンを含む。最後に、ヒストグラム42の領域R3は、呼吸の呼気相の間に測定されるカプノグラム40内の点を含む。図2の例示的な実例において、領域R3は、31~39mmHgのすべてのビンを含む。
Continuing with reference to FIGS. 1 and 2, the capnography
典型的なカプノグラムのカプノグラムヒストグラムは、一定の特性を有する。典型的なカプノグラムのヒストグラムでは、領域R1及び領域R3のビンにおいてより多数のCO2サンプル値が発生することになり、領域R2のビン内の発生数は、領域R1及びR3内の発生数よりも低くなるはずである。すなわち、カプノグラムヒストグラム42は、下方領域R1内のピーク及び上方領域R3内のピーク、並びに、中間領域R2内の谷を有する。さらに、上方領域R3内のピークは典型的には、図2の理想化されたカプノグラムヒストグラム42で見た場合は、領域R1内のピークよりも広がっている。上方領域R3内のピークの広がりは、最高のCO2値が典型的には呼吸の終端(すなわち、呼気終末点)において発生する、呼気相の間のカプノグラム40の傾斜によって引き起こされる。カプノグラム波形40のこの傾斜は、カプノグラムヒストグラム42の上方領域R3内のピークを構成する点の広がりに反映される。そのような広がりは、付加的に又は代替的に、すべての呼吸が同じピークCO2値を有するとは限らない(又は、言い換えれば、etCO2が呼吸ごとに変動する)通常の状況によって引き起こされ得る。呼吸ごとのetCO2値の差は、上方領域R3内のピークの広がりに反映される。対照的に、カプノグラムの吸気相の間、CO2レベルは通常、ゼロに近い平坦なベースラインレベルまで下降し、呼吸間の変動をほとんど呈せず、ヒストグラム42の下方領域R1内のピークはより狭くなる。
A typical capnogram capnogram histogram has certain characteristics. In a typical capnogram histogram, more CO 2 sample values will be generated in the bins of regions R1 and R3, and the number of occurrences in the bins of region R2 will be higher than the number of occurrences in the bins of regions R1 and R3. Should be low. That is, the
カプノグラムヒストグラム42は、スライディングウィンドウ内のカプノグラム40から計算され、例えば、30秒ウィンドウを利用する1つの例示的な実例における5秒ごとなど、数秒ごとに新たなヒストグラムが計算される。ウィンドウを整数回の呼吸と同期させることは試みられないが、ウィンドウは、数回の呼吸を包含するのに十分に大きいことが好ましい(例えば、通常の成人患者については、呼吸間隔が3~5秒/呼吸の例示的な30秒ウィンドウが、6~10回の呼吸を包含する)。ウィンドウサイズよりも短い時間間隔上でヒストグラムを再計算することによって(例えば、30秒ウィンドウを使用して5秒ごと)、連続するヒストグラムウィンドウは、大きく重なり合い、時間の関数としての平滑化効果がもたらされる。呼吸サイクルと同期されないため、カプノグラムヒストグラム42を構築するにあたって呼吸検出器を利用する必要がなく、ヒストグラム42の決定は、非常に高速なCO2サンプルビニングプロセスである。
The
呼気終末二酸化炭素(etCO2)値及び呼吸速度(RR)値がカプノグラム信号40から決定される。信号最大値を検出するための実質的に任意の技法を使用して、etCO2値を検出することができる。例えば、いくつかの実施形態において、etCO2値は、カプノグラム信号40から導出されるヒストグラム42を分析することによって、カプノグラム信号40から決定される。この手法において、非ゼロサンプルカウントを有する最高のCO2レベルビンのCO2レベルが、etCO2値を提供する。同様に、信号の周期性を決定するための実質的に任意の技法を使用して、RR値を検出することができる。例えば、呼吸検出器48を使用して呼吸を検出し、それによって呼吸間隔を決定することによって(RRは平均呼吸間隔の逆数である)、RR値を決定することができる。代替的に、高速フーリエ変換(FFT)を適用して、周波数ドメインにおいてRR値を決定することができる。
The exhaled end carbon dioxide (etCO 2 ) and respiratory rate (RR) values are determined from the
引き続き図1を参照すると、カプノグラムヒストグラム42を使用して、呼気終末CO2パラメータ品質指標(etCO2 PQI)44が計算される。この指標は、カプノグラムヒストグラム42から、及び任意選択的にまたカプノグラム40自体からも導出されるパラメータの加重和として計算される。加重和に含まれるパラメータは、カプノグラム40から得られるetCO2測定の確度を決定する上での相対測定基準として適切に選択される。1つの例示的な実施形態において、etCO2 PQI44は、(1)ベースラインを上回るヒストグラム42の部分の測定基準、(2)領域3内の最大CO2と最高のヒストグラムカウントを有する領域R3内のCO2レベルとの間の差の測定基準、(3)領域R3のカウントと領域R2のカウントとを比較する測定基準、(4)領域R3内の総カウントの割合の測定基準、及び(5)CO2立ち下がり時間の測定基準を含むパラメータから計算される。
Continuing with reference to FIG. 1, the
ベースラインを上回るヒストグラム42の部分の測定基準は、領域R1と比較した、領域R3内にあるヒストグラムの部分を特性化する。この測定基準は通常のカプノグラムについては大きいが、呼気プラトーが一貫しない不良なカプノグラム波形の場合は低くなり得る。
The metric of the portion of the
領域3内の最大CO2と最高のヒストグラムカウントを有する領域R3内のCO2レベルとの間の差の測定基準は、呼気プラトーは通常呼気終末点に近づくにつれて平坦になるため、呼気終末点が最高のCO2値を有するはずであり、etCO2における又はそれに近いCO2レベルビンも多数のカウントを有するはずであるため、小さいと予測される。この測定基準は、非ゼロカウントを有する領域R3のビンのCO2レベルと、最高のカウントを記憶している領域R3のビンのCO2レベルとの間の差から計算される。
The measure of the difference between the maximum CO 2 in
上方領域R3のカウントと中間領域R2のカウントとを比較する測定基準は、カプノグラム40内の吸気相から呼気相までに先鋭な遷移が存在するはずであるという予測を定量化する。そのような事例において、中間領域R2のカウントは低く、上方領域R3のカウントは高い。しかしながら、中間領域2内に上方領域R3よりも多くのビンがあるため、この測定基準は、領域R2のすべてのビンにわたる平均カウントを使用して、及び、同様に、領域R3のすべてのビンにわたる平均カウントを使用して定量化されることが好ましい。
A metric comparing the count in the upper region R3 with the count in the intermediate region R2 quantifies the prediction that there should be a sharp transition from the inspiratory phase to the expiratory phase in the
上方領域R3内の総カウントの割合の測定基準は、カプノグラム波形の大部分が呼気相から成るため、高くなるはずである。この測定基準は、上方領域R3内の総カウントと、カプノグラムヒストグラム42内の総カウントとの比を使用して計算される。
The measure of the percentage of total count in the upper region R3 should be high because the majority of the capnogram waveform consists of the expiratory phase. This metric is calculated using the ratio of the total count in the upper region R3 to the total count in the
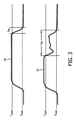
図3を簡単に参照すると、CO2立ち下がり時間の測定基準は、CO2立ち下がり時間の測定基準がカプノグラムヒストグラム42からではなくカプノグラム40から計算されるという点において、例示的なetCO2 PQIに寄与する前出の4つの測定基準とは異なる。CO2立ち下がり時間の測定基準は、酸素補給の効果に起因してカプノグラム波形がウォッシュアウトされるときに、検出のために有用である。これは図3に示されている。図3の上部プロットは、図2に示すものと同じ理想化されたカプノグラム40の呼気プラトーを示す。CO2立ち下がり時間は、高いCO2レベルが上限閾値Tupperを下回って下降するときから、CO2レベルが下限閾値Tlowerを下回って低減するときまでの時間間隔として計算される。このCO2立ち下がり時間は、理想化されたカプノグラム40を示す図3の上部プロット内でtfallとして示されている。tfallは相対的に短いことが分かる。対照的に、図3の下部プロットは、酸素補給ウォッシュアウトを呈するカプノグラム40O2を示す。この事例において、TupperからTlowerへの遷移ははるかに長い。
With brief reference to FIG. 3, the CO 2 fall time metric is exemplary etCO 2 in that the CO 2 fall time metric is calculated from the
呼吸検出を実施することなく、且つ、カプノグラム波形を吸気相と呼気相とにセグメント化することなく、CO2立ち下がり時間を決定することができることが留意されよう。例えば、例示的な実例において、CO2立ち下がり時間は、高いCO2レベルがいつTupperを下回って下降するか、及び、その後、当該CO2レベルがいつTlowerを下回って下降するかを識別することによって計算される。 It should be noted that the CO 2 fall time can be determined without performing respiratory detection and without segmenting the capnogram waveform into the inspiratory and expiratory phases. For example, in an exemplary example, the CO 2 fall time identifies when a high CO 2 level falls below Tupper and then when the CO 2 level falls below T lower . It is calculated by doing.
図1に戻って参照すると、etCO2 PQI44は、これらの測定基準(及び/又は、カプノグラフィによるetCO2測定の信頼性と相関する他の測定基準)の加重和として適切に計算される。すなわち、以下の通りである。

ここで、インデックスiはetCO2 PQI44に寄与する測定基準に及び、Siはi番目の測定基準のスコア(すなわち、値)であり、Wiはi番目の測定基準に対する重みである。重みは、手作業で(例えば、熟練した呼吸器科医、麻酔専門医、呼吸療法士若しくは様々な測定基準の相対的重要性の他の専門家による評定に基づいて)、又は、トレーニングカプノグラムから得られるetCO2値の信頼性に関して熟練した呼吸器科医、麻酔専門医、若しくは他の専門家によって各々ラベル付けされている代表的なカプノグラムのトレーニングセットを使用して機械学習を実施することによって、生成される。 Here, the index i extends to the metric that contributes to etCO 2 PQI44, S i is the score (ie, value) of the i -th metric, and Wi is the weight for the i-th metric. Weights can be obtained manually (eg, based on a rating by a skilled pulmonologist, anesthesia, respiratory therapist or other expert of the relative importance of various metrics) or a training capnogram. By performing machine learning using a representative capnogram training set, each labeled by a skilled pulmonologist, anestherapist, or other specialist with respect to the reliability of the etCO 2 values obtained from. , Generated.
この例において、etCO2 PQIに寄与する5つの測定基準は、例示に過ぎない。より一般的には、カプノグラムヒストグラム42は、呼吸サイクルの吸気相に対応する下方領域R1内の大きく狭いピーク、呼気相に対応する上方領域R3内の大きくわずかにより広いピーク、並びに、吸気から呼気へ及び呼気から吸気への遷移に対応する中間領域R2内の深い谷を呈すると予測されることが理解されよう。この基本ヒストグラム形状から逸脱は、カプノグラム波形が劣化するときに予測され、結果として、etCO2値は信頼性がより低くなると予測される。ヒストグラム形状、及び、したがってカプノグラム波形を評定するために測定基準を定量的に特性化するために、トレーニングカプノグラムについて構築されるヒストグラムを使用して、様々な測定基準を構築及び最適化することができる。測定基準及びそれらの重みの最適な選択は、カプノグラフデバイス及びその患者への接続、モニタリングされている人口動態、所望の感受性(例えば、etCO2 PQIが大きく低減し始める前にカプノグラム波形がどの程度「不良」であるべきか)などに依存する。いくつかの実施形態において、測定基準は、種々の患者接続(例えば、鼻カニューレ対気道アダプタ)、種々の患者呼吸条件(例えば、自発的呼吸対様々な人工呼吸モード)などに対して最適化される。カプノグラムヒストグラム形状は、カプノグラム波形を反映し、そのため、ヒストグラムの定量的測定基準は、カプノグラム内の呼吸間隔を検出する必要なく、且つ、カプノグラムを吸気相と呼気相とにセグメント化する必要なく、カプノグラム波形品質を評定することを可能にする。例示的な実例において、1つの測定基準(CO2立ち下がり時間)が、カプノグラムヒストグラム42からではなく、カプノグラム40から直接的に抽出されるが、これは依然として、呼吸検出を実施すること又はカプノグラムを複数の呼吸相にセグメント化することなく行われる。計算は高速であり、リアルタイムで(すなわち、数十秒、数秒又はそれ未満の遅延で)実施することができる。
In this example, the five metrics that contribute to etCO 2 PQI are merely exemplary. More generally, the
引き続き図1を参照すると、呼吸速度パラメータ品質指標(RR PQI)46も決定される。RRとRR PQIは両方とも、呼吸の検出に依存し、したがって、呼吸検出器48によってカプノグラム40内で検出される呼吸間隔を入力として受信する。RR PQI46は、例示的な実例として、呼吸速度(RR)、呼気時間/吸気時間比(IE比)の測定基準、呼吸のカプノグラム内の無効ピークカウントを定量化する測定基準、カプノグラム二酸化炭素レベルダイナミックレンジ測定基準、及び、吸気CO2レベルがどれだけゼロに近いかの測定基準を含む、測定基準の加重和として適切に決定される。RR及びIE比値は、妥当な範囲の外側に大きく降下する値がRR PQI46を低減するように、妥当な範囲内にあるべきである(例えば、成人については毎分約12~20呼吸のRR)。余分な(無効な)ピークは誤った呼吸検出をもたらす可能性があり、したがって、より多くの無効ピークはRR PQIを低減する。カプノグラムダイナミックレンジ(最大CO2レベル-最小CO2レベル)は、信号強度に影響を与え、そのため、低ダイナミックレンジはRR PQIを低減する。同様に、CO2レベルは、吸気中はゼロに近くなるはずであり、一方、吸気中のより高いCO2レベルは呼吸検出をより困難にし、RR PQI46の値をより低くする。
With reference to FIG. 1, the respiratory rate parameter quality index (RR PQI) 46 is also determined. Both RR and RR PQI depend on the detection of respiration and therefore receive as input the respiration interval detected within the
図1の例示的な実施形態において、RR PQI46はまた、加重和における追加の測定基準としての役割を果たすetCO2 PQI44に基づいても決定される。etCO2 PQI44は、カプノグラム波形の「正常さ」の測定基準である。異常性が高いカプノグラム波形は、呼吸検出をより困難にするため、etCO2 PQI44の値が低くなると、結果として、RR PQI値も低くなる。RR PQI46に対する入力測定基準としてetCO2 PQI44を利用することによって、RRの信頼性の評定においてetCO2 PQI44が有利に再使用される。
In the exemplary embodiment of FIG. 1, the
RR PQI46は再び、寄与する測定基準の加重和として適切に計算される。

ここで、インデックスiはRR PQI46に寄与する測定基準に及び、Siはi番目の測定基準のスコア(すなわち、値)であり、Wiはi番目の測定基準に対する重みである。重みはここでも、手作業で、又は、RR信頼性に関してラベル化されている代表的なカプノグラムのトレーニングセットを使用した機械学習を実施することによって生成される。この実例においてRR PQIに寄与する測定基準はここでも例示に過ぎず、追加の又は他の測定基準が企図される。
Here, the index i extends to the metric that contributes to the
いくつかの実施形態において、呼吸健康状態指標(RWI)50も計算され、これは、カプノグラム40を使用して患者の呼吸健康状態を評定するために品質スコアを表す。RWI50は、医療従事者が、患者の全体的な呼吸健康状態を評価するのを助けるように設計される。RWI50はまた、処置時鎮静などの間に、中枢性無呼吸又は閉塞性無呼吸に起因する低換気の危険性にさらされている挿管されていない患者を識別するために使用される。適切な実施形態において、RWI50に対する加重入力としての役割を果たす測定基準は、測定されているRR及びetCO2並びに対応するRR PQI44及びetCO2 PQI46を含む。概して、RR又はetCO2のいずれかがそれらのそれぞれの正常な範囲外にある場合、これによってRWI50が低下する。RR PQI44が低くなること又はetCO2 PQI46が低くなることによっても、RWI50は低下する。いくつかの実施形態において、気道閉塞又は無呼吸エピソードの検出におけるその使用を促進するために、最後の呼吸測定基準からの時間も、RWI50に組み込まれる。例えば、最後の呼吸からの時間は、CO2レベルが最後に上昇してからの時間を評定するブロック52によって、カプノグラム40から定量化することができる。
In some embodiments, a respiratory health index (RWI) 50 is also calculated, which represents a quality score for assessing a patient's respiratory health using the
指標44、46、50は、カプノグラムヒストグラム42が更新されるたびに、例えば、例示的な実例においては5秒ごとに、適切に再計算される。例示的なヒストグラム計算ウィンドウは30秒であるため、指標44、46、50の最初の計算は、30秒のカプノグラム40が取得された後に実施される。
カプノグラフデバイス10が、RR値及びetCO2値に基づいて情報メッセージを提供するようにプログラムされている場合、指標44、46、50は、任意選択的に、基礎となるRR又はetCO2が対応するPQIによって示されるものとして信頼できないときは、これらの情報メッセージを抑制するために使用されてもよい。非限定的な例示として、1つの企図される実施形態において、表1のメッセージング方式が利用され、出力は、RWIが何らかの閾値よりも低いときにのみ表示される。
If the

この例示的なメッセージング方式において、「患者が不安がっています」メッセージは、RR PQI46が閾値を下回る場合は抑制される。
In this exemplary messaging scheme, the "patient is anxious" message is suppressed if the
etCO2、RR、etCO2 PQI44、RR PQI46、及び/又はRWI50のような証拠パラメータの値の計算及び表示(ディスプレイコンポーネント32上での)に加えて(又はそれに代えて)、カプノグラムヒストグラム42自体をディスプレイコンポーネント32上に表示することが企図される。前述したように、カプノグラムヒストグラム42は、カプノグラム40(任意選択的にまた、例えば傾向線としてディスプレイ32上に表示されてもよい)の表示を読解することと比較して、医療従事者によってより容易に知覚される形式において、カプノグラム波形に関する相当の情報を具現化する。カプノグラム40の傾向線を表示することと比較しての、カプノグラムヒストグラム42を表示することの1つの利点は、傾向線が典型的には水平にスクロールされる一方で、カプノグラムヒストグラム42はスクロールするのではなく、例えば5秒ごとに更新され、連続する更新の間でウィンドウの重なりが大きいことに起因して、連続する更新の間に相当の重なりがある(例えば、ウィンドウが30秒で、更新が5秒の場合、各連続するヒストグラムは、直前のヒストグラムを生成するのに使用された同じカプノグラムデータのうち25秒、及び、5秒のみの新たなカプノグラムデータから導出される)。
In addition to (or instead) calculating and displaying (or instead) the values of evidence parameters such as etCO 2 , RR, etCO 2 PQI44, RR PQI46, and / or RWI50, the
上記の実施形態は有利には、医療従事者によってより容易に把握及び行動される出力を有するカプノグラフィモニタリングを可能にする。以下のいくつかの実施形態において、カプノグラフィモニタリングは、例えば、指又は動脈血酸素飽和度(SpO2)測定が行われる他の組織内の血液の脈動部分を測定するパルスオキシメータによって測定されるSpO2など、血中ヘモグロビン酸素飽和度情報と相乗的に組み合わされる。指の血液では静脈血が大部分を占めるが、静脈血は大きくは脈動しないため、SpO2測定においては考慮されない。動脈血のみが強く脈動するため、パルスオキシメータは動脈血酸素飽和度を測定する。「動脈」という用語は、まだガス交換(肺の中で捕捉されるO2の損失及び組織からのCO2の収集を引き起こす)に関与していない血液を指す。動脈血は、動脈又は毛細血管(微小毛細血管を含む)内に位置する場合があり、そのような血液は、ガス交換にまだ関与していない限り、たとえ毛細血管内に位置する場合であってもなお、動脈血であることが留意され得る。したがって、SpO2測定は、指先又は測定されている他の組織内の動脈血の酸素化を測定し、測定は、その動脈血が動脈、毛細管、又は両方の血管タイプ内にあるかにかかわらず行われる。 The above embodiments advantageously enable capnography monitoring with outputs that are more easily grasped and acted upon by healthcare professionals. In some embodiments below, capnography monitoring is measured, for example, by a pulse oximeter measuring the pulsating portion of blood in a finger or other tissue where arterial oxygen saturation (SpO 2 ) measurements are taken. It is synergistically combined with blood hemoglobin oxygen saturation information such as SpO 2 . Venous blood occupies the majority of finger blood, but venous blood does not pulsate significantly and is not considered in SpO 2 measurements. Since only arterial blood pulsates strongly, a pulse oximeter measures arterial oxygen saturation. The term "artery" refers to blood that has not yet been involved in gas exchange, which causes the loss of O 2 trapped in the lungs and the collection of CO 2 from tissues. Arterial blood may be located within arteries or capillaries (including microcapillaries), even if such blood is located within capillaries unless it is already involved in gas exchange. It can be noted that it is arterial blood. Therefore, SpO 2 measurements measure the oxygenation of arterial blood in the fingertips or other tissues being measured, regardless of whether the arterial blood is in an artery, capillary, or both vascular types. ..
本明細書において、医療専門家は多くの場合、カプノグラフィデータではなくSpO2バイタルサインに主に依拠する傾向にあると認識される。これは、多くの臨床医がカプノグラフィと比較してSpO2により精通していることと、低SpO2レベルが緊急医療問題、すなわち、患者が十分に酸素供給されていないことの直接的な臨床的尺度であると臨床医が認識していることの両方に起因する。対照的に、etCO2のようなカプノグラフィデータの解釈はより複雑であり、一部の医療専門家にとってはより困難であり得る。 It is recognized herein that medical professionals often tend to rely primarily on SpO2 vital signs rather than capnography data. This is a direct clinical fact that many clinicians are more familiar with SpO 2 compared to capnography and that low SpO 2 levels are an emergency medical problem, ie the patient is not adequately oxygenated. It is due to both the clinician's perception that it is a measure. In contrast, the interpretation of capnography data such as etCO 2 is more complex and can be more difficult for some medical professionals.
しかしながら、本明細書においては、カプノメトリは、呼吸の問題がSpO2レベルの低減として現れる前に、呼吸の問題を検出することによって、優れたインジケータとしての役割を果たすことができるため、カプノグラフィは、SpO2モニタリングを補完すると認識される。カプノグラフィは、肺の中での血液-ガス交換の直接の帰結を測定し、一方、SpO2は、この血液-ガス交換の遅れた測定基準を測定し、長い時間期間にわたって行われる肺の中での血液への酸素の伝達が不十分であることによって血液酸素化が累積的に低減した後にのみ、臨床警告をもたらす。 However, capnography is described herein because capnography can serve as an excellent indicator by detecting respiratory problems before they appear as reductions in SpO 2 levels. Recognized as complementing SpO 2 monitoring. Capnography measures the direct consequences of blood-gas exchange in the lung, while SpO 2 measures this delayed measure of blood-gas exchange and takes place in the lung over a long period of time. Only after a cumulative reduction in blood oxygenation due to inadequate transfer of oxygen to the blood provides clinical warning.
SpO2モニタリングをカプノグラフィが補完し得る別の様態は、酸素補給を受けている患者の事例におけるものである。ここで、酸素補給は、高いSpO2レベルを促進するが、そうする中で、根底にある、肺における血液ガス交換問題、すなわち、呼吸速度及び/又は量が低いことを隠してしまう可能性がある。カプノグラフィは、肺における血液-ガス交換のCO2生成を直接的に測定することによって、SpO2測定において酸素補給によってもたらされる追加の酸素化によって隠されている可能性がある呼吸障害を検出することができる。 Another aspect in which capnography can complement SpO 2 monitoring is in the case of patients receiving oxygen supplementation. Here, oxygen supplementation promotes high SpO2 levels, but in doing so can conceal the underlying blood gas exchange problem in the lungs, ie, low respiratory rate and / or volume. be. Capnography detects respiratory disorders that may be concealed by the additional oxygenation provided by oxygenation in SpO 2 measurements by directly measuring the CO 2 production of blood-gas exchange in the lungs. Can be done.
本明細書において開示されている手法において、SpO2及びカプノグラフィは、呼吸障害をより迅速に検出する患者モニタリングを可能にするために相乗的に組み合わされ、SpO2モニタリングを介してライフクリティカルな血液酸素化モニタリングを依然として提供しながら、他の様態では酸素補給によって隠されてしまう可能性がある呼吸障害を検出することができる。いくつかの実施形態において、開示されている手法は、相乗的な臨床判断支援をさらに提供する。SpO2及びカプノグラフィ情報は、1つ又は複数の臨床警告を識別するために別個に分析され、これらの警告は、緊急性に基づいてランク付けされるように表示される。 In the techniques disclosed herein, SpO 2 and capnography are synergistically combined to enable patient monitoring to detect respiratory disorders more quickly, and life-critical blood oxygen through SpO 2 monitoring. While still providing capnographic monitoring, it is possible to detect respiratory disorders that may otherwise be masked by oxygen supplementation. In some embodiments, the disclosed approach further provides synergistic clinical judgment support. SpO 2 and capnography information are analyzed separately to identify one or more clinical warnings, and these warnings are displayed to be ranked based on urgency.
RWIは、それ自体では、血液酸素化(又は、より一般的には、患者の心臓の状態)を考慮しない。以下の例示的な実施形態において、本明細書においては患者安全指標(PSI)として参照される、全体的な患者の安全性の指標を計算するために、患者の動脈酸素飽和度レベル(SpO2)が、RWIと組み合わされる。例示的なPSIは、1~10の範囲内の値であり、ここで、1が最低スコア(患者は応急手当を必要とする)であり、10が最高スコア(換気及び酸素供給が健常)である。患者が、低ヘモグロビン酸素飽和度によって示される血液中の不十分な酸素飽和度と、正常な呼吸速度及び呼気終末CO2濃度によって示される十分な呼吸の両方を同時に有する可能性がある。 The RWI itself does not consider blood oxygenation (or, more generally, the condition of the patient's heart). In the following exemplary embodiments, the patient's arterial oxygen saturation level (SpO 2 ) is used to calculate an overall patient safety index, referred to herein as the Patient Safety Index (PSI). ) Is combined with RWI. An exemplary PSI is a value in the range 1-10, where 1 is the lowest score (patients need first aid) and 10 is the highest score (healthy ventilation and oxygen supply). be. A patient may have both inadequate oxygen saturation in the blood, as indicated by low hemoglobin oxygen saturation, and sufficient respiration, as indicated by normal respiratory rate and terminal CO 2 concentration.
図4を参照すると、RWIとSpO2レベルとを組み合わせることによってPSIを生成する例示的な実施形態が、図式的に示されている。患者12、患者装具14(この事例では鼻カニューレ)、及びカプノグラフデバイス10は、図1の実施形態についてすでに説明されている。カプノグラフデバイス10は、同じく図1を参照しながら前述されている、カプノグラム信号40から決定される呼吸健康状態指標(RWI)50、呼気終末二酸化炭素(etCO2)値60及び呼吸速度(RR)値62を出力する。図4の例示的な実施形態は、図1の実施形態のカプノグラム信号波形、カプノグラムヒストグラム、又はPQI(パラメータ品質指標)値を出力しないが、これらのうちのいずれかはまた、所望に応じて図4の実施形態の変形形態において出力されてもよい。
Referring to FIG. 4, an exemplary embodiment of generating PSI by combining RWI and SpO 2 levels is shown graphically. The
図4の例示的な実施形態は、例えば、指先パルスオキシメータなどであってもよい、パルスオキシメータ70をさらに含むか、又は、パルスオキシメータ70にアクセスすることができる。典型的なパルスオキシメータ設計において、発光ダイオード(LED)又は他の光源が赤色光又は赤外光を、患者の組織(例えば、指先)を通じて送信し、これらの波長における透過が測定される。当該技術分野において既知であるように、これらの異なるスペクトル位置における示差吸収は、動脈血酸素飽和度(SpO2)72の抽出を可能にする。モニタリングされている組織(例えば、指先)の血液量が、連続する各心拍によって循環的に変動するときに光信号の変動から得られる心拍数(HR)74も、パルスオキシメータ70によって出力することができる(心拍数は、付加的に又は代替的に、例えば、心電図など別のセンサから得られてもよい)。
An exemplary embodiment of FIG. 4 further comprises or can access the
マルチパラメータ患者モニタ80が、入力として、RWI50及びetCO2値60を受信し、また、任意選択的に、カプノグラフデバイス10からのRR62、パルスオキシメータ70からのHR74、血圧モニタ(図示されていないコンポーネント)からの血圧などのような他の生理学的パラメータをも受信する。例示的な患者モニタ80は、ディスプレイ82及び電子プロセッサ84を含む。患者モニタリングにおいては慣例であるように、電子プロセッサ84は、任意選択的に、受信されている生理学的パラメータ60、62、72、74のうちの1つ又は複数を、例えば、傾向線、及び/又は、任意選択的に平均化時間ウィンドウにわたって平均されている数値として、ディスプレイ82上に表示するようにプログラムされる。物理的には、患者モニタ80は、例えば、ベッドサイド患者モニタ、ナースステーションモニタ、ウェアラブル患者モニタリングデバイスなどのように、様々に具現化されてもよい。患者モニタのいくつかの例示的な実例は、オランダのアイントホーフェン所在のKoninklijke Philips N.V.から入手可能な様々なIntelliVue(商標)患者モニタを含む。他の実施形態において、患者モニタ80は、何らかの他の医療デバイスと一体化されてもよく、例えば、患者モニタ80は、人工呼吸器(図示せず)のコンポーネントであってもよい。
The multi-parameter patient monitor 80 receives the
図4の例示的な患者モニタ80の電子プロセッサ84は、図4に図式的に示すように、患者安全指標(PSI)を計算するようにさらにプログラムされる。この目的のために、SpO2値72は、SpO2スコア又は指標90に変換され、SpO2指標90及び呼吸健康状態指標(RWI)50は組み合わされて、様々に利用される患者安全指標(PSI)92が生成される。図4の例示的な実例において、PSI92は、臨床的問題を検出するための判断動作94への入力として使用される。判断94が、PSI92の値によって臨床的問題が証拠づけられるということである場合、低SpO2レベル、気管内チューブの配置が不正確である可能性があること、高炭酸(すなわち、血液中のCO2の異常な上昇)などのような警告条件を識別するために、SpO2及びカプノグラフィデータを分析するために、判断支援分析96がトリガされる。動作98において、任意のそのような警告条件が、例えば、緊急性によってランク付けされたリストとして(いくつかの実施形態において、上位N個のリストであってもよく、ここで、Nは、1、2、3、又はより多くの最も緊急の警告のサブセットである)、患者モニタ80のディスプレイ82上に表示される。
The
以下において、PSI92の1つの適切な定式化の例示的な実例が記載される。 In the following, exemplary examples of one suitable formulation of PSI92 are described.
SpO2指標90の例示的な実例において、動脈血酸素飽和度(SpO2)測定値72が、+10と-10との間のスコアを出力するスコア関数へと入力される。動脈血酸素飽和度72が上限閾値(例えば94%)を上回る場合、スコア関数は、10の最大スコア値を出力する。より低い値の酸素飽和度72について、スコアは低減する。動脈血酸素飽和度72が下限閾値(例えば80%)を下回る場合、スコア関数は、-10の最小スコア値を出力する。
In an exemplary embodiment of the SpO 2 index 90, an arterial oxygen saturation (SpO 2 )
PSI92の計算の例示的な実例において、重み付け係数が、酸素飽和度スコア90及びカプノグラフィデバイス10から計算されるRWI50に適用される。これらのスコアの加重和が、結果としてのPSI値である。例えば、動脈血酸素飽和度が92%である場合、対応するスコアは3であり得る。対応するRWIが5である場合で、且つ、両方の入力に対する重みが0.5である場合、出力PSIは4であり、患者が危険にさらされている可能性があり得ることを示す。例示的な実例において、SpO2スコアの範囲[-10,10]内でのスケールの選択は、患者の血液酸素化が低い、臨床的に緊急の状況を捉えることを保証するために、低SpO2値が組み合わされたPSIを引き下げることを保証する。
In an exemplary example of the calculation of
動脈血酸素飽和度スコアリングの変形実施形態は、患者が酸素補給を受けている場合のSpO2について、SpO2スコア90を調整する。この調整は、患者が空気を呼吸しているときの正常に近いと考えられる動脈血酸素飽和度(すなわち、94%)が、同じ患者が鼻カニューレ、マスク又は気管内チューブを通じて酸素補給を受けている場合には低いと考えられることになるという、臨床的な現実性を捉える。予測正常範囲のこの差を計上するために、SpO2指標90を生成する関数は、患者が酸素補給を受けていることが分かっているときには、少量(すなわち、2%)だけより低い値にシフトされる。この変形実施形態は、患者が酸素補給を受けており、飽和度値がわずかにより高くなると予測されるときには、PSI92が、低い酸素飽和度値に対してより感受性になることを可能にする。
A modified embodiment of arterial oxygen saturation scoring adjusts the SpO 2 score 90 for SpO 2 when the patient is receiving oxygen supplementation. This adjustment has an arterial oxygen saturation (ie, 94%) that is considered close to normal when the patient is breathing air, but the same patient is receiving oxygen supplementation through a nasal cannula, mask or intratracheal tube. Capture the clinical reality that in some cases it will be considered low. To account for this difference in the predicted normal range, the function that produces the SpO 2 index 90 shifts to a lower value by a small amount (ie, 2%) when the patient is known to be receiving oxygen supplementation. Will be done. This modified embodiment allows the
患者が酸素補給を受けているという決定は、患者モニタ80に対するユーザ入力に基づいてもよい(例えば、患者プロファイルを設定するときに、看護師又は他の医療専門家は、患者が酸素補給を受けていることを示すラジアル入力ボタンを選択する)。代替的に、患者が酸素補給を受けていることを検出するための自動メカニズムが利用されてもよく、例えば、患者モニタ80が人工呼吸器と一体化されているか、又は、人工呼吸器からデータを受信するように接続されており、且つ、利用可能なデータが吸気酸素濃度比(FiO2)を含む場合、患者モニタ80は、FiO2値に基づいて、患者が酸素補給を受けているか否かを自動的に検出する。そのような実施形態において、酸素補給レベルに基づいて、より低い値のSpO2指標90への前述したわずかなシフトを調整することがさらに企図され、例えば、より高いFiO2値に対しては、指標値のより大きい下方シフトを適用する(より高い吸気酸素濃度比は、より多くの酸素補給を示すため)。 The determination that the patient is oxygenated may be based on user input to the patient monitor 80 (eg, when setting the patient profile, a nurse or other healthcare professional will tell the patient that the patient is oxygenated. Select the radial input button to indicate that). Alternatively, an automated mechanism for detecting that the patient is receiving oxygenation may be utilized, eg, the patient monitor 80 is integrated with the ventilator or data from the ventilator. If the patient is connected to receive a signal and the available data includes a inspired oxygen concentration ratio (FiO 2 ), the patient monitor 80 will determine if the patient is receiving oxygen supplementation based on the FiO 2 value. Is automatically detected. In such embodiments, it is further contemplated to adjust for the aforementioned slight shift to a lower SpO 2 index 90 based on the oxygen supply level, eg, for higher FiO 2 values. Apply a larger downward shift to the index (because a higher inspired oxygen concentration ratio indicates more oxygen supply).
図5及び図6を参照すると、SpO2指標90を計算するために適切に使用されるSpO2指標対SpO2値の関数の例示的な実例が、酸素が補給されない場合(図5)及び酸素が補給される場合(図6)について示されている。図5に見られるように、酸素が補給されない場合、SpO2指標スコアは、94%までのSpO2値についてはその10の最大値のままである(すなわち、上限閾値は94%である)。図6に見られるように、酸素が補給される場合、SpO2指標スコアは、ただ96%までのSpO2値についてその10の最大値のままであり(すなわち、上限閾値は96%まで増大される)、これは、例えば、酸素補給を受けていない患者にとっては95%のSpO2が通常は臨床的に許容可能であると見なされるが、酸素補給を受けている患者にとっては異常に低いと見なされ得ることを反映している。より一般的には、いくつかの好ましい実施形態において、SpO2指標90は、下限閾SpO2値(図5の酸素補給なしスコア関数については78%、又は、図6の酸素補給スコア関数については80%)以下のSpO2の値に対する最小値(例えば、例示的な実例においては-10)を有し、上限閾SpO2値(図5の酸素補給なしスコア関数については94%、又は、図6の酸素補給スコア関数については96%)以上のSpO2の値に対する最大値(例えば、例示的な実例においては+10)まで単調に増大する単調関数を使用して計算される。
Referring to FIGS. 5 and 6 , an exemplary example of a function of SpO2 index vs. SpO2 value appropriately used to calculate
SpO2指標90とRWI50とを組み合わせてPSI92を生成する中で、RWI値及びSpO2値は、同じ時点に対応する生理学的条件を反映すべきである。これら2つの入力信号が時間的に不整合である場合、それらは患者安全性を示すために協働しない場合がある。RWI及びSpO2は異なる生理学的信号から導出されるため、すなわち、一方はカプノグラフィデバイス10によって測定され、他方はパルスオキシメータ70によって測定されるため、互いに前後して発生した事象又は条件を反映し得る可能性がある。言い換えれば、2つの異なるデバイス10、70からのデータストリームは、時間的に同期しない場合がある。不整合のもう1つの原因は、信号平均化であり得る。入力の変動性を改善するために、入力信号を平均することが有益であり得る。しかしながら、信号平均化によって信号の応答が遅延し、結果、2つの信号のうちの一方又は他方が、他方の信号(SpO2又はカプノメトリ)に対して遅延する可能性がある。例えば、患者モニタ80から2つのデバイス10、70に出力される共通のクロック信号を使用すること、2つのデバイス10、70のうちの一方から他方へと同期クロック信号を送信することなど、SpO2及びカプノグラフィ信号を同期させるための様々な手法を使用することができる。別の手法において、信号内の識別可能なランドマークを使用することができ、例えば、カプノグラフィデバイス10が心拍数をも測定する多機能患者モニタリングデバイスである場合、この心拍数を使用して、パルスオキシメータ70によって測定されるHR74と同期させて、2つのデバイス10、70からの信号を同期させる。これらは例示的な同期手法に過ぎない。
In generating PSI92 by combining the
図4を参照すると、判断支援分析96及び判断支援警告メッセージング98の実施形態のいくつかの例示的な実例を次に説明する。
With reference to FIG. 4, some exemplary examples of embodiments of
例えば、別の患者データストリームとして、PSI92を患者モニタ80上に表示することができる。しかしながら、図4の例示的な実例において、PSI92は通常、表示されるが、いくつかの実施形態においては決して表示されない。むしろ、PSI92は主に、臨床介入を要求する可能な状況を検出するために、判断94への入力としての役割を果たす。動作94において、計算されているPSI92が閾値未満である場合、メッセージが表示される。しかしながら、単純「PSIが安全閾値を下回っています」のような警告を表示することは、看護師、医師、又は他の臨床医にとって特に有益ではない。むしろ、図4の例示的な実施形態において、低PSIは、警告メッセージング動作98において表示される1つ又は複数の臨床的に有益な警告メッセージを提供する判断支援分析96をトリガする。これらのメッセージは、各入力(RWI又はSpO2スコア)が計算されるPSI92に及ぼす影響に基づいて選択され、任意選択的にランク付け様式で表示される。この影響は、スコアの不完全度(10-スコア)及び入力に適用される重み付け係数の積である。例えば、SpO2指標90が3であり、重み付け係数が0.5である場合、PSIに対するSpO2スコアの影響は1.5になる。SpO2がPSIに対してより大きい影響を及ぼす場合、メッセージ指示「SpO2が低くなっています」(又は、「酸素供給が不十分です」又は「O2補給を確認してください」のような、何らかの他の意味的に類似したメッセージ)が表示される。他方、RWIがスコアに対してより大きい影響を及ぼす場合、RWIに基づくメッセージが示される。
For example, the
図4の実施形態を使用して実施される例示的なモニタリングプロセスを、以下に説明する。所与の呼吸又は時間期間について、図1を参照しながら本明細書において前述したように、カプノグラフィデバイス10によって測定されるカプノグラフィ信号からRWI50を算出する。時間的にRWIが算出されたときの呼吸に対応するSpO2測定値72が、例えば、例示的なパルスオキシメータ70から受信される。酸素補給の存否に基づいてSpO2に対する的確なスコアマッピング関数(例えば、酸素補給がない場合の図5のスコア関数、又は酸素補給がある場合の図6のスコア関数)を選択する。SpO2値は、図4のSpO2スコア又は指標90にマッピングされる。PSI指標値92は、SpO2指標スコア及びRWI値の加重和として算出される。判断94において、PSI指標値92が閾値未満である場合、判断支援分析96が開始される。1つの例示的な手法において、障害スコアが、PSI92への入力の各々について(すなわち、SpO2指標スコア90及びRWI50の各々について)算出される。障害スコアは、重み付け係数と、10.0-特徴値との積として適切に計算される。その後、いずれの入力(SpO2又はRWI)が最高の障害スコアを有するかが決定される。SpO2がより高い障害スコアを有する場合、動作98において、SpO2が低いことを示すメッセージが表示される。RWIがより高い障害スコアを有する場合、動作98において、RWIに基づくメッセージが表示される。この後者の出力は任意選択的に、例えば、図1を参照しながら本明細書において説明されているような、さらなる判断支援分析をカプノグラフィデータに対して実施することによって生成される。
An exemplary monitoring process carried out using the embodiment of FIG. 4 is described below. For a given breath or time period, the
任意選択的に、PSI信号は、長い時間にわたって又は複数回の呼吸にわたって平均されてもよい。例えば、PSIが5秒ごとに算出される場合、5秒ごとに算出されている結果のPSIを表示するのではなく、その前の1分の間に算出される平均PSIを表示することが有益であり得る。これによって、PSIデータストリーム内のノイズに起因して謝った警告が生成されることを回避するのを助けることができる。 Optionally, the PSI signal may be averaged over a long period of time or over multiple breaths. For example, if PSI is calculated every 5 seconds, it is useful to display the average PSI calculated during the previous minute instead of displaying the resulting PSI calculated every 5 seconds. Can be. This can help avoid generating apologetic warnings due to noise in the PSI data stream.
図4の例示的な実例は、患者モニタリングを改善するためにカプノグラフィ及びSpO2データを統合する動作を実施するためのホスト計算/表示デバイスとして、マルチパラメータ患者モニタ80を利用する。この処理を患者モニタ80において実施することは、そのようなマルチパラメータ患者モニタが、カプノグラフィデータ及びSpO2データが収集される共通の「ハブ」であるため、有利である。例示的な実例において、RWI50は、図1を参照しながら説明されているように、カプノグラフデバイス10によって実施される処理によってさらに計算される。しかしながら、より一般的には、これらの様々な処理は、利用可能な電子処理及び表示デバイスにわたって他の様態で分散されてもよい。例えば、別の企図される実施形態において、すべての処理はカプノグラフデバイスにおいて実施され、SpO2はカプノグラフデバイスへの入力である。この構成において、患者モニタは、任意選択的に省略されてもよい。別の企図される実施形態において、カプノグラフデバイスは、RWI計算と、RWI及びSpO2を統合する後続の動作の両方を実施する患者モニタリングデバイスに未処理のカプノグラム波形を出力する。この手法は、患者モニタが、未処理のカプノグラムを出力することができる任意のカプノグラフデバイスと協働してPSIベースのモニタリングを提供することを可能にする。患者モニタリングを改善するためにカプノグラフィ及びSpO2データを統合する動作は、マイクロプロセッサ、マイクロコントローラ、又は開示されている処理を実施するための他の電子プロセッサによって読み取り可能且つ実行可能である命令を記憶する非一時的記憶媒体によって具現化することができることが、またさらに理解されよう。そのような非一時的記憶媒体は、非限定的な例示として、ハードディスクドライブ又は他の磁気記憶媒体、フラッシュメモリ、読み出し専用メモリ(ROM)又は他の電子記憶媒体、光ディスク又は他の光学記憶媒体、それらの様々な組み合わせなどを含んでもよい。
The exemplary example of FIG. 4 utilizes a multi-parameter patient monitor 80 as a host calculation / display device for performing operations that integrate capnography and SpO 2 data to improve patient monitoring. Performing this process on the patient monitor 80 is advantageous because such multi-parameter patient monitors are a common "hub" from which capnography data and SpO 2 data are collected. In an exemplary embodiment, the
さらなる企図される変形形態として、開示されるRWIは、患者の健康状態を、カプノグラフデバイス10によって測定されるカプノグラムによって示されるものとして表すカプノグラフィ指標の非限定的な例示的実例であるものとして理解されるべきである。より一般的には、他のカプノグラフィ指標定式化が利用されてもよい。別の例示的な実例において、任意選択的に、SpO2に関して開示されているスケーリング動作(例えば、図5及び図6の例示的な実例)と同様に、最小指標値と最大指標値との間でスケーリングされている呼気終末CO2(etCO2)を、カプノグラフィ指標として使用することができる。カプノグラフィ指標は、カプノグラムから導出される任意の情報を使用して計算され、例えば、例示的なRWIは、二酸化炭素濃度又は分圧に基づいて、及びまた、カプノグラムから導出される呼吸速度(RR)情報にも基づいて計算されることが留意されるべきである。
As a further intended variant, the disclosed RWI is as a non-limiting exemplary example of a capnography index representing a patient's health as indicated by a capnography measured by a
カプノグラフィ及び動脈血酸素飽和度データを組み合わせることにおける、図4の手法及びその変形形態は、カプノメトリ及び動脈血酸素飽和度モニタリングと関連付けられる不確実性及び混乱を低減し、カプノグラフィデータの解釈にそれほど習熟していない臨床医が、カプノグラフィ及びSpO2モニタリングを患者モニタリングの解釈により効果的に統合することを可能にする。本発明は、好ましい実施形態を参照して記載されている。先行する詳細な説明の読解及び理解を受けて、他のものに対する修正及び改変を行うことができる。本発明は、添付の特許請求の範囲及びそれらの均等物の範囲内に入る限り、すべてのそのような修正及び改変を含むものとして解釈されることが意図されている。
The method of FIG. 4 and its variants in combining capnography and arterial oxygen saturation data reduce the uncertainty and confusion associated with capnography and arterial oxygen saturation monitoring and are less proficient in interpreting capnography data. Allows non-clinicians to more effectively integrate capnography and SpO 2 monitoring by interpreting patient monitoring. The present invention has been described with reference to preferred embodiments. With the reading and understanding of the preceding detailed description, modifications and modifications to others may be made. The invention is intended to be construed as including all such modifications and modifications, as long as it falls within the scope of the appended claims and their equivalents.
Claims (22)
前記患者の動脈血酸素飽和度(SpO2)を測定するパルスオキシメータと、
電子プロセッサであって、
前記カプノグラフデバイスによって測定される前記カプノグラムから患者健康状態を示すカプノグラフィ指標を生成し、前記カプノグラフィ指標は、前記etCO2 PQI及び前記RR PQIに部分的に基づいて計算され、
患者健康状態を示す動脈血酸素飽和度(SpO2)指標を、前記パルスオキシメータによって測定される前記SpO2から生成し、
前記カプノグラフィ指標及び前記SpO2指標から患者安全指標(PSI)を計算し、前記カプノグラフデバイスが前記計算されたヒストグラムを更新するたびに、前記カプノグラフィ指標は再生成され、前記etCO2 PQI及び前記RR PQIは再計算され、
前記患者安全指標に少なくとも部分的に基づいて決定される1つ又は複数の臨床警告を計算するようにプログラムされている、電子プロセッサと、
計算された前記1つ又は複数の臨床警告のうちの少なくとも1つを表示するディスプレイコンポーネントと
を備える、患者モニタリングデバイスであって、
前記電子プロセッサはさらに、(i)PSI閾値を下回る前記患者安全指標に応じて、前記計算された1つ又は複数の臨床警告を前記ディスプレイコンポーネントに出力し、(ii)前記PSI閾値を下回る前記患者安全指標且つ所与の指標閾値を下回る前記カプノグラフィ指標、前記etCO2 PQI又は前記RR PQIに応じて、前記ディスプレイコンポーネントへの前記計算された1つ又は複数の臨床警告の前記出力を抑制するようにプログラムされている、
患者モニタリングデバイスであって、前記etCO 2 PQIは、(1)ベースラインを上回る前記ヒストグラムの部分の測定基準、(2)前記ヒストグラムの上方領域内の最大CO 2 と最高のヒストグラムカウントを有するCO 2 レベルとの間の差の測定基準、(3)前記上方領域のカウントと中間領域のカウントとを比較する測定基準、(4)前記上方領域内の総カウントの割合の測定基準、及び(5)CO 2 立ち下がり時間の測定基準を含むパラメータから計算される、患者モニタリングデバイス。 A capnograph device that measures a capnogram for use in monitoring a patient's breathing gas, said capnogram being carbon dioxide (CO) acquired over a given time interval that includes the breathing of multiple patients. 2 ) includes a histogram of the sample count of carbon dioxide (CO 2 ) per range of pressure or concentration values, the histogram is updated periodically, and the capnograph device further (i) from the histogram . The exhaled carbon dioxide (etCO 2 ) was determined and (ii) the etCO 2 parameter quality index (etCO 2 PQI) was calculated using one or more quantitative capnogram waveform metrics calculated from said capnogram. (Iii) With a capnograph device that determines the respiratory rate (RR) value from the capnogram and (iv) calculates the RR parameter quality index (RR PQI) using both the RR value and the etCO 2 PQI. ,
A pulse oximeter for measuring arterial oxygen saturation (SpO 2 ) of the patient,
It ’s an electronic processor,
A capnographic index indicating patient health is generated from the capnography measured by the capnography device, and the capnography index is calculated based in part on the etCO 2 PQI and the RR PQI.
An arterial oxygen saturation (SpO 2 ) index, which indicates the patient's health status, is generated from the SpO 2 measured by the pulse oximeter.
A patient safety index (PSI) is calculated from the capnography index and the SpO 2 index, and each time the capnography device updates the calculated histogram, the capnography index is regenerated and the etCO 2 PQI and the said. RR PQI is recalculated
With an electronic processor programmed to calculate one or more clinical warnings that are determined at least in part based on the patient safety index.
A patient monitoring device comprising a display component displaying at least one of the calculated clinical alerts.
The electronic processor further outputs (i) one or more calculated clinical warnings to the display component in response to the patient safety index below the PSI threshold, and (ii) the patient below the PSI threshold. To suppress the output of the calculated one or more clinical warnings to the display component in response to the capnography index, the etCO 2 PQI or the RR PQI, which is a safety index and below a given index threshold. Programmed,
A patient monitoring device , the etCO 2 PQI is a CO 2 having (1) a metric of portion of the histogram above the baseline, (2) maximum CO 2 in the upper region of the histogram and highest histogram count. A measure of the difference between the levels, (3) a measure of comparing the count in the upper region with the count in the middle region, (4) a measure of the percentage of the total count in the upper region, and (5). A patient monitoring device calculated from parameters including a measure of CO 2 fall time.
前記カプノグラフィ指標から計算される前記患者安全指標の成分と、前記SpO2指標から計算される前記患者安全指標の成分とを比較することによって、前記カプノグラフィ指標又は前記SpO2指標がより緊急の臨床警告を示すかを決定することと、
前記カプノグラフィ指標が前記SpO2指標より緊急の臨床警告を示す場合、前記カプノグラムを使用して前記臨床警告を計算することと、
前記SpO2指標が前記カプノグラフィ指標より緊急の臨床警告を示す場合、前記SpO2を使用して前記臨床警告を計算することと
を含む動作によって計算される、請求項1から8のいずれか一項に記載の患者モニタリングデバイス。 The one or more clinical warnings mentioned above
By comparing the component of the patient safety index calculated from the capnography index with the component of the patient safety index calculated from the SpO 2 index, the capnography index or the SpO 2 index is a more urgent clinical warning. To decide whether to show
If the capnography index indicates an urgent clinical warning than the SpO 2 index, the capnography can be used to calculate the clinical warning.
One of claims 1-8, which is calculated by an operation comprising calculating the clinical warning using the SpO 2 when the SpO 2 index indicates an urgent clinical warning than the capnography index. The patient monitoring device described in.
カプノグラフデバイスによって測定されるカプノグラムから患者健康状態を示すカプノグラフィ指標を生成することであって、前記カプノグラムは患者の呼吸気体をモニタリングする際に使用するためであり、前記カプノグラムは、複数の患者の呼吸を包含する所与の時間間隔にわたって取得された二酸化炭素(CO2)の分圧値又は濃度値の範囲毎の二酸化炭素(CO 2 )のサンプルカウントのヒストグラムを含み、前記ヒストグラムは定期的に更新され、前記カプノグラフデバイスはさらに、(i)前記ヒストグラムから呼気終末二酸化炭素(etCO2)を決定し、(ii)前記カプノグラムから計算された1つ又は複数の定量的カプノグラム波形測定基準を使用してetCO2パラメータ品質指標(etCO2 PQI)を計算し、(iii)前記カプノグラムから呼吸速度(RR)値を決定し、(iv)前記RR値及び前記etCO2 PQIの両方を使用してRRパラメータ品質指標(RR PQI)を計算し、前記カプノグラフィ指標は、前記etCO2 PQI及び前記RR PQIに部分的に基づいて計算される、前記カプノグラフィ指標を生成することと、
患者健康状態を示す前記患者の動脈血酸素飽和度(SpO2)指標を、パルスオキシメータによって測定されるSpO2から生成することと、
前記カプノグラフィ指標及び前記SpO2指標から患者安全指標(PSI)を計算することであって、前記カプノグラフデバイスが前記計算されたヒストグラムを更新するたびに、前記カプノグラフィ指標は再生成され、前記etCO2 PQI及び前記RR PQIは再計算される、患者安全指標を計算することと、
前記患者安全指標に少なくとも部分的に基づいて決定される1つ又は複数の臨床警告を計算することと、
PSI閾値を下回る前記患者安全指標に応じて、計算された前記1つ又は複数の臨床警告のうちの少なくとも1つを表示するディスプレイコンポーネントに前記計算された1つ又は複数の臨床警告を出力し、前記PSI閾値を下回る前記患者安全指標且つ所与の指標閾値を下回る前記カプノグラフィ指標、前記etCO2 PQI又は前記RR PQIに応じて、前記ディスプレイコンポーネントへの前記計算された1つ又は複数の臨床警告の前記出力を抑制することと
を含む、非一時的記憶媒体であって、前記etCO 2 PQIは、(1)ベースラインを上回る前記ヒストグラムの部分の測定基準、(2)前記ヒストグラムの上方領域内の最大CO 2 と最高のヒストグラムカウントを有するCO 2 レベルとの間の差の測定基準、(3)前記上方領域のカウントと中間領域のカウントとを比較する測定基準、(4)前記上方領域内の総カウントの割合の測定基準、及び(5)CO 2 立ち下がり時間の測定基準を含むパラメータから計算される、非一時的記憶媒体。 A non-temporary storage medium that stores instructions that can be read and executed by an electronic processor to perform patient monitoring, said patient monitoring.
The capnography is to generate a capnographic index indicating the patient's health condition from the capnography measured by the capnography device, because the capnography is used for monitoring the respiratory gas of the patient, and the capnography is used for a plurality of patients. Includes a histogram of carbon dioxide (CO 2 ) sample counts per range of carbon dioxide (CO 2) voltage divisions or concentration values acquired over a given time interval, including respiration, said histogram is periodic. Updated to, the capnography device further (i) determines exhaled carbon dioxide (etCO 2 ) from the histogram and (ii) one or more quantitative capnogram waveform metrics calculated from the capnography. To calculate the etCO 2 parameter quality index (etCO 2 PQI) using, (iii) determine the respiratory rate (RR) value from the capnography, and (iv) use both the RR value and the etCO 2 PQI. To generate the capnography index, which is calculated based in part on the etCO 2 PQI and the RR PQI.
Generating the patient's arterial oxygen saturation (SpO 2 ) index, which indicates the patient's health status, from SpO 2 measured by a pulse oximeter,
By calculating a patient safety index (PSI) from the capnography index and the SpO 2 index, the capnography index is regenerated and the etCO each time the capnography device updates the calculated histogram. 2 PQI and the RR PQI are recalculated, calculating the patient safety index and
To calculate one or more clinical warnings that are at least partially based on the patient safety indicators.
Output the calculated clinical warning to a display component that displays at least one of the calculated clinical warnings in response to the patient safety index below the PSI threshold. The calculated clinical warning to the display component, depending on the patient safety index below the PSI threshold and the capnography index below the given index threshold, the etCO 2 PQI or the RR PQI. A non-temporary storage medium comprising suppressing the output, the etCO 2 PQI is (1) a metric of portion of the histogram above the baseline, (2) within the region above the histogram. A measure of the difference between the maximum CO 2 and the CO 2 level with the highest histogram count , (3) a measure comparing the count in the upper region with the count in the middle region, (4) within the upper region. A non-temporary storage medium calculated from parameters including a measure of the percentage of total count and (5) a measure of CO 2 fall time .
受信される吸気酸素濃度比(FiO2)に基づいて酸素補給が使用されているか否かを識別すること
をさらに含む、請求項16に記載の非一時的記憶媒体。 The patient monitoring performed is
16. The non-temporary storage medium of claim 16, further comprising identifying whether or not oxygen supplementation is being used based on the received inspired oxygen concentration ratio (FiO 2 ).
前記カプノグラフィ指標及び前記SpO2指標の前記患者安全指標に対する相対的寄与を比較することによってより緊急の成分を決定することを含む動作によって計算され、前記臨床警告は、前記より緊急の成分のデータを使用して計算される、請求項12から18のいずれか一項に記載の非一時的記憶媒体。 The one or more clinical warnings mentioned above
Calculated by actions including determining the more urgent component by comparing the relative contributions of the capnography index and the SpO 2 index to the patient safety index, the clinical warning is the data of the more urgent component. The non-temporary storage medium according to any one of claims 12 to 18, which is calculated using the non-temporary storage medium.
パルスオキシメータを使用して前記患者の動脈血酸素飽和度(SpO2)を測定するステップと、
電子プロセッサを介して、前記カプノグラムから患者健康状態を示すカプノグラフィ指標を生成し、前記カプノグラフィ指標は、前記etCO2 PQI及び前記RR PQIに部分的に基づいて計算され、前記SpO2から患者健康状態を示すSpO2指標を生成し、前記カプノグラフィ指標及び前記SpO2指標から患者安全指標(PSI)を計算し、前記カプノグラフデバイスが前記計算されたヒストグラムを更新するたびに、前記カプノグラフィ指標は再生成され、前記etCO2 PQI及び前記RR PQIは再計算されるステップと、
前記電子プロセッサを介して、前記患者安全指標に少なくとも部分的に基づいて決定される1つ又は複数の臨床警告を計算するステップと、
前記電子プロセッサを介して、PSI閾値を下回る前記患者安全指標に応じて、計算された前記1つ又は複数の臨床警告のうちの少なくとも1つを表示するディスプレイコンポーネントに前記計算された1つ又は複数の臨床警告を出力し、前記PSI閾値を下回る前記患者安全指標且つ所与の指標閾値を下回る前記カプノグラフィ指標、前記etCO2 PQI又は前記RR PQIに応じて、前記ディスプレイコンポーネントへの前記計算された1つ又は複数の臨床警告の前記出力を抑制するステップと
を含む、患者モニタリング方法であって、前記etCO 2 PQIは、(1)ベースラインを上回る前記ヒストグラムの部分の測定基準、(2)前記ヒストグラムの上方領域内の最大CO 2 と最高のヒストグラムカウントを有するCO 2 レベルとの間の差の測定基準、(3)前記上方領域のカウントと中間領域のカウントとを比較する測定基準、(4)前記上方領域内の総カウントの割合の測定基準、及び(5)CO 2 立ち下がり時間の測定基準を含むパラメータから計算される、患者モニタリング方法。 A capnograph device is used to measure capnograms, said capnograms for use in monitoring a patient's breathing gas, said capnograms acquired over a given time interval that includes the breathing of multiple patients. Includes a histogram of carbon dioxide (CO 2 ) sample counts per range of pressure or concentration values of carbon dioxide (CO 2 ), the histogram is updated periodically, and the capnograph device further. (I) The exhaled carbon dioxide (etCO 2 ) is determined from the histogram and (ii) the etCO 2 parameter quality index (etCO 2 ) using one or more quantitative capnogram waveform metrics calculated from the capnogram. PQI) is calculated, (iii) the respiratory rate (RR) value is determined from the capnogram, and (iv) the RR parameter quality index (RR PQI) is calculated using both the RR value and the etCO 2 PQI. Steps and
The step of measuring the arterial oxygen saturation (SpO 2 ) of the patient using a pulse oximeter, and
A capnography index indicating the patient's health condition is generated from the capnography via an electronic processor, and the capnography index is calculated based in part on the etCO 2 PQI and the RR PQI, and the patient's health condition is calculated from the SpO 2 . The indicated SpO 2 index is generated, the patient safety index (PSI) is calculated from the capnography index and the SpO 2 index, and the capnography index is regenerated each time the capnography device updates the calculated histogram. Then, the etCO 2 PQI and the RR PQI are recalculated in the step.
Through the electronic processor, a step of calculating one or more clinical warnings that are determined at least in part based on the patient safety index.
The calculated one or more to the display component displaying at least one of the calculated clinical warnings, depending on the patient safety index below the PSI threshold, via the electronic processor. The calculated 1 to the display component according to the patient safety index below the PSI threshold and the capnography index below the given index threshold, the etCO 2 PQI or the RR PQI. A patient monitoring method comprising the step of suppressing the output of one or more clinical warnings , wherein the etCO 2 PQI is (1) a metric of portion of the histogram above the baseline, (2) the histogram. Criteria for the difference between the maximum CO 2 in the upper region and the CO 2 level with the highest histogram count , (3) Criteria for comparing the counts in the upper region with the counts in the middle region, (4). A patient monitoring method calculated from parameters including a measure of the percentage of total count in the upper region and (5) a measure of CO 2 fall time .
前記SpO2指標は、下限閾SpO2値以下のSpO2の値に対する最小値を有する単調関数であって、上限閾SpO2値以上のSpO2の値に対する最大値まで単調に増大する単調関数を使用して生成される、請求項20に記載の患者モニタリング方法。 The capnography index is generated from information derived from the capnography, including at least carbon dioxide concentration or partial pressure and respiratory rate information.
The SpO 2 index is a monotonic function having a minimum value for a SpO 2 value equal to or lower than the lower limit SpO 2 value, and is a monotonic function that monotonically increases up to a maximum value for a SpO 2 value having an upper limit SpO 2 value or more. 20. The patient monitoring method of claim 20, generated using.
前記患者安全指標は、前記カプノグラフィ指標及び前記SpO2指標の加重和として計算される、請求項21に記載の患者モニタリング方法。
The minimum value of the monotonic function is less than zero, and the maximum value of the monotonic function is greater than zero.
The patient monitoring method according to claim 21, wherein the patient safety index is calculated as a weighted sum of the capnography index and the SpO 2 index.
Applications Claiming Priority (3)
| Application Number | Priority Date | Filing Date | Title |
|---|---|---|---|
| US201762446608P | 2017-01-16 | 2017-01-16 | |
| US62/446,608 | 2017-01-16 | ||
| PCT/EP2018/050799 WO2018130673A1 (en) | 2017-01-16 | 2018-01-15 | Physiologic monitoring decision support system combining capnometry and oxygen saturation |
Publications (3)
| Publication Number | Publication Date |
|---|---|
| JP2020513934A JP2020513934A (en) | 2020-05-21 |
| JP2020513934A5 JP2020513934A5 (en) | 2021-02-25 |
| JP7030819B2 true JP7030819B2 (en) | 2022-03-07 |
Family
ID=61024747
Family Applications (1)
| Application Number | Title | Priority Date | Filing Date |
|---|---|---|---|
| JP2019537827A Active JP7030819B2 (en) | 2017-01-16 | 2018-01-15 | Physiological monitoring judgment support system that combines capnometry and oxygen saturation |
Country Status (5)
| Country | Link |
|---|---|
| US (1) | US20190365281A1 (en) |
| EP (1) | EP3568062A1 (en) |
| JP (1) | JP7030819B2 (en) |
| CN (1) | CN110430804A (en) |
| WO (1) | WO2018130673A1 (en) |
Cited By (1)
| Publication number | Priority date | Publication date | Assignee | Title |
|---|---|---|---|---|
| KR20160017953A (en) * | 2014-08-07 | 2016-02-17 | 삼성전자주식회사 | A driving module, a motion assist apparatus comprising the driving module and a control method of the motion assist apparatus |
Families Citing this family (6)
| Publication number | Priority date | Publication date | Assignee | Title |
|---|---|---|---|---|
| US10589045B2 (en) * | 2016-10-12 | 2020-03-17 | Board Of Regents Of The University Of Texas System | Smart oxygenation system employing automatic control using SpO2-to-FiO2 ratio |
| US11510591B2 (en) * | 2018-07-11 | 2022-11-29 | Oridion Medical 1987 Ltd. | Capnography systems with indicator lights |
| CN111248877A (en) * | 2020-04-18 | 2020-06-09 | 赵宏杰 | Myocardial infarction early warning system |
| TWI788743B (en) * | 2020-12-16 | 2023-01-01 | 奇美醫療財團法人奇美醫院 | Ventilator-weaning timing prediction system, program product thereof and method for building and using the same |
| CN112697702B (en) * | 2020-12-31 | 2023-01-31 | 西北农林科技大学 | CO based on density distribution characteristics 2 Range finding method |
| JP7158641B1 (en) * | 2022-03-14 | 2022-10-24 | ヘルスセンシング株式会社 | Apnea hypopnea index estimation device, method and program |
Citations (6)
| Publication number | Priority date | Publication date | Assignee | Title |
|---|---|---|---|---|
| JP2005508677A (en) | 2001-08-31 | 2005-04-07 | ドレーガー メディカル システムズ インコーポレイテッド | Patient monitor, alarm processing system, and user interface |
| JP2011505177A (en) | 2007-11-13 | 2011-02-24 | オリディオン・メディカル・1987・リミテッド | Medical system, apparatus and method |
| JP2012531246A (en) | 2009-06-24 | 2012-12-10 | オリディオン メディカル 1987 リミテッド | Integrated lung index for withdrawal from artificial respiration |
| JP2013533021A (en) | 2010-06-23 | 2013-08-22 | オリディオン メディカル 1987 リミテッド | Method and system for sleep disorder analysis |
| JP2015506189A (en) | 2011-12-23 | 2015-03-02 | コーニンクレッカ フィリップス エヌ ヴェ | Method and apparatus for monitoring and controlling pressure assist devices |
| WO2016108121A1 (en) | 2014-12-31 | 2016-07-07 | Koninklijke Philips N.V. | System for performing histogram analysis of the time-based capnography signals and method of operation thereof |
Family Cites Families (12)
| Publication number | Priority date | Publication date | Assignee | Title |
|---|---|---|---|---|
| US20130060110A1 (en) * | 1997-01-27 | 2013-03-07 | Lawrence A. Lynn | System and method for automatic detection of a plurality of spo2 time series pattern types |
| US9042952B2 (en) * | 1997-01-27 | 2015-05-26 | Lawrence A. Lynn | System and method for automatic detection of a plurality of SPO2 time series pattern types |
| DE60239835D1 (en) * | 2001-12-06 | 2011-06-01 | Carefusion 303 Inc | Infusion device with CO2 monitoring |
| US8715193B2 (en) * | 2005-03-24 | 2014-05-06 | General Electric Company | Determination of the clinical state of a subject |
| JP2007117591A (en) * | 2005-10-31 | 2007-05-17 | Konica Minolta Sensing Inc | Pulse wave analyzer |
| US9533113B2 (en) * | 2007-01-04 | 2017-01-03 | Oridion Medical 1987 Ltd. | Integrated pulmonary index for weaning from mechanical ventilation |
| EP3493216A1 (en) | 2007-11-13 | 2019-06-05 | Oridion Medical 1987 Ltd. | Medical system, apparatus and method |
| US20140073964A1 (en) * | 2012-09-11 | 2014-03-13 | Nellcor Puritan Bennett Llc | Methods and systems for determining algorithm settings based on classification information |
| RU2659140C2 (en) * | 2012-09-28 | 2018-06-28 | Конинклейке Филипс Н.В. | System and method for assessment of patient health based on recovery responses from oxygen desaturation |
| US20140288440A1 (en) * | 2013-03-22 | 2014-09-25 | Children's Medical Center Corporation | Systems and methods for quantitative capnogram analysis |
| JP6422653B2 (en) * | 2014-01-24 | 2018-11-14 | 日本光電工業株式会社 | Monitoring device |
| WO2016108127A1 (en) | 2014-12-30 | 2016-07-07 | Koninklijke Philips N.V. | Capnometry system with supplemental oxygen detection and method of operation thereof |
-
2018
- 2018-01-15 WO PCT/EP2018/050799 patent/WO2018130673A1/en active Application Filing
- 2018-01-15 CN CN201880018303.2A patent/CN110430804A/en active Pending
- 2018-01-15 JP JP2019537827A patent/JP7030819B2/en active Active
- 2018-01-15 US US16/478,046 patent/US20190365281A1/en not_active Abandoned
- 2018-01-15 EP EP18701283.6A patent/EP3568062A1/en not_active Withdrawn
Patent Citations (6)
| Publication number | Priority date | Publication date | Assignee | Title |
|---|---|---|---|---|
| JP2005508677A (en) | 2001-08-31 | 2005-04-07 | ドレーガー メディカル システムズ インコーポレイテッド | Patient monitor, alarm processing system, and user interface |
| JP2011505177A (en) | 2007-11-13 | 2011-02-24 | オリディオン・メディカル・1987・リミテッド | Medical system, apparatus and method |
| JP2012531246A (en) | 2009-06-24 | 2012-12-10 | オリディオン メディカル 1987 リミテッド | Integrated lung index for withdrawal from artificial respiration |
| JP2013533021A (en) | 2010-06-23 | 2013-08-22 | オリディオン メディカル 1987 リミテッド | Method and system for sleep disorder analysis |
| JP2015506189A (en) | 2011-12-23 | 2015-03-02 | コーニンクレッカ フィリップス エヌ ヴェ | Method and apparatus for monitoring and controlling pressure assist devices |
| WO2016108121A1 (en) | 2014-12-31 | 2016-07-07 | Koninklijke Philips N.V. | System for performing histogram analysis of the time-based capnography signals and method of operation thereof |
Cited By (2)
| Publication number | Priority date | Publication date | Assignee | Title |
|---|---|---|---|---|
| KR20160017953A (en) * | 2014-08-07 | 2016-02-17 | 삼성전자주식회사 | A driving module, a motion assist apparatus comprising the driving module and a control method of the motion assist apparatus |
| KR102125078B1 (en) * | 2014-08-07 | 2020-06-19 | 삼성전자주식회사 | A driving module, a motion assist apparatus comprising the driving module and a control method of the motion assist apparatus |
Also Published As
| Publication number | Publication date |
|---|---|
| EP3568062A1 (en) | 2019-11-20 |
| WO2018130673A1 (en) | 2018-07-19 |
| US20190365281A1 (en) | 2019-12-05 |
| JP2020513934A (en) | 2020-05-21 |
| CN110430804A (en) | 2019-11-08 |
Similar Documents
| Publication | Publication Date | Title |
|---|---|---|
| JP7030819B2 (en) | Physiological monitoring judgment support system that combines capnometry and oxygen saturation | |
| EP2217141B1 (en) | Medical apparatus | |
| US9974479B2 (en) | Monitoring asthma and other respiratory disorders with calibrated photoplethysmography devices and methods of using the same | |
| JP6960929B2 (en) | Enhanced respiratory parameter estimation and out-of-tune detection algorithms through the use of central venous pressure manometry | |
| US9848820B2 (en) | Apnea analysis system and method | |
| JP5887057B2 (en) | Device for measuring and predicting patient respiratory stability | |
| EP2229641B1 (en) | Medical system, apparatus and method | |
| Williams et al. | A comparison of measurements of change in respiratory status in spontaneously breathing volunteers by the exspiron noninvasive respiratory volume monitor versus the capnostream capnometer | |
| US20160045154A1 (en) | Sleep apnea | |
| JP6615317B2 (en) | Capnography with decision support system architecture | |
| CN108024758B (en) | Simplified display of end-tidal CO2 | |
| WO2024032811A1 (en) | Life information processing system and life information processing method | |
| US20160150997A1 (en) | Method, device and system for determining and utilizing etco2 to paco2 gradient | |
| US11844610B2 (en) | System and method for monitoring gas exchange | |
| JP6639185B2 (en) | Pulse wave analyzer | |
| Hess et al. | Respiratory monitoring | |
| Leibowitz et al. | Respiratory Monitoring in Low-Intensity Settings |
Legal Events
| Date | Code | Title | Description |
|---|---|---|---|
| A521 | Request for written amendment filed |
Free format text: JAPANESE INTERMEDIATE CODE: A523 Effective date: 20210113 |
|
| A621 | Written request for application examination |
Free format text: JAPANESE INTERMEDIATE CODE: A621 Effective date: 20210113 |
|
| A977 | Report on retrieval |
Free format text: JAPANESE INTERMEDIATE CODE: A971007 Effective date: 20211015 |
|
| A131 | Notification of reasons for refusal |
Free format text: JAPANESE INTERMEDIATE CODE: A131 Effective date: 20211029 |
|
| A521 | Request for written amendment filed |
Free format text: JAPANESE INTERMEDIATE CODE: A523 Effective date: 20220112 |
|
| TRDD | Decision of grant or rejection written | ||
| A01 | Written decision to grant a patent or to grant a registration (utility model) |
Free format text: JAPANESE INTERMEDIATE CODE: A01 Effective date: 20220128 |
|
| A61 | First payment of annual fees (during grant procedure) |
Free format text: JAPANESE INTERMEDIATE CODE: A61 Effective date: 20220222 |
|
| R150 | Certificate of patent or registration of utility model |
Ref document number: 7030819 Country of ref document: JP Free format text: JAPANESE INTERMEDIATE CODE: R150 |