JP7020962B2 - Measurement correction device and measurement correction method - Google Patents
Measurement correction device and measurement correction method Download PDFInfo
- Publication number
- JP7020962B2 JP7020962B2 JP2018031380A JP2018031380A JP7020962B2 JP 7020962 B2 JP7020962 B2 JP 7020962B2 JP 2018031380 A JP2018031380 A JP 2018031380A JP 2018031380 A JP2018031380 A JP 2018031380A JP 7020962 B2 JP7020962 B2 JP 7020962B2
- Authority
- JP
- Japan
- Prior art keywords
- measurement
- unit
- amount
- voltage drop
- apparent
- Prior art date
- Legal status (The legal status is an assumption and is not a legal conclusion. Google has not performed a legal analysis and makes no representation as to the accuracy of the status listed.)
- Active
Links
Images


Classifications
-
- Y—GENERAL TAGGING OF NEW TECHNOLOGICAL DEVELOPMENTS; GENERAL TAGGING OF CROSS-SECTIONAL TECHNOLOGIES SPANNING OVER SEVERAL SECTIONS OF THE IPC; TECHNICAL SUBJECTS COVERED BY FORMER USPC CROSS-REFERENCE ART COLLECTIONS [XRACs] AND DIGESTS
- Y02—TECHNOLOGIES OR APPLICATIONS FOR MITIGATION OR ADAPTATION AGAINST CLIMATE CHANGE
- Y02E—REDUCTION OF GREENHOUSE GAS [GHG] EMISSIONS, RELATED TO ENERGY GENERATION, TRANSMISSION OR DISTRIBUTION
- Y02E10/00—Energy generation through renewable energy sources
- Y02E10/50—Photovoltaic [PV] energy
- Y02E10/56—Power conversion systems, e.g. maximum power point trackers
-
- Y—GENERAL TAGGING OF NEW TECHNOLOGICAL DEVELOPMENTS; GENERAL TAGGING OF CROSS-SECTIONAL TECHNOLOGIES SPANNING OVER SEVERAL SECTIONS OF THE IPC; TECHNICAL SUBJECTS COVERED BY FORMER USPC CROSS-REFERENCE ART COLLECTIONS [XRACs] AND DIGESTS
- Y02—TECHNOLOGIES OR APPLICATIONS FOR MITIGATION OR ADAPTATION AGAINST CLIMATE CHANGE
- Y02E—REDUCTION OF GREENHOUSE GAS [GHG] EMISSIONS, RELATED TO ENERGY GENERATION, TRANSMISSION OR DISTRIBUTION
- Y02E40/00—Technologies for an efficient electrical power generation, transmission or distribution
- Y02E40/70—Smart grids as climate change mitigation technology in the energy generation sector
-
- Y—GENERAL TAGGING OF NEW TECHNOLOGICAL DEVELOPMENTS; GENERAL TAGGING OF CROSS-SECTIONAL TECHNOLOGIES SPANNING OVER SEVERAL SECTIONS OF THE IPC; TECHNICAL SUBJECTS COVERED BY FORMER USPC CROSS-REFERENCE ART COLLECTIONS [XRACs] AND DIGESTS
- Y04—INFORMATION OR COMMUNICATION TECHNOLOGIES HAVING AN IMPACT ON OTHER TECHNOLOGY AREAS
- Y04S—SYSTEMS INTEGRATING TECHNOLOGIES RELATED TO POWER NETWORK OPERATION, COMMUNICATION OR INFORMATION TECHNOLOGIES FOR IMPROVING THE ELECTRICAL POWER GENERATION, TRANSMISSION, DISTRIBUTION, MANAGEMENT OR USAGE, i.e. SMART GRIDS
- Y04S10/00—Systems supporting electrical power generation, transmission or distribution
- Y04S10/12—Monitoring or controlling equipment for energy generation units, e.g. distributed energy generation [DER] or load-side generation
- Y04S10/123—Monitoring or controlling equipment for energy generation units, e.g. distributed energy generation [DER] or load-side generation the energy generation units being or involving renewable energy sources
Description
本発明は、計測補正装置及び計測補正方法に関し、特に、電力系統の計測値を補正する計測補正装置に適用して好適なものである。 The present invention relates to a measurement correction device and a measurement correction method, and is particularly suitable for application to a measurement correction device that corrects a measured value of an electric power system.
従来より、電力系統、特に配電系統に分散配置される複数の開閉器での計測を同様なタイミングで同期しながら実施する技術が存在している(特許文献1参照)。 Conventionally, there has been a technique for performing measurement in a power system, particularly a plurality of switches distributed and arranged in a power distribution system, while synchronizing at the same timing (see Patent Document 1).
上述した従来技術では、同期信号を発生させて電力線に重畳させる装置または電力線に重畳した同期信号を受信する装置を用いているため、前述した同期機能に関連する装置を追加する必要があった。従って、現在一般的に使用されている機器(以下「現有機器」という)をそのまま用いることはできない。一方、多くの現有機器を更新するまでには相当の長期の年月を要することもあり、即応性のある手段が望まれていた。 In the above-mentioned prior art, since a device for generating a synchronization signal and superimposing it on the power line or a device for receiving the synchronization signal superimposed on the power line is used, it is necessary to add a device related to the above-mentioned synchronization function. Therefore, the equipment currently generally used (hereinafter referred to as "current organic device") cannot be used as it is. On the other hand, it may take a considerable long time to renew many of the current organic devices, and a responsive means has been desired.
本発明は以上の点を考慮してなされたもので、電力系統の現有機器に対してハードウェアやソフトウェアを追加することなく計測時間のずれに起因する測定誤差を軽減させる補正を実施することができる計測補正装置及び計測補正方法を提案しようとするものである。 The present invention has been made in consideration of the above points, and it is possible to carry out a correction for reducing the measurement error due to the deviation of the measurement time without adding hardware or software to the current organic device of the power system. We are trying to propose a measurement correction device and a measurement correction method that can be performed.
かかる課題を解決するため、本発明においては、電力系統の特定箇所で皮相電流又は皮相電力に換算しうる電気量を相対的に短い周期で計測する第1の計測部と、前記皮相電流の変化に対する電圧降下の変化量の違いを検出する検出部と、前記電圧降下の変化量の違いに応じて前記特定箇所の配下における所定箇所で相対的に長い周期で計測する第2の計測部と、前記第2の計測部によって計測した値を、前記相対的に長い周期以下の分解能で計測した値に近似する方式を切り替える算出方式切替部と、前記算出方式切替部で用いた相関の有無の判定に基づいて前記第2の計測部によって計測した値を補正する補正部と、を備えることを特徴とする。 In order to solve such a problem, in the present invention, a first measuring unit that measures an apparent current or an amount of electricity that can be converted into an apparent power at a specific location in the power system in a relatively short cycle, and a change in the apparent current. A detection unit that detects the difference in the amount of change in the voltage drop with respect to the above, and a second measurement unit that measures in a relatively long cycle at a predetermined location under the specific location according to the difference in the amount of change in the voltage drop. Determination of the presence or absence of correlation used in the calculation method switching unit and the calculation method switching unit that switches the method that approximates the value measured by the second measurement unit to the value measured with a resolution of relatively long period or less. It is characterized by including a correction unit for correcting the value measured by the second measurement unit based on the above.
また、本発明においては、電力系統の特定箇所で皮相電流又は皮相電力に換算しうる電気量を相対的に短い周期で計測する第1の計測ステップと、前記皮相電流の変化に対する電圧降下の変化量の違いを検出する検出ステップと、前記電圧降下の変化量の違いに応じて前記特定箇所の配下における所定箇所で相対的に長い周期で計測する第2の計測ステップと、前記第2の計測ステップにおいて計測した値を、前記相対的に長い周期以下の分解能で計測した値に近似する方式を切り替える算出方式切替ステップと、前記算出方式切替ステップにおいて切り替えた方法を用いて前記第2の計測部によって計測した値を補正する補正ステップと、を有することを特徴とする。 Further, in the present invention, the first measurement step of measuring the apparent current or the amount of electricity that can be converted into the apparent power at a specific point of the power system in a relatively short cycle, and the change of the voltage drop with respect to the change of the apparent current. A detection step for detecting a difference in quantity, a second measurement step for measuring at a predetermined location under the specific location in a relatively long cycle according to the difference in the amount of change in the voltage drop, and the second measurement. The second measurement unit using the calculation method switching step of switching the method of switching the method of approximating the value measured in the step to the value measured with the resolution of the relatively long cycle or less and the method switched in the calculation method switching step. It is characterized by having a correction step for correcting the value measured by.
本発明によれば、電力系統の現有機器に対してハードウェアやソフトウェアを追加することなく計測時間のずれに起因する測定誤差を軽減させる補正を実施することができる。 According to the present invention, it is possible to carry out a correction for reducing the measurement error due to the deviation of the measurement time without adding hardware or software to the current organic device of the power system.
以下、図面について、本発明の一実施の形態について詳述する。
(1)本実施の形態によるシステムの構成
図1は、本実施の形態に係る計測補正装置が適用された電力系統の構成例を示す図である。電力系統の主要な流れとしては、発電所101にて発電された電力は、送電線104を経由し、いくつかの電圧階級の配電用変電所102を経て配電線105に送電される。このうち、一部の開閉器200等により、電気量を計測している。さらに電力系統には、大口需要家106及び小口需要家107などの負荷、及び太陽光発電(Photovoltaic Power)装置(以下「PV」とも略す)110などの分散電源が連系されている。
Hereinafter, embodiments of the present invention will be described in detail with reference to the drawings.
(1) Configuration of the system according to the present embodiment FIG. 1 is a diagram showing a configuration example of a power system to which the measurement correction device according to the present embodiment is applied. As a main flow of the power system, the electric power generated in the
図2は、電力系統の電気量の計測値の流れの一例を示すシーケンスチャートである。変電所設置計測装置210は、配電用変電所102の送り出し点を含め、配電系統の電気量の計測結果を収集している。同様に変電所設置計測装置210は、変電所送り出し点の計測データを短周期で計測する計測処理211を実施している。一方、例えば電柱に各々設置されている開閉器2001,2002,……,200nからの計測データは、通信線等を経由して長周期で収集している。
FIG. 2 is a sequence chart showing an example of a flow of measured values of electric energy in an electric power system. The substation installation measuring
(2)データ収集のタイミングについて、
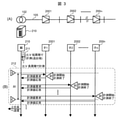
図3は、図2に示す系統図、及び、データ収集のタイミングを系列的に表したタイミングチャートである。図3(A)は、図2に示す系統図を表しており、図3(B)は、計測データの収集に関連するシーケンスチャートを表している。
(2) Regarding the timing of data collection
FIG. 3 is a system diagram shown in FIG. 2 and a timing chart serially showing the timing of data collection. FIG. 3 (A) represents the system diagram shown in FIG. 2, and FIG. 3 (B) represents a sequence chart related to the collection of measurement data.
図3(B)では、通信上の役割に応じ、変電所設置計測装置210を「親(「親局」とも呼ぶ)」と定義する一方、前述した開閉器(の子局)200を「子(「子局」とも呼ぶ)」と定義している。ここで、親局210側では、変電所送り出し点での電気量を、短周期で計測、収集している。なお、以下の説明では、複数の子局200が登場する場合、各子局200同士を区別するため、第1の子局には2001という符号を付与し、第2の子局には2002という符号を付与し、第nの子局には200nという符号を付与する場合がある。なお、これら各子局2001,2002,・・・,200nは、各図面上、それぞれ、「子1」、「子2」、・・・、「子n」と省略して図示するものとする。
In FIG. 3B, the substation
短周期とは、例えば、秒単位等の短い周期を指す。上記計測を短周期で行えるのは、自局内であり、通信の負担が無いか軽微であることによる。収集する電気量としては、例えば皮相電流(|I|)、電圧(V)などがある。有効電力(P)や無効電力(Q)の場合もありうるが、必ずしも全ての箇所で計測しているとは限らない。よって、最低限共通の電気量として、皮相電流(|I|)、電圧(V)、または両者のいずれかに換算(変換)しうる電気量とした。 The short cycle refers to a short cycle such as, for example, in seconds. The above measurement can be performed in a short cycle because it is within the own station and there is no or slight communication load. The amount of electricity to be collected includes, for example, an apparent current (| I |), a voltage (V), and the like. It may be active power (P) or active power (Q), but it is not always measured at all points. Therefore, as the minimum common electric energy, the electric energy that can be converted (converted) into either the apparent current (| I |), the voltage (V), or both is used.
(3)開閉器からの計測値の収集シーケンス
次に、開閉器200からの計測値の収集シーケンスについて説明する。開閉器200からの計測値の収集は、親局210から、各開閉器200(第1の子局2001、第2の子局2002,・・・,第nの子局200n)毎に、個別にポーリングを行うことで実施する。
(3) Sequence for collecting measured values from the switch Next, a sequence for collecting measured values from the
例えば、親局210は、第1の子局2001に対して計測値要求の電文を発行する。同電文を受信した第1の子局2001は、計測を実施するかまたは最新の計測値を応答電文として親局210に対して送信する。
For example, the
これにより、親局210は、上記一連の要求と応答のメッセージ交換を、対象の全ての子局2001,2002,・・・,200nに対して順次実施する。一般に、ある親局210の配下に入る子局の数は多数である。よって、最初の子局である第1の子局2001(図示の子1に相当)へのポーリング開始(図3に示す印S:計測開始の意)の時刻から、最後の子局である第nの子局200n(図示の子nに相当)へのポーリングの終了(図3に示す印E:終了の意)の時刻までは、ある程度幅をもった時間となる(子の時間をΔtと定義する)。
As a result, the
上述した計測時刻のずれは、子局にリアルタイムクロックまたはGPS(Global Positioning System)受信機などの同期機構を用いていなくても順次のポーリングを契機に計測する方式では、回避しがたい。 The above-mentioned deviation of the measurement time cannot be avoided by the method of measuring by sequential polling even if the slave station does not use a synchronization mechanism such as a real-time clock or a GPS (Global Positioning System) receiver.
図3(B)では、長周期の計測処理212を1サイクル分のみ記載したが、実際には、例えば1時間または15分の周期で複数サイクル繰り返している。親局210による短周期での計測処理211も同様で、秒単位などの周期で計測を繰り返す。以上の計測結果を、適宜、上位系の制御システムに送信する。
In FIG. 3B, the long-
次に、長周期での計測による計測時刻のずれが計測値に与える影響に関して、PV110との連系(以下「PV連系」という)が無い系統の場合と、PV連系のある系統の場合とに分けて説明する。 Next, regarding the effect of the deviation of the measurement time due to long-period measurement on the measured value, in the case of a system without interconnection with PV110 (hereinafter referred to as "PV interconnection") and in the case of a system with PV interconnection. It will be explained separately.
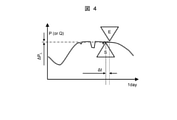
図4は、PV連系の無い場合の長周期の計測による計測値のずれを模式的に示す。図示の印Sは、親局210による長周期での計測の開始時刻を示しており、例えば、親局210が、最初である第1の子局2001へのポーリングを開始する時刻である。一方、図示の印Eは、親局210による長周期の計測の終了時刻を示しており、親局210が、最後である第nの子局200nへのポーリングが終了する時刻である。
FIG. 4 schematically shows the deviation of the measured values due to the long-period measurement when there is no PV interconnection. The mark S in the figure indicates the start time of the measurement by the
なお、説明を簡素化するため、親局210における計測値要求の送出から第2の子局2001,2002,・・・,200nでの計測値取得の時間差、及び、計測値応答の受信と第nの子局200nの計測との時間差は無視して図示している。
In order to simplify the explanation, the time difference between the transmission of the measurement value request in the
PV連系がない系統では、時間当たりの負荷の変動量は比較的小さい。そこで、印S及び印Eのタイミング差(Δt)での潮流値の変化量(ΔPL)は無視できる程度である。よって、比較例としてのPV110の導入以前の一般的な電力系統では、順次のポーリング方式で、測定時刻の差に起因する誤差は無視しうる程度であった。 In a system without PV interconnection, the amount of fluctuation in load per hour is relatively small. Therefore, the amount of change in the tidal current value ( ΔPL ) due to the timing difference (Δt) between the marks S and E is negligible. Therefore, in the general power system before the introduction of PV110 as a comparative example, the error caused by the difference in measurement time was negligible in the sequential polling method.
一方、図5は、本実施の形態においてPV連系がある場合の長周期の計測による計測値のずれを模式的に示す。図示の印S及び印Eは、それぞれ、前述したように長周期の計測に関する開始時刻及び終了時刻を示している。 On the other hand, FIG. 5 schematically shows the deviation of the measured values due to the long-period measurement when there is PV interconnection in the present embodiment. The marked S and E in the figure indicate the start time and the end time of the long-period measurement, respectively, as described above.
PV連系がある場合では、系統の定格値と比較しても有意に大きい幅で、潮流が変化する。これは、負荷の変動が、例えば始業時や正午前後等を除いて、時間的に分散して発生するのに対し、PV110の出力変動は、日射量に応じて、当該PV110の定格値と同程度の幅で変動するためである。 When there is PV interconnection, the tidal current changes in a range that is significantly larger than the rated value of the system. This is because the load fluctuations occur in a timely manner except at the start of work or after noon, whereas the output fluctuations of the PV110 are the same as the rated values of the PV110 according to the amount of solar radiation. This is because it fluctuates in a range of degrees.
従って、図5に示す印Sの時点での電気量の計測値と、Δtしか離れていないはずの印Eの時点での計測値とでも、大幅に異なる値となることもある。よって、長周期の計測周期内における計測値の差(ΔPPV)は、無視できない程度に大きくなる。なお、図4及び図5では、電気量の一例としてP,Qを用いたが、変動の大小という意味では、皮相電流(又は皮相電力)を用いても同様である。 Therefore, the measured value of the electric energy at the time of the mark S shown in FIG. 5 and the measured value at the time of the mark E, which should be separated by only Δt, may be significantly different. Therefore, the difference in measured values (ΔP PV ) within the long-period measurement cycle becomes so large that it cannot be ignored. In FIGS. 4 and 5, P and Q are used as an example of the amount of electricity, but in the sense of magnitude of fluctuation, the same applies to the use of apparent current (or apparent power).
図6(A)は、図2及び図3(A)に示す系統図に対応しており、図6(B)及び図6(C)は、それぞれ、長周期の計測時間内での時刻のずれに起因する計測値のずれの分布を模式的に示す。図示の例では、計測する電気量の一例として、変電所送り出し点からの電圧降下量Vdを用いている。 6 (A) corresponds to the system diagram shown in FIGS. 2 and 3 (A), and FIGS. 6 (B) and 6 (C) show the times within the long-period measurement time, respectively. The distribution of the deviation of the measured value due to the deviation is schematically shown. In the illustrated example, the voltage drop amount Vd from the substation sending point is used as an example of the amount of electricity to be measured.
図示の例では、同一の測定周期内(Δt内)における計測値のずれを示している。図6(B)は、PV連系が無い場合の一例を示すとともに、図6(C)は、PV連系がある場合の一例を示す。 In the illustrated example, the deviation of the measured values within the same measurement cycle (within Δt) is shown. FIG. 6B shows an example in the case where there is no PV interconnection, and FIG. 6C shows an example in the case where there is PV interconnection.
図6(B)では(PV連系が無い場合)、計測時刻が最大Δtずれている各計測値間での差は無視できる程度である。一方、図6(C)では(PV連系がある場合)、計測時刻のずれによる計測値のずれが相対的に大きくなる。図6(B)及び図6(C)では、縦軸が電圧降下量Vdを示しており、横軸が配電用変電所102からの距離を示している。
In FIG. 6B (when there is no PV interconnection), the difference between the measured values whose measurement times are shifted by the maximum Δt is negligible. On the other hand, in FIG. 6C (when there is PV interconnection), the deviation of the measured value due to the deviation of the measurement time becomes relatively large. In FIGS. 6B and 6C, the vertical axis indicates the voltage drop amount Vd, and the horizontal axis indicates the distance from the
これは、開閉器200毎に、図示した様にばらつく計測値のいずれかの値となることを示している。よって、PV連系系統での計測値は、同一の計測周期における計測値を、例えば相対的に比較して潮流を推し量るというような用途には使いにくい。
This indicates that it will be one of the measured values that varies as shown in the figure for each
以上のように、PV連系がある場合、順次のポーリングにより収集した一般的な方式の計測値は、測定時刻のずれによる計測値のずれが、データの利用価値を低下させてしまっている。 As described above, in the case of PV interconnection, the deviation of the measured value due to the deviation of the measurement time in the measured value of the general method collected by the sequential polling reduces the utility value of the data.
そこで、本実施の形態では、上記測定時刻のずれによる計測値の誤差を補正する手法の少なくとも一部を説明する。ここで、図2及び図3で示した短周期での計測処理211に着目する。
Therefore, in the present embodiment, at least a part of the method for correcting the error of the measured value due to the deviation of the measured time will be described. Here, attention is paid to the
当該短周期での計測処理211は、変電所送り出し点での皮相電流(|I|)や電圧(V)を、秒単位などの短周期で計測したデータである。当該短周期での計測処理211に着目したのは、計測時刻のずれをリアルタイムで補正できたほうが利便性が高く、系統の運用管理などを含め、活用範囲が広いためである。
The
しかしながら、皮相電流(|I|)を利用するには課題が存在する。これは、皮相電流から電圧降下量Vdへの変換は必ずしも直接行えないためである。一方、例えば、有効電力(P)や無効電力(Q)を使用できる場合、電圧降下量(Vd)に直接結びつけることができる。例えば電圧降下量は、Vd=(RP+XQ)/Vという式を用いて表すことができる、なお、変数R,Xは、当該地点までの系統のインピーダンスを表す。 However, there are problems in utilizing the apparent current (| I |). This is because the conversion from the apparent current to the voltage drop amount Vd cannot always be performed directly. On the other hand, for example, when active power (P) or reactive power (Q) can be used, it can be directly linked to the voltage drop amount (Vd). For example, the amount of voltage drop can be expressed by using the equation Vd = (RP + XQ) / V, and the variables R and X represent the impedance of the system up to the point.
しかしながら、今回使用できる短周期の計測データは、皮相電流(以降、(√3)V|I|で皮相電力に変換して使用する)であるため、皮相電力の利用にはなんらかの対策が必要である。 However, since the short-period measurement data that can be used this time is the apparent current (hereinafter, converted to apparent power by (√3) V | I |), some measures are required to use the apparent power. be.
そのような対策を検討する前に、皮相電力と電圧降下量との関連を調べる。前提は以下である。親局は、変電所送り出し点の皮相電流(|I|)、電圧(V)をいずれも秒単位などの短周期で計測しているものとする。 Before considering such measures, examine the relationship between apparent power and voltage drop. The assumptions are as follows. It is assumed that the master station measures the apparent current (| I |) and the voltage (V) at the transmission point of the substation in a short cycle such as in seconds.
また、親局210からのポーリングにより、開閉器2001などで計測した値を子局2001経由で、順次取得する。開閉器2001での計測値は、皮相電流(|I|)、電圧とする。
Further, by polling from the
また、全ての子局2001,2002,・・・,200nを計測する周期は、例えば一時間または30分と、親局201での計測周期と比較して格段に長い周期であるものとする。以降、皮相電流は、例えば皮相電力に変換して使用するものとする。
Further, it is assumed that the cycle for measuring all the
図7は、PV連系がある場合において、PV110の出力変動の態様(以下「潮流」という)の変動と皮相電力との関係及び潮流の変動に対する電圧降下量の関係を示す。なお、図7では、縦軸がQを表しており、横軸がPを表しており、図示の平面を「PQ平面」とも呼ぶ。 FIG. 7 shows the relationship between the fluctuation of the output fluctuation mode (hereinafter referred to as “tidal current”) of PV110 and the apparent power and the relationship of the voltage drop amount with respect to the fluctuation of the tidal current when there is PV interconnection. In FIG. 7, the vertical axis represents Q, the horizontal axis represents P, and the illustrated plane is also referred to as a “PQ plane”.
図示の例において特性Aは、負荷特性において、大口需要家106や小口需要家107である負荷のみが連系されたと仮定した場合の潮流の軌跡である。なお、力率が良好な場合には特性Aの傾斜がより緩やかになる。各々破線両矢印で図示した特性B,Cは、それぞれPV110の出力変動が重畳した場合の軌跡であり、それぞれ、例えば、朝のように需要が少なく負荷が小さい場合と、昼間のように需要が多く負荷がある程度大きい場合とに対応している。
In the illustrated example, the characteristic A is the locus of the tidal current when it is assumed that only the loads of the
また、ある皮相電力の値に対応する潮流は、特性DのようにS2=P2+Q2に基づいて同心円となる。各々二点鎖線で示した特性Gは、電圧降下量Vdの降下態様を等高線状に表している(以下「等高線G」という)。なお、当該二点鎖線で示した各等高線Gは、図示の左下から右上に進むにつれて電圧が降下する。 Further, the tidal current corresponding to a certain apparent power value becomes concentric circles based on S 2 = P 2 + Q 2 as in the characteristic D. The characteristic G shown by each two-dot chain line represents the drop mode of the voltage drop amount Vd in a contour line (hereinafter referred to as “contour line G”). The voltage of each contour line G shown by the two-dot chain line decreases from the lower left to the upper right in the figure.
領域E,Fは、潮流の変化に対する皮相電力の感度が無い領域を表しており、PV110の出力変動の軌跡が上記同心円の接線方向となる。次に領域E,Fの決め方について説明する。まず、原点を通り、PV110の出力変動の傾きと直交する直線を引く。次に、同じく原点を通り、かつ、この直線に対し正負の同じ角度だけ回転させた2つの直線を引く。これら2つの直線に囲まれる範囲が領域E及び領域Fである。
The regions E and F represent regions in which the apparent power is not sensitive to changes in the tidal current, and the locus of the output fluctuation of the
ここで、潮流が特性Bに示すような軌跡を辿ったとする。このとき、同軌跡の変化方向は、同心円の略接線方向となり、皮相電力の変動は小さい。一方、特性Bの軌跡は、等高線Gと平行でないため、電圧降下量Vdは変動する。 Here, it is assumed that the tidal current follows the trajectory as shown in the characteristic B. At this time, the change direction of the concentric locus is a substantially tangential direction of the concentric circles, and the fluctuation of the apparent power is small. On the other hand, since the locus of the characteristic B is not parallel to the contour line G, the voltage drop amount Vd fluctuates.
上記内容は、皮相電力から電圧降下量Vdを算出できない条件を示している。同領域は、特性Eと特性Fの範囲となる。これに対して、潮流の軌跡が特性Cである場合、特性Cの軌跡は変化方向が同心円の略半径方向となり、潮流が変動すると皮相電力も変動し、さらに電圧降下量Vdも変動することとなる。よって、後者の条件)では、皮相電力から電圧降下量Vdを算出することができる可能性がある。 The above contents show the condition that the voltage drop amount Vd cannot be calculated from the apparent power. This region is the range of characteristic E and characteristic F. On the other hand, when the locus of the tidal current is characteristic C, the locus of characteristic C changes in the substantially radial direction of concentric circles, and when the tidal current fluctuates, the apparent power also fluctuates, and the voltage drop amount Vd also fluctuates. Become. Therefore, under the latter condition), there is a possibility that the voltage drop amount Vd can be calculated from the apparent power.
そこで、本実施の形態では、皮相電力と電圧降下量Vdとの関係を、実系統での潮流データを用いて検証する。この検証において、電圧降下量Vdの算出は、配電用変電所102の送り出し点での潮流値(P,Q)に、系統のインピーダンスをかけることで算出している。
Therefore, in the present embodiment, the relationship between the apparent power and the voltage drop amount Vd is verified by using the tidal current data in the actual system. In this verification, the voltage drop amount Vd is calculated by multiplying the power flow value (P, Q) at the transmission point of the
図8は、潮流の軌跡が範囲Fになる条件(軽負荷)での皮相電力と電圧降下量Vdとの関係を示し、図9は、特性E,F以外での皮相電力と電圧降下量Vdとの関係を示す。 FIG. 8 shows the relationship between the apparent power and the voltage drop amount Vd under the condition that the locus of the tidal current is in the range F (light load), and FIG. 9 shows the apparent power and the voltage drop amount Vd other than the characteristics E and F. Shows the relationship with.
潮流の軌跡が範囲Fになる条件(軽負荷)では、図7を用いた考察の通り、電圧降下量Vdに対する皮相電力の感度がほとんど無い。つまり、皮相電力と電圧降下量Vdとの相関が小さい。よって、上記条件では、開閉器毎の計測時刻のずれによる計測値の補正に、皮相電力を用いることはできず、別の手段(後述)を用いる。 Under the condition that the locus of the tidal current is in the range F (light load), as discussed with reference to FIG. 7, there is almost no sensitivity of the apparent power to the voltage drop amount Vd. That is, the correlation between the apparent power and the voltage drop amount Vd is small. Therefore, under the above conditions, the apparent power cannot be used to correct the measured value due to the deviation of the measured time for each switch, and another means (described later) is used.
一方、軽負荷以外の条件(潮流が特性E,F以外の範囲となる場合)、同様に図7を用いた考察の通り、電圧降下量Vdに対する皮相電力の感度があることになる。 On the other hand, under conditions other than light load (when the tidal current is in a range other than the characteristics E and F), as in the discussion using FIG. 7, there is the sensitivity of the apparent power to the voltage drop amount Vd.
つまり、上記条件では、皮相電力と電圧降下量Vdとの間に相関があることになる。よって、開閉器2001など毎の計測時刻のずれによる計測値の補正に、皮相電力を用いることができることが分かる。
That is, under the above conditions, there is a correlation between the apparent power and the voltage drop amount Vd. Therefore, it can be seen that the apparent power can be used to correct the measured value due to the deviation of the measured time for each
以上から皮相電力と電圧降下量Vdとの相関の有無を決める要因の1つが、例えば大口需要家106や小口需要家107のような負荷の量であることがわかる。負荷の量は、平日や休日など一日単位で特徴が異なるため、判定に用いると利便性が高い。
From the above, it can be seen that one of the factors that determines the presence or absence of the correlation between the apparent power and the voltage drop amount Vd is the amount of load such as the large-
以上の知見に基づき、本実施の形態では、皮相電力と電圧降下量Vdの相関の有無を基準に、開閉器毎の計測時刻のずれによる計測値を補正する際に、皮相電力を用いる方式と、皮相電力を用いない方式とを切り替える。 Based on the above findings, in the present embodiment, the apparent power is used when correcting the measured value due to the deviation of the measurement time for each switch based on the presence or absence of the correlation between the apparent power and the voltage drop amount Vd. , Switch between methods that do not use apparent power.
以降、本実施の形態について、機能ブロックを用いて説明する。図10は、本実施の形態に係る計測補正装置の機能的な構成例を示す機能ブロック図である。この計測補正装置は、例えば、配電用変電所等、開閉器で測定したデータを収集する役割を担う電気所等に設置されている。なお、この計測補正装置は、低遅延かつ高速の通信路を介して接続されていれば、上述した場所に限らず、任意の場所に設置されていても良い。 Hereinafter, this embodiment will be described with reference to functional blocks. FIG. 10 is a functional block diagram showing a functional configuration example of the measurement correction device according to the present embodiment. This measurement correction device is installed in, for example, a distribution substation or an electric station that plays a role of collecting data measured by a switch. The measurement correction device may be installed in any place, not limited to the above-mentioned place, as long as it is connected via a low-delay and high-speed communication path.
本実施の形態に係る計測補正装置は、入出力部322、親局時刻保持部340、相関有無判定部325、算出方式切替部330、統括制御部320、計測値格納部323、皮相電流を用いた補正部331、皮相電流を用いない補正部332、及び、ポーリング制御部321を備えている。一方、各第1の子局2001~第n子局200nは、子局時刻保持部341を備えている。
The measurement correction device according to the present embodiment uses the input /
入出力部322は、外部とのやりとりを行うI/O装置で、主に通信インターフェース等で構成される。操作卓等のコンソールを含んでも良い。
The input /
計測値格納部323は、配下の開閉器子局からの測定データや各種設定を保存する。
The measurement
ポーリング制御部321は、配下の開閉器子局からの測定データの収集に際し、順次の呼び出し、または、後述する皮相電流を用いない補正のための、特定の子局宛の変則的ポーリング等を実行する。
The
相関有無判定部325は、皮相電流と電圧降下量(電圧降下の変化量)との相関の有無を判定する機能(以下「相関有無判定機能」という)を有する。
The correlation presence /
算出方式切替部330は、本相関有無判定機能の判定結果に応じて、各子局2001,2002,・・・,200nにおいて計測された計測値を、例えば、相対的に長い周期以下の分解能で計測した値に近似する(電圧降下量)算出方式を切り替える。
The calculation
皮相電流を用いた補正部331は、皮相電流を用いて電圧降下量Vdを補正する機能を有し、親局にて短周期で計測した皮相電流を用いて、開閉器子局間の計測時刻のずれによる計測値のずれを補正する。
The
皮相電流を用いない補正部332は、皮相電流を用いずに電圧降下量Vdを補正する機能、すなわち、皮相電流を用いずに後述する方式を用いて開閉器子局間の計測時刻のずれによる計測値のずれを補正する機能を有する。
The
統括制御部320は、上述した各機能を統括的に制御する。具体的には、統括制御部320は、演算や各種処理の実行主体であるCPU、タスクを管理するスケジューラー及びOSなどで構成されている。
The
親局時刻保持部340及び子局時刻保持部341はそれぞれ、親局210及び各子局2001~200nにおいて時刻を保持する機能を有し、具体的には、リアルタイムクロックなどのように時刻を刻むとともに日付を保持するカレンダー機能を有する。
The master station
なお、これら親局時刻保持部340及び子局時刻保持部341は必須の構成ではない。これらを図示したのは、親局210と子局2001~200nとの時刻が同期していないことを明示的に示すためである。例えば、子局2001~200nは親局210の要求に応じて計測値を応答するだけの機能を有していれば、時刻やカレンダーを必ずしも保持する必要は無い。
The master station
次に本実施の形態において特徴的な構成である相関有無判定部325について説明する。相関有無判定部325は、皮相電流と電圧降下量との相関の有無を判定する機能として、図7で示した根拠により、潮流の変動範囲が図7のPQ平面上のどの領域におよそ収まるかに応じて、皮相電流と電圧降下量Vdとの相関があるか否かを判定する。
Next, the correlation presence /
相関有無判定部325は、潮流の変動範囲が主に図7に示す領域E,Fである場合、皮相電流と電圧降下量Vdとの相関が無いと判定する。一方、相関有無判定部325は、上記以外の場合、皮相電流と電圧降下量Vdとの相関があると判定する。
The correlation presence /
相関有無判定部325は、判定根拠として、計測値格納部323に格納している過去の皮相電流と電圧降下量Vdとの関係を用い、統計的に算出して判定しても良い。あるいは、相関有無判定部325は、例えば、平日か休日などの種別に応じてこれを判定しても良い。いずれにしても、相関有無判定部325は、図7で示した判定根拠を適用できればよく、例えば、上位系の制御システムから入手した負荷の状況(P,Q)を用いて判定しても良い。
The correlation presence /
図11は、補正処理の一例を示す。まず、ステップS461では、相関有無判定部325が、皮相電流と電圧降下量Vdとの相関の有無を確認する。ステップS462では、算出方式切替部330が、相関有無判定部325によって判定された相関の有無に応じて補正法を選択する。
FIG. 11 shows an example of the correction process. First, in step S461, the correlation presence /
相関があると判定された場合、算出方式切替部330は、皮相電流を用いる補正法を選択すべくステップS463を実行する。ステップS463は、皮相電流を用いた補正部331が、皮相電流を用いる補正法を適用して補正を実施する。本ステップは機能ブロックに該当する。
If it is determined that there is a correlation, the calculation
一方、相関がないと判定された場合、算出方式切替部330は、皮相電流を用いない補正法を選択すべくステップS464を実行する。このステップS464では、皮相電流を用いない補正部332が、皮相電流を用いない補正法を適用して補正を実行する。
On the other hand, when it is determined that there is no correlation, the calculation
本判定処理は、例えば一日単位で行っても良い。この一日単位の判定処理の実行で足りるケースとしては、図7で示した判定根拠による潮流の変動範囲の領域が、一日単位で変わる場合などである。具体的には、潮流の変動範囲が、図7に示す領域Eや領域Fにほぼ入らない日とほぼ入る日とがおおよそ日毎に決定できる場合、一日単位の判定処理を実行することができる。 This determination process may be performed on a daily basis, for example. A case where the execution of the determination process on a daily basis is sufficient is a case where the region of the fluctuation range of the tidal current based on the determination basis shown in FIG. 7 changes on a daily basis. Specifically, if the fluctuation range of the tidal current can be determined approximately on a daily basis between the days when the tidal current does not enter the region E and the region F and the days when the tidal current fluctuates, the determination process can be executed on a daily basis. ..
より具体的には、休日や週末のように軽負荷の日は、図7に示す領域Fに入る一方、平日のように重負荷の日は、領域Eや領域Fにほぼ入らないとみなせる場合、日毎の判定を適用できる。系統やPVの容量の条件が合えば、簡便な方式として平日か休日かで上記切り替えを実施するようにしても良い。 More specifically, when a day with a light load such as a holiday or a weekend falls into the area F shown in FIG. 7, a day with a heavy load such as a weekday can be regarded as hardly entering the area E or the area F. , Daily judgment can be applied. If the conditions of the capacity of the system and PV are met, the above switching may be performed on weekdays or holidays as a simple method.
また、本実施の形態を適用するに際し、実際に図7相当の図を描く必要は無い。これは、皮相電力と電圧降下量Vdの関係は、過去データの分析の他にも、より上位系統でのP,Qに関する情報から分かるためである。また、別システムがPV出力の推定機能を有している場合、負荷特性(図7に示す特性A)やPVの定格に関する情報は入手済みの場合も多い。上述した補正法を適用するシステムにて、上記別システムが保有する情報を用いると、利便性の向上が期待できる。 Further, when applying the present embodiment, it is not necessary to actually draw the figure corresponding to FIG. 7. This is because the relationship between the apparent power and the voltage drop amount Vd can be understood from the information on P and Q in the higher system in addition to the analysis of the past data. Further, when another system has a PV output estimation function, it is often the case that information on the load characteristics (characteristic A shown in FIG. 7) and the PV rating has already been obtained. If the information possessed by the above-mentioned other system is used in the system to which the above-mentioned correction method is applied, the convenience can be expected to be improved.
次に、皮相電流を用いた補正部331による皮相電流を用いた電圧降下量Vdの補正機能、及び、皮相電流を用いない補正部332による皮相電流を用いない電圧降下量Vdの補正機能について説明する。
Next, the function of correcting the voltage drop amount Vd using the apparent current by the
補正部331による皮相電流を用いた(電圧降下量Vdの)補正法では、詳細な説明は省略するが、図9に示す関係、例えば近似曲線(直線含む)を用いればよい。このような補正法では、時刻のずれによる計測値のずれ量を相対的に求めればよいため、例えば直線の傾きのみを用いた補正としても良い。
In the correction method (of the voltage drop amount Vd) using the apparent current by the
次に、皮相電流を用いない電圧降下量Vdの補正法について説明する。皮相電流(又は皮相電力)を用いない場合、配電用変電所102の送り出し点にて短周期で計測している電気量を用いることはできない。そこで、皮相電流を用いない補正部332は、一例として、後述する図12及び図13に示すような手法を用いることができる。本手法では、ある開閉器をターゲットノードとして計測周期内で複数回計測し、その計測値の差を内外挿するものである。
Next, a method for correcting the voltage drop amount Vd without using the apparent current will be described. When the apparent current (or apparent power) is not used, the amount of electricity measured in a short cycle at the sending point of the
図12は、皮相電力を用いない補正法を採用した場合における通信シーケンスの一例を示す。図示の例では、開閉器第1の子局2001をパイロットノードと定義する一方、開閉器第2の子局2002をターゲットノードと定義する。
FIG. 12 shows an example of a communication sequence when a correction method that does not use apparent power is adopted. In the illustrated example, the switch
計測処理543は、1回目のパイロットノードに関する計測処理であり、計測処理544は、ターゲットノードに関する計測処理であり、計測処理545は、2回目のパイロットノードに関する計測処理である。計測処理543,544,545それぞれの計測時刻をt1,t2,t3としている。
The
図13は、皮相電力を用いない補正法の一例を示す。電圧降下量Vdは、前述のように変電所102の送り出し点を基準とした各ノード(開閉器)までの電圧差に相当する。
FIG. 13 shows an example of a correction method that does not use apparent power. The voltage drop amount Vd corresponds to the voltage difference to each node (switch) with respect to the sending point of the
これら計測処理543,544,545の各符号は、それぞれ、図12に示すシーケンスでの計測処理に対応している。ここで、パイロットノードの計測値の差Vd1を用いて、ターゲットノードの計測時刻t2における測定値を、同様にターゲットノードの時刻t1における値に補正する補正値Vd2は、Vd2≒Vd1*(C1)*(C2)で示される。 Each of the reference numerals of these measurement processes 543, 544, 545 corresponds to the measurement process in the sequence shown in FIG. Here, the correction value Vd2 for correcting the measured value at the measurement time t2 of the target node to the value at the time t1 of the target node by using the difference Vd1 of the measured values of the pilot node is Vd2≈Vd1 * (C1). * Indicated by (C2).
計測処理545での計測値に対し、上記補正値Vd2によって補正することで、ターゲットノード補正結果546が得られる。なお、実際には計測できない値であるが、ターゲットノードの理想値547もある。
By correcting the measured value in the
上記係数C1は、ターゲットノードの電圧変動量に対するパイロットノードの電圧変動量の比である。有効電力(P)及び無効電力(Q)が分かっている場合、系統インピーダンスと潮流による電圧降下量の比を容易に算出できるが、本実施の形態の場合、皮相電力しか分かっていない。また、皮相電流を用いない補正部332は、少なくとも皮相電力の感度が無い前提で使用する。よって、各ノードの電圧変動量の比を用いる。ノードの電圧変動量の比の算出には、計測値格納部323に蓄積した過去のデータを使用できる。
The coefficient C1 is the ratio of the voltage fluctuation amount of the pilot node to the voltage fluctuation amount of the target node. When the active power (P) and the active power (Q) are known, the ratio of the system impedance and the voltage drop due to the power flow can be easily calculated, but in the case of this embodiment, only the apparent power is known. Further, the
ここで、電圧変動量の比は、特に制約を設けない一般の条件下では、一定に近い値となることを期待できない。しかしながら、皮相電流を用いない補正部332を動作させるべき条件下では、ある程度一定に近い値となることを期待できる。これは、皮相電流を用いない補正部332を適用する条件が、休日や週末のような軽負荷の日である点、及び、皮相電流を用いない補正部332を適用する対象が、短時間のPVの出力変動による電圧変動の補正である点により、条件を絞り込めるためである。一方、上述した変数C2は、計測時刻差の比を示しており、C2=(t2-t1)/(t3-t1)で表される。
Here, the ratio of the voltage fluctuation amount cannot be expected to be a value close to a constant value under general conditions without any particular restriction. However, under the condition that the
図14は、皮相電力を用いない補正法の適用結果の一例を示す。本結果は、実系統での潮流計測データを用いて電圧降下量Vdを算出することで取得された。図14(A)は、補正を行わない場合の一例を示す。図14(A)の横軸が、ターゲットノードの時刻t1における正しい値(図13の理想値547)である。同じく縦軸がターゲットノードの時刻t2における値(図13の計測値545)である。
FIG. 14 shows an example of the application result of the correction method that does not use apparent power. This result was obtained by calculating the voltage drop amount Vd using the tidal current measurement data in the actual system. FIG. 14A shows an example in the case where the correction is not performed. The horizontal axis of FIG. 14A is the correct value at time t1 of the target node (
図14(B)は、補正を行った場合の一例を示す。図14(B)の横軸が、図14(A)と同様にターゲットノードの計測時刻t1における正しい値(図13の値547)、縦軸は、ターゲットノードの時刻t2の値を補正したターゲットノードの時刻t1の推定値(図13の値546)である。分布の形状が傾き1の直線に近いほど(細いほど)、理想値に近いことを示している。図14(A)に示す分布と比較し、図14(B)に示す分布は細く、補正の効果が出ていることが分かる。本実施の形態では、補正しない場合と比較し、誤差を約3割低減できている。
FIG. 14B shows an example of the case where the correction is performed. The horizontal axis of FIG. 14 (B) is the correct value at the measurement time t1 of the target node (
図15は、皮相電力を用いる補正法の適用結果の例である。同図縦軸は,変電所送り出し点からの電圧降下量Vd、横軸は時刻Tでフルスパン約20分である。ここで、図示の「子2_理想値」は、ある基準時刻からのずれが無いと仮定した場合の値を示し、目標とする値である。図示の「子2_計測値」は、実際に計測できる値を示し、ある基準時刻からのずれがある値である。図示の「子2_補正後」とは、親局において短周期で計測している皮相電力を用い、第2の子局2002_計測値に補正を加えた値を示す。同図から分かるとおり、皮相電力を用いた補正は、電圧降下量Vdが値VAから値VBにシフトしており、効果的に時刻のずれを補正できることがわかる。 FIG. 15 is an example of the application result of the correction method using apparent power. The vertical axis of the figure is the amount of voltage drop Vd from the substation sending point, and the horizontal axis is the time T with a full span of about 20 minutes. Here, the illustrated "child 2_ideal value" indicates a value when it is assumed that there is no deviation from a certain reference time, and is a target value. The illustrated "child 2_measured value" indicates a value that can be actually measured, and is a value having a deviation from a certain reference time. In the figure, "child 2_corrected" means a value obtained by adding correction to the second slave station 2002_measured value using the apparent power measured in a short cycle in the master station. As can be seen from the figure, in the correction using the apparent power, the voltage drop amount Vd is shifted from the value VA to the value VB, and it can be seen that the time lag can be effectively corrected.
本実施例の方式により、高精度な補正が可能な皮相電力を用いる補正法と、適用範囲が広い皮相電力を用いない補正法を、上述のように、例えば図7に示したような明確な根拠をもって切り替えることができる。 According to the method of this embodiment, the correction method using the apparent power capable of highly accurate correction and the correction method using the apparent power having a wide range of application are clearly defined as shown in FIG. 7, for example, as described above. You can switch on the grounds.
つまり、皮相電流と電圧降下量Vdとの相関がある条件には、皮相電力(皮相電流)を用いて電圧降下を算出した方が補正の精度が高い。一方、皮相電力と電圧降下量との相関がない条件もあるため、精度は低いが適用条件が広い、皮相電力を用いない方式(内外挿等)の手段を用いる。本実施の形態では、そのような条件に応じて、より効果の高い補正方式を選択することで、測定時刻の違いによる誤差の低減効果を向上することができる。なお、上記方式は、整合性のみを評価関数とし、例えばメタヒューリスティック的手法で求めた補正と比較し、明確な根拠に基づいているため、有利である。 That is, under the condition that there is a correlation between the apparent current and the voltage drop amount Vd, the correction accuracy is higher when the voltage drop is calculated using the apparent power (apparent current). On the other hand, since there are some conditions where there is no correlation between the apparent power and the amount of voltage drop, a method that does not use the apparent power (internal / external insertion, etc.) is used because the accuracy is low but the applicable conditions are wide. In the present embodiment, by selecting a correction method having a higher effect according to such a condition, it is possible to improve the effect of reducing the error due to the difference in the measurement time. It should be noted that the above method is advantageous because it uses only consistency as an evaluation function and is based on a clear basis as compared with, for example, a correction obtained by a metaheuristic method.
また、従来、時刻のずれによる計測値のズレを考慮し、電圧余裕等を大きくとる必要があったが、計測精度の向上により、適切な余裕とすることが可能となる。適切な余裕とすることができれば、PV導入量の積み増しが可能となる。あるいは、同様な精度の電気量を取得できるまでの計測期間を短縮することができる。従って、PV導入可否の判定に要する期間等を短縮できるため、変革の早い再生エネルギー関連への対応において優位に立てる。 Further, conventionally, it has been necessary to take a large voltage margin or the like in consideration of the deviation of the measured value due to the time difference, but by improving the measurement accuracy, it becomes possible to make an appropriate margin. If an appropriate margin can be provided, the amount of PV introduced can be increased. Alternatively, the measurement period until the amount of electricity with the same accuracy can be obtained can be shortened. Therefore, the period required for determining whether or not to introduce PV can be shortened, which gives an advantage in responding to the rapidly changing renewable energy-related products.
(4)その他の実施形態
上記実施形態は、本発明を説明するための例示であり、本発明をこれらの実施形態にのみ限定する趣旨ではない。本発明は、その趣旨を逸脱しない限り、様々な形態で実施することができる。例えば、上記実施形態では、各種プログラムの処理をシーケンシャルに説明したが、特にこれにこだわるものではない。従って、処理結果に矛盾が生じない限り、処理の順序を入れ替え又は並行動作するように構成しても良い。
(4) Other Embodiments The above embodiments are examples for explaining the present invention, and the present invention is not intended to be limited only to these embodiments. The present invention can be carried out in various forms as long as it does not deviate from the gist thereof. For example, in the above embodiment, the processing of various programs has been described sequentially, but the present invention is not particularly particular. Therefore, as long as there is no contradiction in the processing results, the processing order may be changed or the processing may be configured to operate in parallel.
本発明は、電力系統の計測値を補正する計測補正装置に広く適用することができる。 INDUSTRIAL APPLICABILITY The present invention can be widely applied to a measurement correction device that corrects a measurement value of an electric power system.
101……発電所、102……変電所、103……計測点、104……送電線、105……配電線、106……大口需要家、107……小口需要家、110……PV(太陽光発電)装置、200……開閉器、210……変電所設置計測装置、211……変電所送り出し点での短周期の計測処理、212……開閉器での長周期の計測処理、320……統括制御部、321……ポーリング制御部、322……入出力部、323……データ格納部、325……相関有無判定部、330……算出方式切替部、331……皮相電流を用いた補正部、332……皮相電流を用いない補正部。 101 …… Power plant, 102 …… Substation, 103 …… Measurement point, 104 …… Transmission line, 105 …… Distribution line, 106 …… Large consumer, 107 …… Small consumer, 110 …… PV (Sun) Photoelectric power generation) device, 200 ... switch, 210 ... substation installation measuring device, 211 ... short cycle measurement processing at the substation sending point, 212 ... long cycle measurement processing with switch, 320 ... ... General control unit, 321 ... Polling control unit, 322 ... Input / output unit, 323 ... Data storage unit, 325 ... Correlation presence / absence determination unit, 330 ... Calculation method switching unit, 331 ... Apparent current was used. Correction unit 332: Correction unit that does not use apparent current.
Claims (5)
前記皮相電流と電圧降下量との相関の有無を判定する判定部と、
前記特定箇所の配下における所定箇所で相対的に長い周期で計測する第2の計測部と、
前記判定部による前記皮相電流と電圧降下量との相関の有無の判定結果に応じて、前記第2の計測部によって計測した値を、前記相対的に長い周期以下の分解能で計測した値に近似する方式を切り替える算出方式切替部と、
前記算出方式切替部によって切り替えた方式に基づいて前記第2の計測部によって計測した値を補正する補正部と、
を備えることを特徴とする計測補正装置。 The first measuring unit that measures the apparent current or the amount of electricity that can be converted into apparent power at a specific point in the power system in a relatively short cycle,
A determination unit for determining the presence or absence of a correlation between the apparent current and the voltage drop amount,
A second measuring unit that measures at a predetermined location under the specific location with a relatively long cycle, and
The value measured by the second measuring unit is approximated to the value measured with a resolution of a relatively long period or less according to the determination result of the presence or absence of the correlation between the apparent current and the voltage drop amount by the determination unit. Calculation method switching unit that switches the method to be used, and
A correction unit that corrects the value measured by the second measurement unit based on the method switched by the calculation method switching unit, and a correction unit.
A measurement correction device characterized by being equipped with.
前記算出方式切替部は、
前記判定部に代えて前記負荷判定部による判定結果に応じて検出した前記電圧降下量の変化量の違いに応じて、前記特定箇所の配下における所定箇所で相対的に長い周期で計測した値を、前記長い計測周期以下の分解能で計測した値に近似する方式を切り替えることを特徴とする請求項1に記載の計測補正装置。 It has a load determination unit that determines the difference in the amount of change in the amount of voltage drop based on the amount of load in the power system.
The calculation method switching unit is
Instead of the determination unit, a value measured in a relatively long cycle at a predetermined location under the specific location is measured according to the difference in the amount of change in the voltage drop detected according to the determination result by the load determination unit. The measurement correction device according to claim 1, further comprising switching a method that approximates a value measured with a resolution of a long measurement cycle or less.
前記算出方式切替部は、
前記判定部に代えて前記種別判定部による判定結果に応じて検出した前記電圧降下量の変化量の違いに応じて、前記特定箇所の配下における所定箇所で相対的に長い周期で計測した値を前記長い計測周期以下の分解能で計測した値に近似する方式を切り替えることを特徴とする請求項2に記載の計測補正装置。 Equipped with a type determination unit that determines the difference in the amount of change in the voltage drop based on the type of weekday or holiday.
The calculation method switching unit is
Instead of the determination unit, a value measured in a relatively long cycle at a predetermined location under the specific location is measured according to the difference in the amount of change in the voltage drop detected according to the determination result by the type determination unit. The measurement correction device according to claim 2, wherein a method that approximates a value measured with a resolution of a long measurement cycle or less is switched.
前記算出方式切替部は、
前記判定切替部によって切り替えられた前記判定部、前記負荷判定部及び前記種別判定部のいずれかによる実行結果に応じて、前記特定箇所の配下における所定箇所で相対的に長い周期で計測した値を前記長い計測周期以下の分解能で計測した値に近似する方式を切り替える
ことを特徴とする請求項3に記載の計測補正装置。 It has a determination switching unit that switches between the determination unit, the load determination unit, and the type determination unit.
The calculation method switching unit is
A value measured in a relatively long cycle at a predetermined location under the specific location according to the execution result of any of the determination unit, the load determination unit, and the type determination unit switched by the determination switching unit. The measurement correction device according to claim 3, further comprising switching a method that approximates a value measured with a resolution of a long measurement cycle or less.
前記皮相電流と電圧降下量との相関の有無を判定する判定ステップと、
前記特定箇所の配下における所定箇所で相対的に長い周期で計測する第2の計測ステップと、
前記判定ステップによる前記皮相電流と電圧降下量との相関の有無の判定結果に応じて、前記第2の計測ステップにおいて計測した値を、前記相対的に長い周期以下の分解能で計測した値に近似する方式を切り替える算出方式切替ステップと、
前記算出方式切替ステップにおいて切り替えた方式に基づいて前記第2の計測ステップによって計測した値を補正する補正ステップと、
を有することを特徴とする計測補正方法。 The first measurement step of measuring the apparent current or the amount of electricity that can be converted into apparent power at a specific point in the power system in a relatively short cycle, and
A determination step for determining the presence or absence of a correlation between the apparent current and the voltage drop amount,
A second measurement step of measuring at a predetermined location under the specific location with a relatively long cycle, and
The value measured in the second measurement step is approximated to the value measured with a resolution of a relatively long cycle or less according to the determination result of the presence or absence of the correlation between the apparent current and the voltage drop amount by the determination step. Calculation method switching step to switch the method to be performed, and
A correction step for correcting the value measured by the second measurement step based on the method switched in the calculation method switching step, and a correction step.
A measurement correction method characterized by having.
Priority Applications (1)
| Application Number | Priority Date | Filing Date | Title |
|---|---|---|---|
| JP2018031380A JP7020962B2 (en) | 2018-02-23 | 2018-02-23 | Measurement correction device and measurement correction method |
Applications Claiming Priority (1)
| Application Number | Priority Date | Filing Date | Title |
|---|---|---|---|
| JP2018031380A JP7020962B2 (en) | 2018-02-23 | 2018-02-23 | Measurement correction device and measurement correction method |
Publications (2)
| Publication Number | Publication Date |
|---|---|
| JP2019146464A JP2019146464A (en) | 2019-08-29 |
| JP7020962B2 true JP7020962B2 (en) | 2022-02-16 |
Family
ID=67772897
Family Applications (1)
| Application Number | Title | Priority Date | Filing Date |
|---|---|---|---|
| JP2018031380A Active JP7020962B2 (en) | 2018-02-23 | 2018-02-23 | Measurement correction device and measurement correction method |
Country Status (1)
| Country | Link |
|---|---|
| JP (1) | JP7020962B2 (en) |
Families Citing this family (1)
| Publication number | Priority date | Publication date | Assignee | Title |
|---|---|---|---|---|
| WO2022180787A1 (en) * | 2021-02-26 | 2022-09-01 | 三菱電機株式会社 | Voltage management device, voltage command device, power system monitoring system, measuring device, voltage management method, and voltage management program |
Citations (3)
| Publication number | Priority date | Publication date | Assignee | Title |
|---|---|---|---|---|
| JP2003032914A (en) | 2001-07-17 | 2003-01-31 | Hitachi Ltd | Automation system of power distribution, and monitoring method thereof |
| JP2006067755A (en) | 2004-08-30 | 2006-03-09 | Toshiba Corp | Method and program for calculating zone load of distribution line |
| US20090088991A1 (en) | 2007-04-09 | 2009-04-02 | Brzezowski Edward H | System and method for monitoring and managing energy performance |
-
2018
- 2018-02-23 JP JP2018031380A patent/JP7020962B2/en active Active
Patent Citations (3)
| Publication number | Priority date | Publication date | Assignee | Title |
|---|---|---|---|---|
| JP2003032914A (en) | 2001-07-17 | 2003-01-31 | Hitachi Ltd | Automation system of power distribution, and monitoring method thereof |
| JP2006067755A (en) | 2004-08-30 | 2006-03-09 | Toshiba Corp | Method and program for calculating zone load of distribution line |
| US20090088991A1 (en) | 2007-04-09 | 2009-04-02 | Brzezowski Edward H | System and method for monitoring and managing energy performance |
Also Published As
| Publication number | Publication date |
|---|---|
| JP2019146464A (en) | 2019-08-29 |
Similar Documents
| Publication | Publication Date | Title |
|---|---|---|
| US10309800B2 (en) | Intelligent receptacle | |
| JP4938750B2 (en) | Power consumption prediction apparatus, power consumption prediction method, and program | |
| US20210313928A1 (en) | Method and apparatus for determining key performance photovoltaic characteristics using sensors from module-level power electronics | |
| JP6410962B2 (en) | Distribution system management device, measuring device, distribution system management system, and power generation amount estimation method | |
| JP6287306B2 (en) | Power estimation apparatus, power estimation method, and program | |
| JP6385292B2 (en) | Power generation output estimation method, estimation device, and estimation program | |
| CN106605345B (en) | Energy management system and method for controlling device and computer readable medium | |
| JP2017011804A (en) | Power management device, device system, power management method, and program | |
| JP7020962B2 (en) | Measurement correction device and measurement correction method | |
| JP2018026909A (en) | Power generation state determination device, monitoring device, power generation state determination method and determination program | |
| CN106408444A (en) | Method for automatically associating a module to a corresponding inverter, and related module and power generation system | |
| JP7479410B2 (en) | A distributed ledger for transacting with grid constraints to ensure grid stability | |
| US9507364B2 (en) | Methods for reducing solar inverter output volatility, and related nodes and solar inverters | |
| US10601225B2 (en) | Management device, management system, control method for management device, and control program | |
| JP5461717B1 (en) | Power prediction device | |
| JP7414988B2 (en) | Power management system, power conversion device and power management method | |
| WO2016063351A1 (en) | Charge/discharge management device | |
| JP6547374B2 (en) | Power estimation apparatus and power estimation method | |
| KR101696266B1 (en) | Home Energy Management System based on SEP 2.0 | |
| US9983024B2 (en) | Determining a load meter installation location in an energy generation system | |
| JP6357414B2 (en) | Energy management system, control method, smart meter, and energy management device | |
| JP6519783B2 (en) | Autonomous distributed voltage control system | |
| CN112398174A (en) | Method, device, controller and system for determining maximum output power of power generation system | |
| EP3987621A1 (en) | Method and system for estimation and monitoring of distributed network conditions | |
| JP2019176544A (en) | Collection device, and power data interpolation method |
Legal Events
| Date | Code | Title | Description |
|---|---|---|---|
| A621 | Written request for application examination |
Free format text: JAPANESE INTERMEDIATE CODE: A621 Effective date: 20201026 |
|
| A977 | Report on retrieval |
Free format text: JAPANESE INTERMEDIATE CODE: A971007 Effective date: 20210831 |
|
| A131 | Notification of reasons for refusal |
Free format text: JAPANESE INTERMEDIATE CODE: A131 Effective date: 20210907 |
|
| A521 | Request for written amendment filed |
Free format text: JAPANESE INTERMEDIATE CODE: A523 Effective date: 20211105 |
|
| A131 | Notification of reasons for refusal |
Free format text: JAPANESE INTERMEDIATE CODE: A131 Effective date: 20211124 |
|
| A521 | Request for written amendment filed |
Free format text: JAPANESE INTERMEDIATE CODE: A523 Effective date: 20220107 |
|
| TRDD | Decision of grant or rejection written | ||
| A01 | Written decision to grant a patent or to grant a registration (utility model) |
Free format text: JAPANESE INTERMEDIATE CODE: A01 Effective date: 20220118 |
|
| A61 | First payment of annual fees (during grant procedure) |
Free format text: JAPANESE INTERMEDIATE CODE: A61 Effective date: 20220203 |
|
| R150 | Certificate of patent or registration of utility model |
Ref document number: 7020962 Country of ref document: JP Free format text: JAPANESE INTERMEDIATE CODE: R150 |