JP6991833B2 - Causal relationship model construction system and method - Google Patents
Causal relationship model construction system and method Download PDFInfo
- Publication number
- JP6991833B2 JP6991833B2 JP2017210964A JP2017210964A JP6991833B2 JP 6991833 B2 JP6991833 B2 JP 6991833B2 JP 2017210964 A JP2017210964 A JP 2017210964A JP 2017210964 A JP2017210964 A JP 2017210964A JP 6991833 B2 JP6991833 B2 JP 6991833B2
- Authority
- JP
- Japan
- Prior art keywords
- data
- monitor data
- causal relationship
- relationship model
- allowable range
- Prior art date
- Legal status (The legal status is an assumption and is not a legal conclusion. Google has not performed a legal analysis and makes no representation as to the accuracy of the status listed.)
- Active
Links
Images


Classifications
-
- G—PHYSICS
- G05—CONTROLLING; REGULATING
- G05B—CONTROL OR REGULATING SYSTEMS IN GENERAL; FUNCTIONAL ELEMENTS OF SUCH SYSTEMS; MONITORING OR TESTING ARRANGEMENTS FOR SUCH SYSTEMS OR ELEMENTS
- G05B23/00—Testing or monitoring of control systems or parts thereof
- G05B23/02—Electric testing or monitoring
- G05B23/0205—Electric testing or monitoring by means of a monitoring system capable of detecting and responding to faults
- G05B23/0218—Electric testing or monitoring by means of a monitoring system capable of detecting and responding to faults characterised by the fault detection method dealing with either existing or incipient faults
- G05B23/0243—Electric testing or monitoring by means of a monitoring system capable of detecting and responding to faults characterised by the fault detection method dealing with either existing or incipient faults model based detection method, e.g. first-principles knowledge model
- G05B23/0245—Electric testing or monitoring by means of a monitoring system capable of detecting and responding to faults characterised by the fault detection method dealing with either existing or incipient faults model based detection method, e.g. first-principles knowledge model based on a qualitative model, e.g. rule based; if-then decisions
- G05B23/0248—Causal models, e.g. fault tree; digraphs; qualitative physics
-
- G—PHYSICS
- G05—CONTROLLING; REGULATING
- G05B—CONTROL OR REGULATING SYSTEMS IN GENERAL; FUNCTIONAL ELEMENTS OF SUCH SYSTEMS; MONITORING OR TESTING ARRANGEMENTS FOR SUCH SYSTEMS OR ELEMENTS
- G05B19/00—Program-control systems
- G05B19/02—Program-control systems electric
- G05B19/418—Total factory control, i.e. centrally controlling a plurality of machines, e.g. direct or distributed numerical control [DNC], flexible manufacturing systems [FMS], integrated manufacturing systems [IMS] or computer integrated manufacturing [CIM]
- G05B19/41885—Total factory control, i.e. centrally controlling a plurality of machines, e.g. direct or distributed numerical control [DNC], flexible manufacturing systems [FMS], integrated manufacturing systems [IMS] or computer integrated manufacturing [CIM] characterised by modeling, simulation of the manufacturing system
-
- G—PHYSICS
- G06—COMPUTING OR CALCULATING; COUNTING
- G06Q—INFORMATION AND COMMUNICATION TECHNOLOGY [ICT] SPECIALLY ADAPTED FOR ADMINISTRATIVE, COMMERCIAL, FINANCIAL, MANAGERIAL OR SUPERVISORY PURPOSES; SYSTEMS OR METHODS SPECIALLY ADAPTED FOR ADMINISTRATIVE, COMMERCIAL, FINANCIAL, MANAGERIAL OR SUPERVISORY PURPOSES, NOT OTHERWISE PROVIDED FOR
- G06Q50/00—Information and communication technology [ICT] specially adapted for implementation of business processes of specific business sectors, e.g. utilities or tourism
- G06Q50/04—Manufacturing
-
- G—PHYSICS
- G05—CONTROLLING; REGULATING
- G05B—CONTROL OR REGULATING SYSTEMS IN GENERAL; FUNCTIONAL ELEMENTS OF SUCH SYSTEMS; MONITORING OR TESTING ARRANGEMENTS FOR SUCH SYSTEMS OR ELEMENTS
- G05B2219/00—Program-control systems
- G05B2219/30—Nc systems
- G05B2219/49—Nc machine tool, till multiple
- G05B2219/49011—Machine 2-D slices, build 3-D model, laminated object manufacturing LOM
-
- Y—GENERAL TAGGING OF NEW TECHNOLOGICAL DEVELOPMENTS; GENERAL TAGGING OF CROSS-SECTIONAL TECHNOLOGIES SPANNING OVER SEVERAL SECTIONS OF THE IPC; TECHNICAL SUBJECTS COVERED BY FORMER USPC CROSS-REFERENCE ART COLLECTIONS [XRACs] AND DIGESTS
- Y02—TECHNOLOGIES OR APPLICATIONS FOR MITIGATION OR ADAPTATION AGAINST CLIMATE CHANGE
- Y02P—CLIMATE CHANGE MITIGATION TECHNOLOGIES IN THE PRODUCTION OR PROCESSING OF GOODS
- Y02P90/00—Enabling technologies with a potential contribution to greenhouse gas [GHG] emissions mitigation
- Y02P90/02—Total factory control, e.g. smart factories, flexible manufacturing systems [FMS] or integrated manufacturing systems [IMS]
Landscapes
- Engineering & Computer Science (AREA)
- Manufacturing & Machinery (AREA)
- Physics & Mathematics (AREA)
- General Physics & Mathematics (AREA)
- Automation & Control Theory (AREA)
- General Engineering & Computer Science (AREA)
- Quality & Reliability (AREA)
- Business, Economics & Management (AREA)
- General Health & Medical Sciences (AREA)
- Economics (AREA)
- Health & Medical Sciences (AREA)
- Human Resources & Organizations (AREA)
- Marketing (AREA)
- Primary Health Care (AREA)
- Strategic Management (AREA)
- Tourism & Hospitality (AREA)
- General Business, Economics & Management (AREA)
- Theoretical Computer Science (AREA)
- Testing And Monitoring For Control Systems (AREA)
- General Factory Administration (AREA)
Description
本発明は、情報処理技術に関する。また、本発明は、製造支援等のためのモデル構築技術に関する。 The present invention relates to information processing technology. The present invention also relates to a model construction technique for manufacturing support and the like.
製造支援等のために、計算機システム上で、因果関係モデル等のモデルを構築する技術がある。この技術では、製造フローの各工程から得られるモニタデータに基づいて、因果関係モデルを構築し、製造品質(例えば検査工程で得られる検査結果品質値)を高めることができるように、好適な制御データ等を予測する。 There is a technology to build a model such as a causal relationship model on a computer system for manufacturing support. In this technique, suitable control is performed so that a causal relationship model can be constructed based on monitor data obtained from each process of the manufacturing flow and the manufacturing quality (for example, the inspection result quality value obtained in the inspection process) can be improved. Predict data etc.
上記モデル構築に関する先行技術例としては、特開2007-4728号公報(特許文献1)、特開2004-178247号公報(特許文献2)が挙げられる。特許文献1には、物理現象が複雑で非線形性が強い製造プロセスの時系列データベースに対し、指定した操業条件と類似の過去の操業事例を検索し、検索結果から将来状態を予測して操業状態を制御する旨が記載されている。特許文献2には、実機の計測工数を削減する旨が記載されている。
Examples of the prior art related to the above model construction include JP-A-2007-4728 (Patent Document 1) and JP-A-2004-178247 (Patent Document 2). In
例えば、製造業では、製造品質向上のために、製造ラインの最終検査工程における検査結果(言い換えると製造品質)が、製品規格値範囲内に入るように、製造フローの各工程を制御する必要がある。例えば、製造フローの各工程で、製造装置の設定条件(制御データともいう)の適正範囲や、センサの検出値(観測データともいう)の適正範囲を、特定し、制御する必要がある。以下、制御データや観測データを、モニタデータと記載する場合がある。 For example, in the manufacturing industry, in order to improve manufacturing quality, it is necessary to control each process of the manufacturing flow so that the inspection result (in other words, manufacturing quality) in the final inspection process of the manufacturing line is within the product standard value range. be. For example, in each process of the manufacturing flow, it is necessary to specify and control the appropriate range of the setting condition (also referred to as control data) of the manufacturing apparatus and the appropriate range of the detection value (also referred to as observation data) of the sensor. Hereinafter, control data and observation data may be referred to as monitor data.
その際、製造フローが複数の工程から成る場合、製品品質に影響する工程が複数存在する。そのため、特に、製造フローにおける投入直後の上流の工程においては、製造品質(検査結果)と、モニタデータ(製造装置の制御データや観測データ)との間の関係性を定量化することが難しい。言い換えると、上流の工程で制御データや観測データがどのような範囲や値であれば、下流の工程での検査結果で製造品質を高くできるか、因果関係等の定量化が難しい。 At that time, when the manufacturing flow consists of a plurality of processes, there are a plurality of processes that affect the product quality. Therefore, it is difficult to quantify the relationship between the manufacturing quality (inspection result) and the monitor data (control data and observation data of the manufacturing apparatus), especially in the upstream process immediately after the input in the manufacturing flow. In other words, it is difficult to quantify the causal relationship, etc., as to what range and value the control data and observation data in the upstream process can improve the manufacturing quality from the inspection results in the downstream process.
なお、特許文献1では、過去のモニタデータを用いて、回帰モデルを構築し、制御データ値を決定する旨が読み取れる。しかし、特許文献1の方法では、回帰を用いているため、予測値を算出するために、モデル構築時に用いた、全てのデータ項目を入力する必要がある。そのため、投入直後の上流の工程において予測値を算出することはできず、制御を実行することができない。特許文献1では、観測データの許容範囲を算出する旨は記載されていない。
In
また、特許文献2では、実測データと物理的な性質を考慮した物理モデルを元に品質影響予測を行うモデルを修正する旨が読み取れる。しかし、特許文献2の方法では、モデルを修正する際にモデル全体を修正する必要がある。この方法では、大規模な製造工程を対象とする場合、実時間で計算が終了しない場合が考えられる。特許文献2では、モデルの一部分を特定してその一部分を修正する旨は記載されていない。
Further, in
本発明の目的は、製造支援等のための因果関係モデル構築技術に関して、モデルの予測精度を向上でき、その結果として製造品質等を向上することができる技術を提供することである。 It is an object of the present invention to provide a technique for constructing a causal relationship model for manufacturing support and the like, which can improve the prediction accuracy of the model and, as a result, improve the manufacturing quality and the like.
本発明のうち代表的な実施の形態は、因果関係モデル構築システム等であって、以下に示す構成を有することを特徴とする。 A typical embodiment of the present invention is a causal relationship model construction system or the like, and is characterized by having the following configurations.
一実施の形態の因果関係モデル構築システムは、計算機システム上に構成され、制御対象の製造フローに関する因果関係モデルを構築する情報処理を行う因果関係モデル構築システムであって、前記計算機システムは、前記製造フローの複数の各々の工程の状態を表すモニタデータと、前記製造フローのうちの検査工程の結果の品質データとを用いて、前記因果関係モデルを構築し、前記因果関係モデルと、前記品質データの目標値とを用いて、複数のモニタデータの間の因果関係に基づいた予測から、前記目標値を満たすように、前記モニタデータの許容範囲を特定し、前記因果関係モデル、および前記モニタデータの許容範囲を含む情報を、画面にグラフィカルに図示して表示する。 The causal relationship model construction system of one embodiment is configured on a computer system and is a causal relationship model construction system that performs information processing to construct a causal relationship model related to a controlled manufacturing flow, and the computer system is the above-mentioned computer system. The causal relationship model is constructed by using the monitor data representing the state of each of a plurality of manufacturing flows and the quality data of the result of the inspection process in the manufacturing flow, and the causal relationship model and the quality are used. From the prediction based on the causal relationship between the plurality of monitor data using the target value of the data, the allowable range of the monitor data is specified so as to satisfy the target value, the causal relationship model, and the monitor. Information including the allowable range of data is displayed graphically on the screen.
本発明のうち代表的な実施の形態によれば、製造支援等のための因果関係モデル構築技術に関して、モデルの予測精度を向上でき、その結果として製造品質等を向上することができる。 According to a typical embodiment of the present invention, it is possible to improve the prediction accuracy of the model with respect to the causal relationship model construction technique for manufacturing support and the like, and as a result, the manufacturing quality and the like can be improved.
以下、本発明の実施の形態を図面に基づいて詳細に説明する。なお、実施の形態を説明するための全図において同一部には原則として同一符号を付し、その繰り返しの説明は省略する。 Hereinafter, embodiments of the present invention will be described in detail with reference to the drawings. In principle, the same parts are designated by the same reference numerals in all the drawings for explaining the embodiments, and the repeated description thereof will be omitted.
[課題等]
課題等について補足説明する。
[Issues, etc.]
A supplementary explanation will be given regarding issues.
(1) 従来技術例では、最終的な検査結果の製造品質のみから、製造フローの各工程の制御データや観測データの好適な値や範囲を決める必要がある。検査結果の値から、各工程(特に上流の工程)の制御データや観測データの好適な範囲を定量化することが難しい。制御データや観測データの間の因果関係の定量化が難しい。各工程の制御データや観測データの好適な範囲を決定するための方法として、因果関係モデルを用いる方法が考えられる。 (1) In the prior art example, it is necessary to determine suitable values and ranges of control data and observation data of each process of the manufacturing flow only from the manufacturing quality of the final inspection result. It is difficult to quantify the suitable range of control data and observation data of each process (particularly upstream process) from the values of the inspection results. It is difficult to quantify the causal relationship between control data and observation data. As a method for determining a suitable range of control data and observation data of each process, a method using a causal relationship model can be considered.
(2) また、従来技術例では、ある因果関係モデルを構築した場合でも、因果関係に基づいた検査結果の予測に関する予測精度の点で改善余地がある。因果関係モデルのうち、予測精度が相対的に低い部分(低精度部分等と記載する場合がある)が含まれている場合がある。従来技術例では、そのような部分の特定は行われていない。そのような部分を特定して、より高精度の予測モデルに修正、置換等することができれば、更新された因果関係モデルによってさらに予測精度を高めることができる。 (2) Further, in the prior art example, even when a certain causal relationship model is constructed, there is room for improvement in the prediction accuracy regarding the prediction of the inspection result based on the causal relationship. Of the causal relationship model, a part with relatively low prediction accuracy (may be described as a low-precision part, etc.) may be included. In the prior art example, such a part is not specified. If such a part can be identified and modified or replaced with a more accurate prediction model, the updated causal relationship model can further improve the prediction accuracy.
(実施の形態)
図1~図14を用いて、本発明の実施の形態の因果関係モデル構築システム等について説明する。実施の形態の因果関係モデル構築システム(以下、単にシステムと記載する場合がある)は、計算機で実現される。実施の形態の因果関係モデル構築方法は、実施の形態の因果関係モデル構築システム上で実行されるステップを有する方法である。
(Embodiment)
The causal relationship model construction system and the like of the embodiment of the present invention will be described with reference to FIGS. 1 to 14. The causal relationship model construction system of the embodiment (hereinafter, may be simply referred to as a system) is realized by a computer. The causal relationship model construction method of the embodiment is a method having steps executed on the causal relationship model construction system of the embodiment.
[前提や概要]
実施の形態の因果関係モデル構築システムでは、製造ラインにおける投入直後の上流の工程から下流の工程まで、例えば最終の品質検査工程までの一連の製造フローに沿って、モニタデータ間の因果関係モデルを構築する。モニタデータは、因果関係モデル構築のために製造フロー上でモニタするデータであり、工程の状態を表すデータである。モニタデータは、製造装置の制御データである場合や、センサの観測データである場合を含む。制御データは、製造装置の設定条件等のデータであり、言い換えると工程に対する入力値である。観測データは、言い換えると工程からの出力値である。また、モニタデータは、対応する工程が検査工程である場合には検査結果データ(品質データともいう)を含む。また、モニタデータは、製造フローから製造の実績として取得されるデータ(取得データと記載する)の場合と、未取得のデータの場合とがある。未取得のデータの場合には、取得データおよびモデルに基づいて予測されるデータ(予測データと記載する)である。
[Premises and outline]
In the causal relationship model construction system of the embodiment, a causal relationship model between monitor data is created along a series of manufacturing flows from the upstream process immediately after input to the downstream process in the production line, for example, to the final quality inspection process. To construct. The monitor data is data to be monitored on the manufacturing flow for constructing a causal relationship model, and is data representing the state of the process. The monitor data includes the case where it is the control data of the manufacturing apparatus and the case where it is the observation data of the sensor. The control data is data such as setting conditions of the manufacturing apparatus, in other words, is an input value for the process. The observation data is, in other words, the output value from the process. Further, the monitor data includes inspection result data (also referred to as quality data) when the corresponding process is an inspection process. Further, the monitor data may be data acquired as manufacturing results from the manufacturing flow (described as acquired data) or unacquired data. In the case of unacquired data, it is the acquired data and the data predicted based on the model (referred to as predicted data).
本システムでは、この因果関係モデルを用いて、例えば上流の工程における製造装置の設定条件(制御データ)から、製品の品質(検査結果)を予測し、製造装置の設定条件等の適正範囲(モニタデータ許容範囲)を特定する。また、本システムでは、その予測の際に、予測誤差が大きく、モニタデータ許容範囲の特定が困難だった場合には、品質目標値に対して予測誤差が大きく生じている箇所(構造部)を、低精度部分として特定する。本システムは、その低精度部分の特定の際、予測値と目標値(または許容範囲)との差に基づいて特定を行う。そして、本システムは、その低精度部分を、置換対象部分として、より高精度な予測モデルに置換(変換、修正等)する。これにより、変換後の予測モデルを含む、更新後の因果関係モデルを用いて、品質に関する予測精度を向上することができる。例えば、製造装置の設定条件の適正範囲等を、好適に設定することができる。 In this system, using this causal relationship model, for example, the quality of the product (inspection result) is predicted from the setting conditions (control data) of the manufacturing equipment in the upstream process, and the appropriate range (monitoring) of the setting conditions of the manufacturing equipment is predicted. Data tolerance) is specified. In addition, in this system, when the prediction error is large and it is difficult to specify the monitor data allowable range, the part (structural part) where the prediction error is large with respect to the quality target value is determined. , Specified as a low precision part. This system identifies the low-precision part based on the difference between the predicted value and the target value (or allowable range). Then, this system replaces the low-precision part with a more accurate prediction model (conversion, correction, etc.) as a replacement target part. This makes it possible to improve the prediction accuracy regarding quality by using the updated causal relationship model including the converted prediction model. For example, an appropriate range of setting conditions of the manufacturing apparatus can be preferably set.
本システムは、モニタデータ(品質データを含む)に基づいて、因果関係モデルを構築し、画面に表示する。本システムは、その因果関係モデルを用いて、上流の工程のモニタデータから下流の工程の検査結果の品質を予測する。本システムは、検査結果の品質が好適な値になるように、すなわち目標値を満たすように、上流の各工程のモニタデータの許容範囲を算出、特定する。本システムは、特定したモニタデータ許容範囲を含む情報を、画面でグラフィカルに図示して表示する。 This system builds a causal relationship model based on monitor data (including quality data) and displays it on the screen. This system predicts the quality of the inspection result of the downstream process from the monitor data of the upstream process by using the causal relationship model. This system calculates and specifies the permissible range of monitor data of each upstream process so that the quality of the inspection result becomes an appropriate value, that is, the target value is satisfied. The system graphically displays and displays information including the specified monitor data tolerance on the screen.
また、本システムは、モニタデータ許容範囲の特定に伴い、予測精度の低い部分(低精度部分と記載する)を特定し、より高精度な予測モデルへの置換対象部分とする。本システムは、特定した低精度部分(置換対象部分)の情報を、画面で表示する。本システムは、特定した低精度部分(置換対象部分)を、より高精度な予測モデルに変換し、その変換後の予測モデルの情報を、画面でグラフィカルに図示して表示する。 In addition, this system identifies a part with low prediction accuracy (described as a low-precision part) as the monitor data allowable range is specified, and sets it as a replacement target part with a more accurate prediction model. This system displays the information of the specified low-precision part (replacement target part) on the screen. This system converts the specified low-precision part (replacement target part) into a more accurate prediction model, and displays the information of the converted prediction model graphically on the screen.
[因果関係モデル構築システム-計算機]
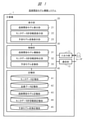
図1は、実施の形態の因果関係モデル構築システムにおける、計算機1の構成として、特に機能ブロックを示す。計算機1は、一般的なPCやサーバ等で構成できる。計算機1は、例えばソフトウェアプログラム実行処理によって、実施の形態での特徴的な各処理部等を実現する。計算機1は、通信網を介したクライアントサーバシステムやクラウドコンピューティングシステム等で構成されてもよい。
[Causal relationship model construction system-computer]
FIG. 1 shows a functional block as a configuration of a
計算機1は、入出力部11、通信部12、表示部20、制御部30、記憶部40等を有し、それらがバス等で接続されている。入出力部11は、図示しない入力装置(例えばキーボードやマウス)、表示装置や他の出力装置(例えばプリンタ)が接続されており、ユーザの操作を受け付ける。入出力部11の表示装置の画面には、ユーザの操作に応じて本システムの各種の情報が表示される。画面は、表示部20によって構成され、本システムのGUI(グラフィカル・ユーザ・インタフェース)として機能する。画面では、因果関係モデル設定項目等の各種の項目が表示され、GUI部品を通じてユーザが入力可能である。画面では、特定されたモニタデータ許容範囲(観測データ許容範囲や制御データ最適値等)や、特定された低精度部分および変換後の予測モデル等の情報が表示される。
The
本システムの計算機1は、ユーザであるシステムエンジニア(SE)等の人が操作し、利用する。ユーザは、製造ラインの製造フローから、モニタデータを取得する。取得の仕方は任意である。例えば、製造装置やセンサから出力されるファイルを利用できる。なお、計算機1が、製造フローの製造装置やセンサから、通信を介してモニタデータを取得してもよい。ユーザは、本システムによって得られた因果関係モデル、モニタデータ許容範囲、変換後予測モデル等を用いて、製造フローに対して好適な制御データや観測データの範囲や値を提示し、製造の制御に反映することができる。
The
通信部12は、計算機1の外部の通信網に対する通信インタフェース装置を含み、外部のサーバや製造装置等と通信する。通信部12は、制御部30からの制御に従って、外部のサーバや製造装置等から、モニタデータや製造工程情報等を取得、参照してもよい。
The
表示部20は、因果関係モデル、モニタデータ許容範囲、および低精度部分の変換後予測モデル等の情報を、ユーザに対して可視化する画面(GUI画面)を構成し、入出力部11を通じて表示する。
The
制御部30は、例えばCPU、ROM、RAM等の公知の要素により構成され、本システムの特徴的な機能を実現するための処理を行う部分である。例えば、CPUは、ROMからプログラムをRAMに読み出して処理を実行することにより、因果関係モデル構築部31等の処理部を実現する。制御部30は、因果関係モデル構築部31、モニタデータ許容範囲特定部32、予測モデル変換部33を有する。
The
因果関係モデル構築部31は、モニタデータ記憶部41に記憶されているモニタデータ(制御データや観測データ)と、品質データ記憶部42に記憶されている品質データ(モニタデータの一種である検査結果データ)とを用いて、因果関係モデルを構築する処理を行う。
The causal relationship
モニタデータ許容範囲特定部32は、因果関係モデル構築部31で得られた因果関係モデルの構造と、モニタデータ記憶部41のモニタデータ(制御データや観測データ)と、品質データ記憶部42の品質データとを用いて、工程毎のモニタデータ許容範囲を算出、特定する処理を行う。モニタデータ許容範囲特定部32は、品質(検査結果)の向上のための目標値に対応するモニタデータ許容範囲を算出、特定する。モニタデータ許容範囲は、観測データ許容範囲の場合と、制御データ許容範囲の場合とを含む。制御データ許容範囲は、最適値(推奨制御値)を含む場合がある。モニタデータ許容範囲特定部32は、下流の工程に対応するモデル構造部(ノード等)から上流の工程に対応するモデル構造部(ノード等)へと因果関係を遡りながら、モニタデータ許容範囲を算出する。
The monitor data allowable
予測モデル変換部33は、モニタデータ許容範囲特定部32で得られたモニタデータ許容範囲と、因果関係モデル構築部31で得られた因果関係モデルとに、モニタデータ記憶部41のモニタデータと品質データ記憶部42の品質データとを入力して予測した結果を比較する。予測モデル変換部33は、モニタデータの予測値の範囲が、モニタデータ許容範囲を逸脱する場合、低精度部分(置換対象部分)として特定し、その低精度部分を、より高精度な予測モデルに変換する処理を行う。
The prediction
記憶部40は、モニタデータ記憶部41、品質データ記憶部42、因果関係モデル記憶部43、モニタデータ許容範囲記憶部44、予測モデル変換記憶部45を有する。モニタデータ記憶部41にはモニタデータが格納されている。品質データ記憶部42には品質データが格納されている。因果関係モデル記憶部43には、因果関係モデルデータが格納されている。モニタデータ許容範囲記憶部44には、モニタデータ許容範囲を含む情報が格納されている。予測モデル変換記憶部45には、低精度部分情報、変換後の予測モデルのデータおよび情報が格納されている。
The
[製造フローおよび因果関係モデル]
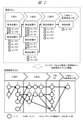
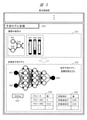
図2は、製造フローおよび因果関係モデルの構成例を示す。図2では、前提となる製造フローとの関係に基づいて、基本的な因果関係モデルがどのように生成されるかについて示している。図2の上側には、製造フローを示し、下側には、その製造フローに対応して生成された因果関係モデルを示す。
[Manufacturing flow and causal relationship model]
FIG. 2 shows a configuration example of a manufacturing flow and a causal relationship model. FIG. 2 shows how a basic causal relationship model is generated based on the relationship with the presupposed manufacturing flow. The upper side of FIG. 2 shows the manufacturing flow, and the lower side shows the causal relationship model generated corresponding to the manufacturing flow.
図2の上側で、製造フローは、上流から下流への複数の工程から構成される。本例では、工程#1,工程#2,工程#3,工程#L(=#4)を有する。本例では、最後の工程#Lは、品質検査工程である。各工程には、1つ以上の製造装置(設備)や1つ以上のセンサが、関係付けて設けられている。工程#Lの品質検査工程には、検査装置およびセンサが設けられており、検査結果データ(品質データ)を出力する。例えば、工程#1では、製造装置#1、製造装置#2を有する。製造装置#1は、工程#1での製造を、設定されている制御データ(制御条件等)に従って制御する。製造装置#1は、例えばセンサA、センサBといった2つのセンサを備える。センサAは、工程#1での製造から、所定の検出を行い、観測データとして出力する。同様に、各工程に、製造装置やセンサが設けられており、工程の順序等に従って接続されている。
On the upper side of FIG. 2, the manufacturing flow is composed of a plurality of steps from upstream to downstream. In this example, it has
なお、説明上、製造フローの最後の工程(工程#L)として品質検査工程を有する方式とする。また、そのため、モニタデータの一部、一種として、品質検査工程で得られる検査結果データ(品質データ)を含む。これらに限るものではなく、製造フローとは独立に、続いて品質検査フローおよびその品質検査工程が存在する方式でもよく、同様に成立する。 For the sake of explanation, a method having a quality inspection process as the final process (process # L) of the manufacturing flow is used. Therefore, as a part of the monitor data, the inspection result data (quality data) obtained in the quality inspection process is included. The method is not limited to these, and a method in which a quality inspection flow and a quality inspection process thereof exist independently of the manufacturing flow may be used, and the same applies.
実施の形態の因果関係モデル構築システムは、上記のような製造フローから、モニタデータとして、制御データ、観測データ、品質データを取得する。例えば、ユーザが、因果関係モデル構築の設定の際に、モニタデータを入力、設定する。実施の形態の因果関係モデル構築システムは、モニタデータおよび製造工程情報に基づいて、因果関係モデルを構築する。なお、製造工程情報は、各モニタデータが製造フローのどの工程のどの製造装置やセンサに関係付けられているか等を把握可能とする情報である。 The causal relationship model construction system of the embodiment acquires control data, observation data, and quality data as monitor data from the manufacturing flow as described above. For example, the user inputs and sets monitor data when setting the causal relationship model construction. The causal relationship model construction system of the embodiment constructs a causal relationship model based on monitor data and manufacturing process information. The manufacturing process information is information that makes it possible to grasp which manufacturing device or sensor in which process of the manufacturing flow each monitor data is associated with.
図2の下側で、本発明で扱うモデルは因果関係モデルである。因果関係モデルは、構造としては、ネットワーク構造、すなわちノードとエッジ(矢印)との接続によって表現できる。各モニタデータは、モデル構造上では、ノードとして表現される。エッジは、因果関係の向きを表す。本例では、モニタデータとして上側のセンサA~Rの観測データを用いた場合の因果関係モデルを示す。例えば、工程#1に対応するモデル構造部では、センサAの観測データに対応するノード(ノードAとする)から、ノードB、ノードCに接続されている。ノードBはノードCに接続されている。ノードCは、ノードD、ノードGに接続されている。
At the bottom of FIG. 2, the model dealt with in the present invention is a causal relationship model. The causal relationship model can be expressed as a network structure, that is, a connection between a node and an edge (arrow). Each monitor data is represented as a node in the model structure. The edge represents the direction of the causal relationship. In this example, a causal relationship model is shown when the observation data of the upper sensors A to R are used as the monitor data. For example, in the model structure unit corresponding to the
[処理フロー]
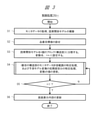
図3は、制御部30の主な処理のフローを示す。図3は、ステップS1~S6を有する。以下、ステップの順に説明する。
[Processing flow]
FIG. 3 shows the main processing flow of the
(S1) まず、制御部30の因果関係モデル構築部31は、製造フローの工程の設備やセンサから、モニタデータとして制御データや観測データを取得し、また、品質検査工程の設備やセンサから品質データを取得する。この際、ユーザが、後述のように設定画面でモニタデータを指定してもよい。なお、モニタデータ(制御データや観測データ)と品質データとを分けて説明する場合がある。因果関係モデル構築部31は、取得したモニタデータを、モニタデータ記憶部41に記憶し、取得した品質データを、品質データ記憶部42に記憶する。制御部30の因果関係モデル構築部31は、入力のモニタデータを用いて、因果関係モデルを構築する。因果関係モデル構築部31は、構築した因果関係モデルのデータを、因果関係モデル記憶部43に記憶する。
(S1) First, the causal relationship
(S2) 次に、制御部30は、品質目標値を設定する。例えば、ユーザが、画面で、品質目標値を設定する。または、制御部30が、品質目標値等の設定ファイルを読み出して参照してもよい。
(S2) Next, the
(S3) 続いて、制御部30は、S1で構築した因果関係モデルにおける構造を、n個の構造部(ブロックともいう)に分割する処理を行う。上流のブロックから下流のブロックへ順に、ブロックの識別子を、1~nとする。そして、制御部30は、制御処理用の変数iを用いて、i=nと設定する。これは、製造フローの下流から上流へ遡って処理するために、最初に最後のブロックnが設定されるものである。分割処理の詳細については後述する(図9)。
(S3) Subsequently, the
(S4) 制御部30は、i番目のブロック(構造部)について、モニタデータ許容範囲を特定する処理、および予測モデル変換処理の判定を行って、変数iの値を更新する。なお、S4の処理詳細例については後述する(図8)。
(S4) The
モニタデータ許容範囲特定処理は、概略的には以下のような処理である。モニタデータ許容範囲特定部32は、モニタデータ毎に、下流のノードのモニタデータの算出済みの許容範囲または品質データの目標値を満たすように、そのモニタデータの許容範囲を特定する。制御部30は、因果関係モデルにおけるあるノードと、因果関係に基づいた前後のノードとをみる。制御部30は、あるノードの後ろ(下流側)のノードのモニタデータの目標値または算出済みの許容範囲を参照する。制御部30は、あるノードのモニタデータの値を変化させた場合に、後ろのノードのモニタデータの目標値または許容範囲を満たすかどうかをみる。制御部30は、そのような条件を満たすような値の範囲を、そのノードのモニタデータ許容範囲として特定する。同様に、制御部30は、処理上注目するノードを、モニタデータ許容範囲を算出済みのノードから、上流側のノードに移して、そのノードと下流のノードとの関係で、同様に許容範囲を特定する。
The monitor data permissible range specifying process is generally the following process. The monitor data permissible
予測モデル変換処理における低精度部分特定処理は、概略的には以下のような処理である。予測モデル変換部33は、モニタデータ許容範囲特定処理の結果として得られる各モニタデータの許容範囲を用いる。予測モデル変換部33は、上記処理の結果として、あるノードについて下流のノードから特定されるモニタデータ許容範囲を得る。また、予測モデル変換部33は、そのノードについて、上流のノードから予測される予測値の範囲を得る。予測モデル変換部33は、その予測値の範囲とそのモニタデータ許容範囲とを比較して、その予測値の範囲がそのモニタデータ許容範囲を逸脱する場合(例えば空集合となる場合)、そのノードのモニタデータを、低精度部分として特定する。なお、ノード単位での特定に限らず、複数のノードを含むモデル構造部として概略的に特定してもよい。
The low-precision partial identification process in the predictive model transformation process is roughly as follows. The prediction
(S5) 制御部30は、続いて、変数iの値が1かどうかを確認する。この確認結果によって次の処理が変更される。i=1の場合(Y)、すなわち一番前のブロックになっている場合には、因果関係モデルの全てのブロックについてモニタデータ許容範囲等を特定したと判定し、S6へ移る。i=1ではない場合(N)には、S4へ戻って同様に繰り返す。
(S5) The
(S6) 制御部30は、表示部20を制御して、画面表示内容を更新させる。すなわち、画面には、特定されたモニタデータ許容範囲、あるいは特定された低精度部分とその変換後の予測モデルの情報が表示される。ユーザの操作に応じて処理を終了する。
(S6) The
[画面]
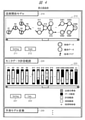
図4、図5は、因果関係モデル構築システムにおける表示部20によって表示される主な表示画面例を示す。この画面では、因果関係モデル表示210、モニタデータ許容範囲表示220、および予測モデル変換表示230といった主に3つの表示部分を含む。
[screen]
4 and 5 show an example of a main display screen displayed by the
図4で、画面内には、因果関係モデル表示210、モニタデータ許容範囲表示220、予測モデル変換表示230を有する。
In FIG. 4, the screen has a causal
[画面-因果関係モデル表示]
因果関係モデル表示210は、因果関係モデル構築部31によって得られた因果関係モデルを、ネットワーク構造で表示する部分である。因果関係モデル表示部21は、領域213に、その因果関係モデルを表示する。因果関係モデル表示210は、領域213、設定(Setting)ボタン211、構築(Build)ボタン212等を含む。
[Screen-Causality model display]
The causal
まず、ユーザが設定(Setting)ボタン211を押下した場合、因果関係モデルを構築する際の条件等を入力するための設定画面(図6)が、ポップアップ等で表示される。
First, when the user presses the setting (Setting)
[設定画面-因果関係モデル構築]
図6で、因果関係モデル構築の設定画面の例を示す。この画面では、使用するデータ(モニタデータ)の設定欄601や、因果関係モデル構築条件の設定欄602を有する。設定欄601では、因果関係モデルを構築する際に使用するモニタデータを、例えばファイルを参照する方式等で設定可能である。設定欄602では、条件の設定ファイルを参照する方式や、Viewer(別の設定画面)上で確認しながら設定する方式を用いることができる。後者の場合、因果関係モデルを構築する方式の場合に一般的に用いられる、離散化手法、構造学習アルゴリズム、制約条件の使用の有無等を、ユーザが選択枝から選択して設定できる。これらの方式は公知技術を用いることができる。ユーザは、条件を設定した後、OKボタン603を押下する。これにより、制御部30の処理によって、その条件が反映される。Cancelボタン604を押下した場合、その条件は反映されず、設定画面を開く前の状態に戻る。
[Setting screen-Causal relationship model construction]
FIG. 6 shows an example of a setting screen for constructing a causal relationship model. This screen has a setting field 601 for data (monitor data) to be used and a setting field 602 for causal relationship model construction conditions. In the setting field 601 the monitor data used when constructing the causal relationship model can be set by, for example, a method of referring to a file. In the setting field 602, a method of referring to the condition setting file or a method of setting while checking on the Viewer (another setting screen) can be used. In the latter case, the user can select and set the discretization method, the structural learning algorithm, whether or not the constraint condition is used, and the like, which are generally used in the case of the method for constructing the causal relationship model. Known techniques can be used for these methods. After setting the conditions, the user presses the
上記設定画面で条件が設定された場合、制御部30の処理によって、その条件で因果関係モデルが構築される。その結果、その因果関係モデルが、表示部20の因果関係モデル表示部21の処理によって、因果関係モデル表示210の領域213に表示される。なお、領域213において因果関係モデルが表示しきれない場合には、スライドバーや拡大縮小等の公知手段を用いて、ユーザが所望の全体や個別部分を表示可能である。
When a condition is set on the setting screen, the causal relationship model is constructed under the condition by the processing of the
領域213では、因果関係モデルが、ノードとエッジで表現されている。各ノードには、モニタデータのID(モニタデータID)が表示されている。本例では複数のモニタデータとして、ID=X1~X305のデータがある場合を示す。なお、最後のモニタデータX305は品質データY1である。ノード毎に、モニタデータの種別がわかるように、所定の図像で区別して表示される。例えば、制御データと観測データとが、異なる種類のノードとして表現される。また、ノード毎に、取得データであるか未取得データ(すなわち予測データ)であるかがわかるように、例えば取得フラグを付けて表示される。取得フラグが付いたノードは取得データを表し、取得フラグが付いていないノードは予測データを表す。また、情報表示の仕方の他の例としては、ユーザが所望のノードの部分を、選択操作(クリック等)することで、その選択したノード部分に関する情報(後述の記憶部40のモニタデータに基づいて表示可能である)を、ポップアップ等で表示するようにしてもよい。
In
[画面-モニタデータ許容範囲表示]
モニタデータ許容範囲表示220では、モニタデータ許容範囲特定部32によって得られたモニタデータ許容範囲を含む情報が表示される。モニタデータ許容範囲表示部22は、領域223に、そのモニタデータ許容範囲を含む情報を、所定の形式のグラフで表示する。本例では、そのグラフとして、横方向に工程順序に沿ったID順にモニタデータをとり、モニタデータ毎に、棒(矩形領域)で、値や範囲を表現する形式としている。各モニタデータの棒は、見やすいように高さ(上下端)を同じに揃えて表示しているが、このような表示形式に限らず可能である。
[Screen-Monitor data tolerance display]
In the monitor data
モニタデータ許容範囲表示220は、領域223、設定(Setting)ボタン221、計算(Calc.)ボタン222等を含む。ユーザが設定ボタン221を押下した場合、モニタデータ許容範囲を計算する際に使用する条件や、計算後(計算済み)のモニタデータ許容範囲等を表示する画面(図7)が、ポップアップ等で表示される。
The monitor data
モニタデータ許容範囲表示220の領域223のグラフでは、以下のようなことが表現されている。品質データY1の棒の品質目標値を満たすために、その前のモニタデータX304の棒の許容範囲や、モニタデータX303の棒の許容範囲となっている。また、例えばモニタデータX303の許容範囲となるためには、その前のモニタデータX301やモニタデータX302の許容範囲となっている。このように、モニタデータ間の因果関係に基づいて下流から上流へ遡る形でモニタデータ許容範囲が特定されている。モニタデータ許容範囲が広いほど、製造時の制御がしやすい。ユーザは、モニタデータ間の許容範囲等の関係性を画面で見て確認できる。ユーザまたは製造業者は、モニタデータ許容範囲内となるように、製造時の制御データや観測データを制御することができる。
In the graph of the
[設定画面-モニタデータ許容範囲]
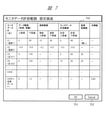
図7は、モニタデータ許容範囲のデータ構成例、および設定画面例を示す。モニタデータ許容範囲記憶部44には、図7中の表700のようなデータが記憶されている。モニタデータ許容範囲表示部22は、モニタデータ許容範囲記憶部44からこのようなモニタデータ許容範囲のデータを読み出して、本設定画面内に表700として表示する。ユーザは、本設定画面で、モニタデータ許容範囲に関する各情報を設定および確認が可能である。
[Setting screen-Monitor data tolerance]
FIG. 7 shows an example of a data configuration of a monitor data allowable range and an example of a setting screen. The monitor data allowable
図7の表700は、列(項目)として、モニタデータID(名)、データ範囲、規格範囲、モニタデータ許容範囲、推奨制御値、目標値(品質目標値)を有する。「モニタデータID(名)」列は、モニタデータIDおよびパラメータ名等を表示する。「データ範囲」列は、取得データ(実績値)の範囲を表示する項目であり、上限値列、下限値列を含む。「データ範囲」列では、取得した各モニタデータの分布から算出された上限値および下限値が格納、表示されている。なお、複数回の製造実行に応じて、同じパラメータ名のモニタデータについても、複数回の値が、実績、統計として得られる。得られた分布における上限値、下限値から、このデータ範囲として算出できる。 Table 700 of FIG. 7 has a monitor data ID (name), a data range, a standard range, a monitor data allowable range, a recommended control value, and a target value (quality target value) as columns (items). The "monitor data ID (name)" column displays the monitor data ID, the parameter name, and the like. The "data range" column is an item for displaying the range of acquired data (actual value), and includes an upper limit value column and a lower limit value column. In the "Data range" column, the upper limit value and the lower limit value calculated from the distribution of each acquired monitor data are stored and displayed. It should be noted that the values of multiple times can be obtained as actual results and statistics even for the monitor data having the same parameter name according to the execution of manufacturing multiple times. It can be calculated as this data range from the upper limit value and the lower limit value in the obtained distribution.
「規格範囲」列は、モニタデータに対して規格範囲または規格値がある場合に設定可能な項目である。「規格範囲」列は、規格上限値列、規格下限値列を含む。この規格範囲は、製造者またはSE等によって任意に設定できる。 The "Standard range" column is an item that can be set when there is a standard range or standard value for the monitor data. The "standard range" column includes a standard upper limit value column and a standard lower limit value column. This standard range can be arbitrarily set by the manufacturer, SE, or the like.
「モニタデータ許容範囲」列は、制御部30によって算出されたモニタデータ許容範囲がある場合に、格納、表示される。「モニタデータ許容範囲」列は、許容上限値列、許容下限値列を含む。モニタデータ許容範囲記憶部44に保存されているモニタデータ許容範囲データがある場合に、この列に反映して表示される。
The "monitor data allowable range" column is stored and displayed when there is a monitor data allowable range calculated by the
「推奨制御値」列は、後述するが、そのモニタデータについての推奨制御値(最適値)が算出された場合に、格納、表示される。 The "recommended control value" column will be described later, but is stored and displayed when the recommended control value (optimum value) for the monitor data is calculated.
「目標値」列は、検査結果の品質データ(製造品質)に関して、目標値がある場合に、品質目標値として設定可能である。本例では、品質データY1に関する目標値として0.90が設定されている。この目標値は、製造者またはSE等によって任意に設定できる。また、この目標値は、制御部30がモニタデータ許容範囲特定処理の際に自動的に調整する場合がある。
The "target value" column can be set as a quality target value when there is a target value for quality data (manufacturing quality) of inspection results. In this example, 0.90 is set as the target value for the quality data Y1. This target value can be arbitrarily set by the manufacturer, SE, or the like. Further, this target value may be automatically adjusted by the
上記設定画面で、ユーザが所望の項目(例えば目標値)を設定した後、OKボタン701を押下した場合、その設定項目が反映される。Cancelボタン702を押下した場合、その設定項目は反映されず、設定画面を開く前の状態に戻る。
When the user presses the
OKボタン701を押下した場合、その設定項目の情報を用いて、制御部30のモニタデータ許容範囲特定部32および予測モデル変換部33による処理が開始される。その処理の結果におけるモニタデータ許容範囲を含む情報が、モニタデータ許容範囲記憶部44に反映、保存される。また、その処理の結果におけるモニタデータ許容範囲を含む情報が、モニタデータ許容範囲表示部22によって、モニタデータ許容範囲表示220の領域223に表示される。
When the
領域223では、表700の情報が、所定の形式のグラフで表現されている。本例では、領域223の情報は、表700の項目に対応した、品質目標値、データ範囲、モニタデータ許容範囲、規格範囲、推奨制御値を有する。それぞれの情報が、所定の図像で表現されている。領域223では、モニタデータ毎に、許容範囲だけでなく、データ範囲や規格範囲を含め、棒で重ねて、値の包含関係等がわかるように表示される。例えば、データ範囲は黒領域、モニタデータ許容範囲はグレー(点々の塗り潰しパターン)の領域、規格範囲は白領域、目標値は斜線の塗り潰しパターンの領域、等で区別して表示されている。また、モニタデータのうち、モニタデータ許容範囲特定部32によって、推奨制御値(最適値)が算出されているものについては、例えば三角の図像によって、棒の途中に、許容範囲内の推奨制御値として表示されている。
In
ユーザは、モニタデータ許容範囲表示220の領域223に表示されたモニタデータ許容範囲情報を見ることで、モニタデータ間の許容範囲等の関係を確認することができる。また、ユーザは、設定ボタン221の押下で表示される図7の画面(表700)を見ることで、モニタデータ許容範囲の上限値や下限値等の詳細情報を確認することができる。すなわち、ユーザは、モニタデータ毎に因果関係モデルに基づいて算出、特定された好適な許容範囲を把握することができる。このように、本システムでは、モニタデータ許容範囲の算出および表示によって、品質目標値を満たすようなモニタデータ許容範囲をユーザが把握することができる。このモニタデータ許容範囲等の情報を、実際の製造の制御に活用することで、製造品質を高めることができる。
The user can confirm the relationship such as the allowable range between the monitor data by looking at the monitor data allowable range information displayed in the
なお、モニタデータ許容範囲表示220における他の情報表示の仕方としては、領域223内でユーザが所望のモニタデータ部分を選択操作(例えばクリック等)することで、その選択された部分に対応する詳細情報を、表700に基づいてポップアップ等で表示するようにしてもよい。また、領域223内で、モニタデータの種別や取得フラグ等がわかるように図像や情報で表示してもよい。
As another method of displaying information in the monitor data
[画面-予測モデル変換表示]
図5で、画面内には、予測モデル変換表示230を有する。予測モデル変換表示230は、領域231、領域232等を含む。領域231は、特定された低精度部分(置換対象部分)の情報を表示する領域である。この領域231の表示は省略してもよいし、前述の領域213内や領域223内で、対応する枠等を表示する方式としてもよい。
[Screen-Predictive model conversion display]
In FIG. 5, a predictive
領域232では、予測モデル変換部33での処理の結果得られた変換後の予測モデルの情報を、予測モデル変換表示部23の処理によって表示する。変換後の予測モデルの情報は、グラフィカルに図示される構造と、詳細情報(パラメータ234、評価値235)の表等の情報とを含む。なお、構造のみを表示し、詳細情報については、別途、設定ボタン233の押下等に応じて表示するようにしてもよい。
In the
本例では、変換後の予測モデルとして、高精度な予測モデルの1つである、深層学習モデルを用いる例を示す。なお、高精度な予測モデルとは、一般的に因果関係モデルよりも高精度が期待できる任意の方式のモデルのことである。本システムでは、予め、変換するための予測モデルとして候補となる少なくとも1つの方式のモデルが用意されている。変換のために必要なデータが予め設定されている。予測モデル変換部33は、因果関係モデルのうち、特定された低精度部分であるモデル構造部を、その用意されている予測モデル(深層学習モデル)に自動的に変換する。
In this example, a deep learning model, which is one of the highly accurate prediction models, is used as the prediction model after conversion. The high-precision prediction model is a model of an arbitrary method that can be expected to have higher accuracy than the causal relational model in general. In this system, at least one model of at least one method as a candidate as a prediction model for conversion is prepared in advance. The data required for conversion is preset. The predictive
なお、変形例として、自動的な変換の方式に限らず可能である。例えば、いくつかの候補となる予測モデルを用意しておき、それらからユーザが方式を選択し確認操作してから、変換を行うようにしてもよい。 As a modification, the conversion method is not limited to the automatic conversion method. For example, some candidate prediction models may be prepared, and the user may select a method from them and perform a confirmation operation before performing the conversion.
領域232内には、深層学習モデルを用いて変換した結果の予測モデルの構造(例えばノードとエッジとで表現されている)が表示されている。また、領域232内には、その予測モデルを構築する際に使用したパラメータ234、および構築後の評価値235が、表の形式で表示されている。
In the
予測モデル変換記憶部45には、置換対象部分の情報、変換後の予測モデルの構造の情報、予測モデルのパラメータ234および評価値235の情報が格納されている。予測モデルのパラメータ234は、予測モデル構築時に必要なパラメータの情報である。評価値235は、予測モデル構築後に得られたデータである。
The prediction model
[処理詳細フロー]
図8は、図3の処理フローのうち、ステップS4の処理詳細例として、モニタデータ許容範囲特定および低精度部分特定を含む処理フローを示す。図8は、ステップS11~S21を有する。以下、ステップの順に説明する。
[Detailed processing flow]
FIG. 8 shows a processing flow including monitor data permissible range specification and low-precision partial specification as a detailed processing example of step S4 in the processing flow of FIG. FIG. 8 has steps S11 to S21. Hereinafter, the steps will be described in order.
(S11) まず、制御部30は、i番目のブロック(図8)のモニタデータの許容範囲を算出、特定する。変数iは、注目するブロック(構造部)を表す。ここでは、この処理の際、モニタデータとして、観測データと制御データとを扱う。モニタデータ許容範囲特定部32は、この処理の際、例えば工程での制御データ(あるモニタデータのノード)の値を変化させた際の、下流のノードの観測データの値の変化をみる。モニタデータ許容範囲特定部32は、その変化と、品質目標値とから、その制御データの値が観測データの許容範囲を満たすように、その制御データの許容範囲を特定し、品質目標値に対応させて最適値(推奨制御値)を特定する。
(S11) First, the
また、モニタデータ許容範囲特定部32は、ブロック内で、上記制御データの許容範囲(最適値)に基づいて、上記観測データの上流側につながっている他の観測データについての許容範囲も特定する。その際、モニタデータ許容範囲特定部32は、記憶部40のモニタデータ(表)の参照に基づいて、他の観測データの実績値(取得データ値)の組み合わせを、他の観測データの許容範囲として特定する。
In addition, the monitor data permissible
図14は、上記モニタデータ許容範囲特定処理等の処理例を示す。ここでは、図4の因果関係モデルの具体例を用い、モニタデータX13付近のブロックの例を用いる。図14の例では、注目するブロックiとして、モニタデータX13,X12,X11の3つのノードを含む。モニタデータX11は制御データであり、モニタデータX12,X13は観測データである。ブロックi内で最初に注目するノードであるモニタデータX13には、上流側に、エッジを介して、モニタデータX11,X12の2つのノードがつながっている。また、ブロックiに対し、下流側のi+1番目のブロックの例として、モニタデータX15,X14,X13を含むブロックi+1がある。ブロックiに対し、上流側のi-1番目のブロックの例として、モニタデータX12を含むブロックi-1がある。 FIG. 14 shows a processing example such as the monitor data allowable range specifying processing. Here, a specific example of the causal relationship model of FIG. 4 is used, and an example of a block near the monitor data X13 is used. In the example of FIG. 14, the block i of interest includes three nodes of monitor data X13, X12, and X11. The monitor data X11 is control data, and the monitor data X12 and X13 are observation data. Two nodes of monitor data X11 and X12 are connected to the monitor data X13, which is the node of interest first in the block i, via an edge on the upstream side. Further, as an example of the i + 1th block on the downstream side with respect to the block i, there is a block i + 1 including monitor data X15, X14, and X13. As an example of the i-1st block on the upstream side with respect to the block i, there is a block i-1 including the monitor data X12.
ブロックiの各モニタデータX13,X12,X11のモニタデータ許容範囲を特定する処理例は以下である。(1)制御部30は、最初に注目するモニタデータX13のノードについて、下流側のブロックi+1でつながっているノード(モニタデータX14,X15)の算出済みの許容範囲を参照する。ここでは、2つのノードがつながっており、モニタデータX14,X15の両方の許容範囲(許容範囲H14,H15とする)を参照するが、少なくとも1つのノードの許容範囲を参照すればよい。制御部30は、モニタデータX14,X15の許容範囲H14,H15を満たすように、モニタデータX13の許容範囲H13を特定する。(2)次に、制御部30は、観測データ(第1の観測データ)であるモニタデータX13から、1つ前の一方のノードで制御データであるモニタデータX11に注目する。制御部30は、モニタデータX13の許容範囲H13に基づいて、モニタデータX11の許容範囲H11を特定する。(3)次に、制御部30は、観測データであるモニタデータX13から、1つ前の他方のノードで観測データ(第2の観測データ)であるモニタデータX12に注目する。モニタデータX12は、モニタデータX11とはつながっていないが、モニタデータX13とはつながっている。ブロックi内のモニタデータX11,X12,X13の関係性は、記憶部40のモニタデータ(取得データ)の表から把握可能である。制御部30は、このような関係性の場合、制御データであるモニタデータX11の算出済みの許容範囲H11に基づいて、観測データであるモニタデータX12の許容範囲H12を特定する。
An example of processing for specifying the monitor data allowable range of each monitor data X13, X12, X11 of the block i is as follows. (1) The
(S12) 次に、制御部30は、S11でi番目のブロックから特定したモニタデータ許容範囲が、空集合であるかどうか、すなわち許容範囲の値が存在するかどうかを判定する。空集合である場合(Y)にはS13へ進み、空集合ではない場合(N)にはS21へ進む。
(S12) Next, the
(S21) S21へ進んだ場合、制御部30は、変数iを、i-1に設定する。すなわち、注目するブロックが、1つ上流側のブロックにされる。S21の後、本処理フローを終了し、図3のステップS5に進む。S5でi=1(最も上流のブロック)になるまで、本処理フローが同様に繰り返される。
(S21) When proceeding to S21, the
(S13) 一方、S13へ進んだ場合、制御部30は、因果関係モデルの予測誤差が0であると仮定した場合に、再度、i番目のブロックのモニタデータの許容範囲が、空集合であるかどうか(値が存在するかどうか)を判定する。空集合ではない場合(N)にはS16へ進み、空集合である場合(Y)にはS14へ進む。
(S13) On the other hand, when the process proceeds to S13, the
なお、ここでいう予測誤差とは、あるノードのモニタデータ(例えばX11,X12)から、因果関係(エッジ)を持つ他のノードのモニタデータ(例えばX13)の値を予測する際の、一般的に生じ得る誤差のことである。 The prediction error here is generally used when predicting the value of the monitor data (for example, X13) of another node having a causal relationship (edge) from the monitor data (for example, X11, X12) of a certain node. It is an error that can occur in.
(S16) S13からS16へ進んだ場合、因果関係モデル(対応するブロック)の予測精度の低さによってモニタデータ許容範囲が存在しない場合(見つからない場合)であると考える。それに基づいて、S16では、予測モデル変換部33は、そのi番目のブロック(構造部)に対応するモニタデータ等の部分を、低精度部分(置換対象部分)として特定し、その情報を、予測モデル変換記憶部45に記憶する。
(S16) When proceeding from S13 to S16, it is considered that the monitor data allowable range does not exist (when it cannot be found) due to the low prediction accuracy of the causal relational model (corresponding block). Based on this, in S16, the prediction
(S17) そして、予測モデル変換部33は、因果関係モデルのうちの、その低精度部分(置換対象部分)を、用意されている高精度な予測モデル(例えば深層学習モデル)に自動的に置換する変換処理を行う。予測モデル変換部33は、変換後に得られた予測モデルのデータおよび情報を、予測モデル変換記憶部45に記憶する。
(S17) Then, the prediction
(S18) S17での予測モデル変換後、制御部30のモニタデータ許容範囲特定部32は、その変換後予測モデルを用いて、そのブロックの部分に関して、再度、モニタデータ許容範囲を算出、特定する。
(S18) After the prediction model conversion in S17, the monitor data allowable
(S19) 制御部30は、S18の結果で、モニタデータ許容範囲が空集合であるかどうか(値が存在するかどうか)を判定する。空集合である場合(Y)にはS20へ進み、空集合ではない場合(N)にはS21へ進む。
(S19) The
(S20) S20へ進んだ場合、制御部30は、自動的に、設定されていた品質目標値を下げるように調整、再設定する。S20の後、S11へ戻り、同様に繰り返す。S20へ進む場合では、設定されている品質目標値の制約が大きいためにモニタデータ許容範囲が見つからない場合であると考え、品質目標値を下げるように調整して、再度許容範囲を探すようにするものである。
(S20) When the process proceeds to S20, the
(S14) 一方、S13で空集合である場合(値が存在しない場合)によってS14へ進んだ場合、制御部30は、注目するブロックを表す変数iの値がi=n(n:最後のブロック)であるかどうかを確認して処理を分岐させる。i=nである場合(Y)にはS20へ進み、i≠nである場合(N)にはS15へ進む。i=nである場合(Y)は、つまり処理上で最初のブロック(製造フロー上で最後のブロック)ではモニタデータ許容範囲が見つからない場合である。
(S14) On the other hand, when the process proceeds to S14 due to the empty set in S13 (when the value does not exist), the
(S15) 制御部30は、変数iを、i+1に設定する。すなわち、注目するブロックを、1つ下流側のブロックに戻す。S15の後、S16へ進む。S15へ進む場合では、i番目のブロックよりも後のi+1番目のブロックの部分を、より高精度な予測モデルに変換することで、モニタデータ許容範囲を見つけることができる可能性があると考えるものである。
(S15) The
なお、S20の処理に関して、変形例として、ユーザ設定等に応じて、品質目標値の自動的な変更をしないように制御してもよい。例えば、ユーザが設定した品質目標値ではモニタデータ許容範囲が決定できない場合に、その旨を処理結果として画面に表示する。ユーザは、その旨を確認し、例えば品質目標値を調整、再設定して、再度処理を指示する。 As a modification of the processing of S20, the quality target value may be controlled not to be automatically changed according to the user setting or the like. For example, when the monitor data allowable range cannot be determined by the quality target value set by the user, that fact is displayed on the screen as the processing result. The user confirms that fact, for example, adjusts and resets the quality target value, and instructs the process again.
上記のように、図8の処理例では、制御部30は、因果関係モデルのブロック(構造部)の単位で、注目するブロックを適宜上流や下流に移しながら、モニタデータ許容範囲および低精度部分を算出、特定する。
As described above, in the processing example of FIG. 8, the
また、制御部30は、ある制御データの許容範囲のうちの、最適値(推奨制御値)を算出する場合には、例えば下流のモニタデータ(例えば観測データ)の許容範囲がなるべく広くなる値を、推奨制御値とする。
Further, when the
また、制御部30は、ブロック内のあるノードのモニタデータの予測値の範囲が、下流から算出されたモニタデータ許容範囲を逸脱する場合、特に図8の処理例では空集合となる場合、そのモニタデータの部分を、低精度部分(置換対象部分)として特定する。
Further, the
図14の下側には、低精度部分特定処理の例として、ブロックiにおける低精度部分のモニタデータを特定する例を示す。注目ノードがモニタデータX13である場合を示す。制御部30は、モニタデータX13のノードについて、上記のように下流のノード(例:X14,X15)の許容範囲を満たすように、許容範囲H13を得る。制御部30は、ブロックi内のモニタデータX13の上流のノード(X11,X12)の値から予測されるモニタデータX13の予測値の範囲を得る。制御部30は、そのモニタデータX13の予測値の範囲と、許容範囲H13とを比較し、予測値の範囲が許容範囲H13を逸脱する場合、特に空集合となる場合(重なる値が存在しない場合)、そのモニタデータX13の部分を、低精度部分として特定する。特に、モニタデータX13を含むブロックiについて、置換対象部分として特定される。なお、逸脱に関する他の処理例としては、範囲同士が一部で重なっていて一部が重ならない場合に、その重なり(逸脱)の度合いを判定するようにしてもよい。
The lower part of FIG. 14 shows an example of specifying the monitor data of the low-precision portion in the block i as an example of the low-precision portion specifying process. The case where the node of interest is monitor data X13 is shown. The
[分割処理]
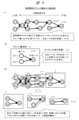
図9は、前述の図3の処理フローのうちのステップS3の、因果関係モデルのn個の構造部への分割処理の例を示す。図9では、制御部30は、分割処理を、因果関係モデルの後ろの部分(下流の工程に関係付けられる部分)から順に、前の部分(上流の工程に関係付けられる部分)へ遡る形で行う。なお、この分割処理は、特に限定せず、他の分割処理を適用してもよい。
[Split processing]
FIG. 9 shows an example of the division processing of the causal relationship model into n structural parts in step S3 in the above-mentioned processing flow of FIG. In FIG. 9, the
(1)まず、制御部30は、因果関係モデルの後ろから順に、1つのノードに注目する。ここでは、注目ノードを変数jで表す。ノード数をm(例えばm=10)で表す。最初、j=mとして設定される。
(1) First, the
(2)制御部30は、注目ノード(j=m)からエッジを介して上流側につながっているノードを順に参照してゆく。制御部30は、注目ノードと、その注目ノードに上流側でつながっている他ノードおよびエッジとを、1つのブロック(構造部)として定義する。
(2) The
ブロック(構造部)毎に順に識別子を付ける。ここでは、ブロックとして下流の最後のブロック(処理上最初のブロック)をnとし、最も上流のブロックを1とする。最初、ブロックnが得られる。本例では、ブロックnは、注目ノードXmと、それよりも1つ前の他ノードXm-2,Xm-1とを含む部分である。 An identifier is assigned to each block (structural part) in order. Here, the last block downstream (the first block in processing) is set as n, and the most upstream block is set to 1. First, block n is obtained. In this example, the block n is a portion including the node of interest Xm and the other nodes Xm-2 and Xm-1 immediately before it.
(3)制御部30は、因果関係モデルの後ろから前へと順に注目ノードを変更しながら、このようにブロックを定義する処理を、上流の最初のノードおよびブロックに到達するまで同様に行う。なお、注目ノードを決める際に、ブロック内に、上流側につながる他ノードが複数ある場合には、製造フローの工程順序情報等を参照、考慮して、後の工程に対応するノードの方を先に注目ノードとしてとるようにする。すなわち、ノードおよびブロックは、なるべく工程順序に沿った順序となるように設定される。
(3) The
上記分割処理で得られたn個の構造部は、製造フローの工程順序を考慮した順序を持っている。なお、上記分割処理の際、制御部30は、工程順序情報を参照する。例えば、各モニタデータのパラメータには、図2のように製造フロー上で関係付けられる工程や装置の情報が存在する。そのため、その情報を参照すれば、工程順序の判断が可能である。
The n structural parts obtained by the above-mentioned division processing have an order in consideration of the process order of the manufacturing flow. At the time of the division process, the
[モニタデータ]
図10は、記憶部40のモニタデータ記憶部41に記憶されるモニタデータ(特に取得データ)の構成例を示す。図10のモニタデータの表は、列(ヘッダ情報)として、製品ID、取得時刻、温度1、温度2、圧力1、圧力2を有する。製品IDは、製造フローで製造される製品毎の識別子である。取得時刻は、そのモニタデータを取得した時刻である。「温度1」~「圧力2」は、モニタデータのパラメータ名の例である。
[Monitor data]
FIG. 10 shows a configuration example of monitor data (particularly acquired data) stored in the monitor
図11は、上記モニタデータにおけるデータ定義例を示す。図11の表では、列(ヘッダ情報)として、モニタデータパラメータ、モニタデータID、種別(第1フラグ)、取得フラグ(第2フラグ)を有する。モニタデータパラメータは、図10のパラメータ名に相当する。モニタデータIDは、本システムの処理上で付与される一意の識別子である。「種別(第1フラグ)」は、そのモニタデータに関する観測データと制御データとの種別を表す。本例では、種別の値「1」が観測データ、値「2」が制御データを表す。取得フラグ(第2フラグ)は、そのモニタデータに関する取得済みの取得データであるか、未取得の予測データであるかを表す。例えば、取得フラグの値「1」が取得データ、値「2」が予測データを表す。 FIG. 11 shows an example of data definition in the monitor data. In the table of FIG. 11, the columns (header information) include monitor data parameters, monitor data IDs, types (first flag), and acquisition flags (second flag). The monitor data parameters correspond to the parameter names in FIG. The monitor data ID is a unique identifier given in the processing of this system. The "type (first flag)" represents the type of observation data and control data related to the monitor data. In this example, the type value "1" represents observation data and the value "2" represents control data. The acquisition flag (second flag) indicates whether the acquired acquisition data or the unacquired prediction data related to the monitor data is used. For example, the value "1" of the acquisition flag represents the acquisition data, and the value "2" represents the prediction data.
図12は、上記モニタデータのうちの一種として、品質データ(検査結果データ)である場合の構成例を示す。図12の表では、列(ヘッダ情報)として、製品ID、モニタデータID、品質値、品質検査結果を有する。モニタデータIDは、その品質データの識別子を表す。なお、例えば値「Y1」は、製造フローの最後の工程が品質検査工程である場合で、最後のモニタデータID(例えばX305)と同じである場合を示す。品質値は、品質検査工程で得られた製品の製造品質を表す値である。品質検査結果は、品質検査工程で品質値に基づいて所定の判定(例えば閾値との比較判定)で得られた値である。例えば、品質値が目標値(例えば0.90)以上の場合には品質検査結果の値が「良」、未満の場合には「不良」とされる場合を示す。品質値の一例としては、歩留まり値が挙げられる。 FIG. 12 shows a configuration example in the case of quality data (inspection result data) as one of the monitor data. The table of FIG. 12 has a product ID, a monitor data ID, a quality value, and a quality inspection result as columns (header information). The monitor data ID represents an identifier of the quality data. For example, the value "Y1" indicates a case where the last step of the manufacturing flow is a quality inspection step and is the same as the last monitor data ID (for example, X305). The quality value is a value indicating the manufacturing quality of the product obtained in the quality inspection process. The quality inspection result is a value obtained by a predetermined determination (for example, comparison determination with a threshold value) based on the quality value in the quality inspection process. For example, when the quality value is equal to or more than the target value (for example, 0.90), the value of the quality inspection result is "good", and when the value is less than the target value, it is considered to be "poor". An example of a quality value is a yield value.
[因果関係モデルデータ]
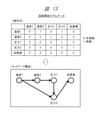
図13は、因果関係モデル記憶部43に記憶される因果関係モデルデータの構成例を示す。図13の上側に示すように、因果関係モデルは、表の形式で表すことができる。表の行および列には、各ノードに対応する各モニタデータのパラメータ(本例では「温度1」~「圧力2」、および品質データの品質値)が並べられている。行列の交差するセル部分には、行のノードと列のノードとの因果関係(エッジによる接続関係)を表す値が格納されている。この値は、2値であり、ノード間が非接続(すなわち因果関係が無い)の場合には値「0」、ノード間が接続(すなわち因果関係が有る、エッジ有り)の場合には値「1」が設定される。図13の下側には、わかりやすいように、上側の表の例をネットワーク構造として表した場合を示す。因果関係モデル記憶部43には上側の表が格納されており、画面表示の際には、表からの変換によって下側のようなネットワーク構造が表示可能である。
[Causal relationship model data]
FIG. 13 shows a configuration example of the causal relationship model data stored in the causal relationship
[効果等]
上記のように、実施の形態の因果関係モデル構築システムによれば、製造支援に係わる因果関係モデルの予測精度を向上でき、その結果として製造品質等を向上することができる。本システムによれば、複数の工程から成る製造フローの場合でも、モニタデータ許容範囲を用いて、工程毎に好適に制御し、検査結果の製造品質を向上することができる。また、本システムによれば、因果関係モデルの特定の一部分をより高精度のモデルに変換し、更新後のモデルを用いて、より好適な制御が可能である。
[Effects, etc.]
As described above, according to the causal relationship model construction system of the embodiment, the prediction accuracy of the causal relationship model related to the manufacturing support can be improved, and as a result, the manufacturing quality and the like can be improved. According to this system, even in the case of a manufacturing flow consisting of a plurality of steps, it is possible to appropriately control each step by using the monitor data allowable range and improve the manufacturing quality of the inspection result. Further, according to this system, a specific part of the causal relationship model can be converted into a more accurate model, and more suitable control can be performed by using the updated model.
本システムは、計算したモニタデータ許容範囲を含む情報を出力することができる。この情報の製造現場での利用の仕方としては、各種可能であるが、例えば以下が挙げられる。(1)本システムは、SE等の人に、許容範囲等の情報を出力する。SE等の人は、その許容範囲等を見て、その許容範囲から選択した制御値等を、製造時に使用する。(2)本システムは、推奨制御値を計算し、許容範囲および推奨制御値等の情報を、SE等の人に出力する。SE等の人は、その情報を見て、例えばその推奨制御値をそのまま製造時に使用する。(3)本システムは、推奨制御値を計算し、許容範囲および推奨制御値等の情報を、SE等の人に出力する。それと共に、本システムは、通信を介して、その推奨制御値等を、製造時に使用するように、自動的に工程の製造装置等に設定する。 This system can output information including the calculated monitor data tolerance. There are various ways to use this information at the manufacturing site, and examples thereof include the following. (1) This system outputs information such as an allowable range to a person such as SE. A person such as SE looks at the permissible range and uses the control value or the like selected from the permissible range at the time of manufacturing. (2) This system calculates the recommended control value and outputs information such as the allowable range and the recommended control value to a person such as SE. A person such as SE sees the information and uses, for example, the recommended control value as it is at the time of manufacturing. (3) This system calculates the recommended control value and outputs information such as the allowable range and the recommended control value to a person such as SE. At the same time, this system automatically sets the recommended control values and the like to the manufacturing equipment and the like of the process so as to be used at the time of manufacturing through communication.
(変形例)
実施の形態の因果関係モデル構築システムの変形例として、以下が挙げられる。まず、前述の実施の形態では、モニタデータ許容範囲の特定に基づいて低精度部分の予測モデル変換まで自動的に行う機能を備える形態としたが、これに限らず可能である。変形例として、モニタデータ許容範囲の特定および画面表示までを行う機能を備える形態としてもよい。また、モデルの低精度部分の特定および画面表示までを行う機能を備える形態としてもよい。
(Modification example)
The following are examples of modifications of the causal relationship model construction system of the embodiment. First, in the above-described embodiment, the form is provided with a function of automatically performing the prediction model conversion of the low-precision portion based on the specification of the monitor data allowable range, but the present invention is not limited to this. As a modification, a form having a function of specifying a monitor data allowable range and displaying a screen may be used. Further, it may be in a form having a function of specifying a low-precision part of the model and displaying the screen.
前述の実施の形態のシステムは、主に、因果関係モデルについて知識があるSE等の人向けに提供されている。SE等のユーザは、上記システムの画面で得られた、モニタデータ許容範囲(制御データの推奨制御値や観測データ許容範囲)、あるいは低精度部分の変換後予測モデルを用いて得られたモニタデータ許容範囲を用いて、製造現場への反映が可能である。モニタデータには、製造フローの工程や装置の情報が関係付けられている。よって、その製造フローの情報を参照することで、どの工程や製造装置の制御データ等を制御すれば製造品質を高くできるかがわかる。これに限らず、変形例のシステムでは、製造業者向けに、モニタデータ許容範囲や変換後予測モデルに関する情報を提供してもよい。例えば、変形例のシステムでは、得られたモニタデータ許容範囲や低精度部分(モデル構造部)の情報から、前提の製造フロー情報に基づいて、関係付けられる工程、製造装置やセンサの情報に変換する。製造フロー情報についても、記憶部40内に格納、管理してもよい。これにより、製造現場の人も、どの工程や製造装置の制御データ等をどのような範囲や値に制御すれば製造品質を高くできるかがわかりやすい。
The system of the above-described embodiment is mainly provided for a person such as SE who has knowledge about a causal relationship model. Users such as SE can use the monitor data tolerance (recommended control value of control data or observation data tolerance) obtained on the screen of the above system, or the monitor data obtained by using the converted prediction model of the low-precision part. It is possible to reflect it on the manufacturing site by using the allowable range. Information on the manufacturing flow process and equipment is related to the monitor data. Therefore, by referring to the information of the manufacturing flow, it is possible to know which process and control data of the manufacturing apparatus should be controlled to improve the manufacturing quality. Not limited to this, the modified example system may provide the manufacturer with information about the monitor data tolerance and the post-conversion prediction model. For example, in the modified example system, the obtained monitor data tolerance and low-precision part (model structure part) information is converted into information on related processes, manufacturing equipment, and sensors based on the premise manufacturing flow information. do. The manufacturing flow information may also be stored and managed in the
また、最初に因果関係モデルを構築するにあたり、どのようなモニタデータ(パラメータ)を用いるかについては、ユーザ(SE等の人)が最初に設定する。その設定に基づいて、製造実行に応じて取得されるモニタデータを用いて、制御部30が自動的に因果関係モデルを構築する。しかしながら、仮に、ユーザによるそのモニタデータ(パラメータ)の選定の仕方が良くなかった場合には、因果関係モデルから算出されるモニタデータ許容範囲等についても、精度が低くなる可能性がある。そこで、変形例のシステムとしては、後でモニタデータの選定を改善できるように、上記のように、モニタデータに関係付けられる工程や装置の情報を画面に表示する。ユーザは、画面で、工程や装置のパラメータの選定を変更し、その状態で名前を付けて設定を保存し、その設定で因果関係モデル構築等を指示する。その設定の結果得られたデータを、名前を付けて保存する。これにより、ユーザは、パラメータの選定に応じた結果が確認でき、なるべく精度を高めるように、パラメータ選定に応じた複数の結果を比較検討することもできる。
In addition, the user (person such as SE) first sets what kind of monitor data (parameter) to use when constructing the causal relationship model first. Based on the setting, the
以上、本発明を実施の形態に基づいて具体的に説明したが、本発明は前述の実施の形態に限定されず、その要旨を逸脱しない範囲で種々変更可能である。本発明におけるモデル構築は、製造分野に限らず、他の分野(例えば販売、マーケティング)にも同様に適用可能である。 Although the present invention has been specifically described above based on the embodiments, the present invention is not limited to the above-described embodiments and can be variously modified without departing from the gist thereof. The model construction in the present invention is not limited to the manufacturing field, but can be similarly applied to other fields (for example, sales, marketing).
1…計算機、11…入出力部、12…通信部、20…表示部、30…制御部、40…記憶部、210…因果関係モデル表示、220…モニタデータ許容範囲表示、230…予測モデル変換表示。 1 ... Computer, 11 ... Input / output unit, 12 ... Communication unit, 20 ... Display unit, 30 ... Control unit, 40 ... Storage unit, 210 ... Causal relationship model display, 220 ... Monitor data tolerance display, 230 ... Predictive model conversion display.
Claims (9)
前記計算機システムは、
前記製造フローの複数の各々の工程の状態を表すモニタデータと、前記製造フローのうちの検査工程の結果の品質データとを用いて、前記因果関係モデルを構築し、
前記因果関係モデルと、前記品質データの目標値とを用いて、複数のモニタデータの間の因果関係に基づいた予測から、前記目標値を満たすように、前記モニタデータの許容範囲を特定し、
前記因果関係モデル、および前記モニタデータの許容範囲を含む情報を、画面にグラフィカルに図示して表示し、
前記モニタデータとして、前記製造フローの前記工程に関係付けられる製造装置の制御データと、前記工程に関係付けられるセンサの観測データと、を有し、
前記計算機システムは、前記モニタデータの許容範囲を特定する際、
前記観測データの許容範囲と、前記制御データの許容範囲とを特定し、
前記因果関係モデルの構造を、前記製造フロー上の下流から上流に沿って、複数の構造部に分割し、下流から上流に遡りながら構造部毎に前記許容範囲を特定する処理を行い、
前記構造部内では、複数のモニタデータの因果関係に従って、着目するモニタデータを下流から上流に遡りながら前記許容範囲を特定する処理を行い、
前記構造部毎に、前記制御データの値を変化させた際の、下流側の前記観測データの値の変化が、前記目標値または特定済みの前記許容範囲を満たすように、前記制御データの許容範囲を特定し、
前記構造部毎に、下流側のモニタデータの許容範囲がなるべく広くなるように、前記制御データの許容範囲のうちの最適値を算出し、前記最適値とした場合の前記観測データの許容範囲を算出し、
前記構造部毎に、前記制御データの下流につながる第1の観測データと、前記第1の観測データの上流につながる第2の観測データとがある場合に、前記制御データの許容範囲に基づいて、前記第2の観測データの許容範囲を特定する、
因果関係モデル構築システム。 It is a causal relationship model construction system that is configured on a computer system and performs information processing to build a causal relationship model related to the manufacturing flow to be controlled.
The computer system is
The causal relationship model is constructed by using the monitor data representing the state of each of the plurality of processes of the manufacturing flow and the quality data of the result of the inspection step in the manufacturing flow.
Using the causal relationship model and the target value of the quality data, the allowable range of the monitor data is specified so as to satisfy the target value from the prediction based on the causal relationship between the plurality of monitor data.
Information including the causal relationship model and the allowable range of the monitor data is graphically displayed on the screen and displayed.
As the monitor data, the control data of the manufacturing apparatus related to the process of the manufacturing flow and the observation data of the sensor related to the process are included.
The computer system determines the permissible range of the monitor data.
Identify the permissible range of the observation data and the permissible range of the control data,
The structure of the causal relationship model is divided into a plurality of structural parts along the downstream to the upstream on the manufacturing flow, and a process of specifying the permissible range for each structural part is performed while going back from the downstream to the upstream.
In the structural unit, according to the causal relationship of a plurality of monitor data, a process of specifying the permissible range is performed while tracing the monitor data of interest from the downstream to the upstream.
Allowance of the control data so that the change in the value of the observation data on the downstream side when the value of the control data is changed for each structural part satisfies the target value or the specified allowable range. Identify the range and
For each structural unit, the optimum value of the allowable range of the control data is calculated so that the allowable range of the monitor data on the downstream side is as wide as possible, and the allowable range of the observation data when the optimum value is used is set. Calculate and
When there is a first observation data connected to the downstream side of the control data and a second observation data connected to the upstream side of the first observation data for each structural part, based on the allowable range of the control data. , Identify the permissible range of the second observation data,
Causal relationship model construction system.
前記計算機システムは、
前記モニタデータの許容範囲に基づいて、前記因果関係モデルのうち予測精度に関する低精度部分を特定し、
前記低精度部分を表す情報を前記画面に表示し、
前記計算機システムは、前記低精度部分を特定する際、
前記構造部毎に、前記モニタデータ毎に、前記製造フロー上で上流のモニタデータに基づいた予測値の範囲が、下流のモニタデータに基づいて得られた前記許容範囲を逸脱する場合、前記モニタデータを含む部分を、前記低精度部分として特定する、
因果関係モデル構築システム。 In the causal relationship model construction system according to claim 1,
The computer system is
Based on the permissible range of the monitor data, the low-precision part regarding the prediction accuracy of the causal relational model is identified.
Information indicating the low-precision portion is displayed on the screen, and the information is displayed on the screen.
When the computer system identifies the low precision portion,
When the range of the predicted value based on the upstream monitor data on the manufacturing flow deviates from the allowable range obtained based on the downstream monitor data for each of the structural parts and the monitor data, the monitor is used. The part containing the data is specified as the low-precision part.
Causal relationship model construction system.
前記計算機システムは、
前記因果関係モデルのうちの前記低精度部分を、用意されている別の予測モデルに変換し、
前記変換後の予測モデルを含む情報を、前記画面にグラフィカルに図示して表示する、
因果関係モデル構築システム。 In the causal relationship model construction system according to claim 2,
The computer system is
The low-precision part of the causal relationship model is converted into another prepared prediction model.
Information including the transformed prediction model is graphically displayed and displayed on the screen.
Causal relationship model construction system.
前記計算機システムは、
前記変換後の予測モデルを含む、更新後の前記因果関係モデルを用いて、前記モニタデータの許容範囲を再計算し、
前記再計算した前記モニタデータの許容範囲を含む情報を前記画面に表示する、
因果関係モデル構築システム。 In the causal relationship model construction system according to claim 3,
The computer system is
Using the updated causal relationship model, including the transformed predictive model, the permissible range of the monitor data was recalculated.
Information including the allowable range of the recalculated monitor data is displayed on the screen.
Causal relationship model construction system.
前記計算機システムは、前記低精度部分を特定する際、前記モニタデータの許容範囲が空集合となる場合、前記モニタデータを含む部分を、前記低精度部分として特定する、
因果関係モデル構築システム。 In the causal relationship model construction system according to claim 2 ,
When the computer system specifies the low-precision portion, if the allowable range of the monitor data is an empty set, the computer system specifies the portion including the monitor data as the low-precision portion.
Causal relationship model construction system.
前記計算機システムは、前記モニタデータの許容範囲を特定する際、前記目標値を満たすような前記許容範囲が特定できない場合には、前記目標値を自動的に下げるように調整し、前記許容範囲の特定を再度行う、
因果関係モデル構築システム。 In the causal relationship model construction system according to claim 1,
When the computer system specifies the allowable range of the monitor data, if the allowable range that satisfies the target value cannot be specified, the computer system adjusts to automatically lower the target value, and the allowable range is within the allowable range. Re-identify,
Causal relationship model construction system.
前記計算機システムは、前記モニタデータの許容範囲を含む情報を表示する際、前記複数のモニタデータを前記製造フローの前記工程の順序に沿って並べて、前記モニタデータ毎に、取得した前記モニタデータのデータ範囲と、規格範囲が設定されている場合の前記規格範囲と、前記モニタデータの許容範囲とを表示する、
因果関係モデル構築システム。 In the causal relationship model construction system according to claim 1,
When the computer system displays information including an allowable range of the monitor data, the plurality of monitor data are arranged in the order of the steps of the manufacturing flow, and the acquired monitor data is obtained for each monitor data. The data range, the standard range when the standard range is set, and the allowable range of the monitor data are displayed.
Causal relationship model construction system.
前記計算機システムは、前記許容範囲を特定した前記モニタデータに関係付けられる前記製造フロー上の前記工程または前記工程に関係付けられる製造装置またはセンサの情報を前記画面に表示する、
因果関係モデル構築システム。 In the causal relationship model construction system according to claim 1,
The computer system displays on the screen information about the process on the manufacturing flow associated with the monitor data specifying the permissible range or the manufacturing apparatus or sensor associated with the process.
Causal relationship model construction system.
前記計算機システムにおいて実行されるステップとして、
前記製造フローの複数の各々の工程の状態を表すモニタデータと、前記製造フローのうちの検査工程の結果の品質データとを用いて、前記因果関係モデルを構築するステップと、
前記因果関係モデルと、前記品質データの目標値とを用いて、複数のモニタデータの間の因果関係に基づいた予測から、前記目標値を満たすように、前記モニタデータの許容範囲を特定するステップと、
前記因果関係モデル、および前記モニタデータの許容範囲を含む情報を、画面にグラフィカルに図示して表示するステップと、
を有し、
前記モニタデータとして、前記製造フローの前記工程に関係付けられる製造装置の制御データと、前記工程に関係付けられるセンサの観測データと、を有し、
前記計算機システムが前記モニタデータの許容範囲を特定するステップでは、
前記観測データの許容範囲と、前記制御データの許容範囲とを特定し、
前記因果関係モデルの構造を、前記製造フロー上の下流から上流に沿って、複数の構造部に分割し、下流から上流に遡りながら構造部毎に前記許容範囲を特定する処理を行い、
前記構造部内では、複数のモニタデータの因果関係に従って、着目するモニタデータを下流から上流に遡りながら前記許容範囲を特定する処理を行い、
前記構造部毎に、前記制御データの値を変化させた際の、下流側の前記観測データの値の変化が、前記目標値または特定済みの前記許容範囲を満たすように、前記制御データの許容範囲を特定し、
前記構造部毎に、下流側のモニタデータの許容範囲がなるべく広くなるように、前記制御データの許容範囲のうちの最適値を算出し、前記最適値とした場合の前記観測データの許容範囲を算出し、
前記構造部毎に、前記制御データの下流につながる第1の観測データと、前記第1の観測データの上流につながる第2の観測データとがある場合に、前記制御データの許容範囲に基づいて、前記第2の観測データの許容範囲を特定する、
因果関係モデル構築方法。 It is a causal relationship model construction method in a causal relationship model construction system that is configured on a computer system and performs information processing to construct a causal relationship model related to the manufacturing flow of a controlled object.
As a step performed in the computer system,
A step of constructing the causal relationship model using monitor data representing the state of each of a plurality of processes of the manufacturing flow and quality data of the result of the inspection process in the manufacturing flow.
Using the causal relationship model and the target value of the quality data, a step of specifying an allowable range of the monitor data so as to satisfy the target value from a prediction based on the causal relationship between a plurality of monitor data. When,
A step of graphically displaying information including the causal relationship model and the allowable range of the monitor data on the screen, and
Have ,
As the monitor data, the control data of the manufacturing apparatus related to the process of the manufacturing flow and the observation data of the sensor related to the process are included.
In the step where the computer system determines the allowable range of the monitor data,
Identify the permissible range of the observation data and the permissible range of the control data,
The structure of the causal relationship model is divided into a plurality of structural parts along the downstream to the upstream on the manufacturing flow, and a process of specifying the permissible range for each structural part is performed while going back from the downstream to the upstream.
In the structural unit, according to the causal relationship of a plurality of monitor data, a process of specifying the permissible range is performed while tracing the monitor data of interest from the downstream to the upstream.
Allowance of the control data so that the change in the value of the observation data on the downstream side when the value of the control data is changed for each structural part satisfies the target value or the specified allowable range. Identify the range and
For each structural unit, the optimum value of the allowable range of the control data is calculated so that the allowable range of the monitor data on the downstream side is as wide as possible, and the allowable range of the observation data when the optimum value is used is set. Calculate and
When there is a first observation data connected to the downstream side of the control data and a second observation data connected to the upstream side of the first observation data for each structural part, based on the allowable range of the control data. , Identify the permissible range of the second observation data,
How to build a causal relationship model.
Priority Applications (2)
| Application Number | Priority Date | Filing Date | Title |
|---|---|---|---|
| JP2017210964A JP6991833B2 (en) | 2017-10-31 | 2017-10-31 | Causal relationship model construction system and method |
| US16/147,923 US10775780B2 (en) | 2017-10-31 | 2018-10-01 | Causal relation model building system and method thereof |
Applications Claiming Priority (1)
| Application Number | Priority Date | Filing Date | Title |
|---|---|---|---|
| JP2017210964A JP6991833B2 (en) | 2017-10-31 | 2017-10-31 | Causal relationship model construction system and method |
Publications (2)
| Publication Number | Publication Date |
|---|---|
| JP2019082943A JP2019082943A (en) | 2019-05-30 |
| JP6991833B2 true JP6991833B2 (en) | 2022-01-13 |
Family
ID=66245576
Family Applications (1)
| Application Number | Title | Priority Date | Filing Date |
|---|---|---|---|
| JP2017210964A Active JP6991833B2 (en) | 2017-10-31 | 2017-10-31 | Causal relationship model construction system and method |
Country Status (2)
| Country | Link |
|---|---|
| US (1) | US10775780B2 (en) |
| JP (1) | JP6991833B2 (en) |
Cited By (1)
| Publication number | Priority date | Publication date | Assignee | Title |
|---|---|---|---|---|
| JP7789445B1 (en) * | 2025-05-28 | 2025-12-22 | アイクリスタル株式会社 | Information processing system, information processing method and program |
Families Citing this family (12)
| Publication number | Priority date | Publication date | Assignee | Title |
|---|---|---|---|---|
| US12346834B2 (en) * | 2018-01-22 | 2025-07-01 | International Business Machines Corporation | Free-form production based on causal predictive models |
| US12613514B2 (en) * | 2018-06-14 | 2026-04-28 | Gestamp Automoción, S.A. | Quality monitoring of industrial processes |
| JP7350601B2 (en) * | 2019-10-04 | 2023-09-26 | エヌ・ティ・ティ・コミュニケーションズ株式会社 | Information processing device, information processing method, and information processing program |
| JP7395987B2 (en) * | 2019-11-22 | 2023-12-12 | 株式会社リコー | Information processing systems, methods, and programs |
| JP7491724B2 (en) * | 2020-04-22 | 2024-05-28 | 株式会社 日立産業制御ソリューションズ | Information processing device and information processing method |
| US20220067233A1 (en) * | 2020-08-27 | 2022-03-03 | Industrial Technology And Safety Council Llc | Generating operational and realistic models of physical systems |
| US12174915B1 (en) * | 2020-10-01 | 2024-12-24 | Wells Fargo Bank, N.A. | Progressive machine learning using a qualifier |
| WO2023176467A1 (en) * | 2022-03-16 | 2023-09-21 | Jfeスチール株式会社 | Cause inference device, cause inference method, cause inference system, and terminal device |
| WO2023176464A1 (en) * | 2022-03-16 | 2023-09-21 | Jfeスチール株式会社 | Cause inference device, cause inference method, cause inference system, and terminal device |
| US20240144297A1 (en) * | 2022-11-02 | 2024-05-02 | Wevo, Inc. | Artificial intelligence based theme builder for processing user expectations |
| CN116130026B (en) * | 2022-12-14 | 2026-01-16 | 明度智云(浙江)科技有限公司 | A simulated manufacturing method, system, and storage medium for a pharmaceutical process formulation. |
| JP7781345B2 (en) * | 2023-04-19 | 2025-12-05 | 三菱電機株式会社 | Monitoring and Control Equipment |
Citations (1)
| Publication number | Priority date | Publication date | Assignee | Title |
|---|---|---|---|---|
| JP2004186445A (en) | 2002-12-03 | 2004-07-02 | Omron Corp | Modeling apparatus, model analysis method, process abnormality detection / classification system, process abnormality detection / classification method, modeling system, modeling method, failure prediction system, and method of updating modeling apparatus |
Family Cites Families (14)
| Publication number | Priority date | Publication date | Assignee | Title |
|---|---|---|---|---|
| US7110956B1 (en) * | 1996-05-28 | 2006-09-19 | Texas Instruments Incorporated | Capability predictor |
| JP2003502771A (en) * | 1999-06-22 | 2003-01-21 | ブルックス オートメーション インコーポレイテッド | Run-to-run controller used for microelectronics fabrication |
| JP3760911B2 (en) | 2002-11-27 | 2006-03-29 | トヨタ自動車株式会社 | Model creation method, model creation program, and simulation apparatus |
| JP4495960B2 (en) * | 2003-12-26 | 2010-07-07 | キヤノンItソリューションズ株式会社 | Model creation device for the relationship between process and quality |
| US7127358B2 (en) * | 2004-03-30 | 2006-10-24 | Tokyo Electron Limited | Method and system for run-to-run control |
| US7221987B2 (en) * | 2004-06-15 | 2007-05-22 | Kimberly-Clark Worldwide, Inc. | Generating a reliability analysis by identifying casual relationships between events in an event-based manufacturing system |
| JP2006343881A (en) * | 2005-06-07 | 2006-12-21 | Institute Of Physical & Chemical Research | Self-position estimation system and self-position estimation method |
| JP4488964B2 (en) | 2005-06-27 | 2010-06-23 | 新日本製鐵株式会社 | Process operating state control method and computer program |
| US7650199B1 (en) * | 2005-08-03 | 2010-01-19 | Daniel Kadosh | End of line performance prediction |
| CN101842756A (en) * | 2007-08-14 | 2010-09-22 | 国际壳牌研究有限公司 | System and method for continuous, on-line monitoring of a chemical plant or refinery |
| US8494798B2 (en) * | 2008-09-02 | 2013-07-23 | Mks Instruments, Inc. | Automated model building and batch model building for a manufacturing process, process monitoring, and fault detection |
| JP4764490B2 (en) * | 2009-03-30 | 2011-09-07 | 株式会社東芝 | User evaluation device according to hardware usage |
| JP5688227B2 (en) * | 2010-02-26 | 2015-03-25 | 株式会社日立ハイテクノロジーズ | Etching apparatus, control simulator, and semiconductor device manufacturing method |
| US20150066592A1 (en) * | 2013-08-30 | 2015-03-05 | Infineon Technologies Ag | Methods of semiconductor manufacturing and supply chain management systems |
-
2017
- 2017-10-31 JP JP2017210964A patent/JP6991833B2/en active Active
-
2018
- 2018-10-01 US US16/147,923 patent/US10775780B2/en active Active
Patent Citations (1)
| Publication number | Priority date | Publication date | Assignee | Title |
|---|---|---|---|---|
| JP2004186445A (en) | 2002-12-03 | 2004-07-02 | Omron Corp | Modeling apparatus, model analysis method, process abnormality detection / classification system, process abnormality detection / classification method, modeling system, modeling method, failure prediction system, and method of updating modeling apparatus |
Cited By (1)
| Publication number | Priority date | Publication date | Assignee | Title |
|---|---|---|---|---|
| JP7789445B1 (en) * | 2025-05-28 | 2025-12-22 | アイクリスタル株式会社 | Information processing system, information processing method and program |
Also Published As
| Publication number | Publication date |
|---|---|
| US10775780B2 (en) | 2020-09-15 |
| US20190129397A1 (en) | 2019-05-02 |
| JP2019082943A (en) | 2019-05-30 |
Similar Documents
| Publication | Publication Date | Title |
|---|---|---|
| JP6991833B2 (en) | Causal relationship model construction system and method | |
| JP7062577B2 (en) | Manufacturing condition identification system and method | |
| JP7330712B2 (en) | Material property prediction device and material property prediction method | |
| JP5866446B2 (en) | Graph drawing apparatus, graph drawing method, process management system, process management method, control program, and readable storage medium | |
| TWI801502B (en) | Plant operating condition setting support system, learning device, and operating condition setting support device | |
| WO2018052015A1 (en) | Analysis support device for system, analysis support method and program for system | |
| CN109074061A (en) | Apparatus and method for generating industrial process graphics | |
| JP5930225B2 (en) | Energy efficiency evaluation support device, computer program, and energy efficiency evaluation support method | |
| KR101022230B1 (en) | How to build an optimal production scenario in a digital factory | |
| JP2006528557A (en) | Tool and process design in molding technology | |
| JP7360925B2 (en) | analysis system | |
| WO2020184087A1 (en) | Analysis device, analysis method, and analysis program | |
| JP6273835B2 (en) | State determination device, state determination method, and state determination program | |
| JP2011129580A (en) | Defective device detection system, and defective device detection program | |
| JP2022014618A (en) | Prediction device and prediction method | |
| US7801705B2 (en) | Mass on model | |
| JP2019003453A (en) | Defect factor analysis system and defect factor analysis method | |
| JP6531820B2 (en) | Estimator Visualization System | |
| TW202221549A (en) | Method for optimizing output result of spectrometer and electronic device using the same | |
| JP5221276B2 (en) | PLANT MONITORING CONTROL DEVICE, ITS CONTROL METHOD, AND ITS PROGRAM | |
| US20110289473A1 (en) | Software modification estimate method and software modification estimate system | |
| WO2023233858A1 (en) | Calculation device and calculation method for neural network | |
| CN111985074B (en) | Modeling structure analysis method and device | |
| US20200250353A1 (en) | System for managing buildings | |
| WO2022195748A1 (en) | Process management device |
Legal Events
| Date | Code | Title | Description |
|---|---|---|---|
| A621 | Written request for application examination |
Free format text: JAPANESE INTERMEDIATE CODE: A621 Effective date: 20200305 |
|
| A977 | Report on retrieval |
Free format text: JAPANESE INTERMEDIATE CODE: A971007 Effective date: 20210210 |
|
| A131 | Notification of reasons for refusal |
Free format text: JAPANESE INTERMEDIATE CODE: A131 Effective date: 20210330 |
|
| A521 | Written amendment |
Free format text: JAPANESE INTERMEDIATE CODE: A523 Effective date: 20210518 |
|
| TRDD | Decision of grant or rejection written | ||
| A01 | Written decision to grant a patent or to grant a registration (utility model) |
Free format text: JAPANESE INTERMEDIATE CODE: A01 Effective date: 20211109 |
|
| A61 | First payment of annual fees (during grant procedure) |
Free format text: JAPANESE INTERMEDIATE CODE: A61 Effective date: 20211208 |
|
| R150 | Certificate of patent or registration of utility model |
Ref document number: 6991833 Country of ref document: JP Free format text: JAPANESE INTERMEDIATE CODE: R150 |