JP6969320B2 - Monitoring status display device, monitoring status display method, and monitoring status display program - Google Patents
Monitoring status display device, monitoring status display method, and monitoring status display program Download PDFInfo
- Publication number
- JP6969320B2 JP6969320B2 JP2017227266A JP2017227266A JP6969320B2 JP 6969320 B2 JP6969320 B2 JP 6969320B2 JP 2017227266 A JP2017227266 A JP 2017227266A JP 2017227266 A JP2017227266 A JP 2017227266A JP 6969320 B2 JP6969320 B2 JP 6969320B2
- Authority
- JP
- Japan
- Prior art keywords
- monitoring
- image
- state
- monitored
- monitoring data
- Prior art date
- Legal status (The legal status is an assumption and is not a legal conclusion. Google has not performed a legal analysis and makes no representation as to the accuracy of the status listed.)
- Active
Links
Images


Classifications
-
- G—PHYSICS
- G05—CONTROLLING; REGULATING
- G05B—CONTROL OR REGULATING SYSTEMS IN GENERAL; FUNCTIONAL ELEMENTS OF SUCH SYSTEMS; MONITORING OR TESTING ARRANGEMENTS FOR SUCH SYSTEMS OR ELEMENTS
- G05B23/00—Testing or monitoring of control systems or parts thereof
- G05B23/02—Electric testing or monitoring
Description
本発明は、モータ等の監視対象機器の各種計測値および各種状態を表示する監視状態表示技術に関する。 The present invention relates to a monitoring state display technique for displaying various measured values and various states of a device to be monitored such as a motor.
特許文献1には、電力量監視システムが記載されている。電力量監視システムは、PCと複数の電力計測ユニットを備える。PCは、複数の電力計測ユニットに接続されている。
PCは、複数の電力計測ユニットで計測した電力量を取得する。PCは、電力量をグラフ化して表示している。 The PC acquires the amount of electric power measured by a plurality of electric power measuring units. The PC displays the amount of electric power as a graph.
しかしながら、特許文献1のシステムでは、電力量を1種類の時系列の棒グラフで表示するだけであり、これは単なる計測値の表示である。このため、ユーザが予兆保全を実現するために必要とする情報を分かり易く提供できているとは限らない。
However, in the system of
したがって、本発明の目的は、予兆保全に有効な情報をユーザに分かり易く提供できる技術を提供することにある。 Therefore, an object of the present invention is to provide a technique capable of providing a user with information effective for predictive maintenance in an easy-to-understand manner.
本開示の一例では、監視状態表示装置は、状態判定部、および、監視画像生成部を備える。状態判定部は、監視対象機器に対して設置された計測器から取得した監視データから監視対象機器の正常または異常の状態を判定する。監視画像生成部は、監視データまたは状態の判定結果に基づいて作成される複数種類のグラフの少なくとも1つを含む監視画像を生成する。 In one example of the present disclosure, the monitoring status display device includes a status determination unit and a monitoring image generation unit. The status determination unit determines the normal or abnormal status of the monitored device from the monitoring data acquired from the measuring instrument installed for the monitored device. The surveillance image generation unit generates a surveillance image including at least one of a plurality of types of graphs created based on the surveillance data or the determination result of the state.
この構成では、計測値のような監視データだけでなく、当該監視データによって判定される機器の状態に基づいて、複数種類のグラフが提供される。これにより、ユーザは、これらのグラフに基づいて、予兆保全に有効な情報を分かり易く得られる。 In this configuration, not only monitoring data such as measured values, but also a plurality of types of graphs are provided based on the state of the device determined by the monitoring data. As a result, the user can easily obtain information effective for predictive maintenance based on these graphs.
また、本開示の一例では、監視画像は、監視対象機器毎のグラフで構成される対象別画像と、監視データの種類毎のグラフで構成される種類別画像と、の少なくとも一方を含む。 Further, in one example of the present disclosure, the surveillance image includes at least one of a target-specific image composed of a graph for each monitoring target device and a type-specific image composed of a graph for each type of monitoring data.
この構成では、監視対象機器毎または監視データ毎にグラフを視認でき、ユーザ設備や保全用途に合わせた予兆保全がより容易になる。 In this configuration, the graph can be visually recognized for each monitored device or each monitored data, and it becomes easier to perform predictive maintenance according to the user equipment and maintenance application.
また、本開示の一例では、複数種類のグラフは、監視データである計測値の時系列変化を示す折れ線グラフと、監視状態の判定結果に応じた複数の表示態様のバーを時系列に示すバーグラフと、を含む。 Further, in one example of the present disclosure, the plurality of types of graphs are a line graph showing time-series changes in measured values, which are monitoring data, and a bar showing a plurality of display modes according to the determination result of the monitoring state in chronological order. Includes graphs and.
この構成では、計測値の遷移を確認し易いグラフと、監視状態の遷移が確認し易いグラフとが用いられる。これにより、1つの監視対象機器に注目した詳細な予兆保全と、ユーザ設備全体を把握する概要的な予兆保全との使い分けが、より容易になる。 In this configuration, a graph that makes it easy to confirm the transition of the measured value and a graph that makes it easy to confirm the transition of the monitoring state are used. This makes it easier to properly use the detailed predictive maintenance focusing on one monitored device and the general predictive maintenance that grasps the entire user equipment.
また、本開示の一例では、折れ線グラフは、監視状態の判定結果の判定基準となる基準線が示されている。 Further, in an example of the present disclosure, the line graph shows a reference line as a determination criterion of the determination result of the monitoring state.
この構成では、折れ線グラフからも監視状態の遷移を容易に確認できる。 In this configuration, the transition of the monitoring state can be easily confirmed from the line graph.
また、本開示の一例では、折れ線グラフは、監視状態の判定結果に応じて異なる背景色が示されている。 Further, in one example of the present disclosure, the line graph shows a different background color depending on the determination result of the monitoring state.
この構成では、折れ線グラフによる監視状態の遷移の確認がさらに容易になる。 With this configuration, it becomes easier to confirm the transition of the monitoring state by the line graph.
また、本開示の一例では、バーグラフは、監視状態の変化の検出時刻が示されている。 Further, in one example of the present disclosure, the bar graph shows the detection time of the change in the monitoring state.
この構成では、監視状態の変化の時刻を容易に確認できる。 With this configuration, the time of change in the monitoring status can be easily confirmed.
また、本開示の一例では、監視画像生成部は、監視画像に対する操作位置に基づいて、該操作位置に対応する監視対象機器または監視データに関連する状態を示す詳細なデータを含む監視画像に生成する。 Further, in one example of the present disclosure, the monitoring image generation unit generates a monitoring image including detailed data indicating a state related to the monitoring target device corresponding to the operation position or the monitoring data based on the operation position with respect to the monitoring image. do.
この構成では、監視状態や監視データの詳細なデータを容易に確認できる。 In this configuration, the monitoring status and detailed data of the monitoring data can be easily confirmed.
本発明によれば、予兆保全に有効な、より多くの情報をユーザに分かり易く提供できる。 According to the present invention, effective predictor integrity, can provide easy to understand the user more information.
以下、本発明の実施形態を、図を参照して説明する。 Hereinafter, embodiments of the present invention will be described with reference to the drawings.
・適用例
まず、図1を用いて、本発明が適用される一例について説明する。図1は、本発明の実施形態に係る監視画像の複数の態様の遷移関係を示すブロック図である。
-Application example First, an example to which the present invention is applied will be described with reference to FIG. FIG. 1 is a block diagram showing a transition relationship of a plurality of aspects of a surveillance image according to an embodiment of the present invention.
図1に示すように、本実施形態に係る監視状態表示装置および監視状態表示方法では、複数の態様からなる監視画像が用意されている。具体的には、監視画像は、監視対象別画像と監視種類別画像とを有する。 As shown in FIG. 1, in the monitoring state display device and the monitoring state display method according to the present embodiment, a monitoring image composed of a plurality of modes is prepared. Specifically, the monitored image has an image for each monitoring target and an image for each monitoring type.
監視対象別画像は、監視対象とする監視対象機器毎に設定された監視画像である。監視対象別画像は、監視対象別状態一覧画像、監視種類別バーグラフ、監視種類別折れ線グラフ、および、詳細状態画像を含む。 The image for each monitoring target is a monitoring image set for each monitoring target device to be monitored. The images for each monitoring target include a status list image for each monitoring target, a bar graph for each monitoring type, a line graph for each monitoring type, and a detailed status image.
監視対象別状態一覧画像は、監視対象機器の概略的な状態を、例えばアイコン等のようなシンボルマークによって表示する画像である。ここで、状態とは、例えば、正常、異常を少なくとも含み、さらに要注意状態を含むことが好ましい。 The state list image for each monitoring target is an image that displays the approximate state of the monitored device by a symbol mark such as an icon. Here, the state preferably includes, for example, normal or abnormal, and further preferably includes a state requiring attention.
監視種類別バーグラフは、監視対象機器における監視データの状態の時間遷移等を表示する画像である。 The bar graph for each monitoring type is an image that displays the time transition of the state of the monitoring data in the monitored device.
監視種類別折れ線グラフは、監視対象機器における監視データ(計測値等)の時間遷移等を表示する画像である。 The line graph for each monitoring type is an image that displays the time transition and the like of monitoring data (measured values and the like) in the monitored device.
詳細状態画像は、監視対象機器に対する各種の監視データをより詳細に表示する画像である。 The detailed status image is an image that displays various monitoring data for the monitored device in more detail.
監視種類別画像は、監視対象とする監視データ毎に設定された監視画像である。監視種類別画像は、監視種類別一覧画像、監視対象別バーグラフ、監視対象別折れ線グラフ、および、詳細状態画像を含む。 The image for each monitoring type is a monitoring image set for each monitoring data to be monitored. Monitoring by type image comprises monitoring Type a list image, monitored by a bar graph, monitored by the line graph, and the detailed state image.
監視種類別一覧画像は、監視データの概略的な状態を、例えばアイコン等のようなシンボルマークによって表示する画像である。ここで、状態とは、例えば、正常、異常を少なくとも含み、さらに要注意状態を含むことが好ましい。 Monitoring Type a list image, a schematic state monitoring data is an image to be displayed by a symbol mark, such as icons. Here, the state preferably includes, for example, normal or abnormal, and further preferably includes a state requiring attention.
監視対象別バーグラフは、監視データの内、表示対象とする監視対象機器の監視データの状態の時間遷移等を表示する画像である。これは、実質的には、監視種類別バーグラフと同様の内容を示している。 The bar graph for each monitoring target is an image that displays the time transition of the state of the monitoring data of the monitoring target device to be displayed among the monitoring data. This is substantially the same as the bar graph for each monitoring type.
監視対象別折れ線グラフは、監視データの内、表示対象とする監視対象機器の監視データの時間遷移等を表示する画像である。これは、実質的には、監視種類別折れ線グラフと同様の内容を示している。 The line graph for each monitoring target is an image that displays the time transition of the monitoring data of the monitoring target device to be displayed among the monitoring data. This shows substantially the same contents as the line graph for each monitoring type.
詳細状態画像は、監視対象機器に対する各種の監視データをより詳細に表示する画像である。 The detailed status image is an image that displays various monitoring data for the monitored device in more detail.
上述の各態様の画像は、例えば、ユーザからの操作入力にしたがって、順次切り替えが可能である。 The images of each of the above embodiments can be sequentially switched, for example, according to an operation input from the user.
このような構成によって、ユーザは、監視対象機器毎、または監視データ毎に状態やデータの遷移を視認できる。これにより、ユーザは、予兆保全に有効な情報を、より多く得られる。また、ユーザは、予兆保全に有効な情報を、より容易に且つ分かり易く得られる。 With such a configuration, the user can visually recognize the state and data transition for each monitored device or each monitored data. As a result, the user can obtain more information that is effective for predictive maintenance. In addition, the user can obtain information effective for predictive maintenance more easily and easily.
・構成例
次に、本発明の実施形態に係る監視状態表示装置および監視状態表示方法について、図を参照して説明する。上述のように、図1は、本発明の実施形態に係る監視画像の複数の態様の遷移関係を示すブロック図である。図2は、本発明の実施形態に係る監視状態表示装置の構成の一例を示すブロック図である。図3は、本発明の実施形態に係る監視状態表示装置を含む監視システムの構成の一例を示す図である。
• Configuration Example Next, the monitoring status display device and the monitoring status display method according to the embodiment of the present invention will be described with reference to the drawings. As described above, FIG. 1 is a block diagram showing a transition relationship of a plurality of aspects of the surveillance image according to the embodiment of the present invention. FIG. 2 is a block diagram showing an example of the configuration of the monitoring status display device according to the embodiment of the present invention. FIG. 3 is a diagram showing an example of a configuration of a monitoring system including a monitoring status display device according to an embodiment of the present invention.
上述のように、本実施形態に係る監視状態表示装置および監視状態表示方法では、予兆保全に有効な情報を複数の態様で示す監視画像が生成される。このような監視画像の生成は、例えば、図2に示す構成によって実現される。 As described above, in the monitoring state display device and the monitoring state display method according to the present embodiment, a monitoring image showing information effective for predictive maintenance in a plurality of modes is generated. The generation of such a surveillance image is realized by, for example, the configuration shown in FIG.
図2に示すように、監視状態表示装置10は、監視データ取得部11、状態判定部12、監視画像生成部13、記憶部14、通信制御部15、操作入力部16、および、表示部17を備える。監視状態表示装置10は、例えば、パーソナルコンピュータ等の演算処理装置と、該演算処理装置で実行される後述の処理が記載されたプログラムとによって実現される。このプログラムは、例えば、磁気媒体または半導体記憶媒体等からなる記憶部14に記憶されている。
As shown in FIG. 2, the monitoring
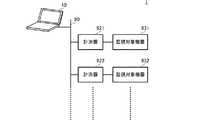
この監視状態表示装置10は、図3に示すような監視システム1の構成要素である。監視システム1は、監視状態表示装置10、ネットワーク90、計測器921、922、監視対象機器931、932を備える。なお、監視システム1に含まれる計測器および監視対象機器の個数は、図3の構成に限るものではなく、監視対象のシステムに応じて適宜設定されている。
The monitoring
計測器921は、監視対象機器931の状態に関する各種の物理量を計測する。計測器921は、計測結果に基づいて監視対象機器931に対する監視データを生成する。ここで、監視データとは、例えば、加速度、速度、温度、差温、絶縁抵抗、劣化度、電流等である。差温とは、例えば、モータ温度と周囲温度との差である。劣化度は、電流波形の乱れから算出される指数である。また、計測器921は、これら物理量以外の情報、例えば、通信エラー、電源のオン/オフ等の情報を監視対象機器931から取得、検出し、監視データに含む。計測器922は、計測器921と同様の方法で、監視対象機器932の状態に関する各種の物理量を計測する。計測器922は、計測器921と同様の方法で、計測結果に基づいて監視対象機器932に対する監視データを生成する。
The measuring
計測器921および計測器922は、ネットワーク90を介して、監視状態表示装置10に接続されている。計測器921および計測器922は、それぞれが生成した監視データを、監視状態表示装置10に送信する。
The measuring
監視状態表示装置10の通信制御部15は、上述のネットワーク90に接続されており、計測器921および計測器922との通信を制御する。監視データ取得部11は、通信制御部15およびネットワーク90を介して、計測器921および計測器922から監視データを取得する。監視データ取得部11は、監視データを、状態判定部12および監視画像生成部13に出力する。なお、監視データ取得部11は、省略が可能であり、この場合、監視データは、状態判定部12および監視画像生成部13によって取得すればよい。
The
状態判定部12は、監視データに基づいて、監視対象機器931および監視対象機器932の状態を判定する。ここで、機器の状態とは、少なくとも正常状態と異常状態とを含み、要注意状態を含むことが好ましい。要注意状態とは、異常状態ほど問題にはならないが正常状態と比較して悪化状態である。
The
この判定は、例えば、監視データが数値であれば、監視データに対して要注意状態または異常状態の基準値(しきい値)を設定し、監視データと基準値との比較によって実現される。また、この判定は、監視データがステータスを示すデータであれば、監視データのステータスと正常状態、異常状態、要注意状態に対応するステータスとの一致を検出することによって実現される。なお、この判定は、所定の時間間隔で逐次実行される。 This determination may, for example, if the monitoring data is a numerical value, and set a reference value of the suspect or abnormal conditions (the threshold value) to the monitoring data, thus being implemented in the comparison of the monitoring data and the reference value NS. Further, if the monitoring data is data indicating a status, this determination is realized by detecting a match between the status of the monitoring data and the status corresponding to the normal state, the abnormal state, and the caution state. It should be noted that this determination is sequentially executed at predetermined time intervals.
また、この判定は、監視データ毎に行われる。例えば、監視対象機器に対して複数の監視データが存在する場合には、これら複数の監視データ毎に状態の判定が行われる。 Further, this determination is made for each monitoring data. For example, when a plurality of monitoring data exist for the monitored device, the status is determined for each of the plurality of monitoring data.
状態判定部12は、判定した状態(状態判定結果)を、監視画像生成部13に出力する。また、状態判定部12は、監視対象機器の動作異常を取得し、監視画像生成部13に出力する。動作異常とは、計測値からなる監視データに基づいて判定される異常ではなく、通信エラー、電源のオン/オフ等の監視対象機器の動作そのものの異常である。
The
監視画像生成部13は、監視データおよび状態判定結果を記憶部14に記憶する。監視画像生成部13は、これら監視データまたは状態判定結果を用いて、上述の複数の態様のいずれかの監視画像を生成する。なお、複数の態様の監視画像の具体例は、後述する。
The monitoring
この際、監視画像生成部13は、操作入力部16によって、ユーザから監視画像に対して操作された内容を検出し、当該操作内容に応じた態様の監視画像を生成する。なお、操作入力部16は、例えば、キーボード、マウス、タッチパネル等によって実現される。
At this time, the monitoring
監視画像生成部13は、生成した監視画像を表示部17に出力する。表示部17は、監視画像を表示する。
The surveillance
この監視状態表示装置10および監視方法では、概略的に、次に示す処理によって、監視画像を決定して表示する。図4は、本発明の第1の実施形態に係る監視方法の概略を示すフローチャートである。
In the monitoring
まず、監視状態表示装置10は、操作入力部16によって、ユーザから表示態様の選択の受け付けを実行する(S11)。監視状態表示装置10の監視画像生成部13は、監視対象機器をメインとする表示が選択されたか、監視データの種類をメインとする表示が選択されたかを判定する(S12)。
First, the monitoring
監視画像生成部13は、監視対象機器をメインとする表示が選択されていれば、監視対象別画像を生成する(S13)。監視画像生成部13は、監視データの種類をメインとする表示が選択されていれば、監視種類別画像を生成する(S14)。
If the display mainly for the monitored device is selected, the monitored
さらに、本実施形態の監視状態表示装置10および監視方法では、次に示す処理によって、予兆保全に関連するより多くのデータを含む監視画像を生成する。図5は、本発明の第1の実施形態に係る監視方法の具体的な処理例を示すフローチャートである。
Further, in the monitoring
監視状態表示装置10の監視画像生成部13は、後述の図6(A)、図6(B)に示すような一覧画像を生成する(S21)。この際、監視画像生成部13は、選択結果に応じて、監視対象別一覧画像または監視種類別一覧画像を生成する。
The monitoring
監視画像生成部13は、一覧画像に対する操作を受け付け(S22)、その操作位置および操作内容(例えば、マウスによるシングルクリック、右クリック等)を検出する(S23)。
The monitoring
監視画像生成部13は、この操作内容に応じて、後述の図8、図10に示すようなバーグラフ画像を生成する(S24)。
The monitoring
監視画像生成部13は、バーグラフ画像に対する操作入力を受け付け、その操作位置および操作内容を検出する(S25)。監視画像生成部13は、この操作が折れ線グラフ画像の生成対象であれば(S26:YES)、後述の図11に示すような折れ線グラフ画像を生成する(S27)。
The monitoring
監視画像生成部13は、この操作が折れ線グラフ画像の生成対象でなく(S26:NO)、詳細状態画像の生成対象であれば(S29:YES)、後述の図13、図16に示すような詳細状態画像を生成する(S30)。
If this operation is not a line graph image generation target (S26: NO) but a detailed state image generation target (S29: YES), the monitoring
また、監視画像生成部13は、折れ線グラフ画像に対する操作入力を受け付け、その操作位置および操作内容を検出する(S28)。監視画像生成部13は、この操作が詳細状態画像の生成対象であれば(S29:YES)、後述の図13、図16に示すような詳細状態画像を生成する(S30)。
Further, the monitoring
このように、本実施形態の構成および処理を用いることによって、ユーザの所望する態様が異なる複数の監視画像を提供できる。これにより、予兆保全に有効な情報を、ユーザに分かり易く提供できる。 As described above, by using the configuration and processing of the present embodiment, it is possible to provide a plurality of surveillance images having different modes desired by the user. As a result, information effective for predictive maintenance can be provided to the user in an easy-to-understand manner.
次に、各監視画像の具体例を説明する。なお、以下の説明では、監視対象機器をモータとしている。しかしながら、監視対象機器は、これに限るものではない。また、監視対象機器数、監視対象の監視データの種類数も、以下で説明する個数に限るものではない。 Next, a specific example of each monitoring image will be described. In the following description, the monitored device is a motor. However, the monitored device is not limited to this. Further, the number of monitored devices and the number of types of monitored data to be monitored are not limited to the number described below.
(一覧画像)
図6(A)は、監視対象別一覧画像の一例を示す図であり、図6(B)は、監視種類別一覧画像の一例を示す図である。なお、図6(A)、図6(B)では、図を見やすくするために、記号を一部にのみ付記し、同様の箇所への記号の付記は省略している。
(List image)
FIG. 6A is a diagram showing an example of a list image by monitoring target, and FIG. 6B is a diagram showing an example of a list image by monitoring type. In addition, in FIG. 6A and FIG. 6B, in order to make the figure easier to see, the symbol is added only in a part, and the addition of the symbol to the same place is omitted.
(監視対象別一覧画像)
図6(A)に示すように、監視対象別一覧画像71Aは、複数のアイコン711、表示切替用アイコン701を有する。複数のアイコン711は、監視対象機器(モータ)毎に設定されている。すなわち、8個のモータのそれぞれに対して、アイコン711が設定されている。複数のアイコン711は、対象別一覧画像71A上に配列されている。
(List image by monitoring target)
As shown in FIG. 6A, the monitoring target-
アイコン711には、対応するモータの名称7111、このモータの状態を示すシンボルマーク7112、このモータの状態を示すテキストデータ7113、および、このモータの付加的異常を示すアイコン7114を有する。付加的異常とは、計測値からなる監視データに基づいて判定される異常ではなく、通信エラー、センサ等の電源のオン/オフ、動作異常等に基づく異常である。なお、アイコン7114は、省略することもできる。
The
シンボルマーク7112は、モータの状態に応じてデザインが異なる。例えば、図6(A)では、穴開きの○印は正常状態を示し、穴開きの○印の中に「!」マークは、注意状態を示し、塗りつぶし○印に「!」マークは異常状態を示す。これらのシンボルマーク7112の状態と、テキストデータ7113の状態とは同期している。また、シンボルマーク7112は、状態に応じて色を異ならせてもよい。例えば、正常状態では緑色、注意状態では黄色、異常状態では赤色とする。これにより、視認性は更に向上する。
The design of the
なお、この正常状態、異常状態、および、要注意状態は、現在値の判定結果である。また、アイコン711に表示される状態およびシンボルマーク7112は、対象のモータに対する複数の監視データを用い、監視データ毎に判定した判定結果の中で、最も悪いものを抽出して示している。例えば、モータ1について、複数の監視データとして加速度、速度、温度、差温、絶縁抵抗、劣化度、および、電流の状態を取得し、全てが正常状態であれば、正常状態の表示を行う。また、複数の監視データの少なくとも1つが要注意状態であり、異常状態がなければ、要注意状態の表示を行う。また、複数の監視データの少なくとも1つが異常状態であれば、異常状態の表示を行う。
The normal state, the abnormal state, and the state requiring attention are the determination results of the current values. Further, the state and the
この表示により、ユーザは、複数のモータの状態を、容易に且つ分かり易く、一括して確認できる。 With this display, the user can easily and easily understand the states of the plurality of motors at once.
(監視種類別一覧画像)
図6(B)に示すように、監視種類別一覧画像71Bは、複数のアイコン712、表示切替用アイコン701を有する。複数のアイコン712は、監視データの種類毎に設定されている。ここでは、監視データの種類は、加速度、速度、温度、差温、絶縁抵抗、劣化度、および、電流である。すなわち、7種類の監視データのそれぞれに対して、アイコン712が設定されている。複数のアイコン712は、監視種類別一覧画像71B上に、監視に使用している監視種類別に配列されている。
(List image by monitoring type)
As shown in FIG. 6B, the monitoring
アイコン712には、対応する監視データの種類7121、この監視データの状態を示すシンボルマーク7122、および、この監視データの状態を示すテキストデータ7123を有する。
The
シンボルマーク7122は、監視データの状態に応じてデザインが異なる。例えば、図6(B)では、穴開きの○印は正常状態を示し、穴開きの○印の中に「!」マークは、注意状態を示し、塗りつぶし○印に「!」マークは異常状態を示す。これらのシンボルマーク7122の状態と、テキストデータ7123の状態とは同期している。また、シンボルマーク7122は、状態に応じて色を異ならせてもよい。例えば、正常状態では緑色、注意状態では黄色、異常状態では赤色とする。これにより、視認性は更に向上する。
The design of the symbol mark 7122 differs depending on the state of the monitoring data. For example, in FIG. 6B, a ○ mark with a hole indicates a normal state, a “!” Mark in the ○ mark with a hole indicates a caution state, and a “!” Mark in a filled ○ mark indicates an abnormal state. Is shown. The state of these symbol marks 7122 and the state of the
なお、この正常状態、異常状態、および、要注意状態は、現在値の判定結果である。また、アイコン712に表示される状態およびシンボルマーク7122は、対象の監視データに対する複数の監視対象機器の状態を用いて、最も悪いものを抽出して示している。例えば、加速度について、複数の監視対象機器としてモータ1からモータ8の状態を取得し、全てが正常状態であれば、正常状態の表示を行う。また、複数の監視対象機器の少なくとも1つが要注意状態であり、異常状態がなければ、要注意状態の表示を行う。また、複数の監視対象機器の少なくとも1つが異常状態であれば、異常状態の表示を行う。
The normal state, the abnormal state, and the state requiring attention are the determination results of the current values. Further, the state displayed on the
この表示により、ユーザは、複数の監視データの状態を、容易に且つ分かり易く、一括して確認できる。 With this display, the user can easily and easily understand the status of a plurality of monitoring data at once.
なお、監視対象別一覧画像71Aおよび監視種類別一覧画像71Bに含まれる表示切替用アイコン701は、例えば、図7のような形状である。図7は、表示切替用アイコンの形状を示す図である。
The
図7に示すように、表示切替用アイコン701には、現在の画像の種類、すなわち、監視対象別一覧画像71Aであるか、監視種類別一覧画像71Bであるかが表示されている。図7の例では、監視対象別一覧画像71Aに対しては「モータ別監視」が設定され、監視種類別一覧画像71Bに対しては「監視種類別監視」が設定されている。さらに、表示切替用アイコン701は、選択操作によって、図7に示すように、選択可能な一覧画像が表示される。そして、表示切替用アイコン701によって選択操作されることで、「モータ別監視」と「監視種類別監視」との切り替え、すなわち、監視対象別一覧画像71Aと監視種類別一覧画像71Bとの切り替えが実行される。これにより、ユーザは、その時点で予兆保全として有効な一覧画像を選択して確認できる。
As shown in FIG. 7, the
そして、上述の監視対象別一覧画像71Aのアイコン711の選択操作を受け付けると、次に示す監視対象別バーグラフ画像72が生成され、表示される。また、アイコン7114の選択操作を受け付けると、付加的異常を含む後述の詳細状態画像75が生成され、表示される。
Then, when the selection operation of the
また、上述の種類別一覧画像71Bのアイコン712の選択操作を受け付けると、次に示す監視種類別バーグラフ画像73が生成され、表示される。これにより、ユーザは、監視対象機器別、または、監視データの種類別の更なる情報を、容易に確認できる。
Further, when the selection operation of the
(バーグラフ画像)
図8は、監視対象別のバーグラフ画像の一例を示す図である。図9は、バーグラフの一部を拡大した図である。図10は、監視種類別のバーグラフ画像の一例を示す図である。
(Bar graph image)
FIG. 8 is a diagram showing an example of a bar graph image for each monitoring target. FIG. 9 is an enlarged view of a part of the bar graph. FIG. 10 is a diagram showing an example of a bar graph image for each monitoring type.
(監視対象別バーグラフ画像)
図8に示すように、監視対象別バーグラフ画像72は、監視対象機器一覧ウィンドウ721、バーグラフ表示ウィンドウ722を有する。また、監視対象別バーグラフ画像72は、表示切替用アイコン701、グラフ選択用アイコン702、および、スケール切替用アイコン703を有する。
(Bar graph image by monitoring target)
As shown in FIG. 8, the
監視対象機器一覧ウィンドウ721は、監視対象機器表示ウィンドウ7211、状態表示アイコン7212を有する。監視対象機器表示ウィンドウ7211は、現在監視している監視対象機器数に応じた数が配列して表示されている。監視対象機器表示ウィンドウ7211には、それぞれの名称(例えば、モータ1、モータ2等)が記載されている。状態表示アイコン7212は、監視対象機器の要注意状態または異常状態に応じたアイコンであり、要注意状態または異常状態にある監視対象機器の監視対象機器表示ウィンドウ7211内に表示されている。これにより、ユーザは、要注意状態または異常状態にある監視対象機器を容易に確認できる。
The monitored
バーグラフ表示ウィンドウ722は、監視対象機器一覧ウィンドウ721にて選択された監視対象機器の状態を示すバーグラフ724を有する。バーグラフ724は、監視対象機器の計測に用いるデバイス毎に生成されている。バーグラフ724は、1つのデバイスに対して監視データ毎(例えば、加速度、速度、温度、差温等)に生成され、それぞれのバーグラフの時刻が一致するように、配列されている。
The bar
また、バーグラフ表示ウィンドウ722は、バーグラフ724毎に当該状態を検出する監視デバイス名723、および、現在の状態を示すアイコン725を有する。なお、アイコン725は、少なくとも要注意状態と異常状態とを判別できるものであればよい。
Further, the bar
図9に示すように、バーグラフ724は、項目表示ウィンドウ726、および、バーグラフ表示ウィンドウ727を有する。
As shown in FIG. 9, the
項目表示ウィンドウ726は、監視データの名称7261、監視データの計測値7262、監視データの単位記号7263、監視データの現在の状態を示すアイコン7264を有する。この際、監視データの計測値7262は、監視データが要注意状態または異常状態であると、それぞれの状態に応じた強調表示がされる。これにより、ユーザは、各監視データが現在、要注意状態または異常状態であることを、容易に分かり易く確認できる。また、この状態は、アイコン7264によっても確認できる。
The
バーグラフ表示ウィンドウ727には、監視データの状態に応じてそれぞれに異なる表示態様のバー7271が、時系列に表示されている。また、バーグラフ表示ウィンドウ727には、監視データの状態が変化した時刻7272が表示されている。このようなバーグラフを用いることによって、ユーザは、監視データの状態の時間遷移を、容易に分かり易く確認できる。また、時刻7272によって、状態が変化した時刻を、容易に確認できる。
In the bar
このようなバーグラフの画像を用いることによって、ユーザは、各監視対象機器における各監視データの状態の時間遷移を容易に且つ分かり易く確認できる。すなわち、監視対象機器の時系列変化を捉えることができ、予兆保全に必要となる情報を取得できる。 By using such a bar graph image, the user can easily and easily confirm the time transition of the state of each monitoring data in each monitoring target device. That is, it is possible to capture the time-series changes of the monitored equipment and acquire the information necessary for predictive maintenance.
(監視種類別バーグラフ画像)
図10に示すように、監視種類別バーグラフ画像73は、監視データ一覧ウィンドウ731、バーグラフ表示ウィンドウ732を有する。また、監視種類別バーグラフ画像73は、表示切替用アイコン701、グラフ選択用アイコン702、および、スケール切替用アイコン703を有する。
(Bar graph image by monitoring type)
As shown in FIG. 10, the
監視データ一覧ウィンドウ731は、監視データ表示ウィンドウ7311、状態表示アイコン7312を有する。監視データ表示ウィンドウ7311は、現在監視している監視データの種類数に応じた数が配列して表示されている。監視データ表示ウィンドウ7311には、それぞれの名称(例えば、加速度、速度等)が記載されている。状態表示アイコン7312は、監視データの要注意状態または異常状態に応じたアイコンであり、要注意状態または異常状態にある監視データの監視データ表示ウィンドウ7311内に表示されている。これにより、ユーザは、要注意状態または異常状態にある監視データを容易に確認できる。
The monitoring
バーグラフ表示ウィンドウ732は、監視データ一覧ウィンドウ731にて選択された監視データの状態を示すバーグラフ734を有する。また、バーグラフ724は、1つの監視データに対して監視対象機器毎(例えば、モータ1、モータ2等)に生成され、それぞれのバーグラフの時刻が一致するように、配列されている。
The bar
また、バーグラフ表示ウィンドウ732は、バーグラフ734毎に当該状態を検出する監視データ名733、および、現在の状態を示すアイコン735を有する。なお、アイコン735は、少なくとも要注意状態と異常状態とを判別できるものであればよい。
Further, the bar
バーグラフ734は、バーグラフ724と同様に、項目表示ウィンドウ、および、バーグラフ表示ウィンドウを有する。
Similar to the
項目表示ウィンドウは、監視対象機器の名称、監視データの計測値、監視データの単位記号、監視データの現在の状態を示すアイコンを有する。この際、監視データの計測値は、監視データが要注意状態または異常状態であると、それぞれの状態に応じた強調表示がされる。これにより、ユーザは、所望とする監視データに対してどの監視対象機器が現在、要注意状態または異常状態であることを、容易に分かり易く確認できる。また、この状態は、アイコンによっても確認できる。 The item display window has an icon indicating the name of the monitored device, the measured value of the monitored data, the unit symbol of the monitored data, and the current state of the monitored data. At this time, the measured value of the monitoring data is highlighted according to each state when the monitoring data is in a caution state or an abnormal state. As a result, the user can easily and easily confirm which monitored device is currently in the caution state or the abnormal state with respect to the desired monitoring data. This state can also be confirmed by the icon.
バーグラフ表示ウィンドウには、監視データの状態に応じてそれぞれに異なる表示態様のバーが、時系列に表示されている。また、バーグラフ表示ウィンドウには、監視データの状態が変化した時刻が表示されている(図10では図示を省略している)。このようなバーグラフを用いることによって、ユーザは、監視データを基準とした各監視対象機器の状態の時間遷移を、容易に分かり易く確認できる。また、時刻によって、状態が変化した時刻を、容易に確認できる。 In the bar graph display window, bars having different display modes depending on the state of the monitoring data are displayed in chronological order. Further, in the bar graph display window, the time when the state of the monitoring data changes is displayed (not shown in FIG. 10). By using such a bar graph, the user can easily and easily confirm the time transition of the state of each monitored device based on the monitoring data. In addition, the time when the state changes can be easily confirmed by the time.
このようなバーグラフの画像を用いることによって、ユーザは、各監視データにおける各監視対象機器の状態の時間遷移を容易に且つ分かり易く確認できる。すなわち、監視データを基準として、予兆保全に必要となる情報を確認できる。 By using such a bar graph image, the user can easily and easily confirm the time transition of the state of each monitored device in each monitored data. That is, the information required for predictive maintenance can be confirmed based on the monitoring data.
そして、このようなバーグラフを用いることによって、膨大な数および種類のデータの状態遷移を概略的にひと目で把握できる。これにより、高い保全スキルを有さなくても、予兆保全が可能になり、また、保全工数を削減できる。また、状態の変化、および、変化時間が容易に把握できるので、原因分析や保全計画の策定の助けになる。これにより、保全活動の効率が向上する。 Then, by using such a bar graph, the state transitions of a huge number and types of data can be roughly grasped at a glance. As a result, it is possible to perform predictive maintenance without having high maintenance skills, and it is possible to reduce maintenance man-hours. In addition, the change in state and the change time can be easily grasped, which helps to analyze the cause and formulate a maintenance plan. This will improve the efficiency of maintenance activities.
なお、監視対象別バーグラフ画像72および監視種類別バーグラフ画像73において、グラフ選択用アイコン702を操作し、後述の図11に示すような折れ線グラフを表示することができる。この際、バーグラフと折れ線グラフとを同時に表示してもよく、バーグラフに換えて折れ線グラフを表示してもよい。
In the
また、スケール切替用アイコン703を操作することによって、バーグラフの時間軸のスケールを変更できる。これにより、ユーザは、所望とする時間スケールで、状態の時間遷移を確認できる。
Further, the scale of the time axis of the bar graph can be changed by operating the
(折れ線グラフ画像)
図11は、監視対象別の折れ線グラフ画像の一例を示す図である。図12は、折れ線グラフの一部を拡大した図である。なお、以下では、バーグラフと折れ線グラフとを同時に表示する態様を示すが、バーグラフを省略することもできる。
(Line graph image)
FIG. 11 is a diagram showing an example of a line graph image for each monitoring target. FIG. 12 is an enlarged view of a part of the line graph. In the following, the mode of displaying the bar graph and the line graph at the same time is shown, but the bar graph may be omitted.
図11に示すように、折れ線グラフ画像74は、監視対象機器一覧ウィンドウ741、グラフ表示ウィンドウ742を有する。また、折れ線グラフ画像74は、表示切替用アイコン701、グラフ選択用アイコン702、および、スケール切替用アイコン703を有する。
As shown in FIG. 11, the
監視対象機器一覧ウィンドウ741は、上述の監視対象機器一覧ウィンドウ721と同様に、監視対象機器表示ウィンドウ、状態表示アイコンを有する。監視対象機器表示ウィンドウは、現在監視している監視対象機器数に応じた数が配列して表示されている。監視対象機器表示ウィンドウには、それぞれの名称(例えば、モータ1、モータ2等)が記載されている。状態表示アイコンは、監視対象機器の要注意状態または異常状態に応じたアイコンであり、要注意状態または異常状態にある監視対象機器の監視対象機器表示ウィンドウ内に表示されている。これにより、ユーザは、要注意状態または異常状態にある監視対象機器を容易に確認できる。
The monitored
グラフ表示ウィンドウ742は、監視対象機器一覧ウィンドウ741にて選択された監視対象機器の状態を示すバーグラフ744および折れ線グラフ746を有する。バーグラフ744および折れ線グラフ746は、監視対象機器の計測に用いるデバイス毎に生成されている。バーグラフ744と折れ線グラフ746とは、時刻同期して表示されている。バーグラフ744および折れ線グラフ746は、1つのデバイスに対して監視データ毎(例えば、加速度、速度、温度、差温等)に生成され、それぞれのバーグラフの時刻が一致するように、配列されている。
The
また、グラフ表示ウィンドウ742は、バーグラフ744および折れ線グラフ746毎に当該状態を検出する監視デバイス名743、および、現在の状態を示すアイコン745を有する。なお、アイコン745は、少なくとも要注意状態と異常状態とを判別できるものであればよい。
Further, the
図12に示すように、折れ線グラフ746は、横軸7461、縦軸7462、折れ線7463、要注意基準線7464、異常基準線7465、要注意領域背景7466、および、異常領域背景7467を有する。
As shown in FIG. 12, the
横軸7461には、時刻が表示され、縦軸7462は、計測値の目盛りが表示される。この横軸7461と縦軸7462とからなる平面において、監視データである計測値に応じた折れ線7463が表示される。また、要注意基準線7464は、要注意状態を判定するしきい値に基づいて表示されており、異常基準線7465は、異常状態を判定するしきい値に基づいて表示されている。要注意領域背景7466は、要注意状態を判定するしきい値と異常状態を判定するしきい値との間の領域に表示され、異常領域背景7467は、異常状態を判定するしきい値よりも高い値の領域に表示されている。要注意領域背景7466と異常領域背景7467とは、異なる色が設定されており、これらは正常状態を示す領域(要注意状態を判定するしきい値よりも低い値の領域)とも異なる色が設定されている。
The time is displayed on the
このような折れ線グラフを用いることによって、ユーザは、監視データの状態の時間遷移を、より詳細に確認できる。また、要注意基準線7464、異常基準線7465を用いることによって、要注意状態、異常状態への遷移状態をより分かり易く、詳細に確認できる。さらに、要注意領域背景7466、および、異常領域背景7467を用いることによって、要注意状態、異常状態への遷移状態をより分かり易く確認できる。
By using such a line graph, the user can confirm the time transition of the state of the monitoring data in more detail. Further, by using the
そして、このような折れ線グラフを用いることによって、わずかな兆候であっても容易に確認でき、精密な状態監視を実現できる。これにより、精密な予兆保全を実現できる。また、要注意基準線および異常基準線を用いることによって、監視データ、すなわち、機器の状態がどのように要注意状態および異常状態に遷移していくかを、精密に把握でき、高い保全スキルを要することなく、予兆保全を確実に実現できる。 Then, by using such a line graph, even a slight sign can be easily confirmed, and precise condition monitoring can be realized. As a result, precise predictive maintenance can be realized. In addition, by using the caution reference line and the abnormality reference line, it is possible to accurately grasp the monitoring data, that is, how the state of the device transitions to the caution state and the abnormality state, and to acquire high maintenance skills. Premonition maintenance can be reliably realized without the need.
また、バーグラフと折れ線グラフとを並べて表示する態様では、概略的な状態遷移と、詳細な状態遷移とを同時に比較しながら確認できる。これにより、予兆保全に有効な情報を、より多く、一括して確認でき、予兆保全に有効である。 Further, in the mode in which the bar graph and the line graph are displayed side by side, it is possible to confirm the schematic state transition and the detailed state transition while simultaneously comparing them. As a result, more information that is effective for predictive maintenance can be confirmed collectively, which is effective for predictive maintenance.
なお、図示していないが、監視データを基準として、監視対象機器毎に折れ線グラフを生成してもよい。 Although not shown, a line graph may be generated for each device to be monitored based on the monitoring data.
(監視対象別詳細状態画像)
図13は、監視対象別詳細状態画像の一例を示す図である。図13に示すように、監視対象別詳細状態画像75は、デバイス一覧ウィンドウ751、詳細内容表示ウィンドウ752を有する。詳細内容表示ウィンドウ752は、計測値表示ウィンドウ753、ステータス表示ウィンドウ754、および、グラフ表示ウィンドウ755を備える。グラフ表示ウィンドウ755は、上述のグラフ表示ウィンドウ742と同様であり、説明は省略する。
(Detailed status image for each monitoring target)
FIG. 13 is a diagram showing an example of a detailed state image for each monitoring target. As shown in FIG. 13, the
また、監視対象別詳細状態画像75は、表示切替用アイコン701、グラフ選択用アイコン702、および、スケール切替用アイコン703を有する。これらも、上述の各画像と同様であり、説明は省略する。
Further, the
デバイス一覧ウィンドウ751は、機器名称ウィンドウ7511、監視デバイス表示ウィンドウ7512を有する。
The
機器名称ウィンドウ7511には、要注意状態または異常状態に応じたアイコンが表示されている。これにより、ユーザは、要注意状態または異常状態にあることを容易に確認できる。
In the
監視デバイス表示ウィンドウ7512は、現在監視している監視対象機器のデバイス数に応じた数が配列して表示されている。監視デバイス表示ウィンドウ7512には、それぞれの名称(例えば、図13であれば、K6CM−VB等)が記載されている。
In the monitoring
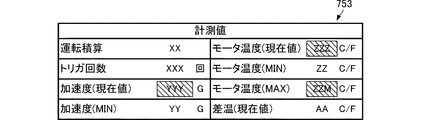
計測値表示ウィンドウ753には、機器名称ウィンドウ7511に示されている監視対象機器の各種の計測値が表示されている。図14は、計測値表示ウィンドウの一例を示す図である。図14に示すように、計測値表示ウィンドウには、計測値の種類(名称)、計測値、および、計測値の単位が表示されている。例えば、計測値の種類としては、図14に示すように、運転積算、トリガ回数、加速度(現在値)、加速度(MIN(最小値))、モータ温度(現在値)、モータ温度(MIN(最小値))、モータ温度(MAX(最大値))、差温(現在値)がある。なお、運転積算は、監視対象機器の寿命の目安になる指標である。また、トリガ回数は、計測のオンオフトリガの使用回数である。
In the measured
計測値表示ウィンドウ753では、要注意状態および異常状態にある計測値に対して強調表示が施されている。
In the measured
このような計測値の表示を行うことで、ユーザは、監視データに関するより詳細な情報を確認できる。 By displaying such measured values, the user can confirm more detailed information about the monitoring data.
ステータス表示ウィンドウ754には、機器名称ウィンドウ7511に示されている監視対象機器の各種のステータスが表示されている。
In the
図15(A)、図15(B)は、ステータス表示ウィンドウの一例を示す図である。図15(A)、図15(B)に示すように、ステータス表示ウィンドウには、監視対象機器の状態把握に有効な各種のステータスが表示されている。例えば、ステータスとしては、図15(A)、図15(B)に示すように、加速度未計測状態、加速度入力異常、加速度警報(注意)、加速度警報(異常)、モータ温度未計測状態、モータ温度入力異常、モータ温度警報(注意)、モータ温度警報(異常)、計測CPU異常、計測CPUデータフラッシュ異常、メインCPU異常、メインCPUデータフラッシュ異常、運転積算状態、計測状態、トリガ入力、異常出力等がある。すなわち、ステータスとは、計測値によって判定可能な状態ではなく、計測デバイスに関する異常等を表すものである。 15 (A) and 15 (B) are diagrams showing an example of a status display window. As shown in FIGS. 15A and 15B, various statuses effective for grasping the status of the monitored device are displayed in the status display window. For example, as the status, as shown in FIGS. 15 (A) and 15 (B), an acceleration unmeasured state, an acceleration input abnormality, an acceleration alarm (caution), an acceleration alarm (abnormal), a motor temperature unmeasured state, and a motor. Temperature input error, motor temperature alarm (caution), motor temperature alarm (abnormal), measurement CPU error, measurement CPU data flash error, main CPU error, main CPU data flash error, operation integration status, measurement status, trigger input, error output There is power etc. That is, the status is not a state that can be determined by the measured value, but represents an abnormality or the like related to the measuring device.
ステータス表示ウィンドウ754には、異常状態と判定されたステータスに対して、異常状態を示すアイコンが添えられている。
The
このようなステータスの表示を行うことで、ユーザは、計測値に基づく監視データのみでなく、より多様で詳細な情報を確認できる。 By displaying such a status, the user can confirm not only the monitoring data based on the measured value but also more diverse and detailed information.
そして、このような表示を行うことによって、ユーザは、監視対象機器を基準にした詳細な情報を、分かり易く確認できる。 Then, by performing such a display, the user can confirm detailed information based on the monitored device in an easy-to-understand manner.
(種類別詳細状態画像)
図16は、種類別詳細状態画像の一例を示す図である。図16に示すように、種類別詳細状態画像76は、監視対象機器一覧ウィンドウ761、詳細内容表示ウィンドウ762を有する。詳細内容表示ウィンドウ762は、計測値表示ウィンドウ763、ステータス表示ウィンドウ764、および、グラフ表示ウィンドウ765を備える。詳細内容表示ウィンドウ762は、上述の詳細内容表示ウィンドウ752と同様であり、説明は省略する。
(Detailed state image by type)
FIG. 16 is a diagram showing an example of a detailed state image for each type. As shown in FIG. 16, the type-specific
また、種類別詳細状態画像76は、表示切替用アイコン701、グラフ選択用アイコン702、および、スケール切替用アイコン703を有する。これらも、上述の各画像と同様であり、説明は省略する。
Further, the
監視対象機器一覧ウィンドウ761は、監視データ名称ウィンドウ7611、監視対象機器表示ウィンドウ7612を有する。
The monitored
監視データ名称ウィンドウ7611には、要注意状態または異常状態に応じたアイコンが表示されている。これにより、ユーザは、要注意状態または異常状態にあることを容易に確認できる。
In the monitoring
監視対象機器表示ウィンドウ7612は、現在監視している監視データに対応する監視対象機器数に応じた数が配列して表示されている。監視対象機器表示ウィンドウ7612には、それぞれの名称(例えば、図16であれば、モータ1等)が記載されている。
The monitored
そして、このような表示を行うことによって、ユーザは、監視データの種類を基準にした詳細な情報を、分かり易く確認できる。
Then, by performing such a display, the user can confirm detailed information based on the type of monitoring data in an easy-to-understand manner.
1:監視システム
10:監視状態表示装置
11:監視データ取得部
12:状態判定部
13:監視画像生成部
14:記憶部
15:通信制御部
16:操作入力部
17:表示部
71A:監視対象別一覧画像
71B:監視種類別一覧画像
72:監視対象別バーグラフ画像
73:監視種類別バーグラフ画像
74:折れ線グラフ画像
75:監視対象別詳細状態画像
76:監視種類別詳細状態画像
90:ネットワーク
701:表示切替用アイコン
702:グラフ選択用アイコン
703:スケール切替用アイコン
711:アイコン
712:アイコン
721:監視対象機器一覧ウィンドウ
722:バーグラフ表示ウィンドウ
723:監視デバイス名
724:バーグラフ
725:アイコン
726:項目表示ウィンドウ
727:バーグラフ表示ウィンドウ
731:監視データ一覧ウィンドウ
732:バーグラフ表示ウィンドウ
733:監視データ名
734:バーグラフ
735:アイコン
741:監視対象機器一覧ウィンドウ
742:グラフ表示ウィンドウ
743:監視デバイス名
744:バーグラフ
745:アイコン
746:線グラフ
751:デバイス一覧ウィンドウ
752:詳細内容表示ウィンドウ
753:計測値表示ウィンドウ
754:ステータス表示ウィンドウ
755:グラフ表示ウィンドウ
761:監視対象機器一覧ウィンドウ
762:詳細内容表示ウィンドウ
763:計測値表示ウィンドウ
764:ステータス表示ウィンドウ
765:グラフ表示ウィンドウ
921、922:計測器
931、932:監視対象機器
7111:名称
7112:シンボルマーク
7113:テキストデータ
7114:アイコン
7121:種類
7122:シンボルマーク
7123:テキストデータ
7211:監視対象機器表示ウィンドウ
7212:状態表示アイコン
7261:名称
7262:計測値
7263:単位記号
7264:アイコン
7271:バー
7272:時刻
7311:監視データ表示ウィンドウ
7312:状態表示アイコン
7461:横軸
7462:縦軸
7463:線
7464:要注意基準線
7465:異常基準線
7466:要注意領域背景
7467:異常領域背景
7511:機器名称ウィンドウ
7512:監視デバイス表示ウィンドウ
7611:監視データ名称ウィンドウ
7612:監視対象機器表示ウィンドウ
1: Monitoring system 10: Monitoring status display device 11: Monitoring data acquisition unit 12: Status determination unit 13: Monitoring image generation unit 14: Storage unit 15: Communication control unit 16: Operation input unit 17: Display unit 71A: By monitoring target List image 71B: List image by monitoring type 72: Bargraph image by monitoring target 73: Bargraph image by monitoring type 74: Break line graph image 75: Detailed status image by monitoring target 76: Detailed status image by monitoring type 90: Network 701 : Display switching icon 702: Graph selection icon 703: Scale switching icon 711: Icon 712: Icon 721: Monitored device list window 722: Bar graph display window 723: Monitoring device name 724: Bar graph 725: Icon 726: Item display window 727: Bar graph display window 731: Monitoring data list window 732: Bar graph display window 733: Monitoring data name 734: Bar graph 735: Icon 741: Monitoring target device list window 742: Graph display window 743: Monitoring device name 744: Bar graph 745: Icon 746: Line graph 751: Device list window 752: Detailed content display window 753: Measured value display window 754: Status display window 755: Graph display window 761: Monitored device list window 762: Detailed content display Window 763: Measured value display window 764: Status display window 765: Graph display window 921, 922: Measuring instrument 931, 932: Monitored device 7111: Name 7112: Symbol mark 7113: Text data 7114: Icon 7121: Type 7122: Symbol Mark 7123: Text data 7211: Monitored device display window 7212: Status display icon 7261: Name 7262: Measured value 7263: Unit symbol 7264: Icon 7721: Bar 7272: Time 7311: Monitoring data display window 7312: Status display icon 7461: Horizontal axis 7462: Vertical axis 7436: Line 7464: Caution reference line 7465: Abnormality reference line 7466: Caution area background 7467: Abnormal area background 7511: Device name window 7512: Monitoring device display window 7611: Monitoring data name window 7612: Monitored device display window
Claims (8)
複数の監視対象機器のそれぞれから、その監視対象機器に対して設定されている複数種類の監視データについて計測された計測値を取得する監視データ取得部と、
前記監視対象機器毎に、計測された前記監視データの計測値に基づいて、当該監視対象機器の状態を判定する状態判定部と、
前記操作入力部で受け付けた入力操作に応じた監視画像を生成する監視画像生成部と、を備え、
前記監視画像には、前記監視対象機器についての監視対象別画像、および前記監視データの種類についての監視種類別画像の種類があり、
前記監視画像生成部は、
前記状態判定部における前記状態の判定結果を時系列に示すバーグラフにかかる第1部分画像の生成、および前記監視データについて計測された計測値を時系列に示す折れ線グラフにかかる第2部分画像の生成が行え、
また、前記操作入力部で受け付けた入力操作に応じて、前記第1部分画像を含む前記監視画像の生成、または前記第2部分画像を含む前記監視画像の生成を選択的に行う、
監視状態表示装置。 An operation input unit that accepts input operations and
A monitoring data acquisition unit that acquires measured values measured for multiple types of monitoring data set for the monitored device from each of the multiple monitored devices.
For each of the monitoring target device, based on the measurement values of the monitoring data measured, and the monitoring determines the state determination unit the status of the target device,
A monitoring image generation unit that generates a monitoring image according to an input operation received by the operation input unit is provided.
The monitoring image includes a type of image for each monitoring target for the device to be monitored and a type of image for each type of monitoring for the type of monitoring data.
The surveillance image generation unit is
The generation of the first part image on the bar graph showing the judgment result of the state in the state determination unit in time series, and the second part image on the line graph showing the measured values measured for the monitoring data in time series. Can be generated,
Further, according to the input operation received by the operation input unit, the monitoring image including the first partial image or the monitoring image including the second partial image is selectively generated.
Monitoring status display device.
請求項1に記載の監視状態表示装置。 The bar graph is a time-series arrangement of bars in a display mode corresponding to the determination result of the state of the monitored device in the state determination unit.
The monitoring status display device according to claim 1.
請求項1または請求項2に記載の監視状態表示装置。 The line graph is obtained shows the determination reference line serving as a criterion of the determination result of said state,
The monitoring status display device according to claim 1 or 2.
請求項1、請求項2、または請求項3のいずれか1項に記載の監視状態表示装置。 The line graph shows the background color in a color corresponding to the determination result of the state of the monitored device in the state determination unit.
The monitoring state display device according to any one of claims 1, 2, or 3.
請求項1、請求項2、請求項3、または請求項4のいずれか1項に記載の監視状態表示装置。 The bar graph is the state determining unit has shown a detection time obtained by detecting a change in the state,
Claim 1, claim 2, monitor the state display device according to any one of claims 3 or claim 4,.
請求項1、請求項2、請求項3、請求項4、または請求項5のいずれか1項に記載の監視状態表示装置。 The operation input unit has a pointing device.
Claim 1, claim 2, claim 3, monitoring status display device according to any one of claims 4 or claim 5,.
前記監視対象機器毎に、計測された前記監視データの計測値に基づいて、当該監視対象機器の状態を判定する状態判定処理と、
操作入力部で受け付けた入力操作に応じた監視画像を生成する監視画像生成処理と、を演算処理装置が実行する監視状態表示方法であって、
前記監視画像には、前記監視対象機器についての監視対象別画像、および前記監視データの種類についての監視種類別画像の種類があり、
前記監視画像生成処理は、
前記状態判定処理における前記状態の判定結果を時系列に示すバーグラフにかかる第1部分画像の生成、および前記監視データについて計測された計測値を時系列に示す折れ線グラフにかかる第2部分画像の生成を選択的に行い、
また、前記操作入力部で受け付けた入力操作に応じて、前記第1部分画像を含む前記監視画像の生成、または前記第2部分画像を含む前記監視画像の生成を選択的に行う、
監視状態表示方法。 Monitoring data acquisition processing to acquire measured values measured for multiple types of monitoring data set for the monitored device from each of the multiple monitored devices, and
Wherein each monitoring target apparatus, based on the measurement values of the monitoring data measured, and determining the state determination process of the state of the monitored equipment,
This is a monitoring status display method in which the arithmetic processing unit executes a monitoring image generation process that generates a monitoring image according to an input operation received by the operation input unit.
The monitoring image includes a type of image for each monitoring target for the device to be monitored and a type of image for each type of monitoring for the type of monitoring data.
The surveillance image generation process is
Generation of the first partial image on the bar graph showing the determination result of the state in the state determination process in time series, and the second partial image on the line graph showing the measured values measured for the monitoring data in time series. Selectively generate
Further, according to the input operation received by the operation input unit, the monitoring image including the first partial image or the monitoring image including the second partial image is selectively generated.
Monitoring status display method.
前記監視対象機器毎に、計測された前記監視データの計測値に基づいて、当該監視対象機器の状態を判定する状態判定処理と、
操作入力部で受け付けた入力操作に応じた監視画像を生成する監視画像生成処理と、を演算処理装置に実行させる監視状態表示プログラムであって、
前記監視画像には、前記監視対象機器についての監視対象別画像、および前記監視データの種類についての監視種類別画像の種類があり、
前記監視画像生成処理は、
前記状態判定処理における前記状態の判定結果を時系列に示すバーグラフにかかる第1部分画像の生成、および前記監視データについて計測された計測値を時系列に示す折れ線グラフにかかる第2部分画像の生成を選択的に行い、
また、前記操作入力部で受け付けた入力操作に応じて、前記第1部分画像を含む前記監視画像の生成、または前記第2部分画像を含む前記監視画像の生成を選択的に行う、
監視状態表示プログラム。 Monitoring data acquisition processing to acquire measured values measured for multiple types of monitoring data set for the monitored device from each of the multiple monitored devices, and
Wherein each monitoring target apparatus, based on the measurement values of the monitoring data measured, and determining the state determination process of the state of the monitored equipment,
It is a monitoring status display program that causes an arithmetic processing unit to execute a monitoring image generation process that generates a monitoring image according to an input operation received by the operation input unit.
The monitoring image includes a type of image for each monitoring target for the device to be monitored and a type of image for each type of monitoring for the type of monitoring data.
The surveillance image generation process is
Generation of the first partial image on the bar graph showing the determination result of the state in the state determination process in time series, and the second partial image on the line graph showing the measured values measured for the monitoring data in time series. Selectively generate
Further, according to the input operation received by the operation input unit, the monitoring image including the first partial image or the monitoring image including the second partial image is selectively generated.
Monitoring status display program.
Priority Applications (3)
| Application Number | Priority Date | Filing Date | Title |
|---|---|---|---|
| JP2017227266A JP6969320B2 (en) | 2017-11-27 | 2017-11-27 | Monitoring status display device, monitoring status display method, and monitoring status display program |
| PCT/JP2018/039119 WO2019102756A1 (en) | 2017-11-27 | 2018-10-22 | Monitoring state display device, monitoring state display method, and monitoring state display program |
| TW107138551A TW201925943A (en) | 2017-11-27 | 2018-10-31 | Monitoring state display device, monitoring state display method, and monitoring state display program |
Applications Claiming Priority (1)
| Application Number | Priority Date | Filing Date | Title |
|---|---|---|---|
| JP2017227266A JP6969320B2 (en) | 2017-11-27 | 2017-11-27 | Monitoring status display device, monitoring status display method, and monitoring status display program |
Publications (2)
| Publication Number | Publication Date |
|---|---|
| JP2019096238A JP2019096238A (en) | 2019-06-20 |
| JP6969320B2 true JP6969320B2 (en) | 2021-11-24 |
Family
ID=66630596
Family Applications (1)
| Application Number | Title | Priority Date | Filing Date |
|---|---|---|---|
| JP2017227266A Active JP6969320B2 (en) | 2017-11-27 | 2017-11-27 | Monitoring status display device, monitoring status display method, and monitoring status display program |
Country Status (3)
| Country | Link |
|---|---|
| JP (1) | JP6969320B2 (en) |
| TW (1) | TW201925943A (en) |
| WO (1) | WO2019102756A1 (en) |
Families Citing this family (2)
| Publication number | Priority date | Publication date | Assignee | Title |
|---|---|---|---|---|
| TWI738214B (en) * | 2020-02-13 | 2021-09-01 | 國立虎尾科技大學 | Many-to-many state recognition system for names of Internet of things broadcasting equipment |
| JPWO2022102348A1 (en) * | 2020-11-11 | 2022-05-19 |
Family Cites Families (8)
| Publication number | Priority date | Publication date | Assignee | Title |
|---|---|---|---|---|
| JPH02193299A (en) * | 1989-01-23 | 1990-07-30 | Toshiba Corp | Process display device |
| JP2680214B2 (en) * | 1991-09-19 | 1997-11-19 | 株式会社日立製作所 | Process monitoring system |
| JP4784269B2 (en) * | 2005-11-04 | 2011-10-05 | オムロン株式会社 | Image processing device |
| JP2011154422A (en) * | 2010-01-26 | 2011-08-11 | Mitsubishi Electric Corp | Device for monitoring and controlling of plant |
| JP2013176828A (en) * | 2012-02-29 | 2013-09-09 | Ebara Corp | Remote monitoring system of polishing end point detection device |
| JP2016146014A (en) * | 2015-02-06 | 2016-08-12 | 三菱電機株式会社 | Plant monitoring control device |
| JP6638370B2 (en) * | 2015-12-15 | 2020-01-29 | オムロン株式会社 | Control device, monitoring system, control program, and recording medium |
| WO2017159501A1 (en) * | 2016-03-15 | 2017-09-21 | 日本精機株式会社 | Display device and plant equipment state collection system |
-
2017
- 2017-11-27 JP JP2017227266A patent/JP6969320B2/en active Active
-
2018
- 2018-10-22 WO PCT/JP2018/039119 patent/WO2019102756A1/en active Application Filing
- 2018-10-31 TW TW107138551A patent/TW201925943A/en unknown
Also Published As
| Publication number | Publication date |
|---|---|
| WO2019102756A1 (en) | 2019-05-31 |
| JP2019096238A (en) | 2019-06-20 |
| TW201925943A (en) | 2019-07-01 |
Similar Documents
| Publication | Publication Date | Title |
|---|---|---|
| JP5091308B2 (en) | Graphic user interface device | |
| CN107924173B (en) | Monitoring device, monitoring system, and computer-readable storage medium | |
| US8830052B2 (en) | Alarm display apparatus and alarm display method | |
| JP6794919B2 (en) | Process control system and data processing method | |
| TWI735844B (en) | Abnormality monitoring device and abnormality monitoring method | |
| JP4046309B2 (en) | Plant monitoring device | |
| US8281249B2 (en) | Apparatus and method for visually displaying an item of status information relating to a technical process on a plurality of screens | |
| JP6969320B2 (en) | Monitoring status display device, monitoring status display method, and monitoring status display program | |
| CN105051635A (en) | Navigating within graphical depiction of process control plant | |
| JP6315528B1 (en) | Anomaly detection model construction device, anomaly detection model construction method and program | |
| CN109581965A (en) | Running management device | |
| JP2006064307A (en) | Appliance diagnosis device, operation program therefor and appliance diagnosis method | |
| JP6791892B2 (en) | Anomaly detection parameter adjustment display device | |
| WO2019102757A1 (en) | Monitoring state display device, monitoring state display method, and monitoring state display program | |
| US20090309721A1 (en) | Control and monitoring system | |
| JP2009265944A (en) | Screen display method, screen display program and screen display device | |
| JP5128219B2 (en) | Display device and display method | |
| JP7203085B2 (en) | Abnormality monitoring device, abnormality monitoring method, program, control device and plant | |
| JP2012008649A (en) | State display device and state display method | |
| JP4940182B2 (en) | Actuator position check device | |
| CN109828146A (en) | A method of equipment working condition is judged by device electrical parameters AD sampling | |
| JP5459130B2 (en) | Indicator | |
| JP2006235890A (en) | Operation support system and operation support method | |
| JP7099635B2 (en) | Data acquisition equipment, plant monitoring system and data collection method | |
| JP6760985B2 (en) | Operation management device |
Legal Events
| Date | Code | Title | Description |
|---|---|---|---|
| A621 | Written request for application examination |
Free format text: JAPANESE INTERMEDIATE CODE: A621 Effective date: 20200302 |
|
| A131 | Notification of reasons for refusal |
Free format text: JAPANESE INTERMEDIATE CODE: A131 Effective date: 20210112 |
|
| A521 | Written amendment |
Free format text: JAPANESE INTERMEDIATE CODE: A523 Effective date: 20210310 |
|
| TRDD | Decision of grant or rejection written | ||
| A01 | Written decision to grant a patent or to grant a registration (utility model) |
Free format text: JAPANESE INTERMEDIATE CODE: A01 Effective date: 20210928 |
|
| A61 | First payment of annual fees (during grant procedure) |
Free format text: JAPANESE INTERMEDIATE CODE: A61 Effective date: 20211011 |
|
| R150 | Certificate of patent or registration of utility model |
Ref document number: 6969320 Country of ref document: JP Free format text: JAPANESE INTERMEDIATE CODE: R150 |