JP6514239B2 - Machine diagnostic device and machine diagnostic method - Google Patents
Machine diagnostic device and machine diagnostic method Download PDFInfo
- Publication number
- JP6514239B2 JP6514239B2 JP2016570237A JP2016570237A JP6514239B2 JP 6514239 B2 JP6514239 B2 JP 6514239B2 JP 2016570237 A JP2016570237 A JP 2016570237A JP 2016570237 A JP2016570237 A JP 2016570237A JP 6514239 B2 JP6514239 B2 JP 6514239B2
- Authority
- JP
- Japan
- Prior art keywords
- operation mode
- data
- machine
- abnormality
- measurement data
- Prior art date
- Legal status (The legal status is an assumption and is not a legal conclusion. Google has not performed a legal analysis and makes no representation as to the accuracy of the status listed.)
- Active
Links
Images


Classifications
-
- G—PHYSICS
- G05—CONTROLLING; REGULATING
- G05B—CONTROL OR REGULATING SYSTEMS IN GENERAL; FUNCTIONAL ELEMENTS OF SUCH SYSTEMS; MONITORING OR TESTING ARRANGEMENTS FOR SUCH SYSTEMS OR ELEMENTS
- G05B23/00—Testing or monitoring of control systems or parts thereof
- G05B23/02—Electric testing or monitoring
- G05B23/0205—Electric testing or monitoring by means of a monitoring system capable of detecting and responding to faults
- G05B23/0208—Electric testing or monitoring by means of a monitoring system capable of detecting and responding to faults characterized by the configuration of the monitoring system
-
- G—PHYSICS
- G05—CONTROLLING; REGULATING
- G05B—CONTROL OR REGULATING SYSTEMS IN GENERAL; FUNCTIONAL ELEMENTS OF SUCH SYSTEMS; MONITORING OR TESTING ARRANGEMENTS FOR SUCH SYSTEMS OR ELEMENTS
- G05B23/00—Testing or monitoring of control systems or parts thereof
- G05B23/02—Electric testing or monitoring
- G05B23/0205—Electric testing or monitoring by means of a monitoring system capable of detecting and responding to faults
- G05B23/0218—Electric testing or monitoring by means of a monitoring system capable of detecting and responding to faults characterised by the fault detection method dealing with either existing or incipient faults
- G05B23/0224—Process history based detection method, e.g. whereby history implies the availability of large amounts of data
- G05B23/0227—Qualitative history assessment, whereby the type of data acted upon, e.g. waveforms, images or patterns, is not relevant, e.g. rule based assessment; if-then decisions
-
- G—PHYSICS
- G01—MEASURING; TESTING
- G01R—MEASURING ELECTRIC VARIABLES; MEASURING MAGNETIC VARIABLES
- G01R31/00—Arrangements for testing electric properties; Arrangements for locating electric faults; Arrangements for electrical testing characterised by what is being tested not provided for elsewhere
- G01R31/34—Testing dynamo-electric machines
- G01R31/343—Testing dynamo-electric machines in operation
Description
本発明は、機械の異常を診断する機械診断装置および機械診断方法に関する。 The present invention relates to a machine diagnostic device and a machine diagnostic method for diagnosing machine abnormalities.
発電用ガスタービンなど社会インフラ向け機械は、1日24時間稼働することが要求されている。そのような機械の高い稼働率を維持するためには、計画外の稼働停止を防がねばならない。そのためには、保守のやり方を、従来の機械の稼働時間に基づいた定期保守から、機械の状態に基づいて予防保全を適切に行う状態監視保守への移行が必要である。 Machines for social infrastructure, such as gas turbines for power generation, are required to operate 24 hours a day. In order to maintain high availability of such machines, unplanned outages must be prevented. For this purpose, it is necessary to shift the method of maintenance from the conventional maintenance based on the operating time of the machine to the state monitoring maintenance that appropriately performs the preventive maintenance based on the state of the machine.
状態監視保守を実現するためには、機械に設けられた各種センサを介して収集されるセンサデータを定められた異常診断手順に従って分析し、機械の異常や故障の予兆を診断する機械診断装置の役割が重要となる。ここで、異常診断手順とは、1つ以上のセンサから取得されるデータを処理し、その処理結果に基づき機械の異常の予兆などを診断するコンピュータの処理フローをいう。 In order to realize condition monitoring maintenance, a machine diagnostic device that analyzes sensor data collected through various sensors provided in the machine according to a defined abnormality diagnosis procedure and diagnoses a sign of machine abnormality or failure. Role is important. Here, the abnormality diagnosis procedure refers to a processing flow of a computer that processes data acquired from one or more sensors and diagnoses a sign of machine abnormality and the like based on the processing result.
通常、このような診断の対象となる機械は、複数の運転モードを有している。そして、その機械に設けられたセンサから得られるセンサ値は、運転モード毎に異なっているのが一般的である。従って、機械診断装置の異常診断手順においては、機械の運転モードを考慮せざるを得ない。つまり、機械の運転モードを考慮しない異常診断手順は、診断結果の誤報や失報につながる。なお、誤報とは、機械の正常な状態を異常と診断したケースをいい、失報とは、機械の異常な状態を正常と診断したケースをいう。 Usually, the machine targeted for such diagnosis has a plurality of operation modes. And the sensor value obtained from the sensor provided in the machine is generally different for each operation mode. Therefore, in the abnormality diagnosis procedure of the machine diagnostic apparatus, the operation mode of the machine can not but be considered. That is, an abnormality diagnosis procedure that does not take into consideration the operation mode of the machine leads to false or false alarms in the diagnosis result. The false alarm means the case where the normal state of the machine is diagnosed as abnormal, and the false alarm means the case where the abnormal state of the machine is diagnosed as normal.
従って、従来の機械診断装置でも機械の運転モードは考慮されている。例えば、特許文献1には、運転モードを考慮した機械診断装置の先行例として、「1つの部屋内等に設置される複数の機器からなる設備を構成する各機器の運転状態の相違1つずつを全て運転モードの相違としてとらえ、各運転モードごとに、逆フィルタ等の基準データを求めておき、異常の有無の判定を行なうにあたっては、そのときに得られた信号と、そのときの運転モードと同一の運転モードについて求めておいた基準データとに基づいて異常の有無の判定を行なう」設備診断装置が開示されている。
Therefore, the operating mode of the machine is considered in the conventional machine diagnostic device. For example,
また、特許文献1の段落0052には、「コード取得部312は、図1に示す制御用コンピュータ20から、コンプレッサ室10に設置される複数のコンプレッサ12〜17からなる診断対象設備の現在の運転モードを表わすコードを受け取るものである。」とも記載されている。これは、特許文献1に開示された設備診断装置では、その診断対象の設備(機械)の運転モードが当該設備(機械)の制御用コンピュータから供給されることを意味している(特許文献1の図1も参照)。
Further, in paragraph 0052 of
しかしながら、制御用コンピュータから設備(機械)の運転モードを取得するのは、例えば、既設の機械に新たに機械診断装置を付加するような場合、必ずしも容易とはいえない。とくに、新たに付加される機械診断装置のメーカと既設の機械の制御用コンピュータのメーカとが異なる場合には、その制御用コンピュータに運転モードを出力するための新たな信号線やプログラム追加することはほとんど困難といってよい。従って、新たに設けられる機械診断装置が既設の制御用コンピュータから運転モードを取得することは実質的に困難である。 However, acquiring the operation mode of the facility (machine) from the control computer is not always easy, for example, when a machine diagnostic device is newly added to an existing machine. In particular, when the manufacturer of the newly added machine diagnostic device is different from the manufacturer of the control computer of the existing machine, add a new signal line or program for outputting the operation mode to the control computer. Is almost difficult. Therefore, it is substantially difficult for the newly provided machine diagnostic device to acquire the operation mode from the existing control computer.
以上のように、従来技術の機械(設備)診断装置は、実質的には既設の機械に適用困難という技術的問題が存在する。そこで、本発明の目的は、制御仕様が不明の既設の機械にも適用可能な機械診断装置および機械診断方法を提供することにある。 As described above, there is a technical problem that it is difficult to apply the conventional machine (equipment) diagnostic device to an existing machine. Therefore, an object of the present invention is to provide a machine diagnostic device and a machine diagnostic method that can be applied to existing machines whose control specifications are unknown.
本発明に係る機械診断装置は、1つ以上の運転モードを有する機械に取り付けられたセンサによって計測される計測データに基づき前記機械の異常を診断する機械診断装置であって、前記機械の異常の部位および態様を表す異常モードと、前記機械の異常モードが発生し得る前記機械の運転モードと、前記機械の異常モードの診断に用いられる診断手順情報と、を予め対応付けて記憶した異常診断情報記憶部と、前記センサから、そのセンサによって計測される時系列の計測データを取得するセンサデータ取得部と、前記センサデータ取得部を介して過去に取得された少なくとも1つの前記時系列の計測データのうち、ユーザによって指定された範囲における振幅、周波数、前記振幅の変化量および前記周波数の変化量に基づき、前記機械の運転モードを定義する運転モードデータを作成し、記憶装置に格納する運転モードデータ作成部と、前記センサデータ取得部を介して前記時系列の計測データを取得したときには、その計測データの振幅および周波数の時系列データを、前記記憶装置に格納されている前記運転モードデータと比較することにより、前記機械の運転モードを特定する運転モード特定部と、前記異常診断情報記憶部を参照して、前記運転モード特定部で特定される運転モードに対応付けられている前記機械の全ての異常モードを求め、前記求めた全ての異常モードのそれぞれに対応付けられている前記診断手順情報を全て求め、前記求めた全ての診断手順情報に従って、前記センサデータ取得部を介して取得される前記時系列の計測データを処理し、前記機械の異常モードの発生の有無を診断する異常診断部と、を備えることを特徴とする。 The machine diagnostic device according to the present invention is a machine diagnostic device that diagnoses an abnormality of the machine based on measurement data measured by a sensor attached to the machine having one or more operation modes, the abnormality of the machine being abnormal Abnormality diagnostic information in which an abnormal mode representing a part and an aspect, an operation mode of the machine in which an abnormal mode of the machine can occur, and diagnostic procedure information used for diagnosing an abnormal mode of the machine are stored in advance A storage unit, a sensor data acquisition unit for acquiring time-series measurement data measured by the sensor from the sensor, and at least one time-series measurement data acquired in the past via the sensor data acquisition unit of the amplitude of the range specified by the user, the frequency, based on a change amount of the change amount and the frequency of the amplitude, of the machine When the measurement data of the time series is acquired through the operation mode data creation unit that creates the operation mode data that defines the transfer mode and stores it in the storage device, the amplitude and frequency of the measurement data are acquired The operation mode identification unit for identifying the operation mode of the machine by comparing the time series data of the above with the operation mode data stored in the storage device, and referring to the abnormality diagnosis information storage unit. The abnormal mode of the machine associated with the operation mode identified by the operating mode identification unit is determined, and the diagnostic procedure information associated with each of the abnormal modes determined above is all determined, Processing the time-series measurement data acquired via the sensor data acquisition unit according to all the diagnostic procedure information determined; And abnormality diagnosis unit for diagnosing the presence or absence of the occurrence of normal mode, characterized in that it comprises a.
本発明によれば、制御仕様が不明の既設の機械にも適用可能な機械診断装置および機械診断方法が提供される。 According to the present invention, a machine diagnostic device and a machine diagnostic method that are applicable to existing machines whose control specifications are unknown are provided.
以下、本発明の実施形態について、図面を参照して詳細に説明する。 Hereinafter, embodiments of the present invention will be described in detail with reference to the drawings.
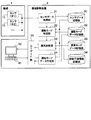
図1は、本発明の実施形態において、機械1、機械診断装置2、保守員3および管理者4がする行為の例を示した図である。機械1は、機械診断装置2による監視対象の装置であり、定期的に、または、機械診断装置2が異常ないし異常の予兆(以下、単に異常という)を検出したときには、保守員3による保守作業が行われる。機械1には、図示しない各種センサ(図2でいうセンサ11)が搭載されており、各種センサにより計測された機械1の様々な計測データは、機械診断装置2へ向けて出力される。
FIG. 1 is a diagram showing an example of actions performed by the
機械診断装置2は、機械1から各種センサにより計測された計測データを収集し、集計するとともに、定期的に、所定の異常診断手順に従って機械1における異常の有無を診断し、その診断結果を管理者4に報知する。管理者4は、機械診断装置2からの診断結果の報知に基づき、機械1の異常または異常の原因(故障の内容)を知ったときには、現場の保守員3に対し、機械1の保守作業の実施を指示する。
The machine
図2は、本発明の実施形態に係る機械診断装置2の機能的なブロック構成の例を示した図である。図2に示すように、機械診断装置2は、センサデータ取得部21、運転モード特定部22、異常診断部23、運転モードデータ作成部24、ユーザIF部25、センサデータ記憶部31、運転モードデータ記憶部32、異常モードデータ記憶部33、診断手順情報記憶部34などを含んで構成される。
FIG. 2 is a diagram showing an example of a functional block configuration of the machine
また、ハードウエアとしての機械診断装置2は、演算処理装置(マイクロプロセッサなど:図示省略)と、記憶装置(半導体メモリ、ハードディスク装置など:図示省略)と、入力装置41(キーボード、マウスなど)と、表示装置42(液晶表示装置など)と、を備えたいわゆるコンピュータによって構成される。
The machine
ここで、センサデータ取得部21、運転モード特定部22、異常診断部23、運転モードデータ作成部24およびユーザIF部25のそれぞれの機能は、前記の演算処理装置が記憶装置に記憶された所定のプログラムを実行することにより実現される。また、センサデータ記憶部31、運転モードデータ記憶部32、異常モードデータ記憶部33および診断手順情報記憶部34は、前記記憶装置の中に所定のデータが記憶されて構成される。
Here, the respective functions of the sensor
なお、本実施形態において機械診断装置2の診断対象となる機械1は、機械的な動作をすることにより所期の機能を実現する装置であればどのような装置であってもよい。ただし、本実施形態では、発明の内容を分かり易くするために、機械1は、例えば、電動機そのもの、あるいは、電動機とその電動機によって駆動される機構部を有する装置であるとする。電動機は、多くの生産設備に取り付けられる主幹部品であり、電気エネルギーを機械エネルギーに変換する。
In the present embodiment, the
機械1には、その動作状態を監視する目的で、1つまたは複数のセンサ11が取り付けられている。機械1が電動機である場合、機械1には、例えば、電動機に入力される電流を計測する電流センサ、電動機の軸受などの振動を計測する1つ以上の振動センサ、軸受周辺の温度を計測する温度センサなどが取り付けられる。センサ11は、予め定められた時間周期で電流、振動、温度などを計測し、その計測したデータを計測データとして機械診断装置2に供給する。
The
以下、機械診断装置2を構成するそれぞれのブロックについて、図2に加え、図3以降の図面を参照しながら詳しく説明する。ただし、ユーザIF部25については、詳細な説明を省略するが、ユーザIF部25は、異常診断部23や運転モードデータ作成部24での処理結果を表示装置42に表示する制御や、その表示に必要なデータなどをキーボードなどの入力装置41から取得する制御などを行うブロックである。
Hereinafter, each block constituting the machine
(センサデータの取得)
センサデータ取得部21(図2参照)は、機械1に取り付けられたセンサ11に有線または無線の通信システム(図示省略)を介して接続されている。そして、センサ11によって計測され、センサ11から供給される電流、温度、加速度などの計測データを受け取り、センサデータ記憶部31に格納する。(Acquisition of sensor data)
The sensor data acquisition unit 21 (see FIG. 2) is connected to the
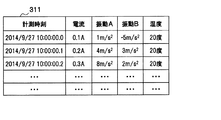
図3は、センサデータ記憶部31に記憶されるセンサデータ311の構成の例を示した図である。図3に示すように、センサデータ311は、機械1に取り付けられたそれぞれのセンサ11で計測された計測データが計測時刻に対応付けられて構成される。
FIG. 3 is a diagram showing an example of the configuration of the
図3のセンサデータ311の例では、当該センサデータ311に含まれる計測データは、例えば、電動機に取り付けられた電流センサ、2つの振動センサおよび温度計によってそれぞれ計測される電流、加速度および温度であるとしている。また、この例では、すべての計測データが、0.1秒周期で計測されているが、それぞれの計測データの計測周期が互いに異なってもよい。例えば、電流は、0.1秒周期で計測され、振動は、0.01秒周期で計測され、温度は、1秒周期で計測されるようなものであってもよい。
In the example of the
また、センサ11が計測データを計測する周期は、センサ11が計測データをセンサデータ取得部21へ送信する周期と異なっていてもよい。例えば、センサ11は、計測データを0.1秒周期で計測し、1秒分の計測データをまとめて1秒おきにセンサデータ取得部21へ供給してもよい。
Further, the cycle in which the
(運転モードの定義および特定)
図4は、運転モードデータ記憶部32に記憶される運転モードデータ321の構成の例を示した図である。図4に示すように、運転モードデータ321は、「運転モード名称」、「時間」、「振幅」、「周波数」、「運転モードID」などの項目のデータによって構成される。ここで、「運転モード名称」は、機械1の運転時に現れる運転モードを識別する名称、「時間」は、当該運転モードの特定に必要な継続時間、「センサ」は、当該運転モードの特定に用いられる計測データの名称、「振幅」は、当該計測データの振幅値または振幅値の変化量、「周波数」は、当該計測データの周波数または周波数の変化量、「運転モードID」は、当該運転モードを識別する番号または記号である。(Define and identify the operation mode)
FIG. 4 is a diagram showing an example of the configuration of the
運転モードデータ321は、機械1の運転モードを定義するデータであり、運転モードデータ作成部24(図2参照)で作成される。また、運転モードデータ321は、運転モード特定部22が、センサデータ取得部21で取得された計測データがいずれの運転モードに属するか、を特定するときに用いられる。
The
図4の例では、運転モードは、機械1(電動機)での電流の計測データによって特定されるとしている。そして、例えば、周波数50Hzの電流の振幅が10秒の間に0Aから10Aに上昇した場合、その運転モードを「起動運転モード」と定義する。また、周波数50Hzの電流が3秒間一定の振幅10Aを維持した場合、その運転モードを「定常運転モード」と定義する。また、一定の振幅10Aを有する電流の周波数が10秒の間に50Hzから80Hzへ変化した場合、その運転モードを「加速運転モード」と定義する。 In the example of FIG. 4, the operation mode is specified by measurement data of current in the machine 1 (motor). Then, for example, when the amplitude of the current of 50 Hz in frequency rises from 0 A to 10 A in 10 seconds, the operation mode is defined as “start operation mode”. Further, when a current of 50 Hz in frequency maintains a constant amplitude of 10 A for 3 seconds, the operation mode is defined as a “steady operation mode”. Further, when the frequency of the current having a constant amplitude 10A changes from 50 Hz to 80 Hz in 10 seconds, the operation mode is defined as "acceleration operation mode".
図5は、機械1が電動機である場合の各運転モードにおける電流波形の例を示した図であり、(a)は、起動運転モードの電流波形の例、(b)は、定常運転モードの電流波形の例、(c)は、加速運転モードの電流波形の例である。図5(a)に示すように、起動運転モードでは、電流の周波数は概ね一定であるが、電流の振幅は、0Aから所定の電流値(例えば、10A)になるまで徐々に増加する。また、図5(b)に示すように、定常運転モードでは、電流の計測値は、振幅、周波数ともに一定の値となる。これは、電動機が一定の回転数で定常的に稼働している状態を表している。また、図5(c)に示すように、加速運転モードでは、電流の振幅は一定であるが、周波数は、例えば、50Hzから80Hzへと徐々に増加する。これは、電動機の回転数が徐々に増加している状態を表している。
FIG. 5 is a diagram showing an example of a current waveform in each operation mode when the
なお、運転モードは、図4および図5に示した運転モードのほかにも、適宜、定義することができる。機械1が電動機の場合、さらに、減速運転モードや停止運転モードがあってもよい。また、定常運転モードにしても、周波数や振幅が互いに異なる第2、第3の定常運転モードがあってもよい。
In addition to the operation modes shown in FIGS. 4 and 5, the operation mode can be defined as appropriate. When the
また、運転モードは、複数の計測データの組み合わせによって定義されるものであってもよい。例えば、機械1に入力する電流に加え、機械1周辺の温度を用い、低温時の起動運転モード、常温時の起動運転モードなどを定義してもよい。ただし、温度など変動時間が非常に長い計測データについては、図4の運転モードデータ321でいう「振幅」は、その計測データそのもの(温度など)であるとする。また、「周波数」は、とくに値を定めず、単に一定であるとする。
In addition, the operation mode may be defined by a combination of a plurality of measurement data. For example, in addition to the current input to the
以上、図4および図5に示した運転モードの例は、簡単な例であるが、一般には、運転モードの定義は、必ずしも誰にでもできるものではない。とくに、機械1の制御仕様が開示されていないような場合には、その機械1の動作や運転に精通した専門家でなければ、その運転モードを適切に定義することは困難である。そこで、本実施形態に係る機械診断装置2では、次に示すように、専門家の介入による運転モードの定義をサポートする仕組みが組み込まれている。
As mentioned above, although the example of the driving | running mode shown to FIG. 4 and FIG. 5 is a simple example, the definition of a driving | running mode is not necessarily a thing which anyone can generally do. In particular, when the control specifications of the
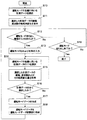
図6は、運転モードデータ作成部24が実行する処理フローの例を示した図、図7は、運転モードデータ作成部24での処理で表示される運転モード定義画面50の例を示した図である。図6に示すように、運転モードデータ作成部24は、まず、専門家が入力装置41を介して入力するデータに基づき、運転モードの定義に用いるセンサ11の計測データを選択する(ステップS10)。この処理は、表示装置42の表示画面(図示省略)に表示されたセンサ11の計測データの名称一覧の中から、専門家が運転モードの定義に用いる計測データを選択するものであってもよく、または、専門家が入力装置41(キーボードなど)を介して、直接、その計測データの名称などを入力するものであってもよい。なお、この選択では、一般には、複数の計測データの選択が可能であるとする。
FIG. 6 is a diagram showing an example of the processing flow executed by the driving mode
次に、運転モードデータ作成部24は、センサデータ記憶部31から、前記選択した計測データについて過去に取得されたデータを読み出し、その計測データの時系列データ、その振幅および周波数の時系列変化を表示装置42に表示する(ステップS11)。ここで、振幅とは、センサデータの包絡線から得られる値、周波数とは、所定の時間に区分したセンサデータの周波数分析(周波数変換)により得られる周波数を意味する。
Next, the operation mode
図7に示すように、例えば、運転モード定義画面50には、選択された計測データである電流の時系列データ、その電流の振幅および周波数の時系列変化がグラフ表示される。なお、このグラフ表示では、時系列の計測データやその振幅および周波数を、適宜、時間軸をスクロール移動させて表示したり、時間軸を圧縮して表示したりすることが可能であるとする。
As shown in FIG. 7, for example, on the operation
そこで、機械1の動作や運転に精通した専門家は、この運転モード定義画面50を用いて機械1の運転モードを定義する。まず、専門家は、マウスカーソルなどの入力装置41を介して、運転モード定義画面50上で定義しようとする運転モードの範囲を定める切り出し情報を入力する。なお、図7の運転モード定義画面50では、運転モードの切り出し情報は、破線の矩形51で表わされている。
Therefore, a specialist who is familiar with the operation and operation of the
このとき、運転モードデータ作成部24は、図6に示すように、運転モードの切り出し情報(矩形51)が入力装置41から入力されたか否かを判定する(ステップS12)。そして、運転モードの切り出し情報(矩形51)が入力された場合には(ステップS12でYes)、運転モードデータ作成部24は、さらに、当該運転モードに付与すべき運転モードIDやその名称を入力する(ステップS13)。
At this time, as shown in FIG. 6, the operation mode
例えば、図7に示すように、運転モード定義画面50において、運転モードの範囲を定める破線の矩形51が入力されると、その運転モード定義画面50には、運転モードIDの定義窓52が併せて表示される。そして、その定義窓52の中には、当該運転モードの運転モードIDを入力するための入力ボックス521や、運転モード名称を入力するための入力ボックス522などが表示される。従って、専門家は、この定義窓52における入力ボックス521,555を介して当該運転モードの運転モードIDおよび運転モード名称を入力することができる。
For example, as shown in FIG. 7, when a
続いて、運転モードデータ作成部24は、ステップS10で選択した運転モードの定義に用いる計測データの中から、その1つを選択する(ステップS14)。そして、その選択した計測データについて、当該運転モードを切り出すための矩形51に含まれる範囲における振幅、周波数およびその時間変化量を取得する(ステップS15)。例えば、時刻0から10秒間の起動運転モードでは、電流の振幅は、0Aから10Aまで上昇し、周波数は50Hzで一定であるなどの情報を取得する。
Subsequently, the operation mode
次に、運転モードデータ作成部24は、ステップS14において、運転モードの定義に用いる計測データを全て選択したか否かを判定する(ステップS16)。そして、全ての計測データを未だ選択していなかった場合には(ステップS16でNo)、ステップS14およびステップS15の処理を繰り返し実行する。一方、前記の計測データを全て選択していた場合には(ステップS16でYes)、運転モードデータ作成部24は、ステップS15で取得したそれぞれの計測データについての振幅、周波数およびその時間変化量をまとめ、当該運転モードに係る運転モードデータを作成する(ステップS17)。そして、その作成した運転モードデータを運転モードデータ記憶部32に格納し(ステップS18)、ステップS12以下の処理を再度実行する。
Next, in step S14, the operation mode
また、ステップS12の判定で、運転モードの切り出し情報(矩形51)が入力されず(ステップS12でNo)、さらに運転モード切り出しを終了する情報も入力されなかった場合には(ステップS19でNo)、運転モードデータ作成部24は、ステップS12の処理を再度実行する。一方、ステップS12の判定で、運転モードの切り出し情報(矩形51)が入力されず(ステップS12でNo)、代わりに運転モード切り出しを終了する情報が入力された場合には(ステップS19でYes)、運転モードデータ作成部24は、図6の運転モードデータ作成処理を終了する。なお、図7の運転モード定義画面50には、「終了」ボタン53が設けられており、ここでは、「終了」ボタン53がクリックされることをもって、運転モード切り出しを終了する情報が入力されたものとする。
Further, in the determination of step S12, when the cutout information (rectangle 51) of the operation mode is not input (No in step S12) and the information for ending the operation mode cutout is also not input (No in step S19) The operation mode
以上の運転モードデータ作成部24の処理により、運転モードデータ記憶部32には、全ての運転モードに係る運転モードデータ、すなわち、運転モードデータ321(図4参照)が作成されたことになる。そして、この運転モードデータ321は、運転モード特定部22が機械1の運転モードを特定するとき、それぞれの運転モードの基準データとして用いられる。
By the above processing of the operation mode
図8は、運転モード特定部22が実行する処理フローの例を示した図である。図8に示すように、運転モード特定部22は、まず、センサデータ取得部21を介して入力されるセンサデータ311(図3参照)のうち、運転モードデータ321で運転モードの定義に用いるとしている計測データの時系列データを取得する(ステップS31)。
FIG. 8 is a diagram showing an example of a process flow performed by the operation
次に、運転モード特定部22は、前記取得した計測データの時系列データを、「振幅」および「周波数」の時系列データに変換する(ステップS32)。なお、ここでいう「振幅」は、その変動周期が計測データの取得周期(サンプリング周期)に比べ非常に大きい場合には、計測データの時系列データそのものであってもよく、その場合は、「振幅」への変換は不要である。
Next, the operation
次に、運転モード特定部22は、運転モードデータ記憶部32に記憶されている運転モードデータ321を参照し、その中から運転モードの定義データを1つの選択する(ステップS33)。
Next, the operation
次に、運転モード特定部22は、ステップS32で求めた計測データの「振幅」および「周波数」の時系列データを、ステップS33で選択した運転モードの定義データ、より詳しくは、運転モードデータ321の「振幅」、「周波数」および「時間」の欄のデータ(図4参照)と比較する(ステップS34)。そして、その比較の結果、両者が一致した場合には(ステップS35でYes)、運転モード特定部22は、その一致した時間部分に対応するセンサデータ311が属する運転モードがステップS33で選択した運転モードであると特定する(ステップS36)。その結果、運転モードIDが取得されたこととなるので、図8の処理を終了する。なお、こうして取得された運転モードIDは、異常診断部23へ供給される。
Next, the operation
一方、ステップS34の比較の結果、両者が一致していなかった場合には(ステップS35でNo)、運転モード特定部22は、さらに、ステップS33の判定で全ての運転モードの定義データを選択していたか否かを判定する(ステップS37)。その判定の結果、未だ全ての運転モードの定義データを選択していなかった場合には(ステップS37でNo)、ステップS33に戻って、ステップS33以下の処理を繰り返して実行する。
On the other hand, as a result of comparison in step S34, when both do not match (No in step S35), operation
また、ステップS37の判定で、運転モードの定義データを全て選択していたと判定された場合には(ステップS37でYes)、運転モード特定部22は、運転モードを特定せずに図8の処理を終了する。従って、この場合には、運転モードIDは取得されないので、後続の異常診断部23での処理は行われない。
If it is determined in step S37 that all operation mode definition data has been selected (Yes in step S37), the operation
以上、図8を用いて示した処理は、所定の時間周期で次々に取得されるセンサデータ311が、運転モードデータ記憶部32に記憶されているそれぞれの運転モードの定義データのいずれに一致するかを検索する処理に他ならない。
As described above, in the process shown by using FIG. 8, the
(機械1の異常診断)
異常診断部23(図2参照)は、運転モード特定部22から運転モードIDを受け取ると機械1の異常診断を行う。以下、図9〜図13の図面を参照しつつ、異常診断部23が行う異常診断の詳細について説明する。(Abnormal diagnosis of machine 1)
The abnormality diagnosis unit 23 (see FIG. 2) diagnoses the abnormality of the
図9は、異常モードデータ記憶部33に記憶される異常モードデータ331の構成の例を示した図である。図8に示すように、異常モードデータ331は、「異常モード」それぞれに対し、「運転モードID」および「診断手順ID」が対応づけられて構成される。ここで、「異常モード」は、機械1において発生する異常または故障(以下、単に、異常という)を識別する情報であり、多くの場合、その異常の態様または発生部位を表す。また、「運転モードID」は、前記「異常モード」が発生し得る運転モードを示した情報である。また、「診断手順ID」は、前記「異常モード」を検出ための診断手順情報を識別する情報である。
FIG. 9 is a diagram showing an example of the configuration of the
図9の異常モードデータ331の例では、「異常モード」として電動機の軸受の内輪に傷が生じた「軸受内輪傷」、軸受の外輪に傷が生じた「軸受外輪傷」、電動機の固定子の絶縁体が劣化した「固定子絶縁体劣化」などが示されている。さらに、図9の例によれば、「軸受内輪傷」という異常モードは、「運転モードID」が「1」または「2」の運転モードで発生し、その異常は、「診断手順ID」が「1」の診断手順により検出されることなどが示されている。
In the example of the
なお、本実施形態では、以上のような異常モードデータ331は、機械1の動作や運転に精通した専門家が過去の異常診断の経験や結果に基づき、事前に用意したデータであるとする。また、「異常モード」は、図9の例に限定されるものではない。
In the present embodiment, it is assumed that the
図10は、診断手順情報記憶部34に記憶される診断手順情報341の構成の例を示した図である。図10に示すように、診断手順情報記憶部34には、通常、複数種類の診断手順情報341が記憶されており、それぞれの診断手順情報341は、「診断手順ID」、「センサ」、「前処理」、「アルゴリズム」、「後処理」などの情報を含んで構成されている。
FIG. 10 is a diagram showing an example of the configuration of the
ここで、「診断手順ID」は、診断手順情報記憶部34内において、それぞれの診断手順情報341を識別する情報である。また、「センサ」は、当該診断手順で用いられる計測データの名称である。図10の例では、当該診断手順では「振動A」および「温度」が用いられることが示されている。
Here, the “diagnostic procedure ID” is information for identifying each
「前処理」は、診断アルゴリズムを適用する際に「センサ」で指定される計測データに対し施す処理を指定する情報である。「前処理」の例としては、ノイズ除去のためのフィルタリング処理、移動平均処理などがある。また、計測データが周期的なデータである場合には、周波数解析処理などを施すことができる。なお、図10の例では、「前処理」として「振動A」の計測データに周波数解析処理を施すことが示されている。 The “pre-processing” is information specifying a process to be performed on measurement data specified by the “sensor” when applying a diagnostic algorithm. Examples of “pre-processing” include filtering for noise removal and moving average processing. In addition, when the measurement data is periodic data, frequency analysis processing can be performed. In the example of FIG. 10, it is shown that the frequency analysis processing is performed on the measurement data of “vibration A” as “pre-processing”.
「アルゴリズム」は、当該診断手順で用いられる異常検出のアルゴリズムを特定する情報である。図10の例では、「アルゴリズム」として、「K平均法」のクラスタ分析が用いられること、さらに、その付属情報として、そのクラスタ分析で用いられる「クラスタ情報がDatafile0」に格納されていることが示されている。なお、異常検出のアルゴリズムとしては、例えば、「主成分分析」などであってもよい。
The "algorithm" is information specifying an algorithm of anomaly detection used in the diagnostic procedure. In the example of FIG. 10, cluster analysis of "K-means method" is used as "algorithm" and, further, "cluster information used in the cluster analysis is stored in
「後処理」は、前記の異常検出のアルゴリズムが適用された後、機械1の異常を判定する処理で用いられる異常判定の条件などを特定する情報である。図10の例では、「後処理」、すなわち、異常判定の条件として、異常度3以上が3秒以上継続することが示されている。
The “post-processing” is information for specifying the condition of abnormality determination and the like used in the process of determining an abnormality of the
なお、クラスタ分析では、所定の時刻ごとに前記「センサ」で指定されるn個の計測データが取得されるので、そのn個の計測データを成分とするn次元ベクトル空間を想定する。そして、そのn次元ベクトル空間の中で、過去に取得された各時刻のn個の成分を有する計測データを用いて、クラスタ情報が作成される。すなわち、各時刻のn個の成分を有する計測データは、n次元ベクトル空間の中で各クラスタに分けられる。本実施形態では、このようなクラスタ情報(例えば、Datafile0)は、機械1の運転モードごとに作成される。
In cluster analysis, n measurement data designated by the “sensor” are acquired at predetermined time intervals, so an n-dimensional vector space is assumed, which has the n measurement data as a component. Then, cluster information is created using measurement data having n components of each time acquired in the past in the n-dimensional vector space. That is, measurement data having n components at each time is divided into clusters in the n-dimensional vector space. In the present embodiment, such cluster information (for example, Datafile 0) is created for each operation mode of the
そして、センサ11で計測される計測データの中に、いずれのクラスタにも属さないような計測データがあった場合には、その計測データは異常、すなわち、機械1に異常または異常の兆候が現れたとみなされる。
Then, when there is measurement data which does not belong to any cluster among the measurement data measured by the
クラスタ分析では、「異常度」は、前記のn次元ベクトル空間において、各時刻の計測データが表す位置とその位置に最も近いクラスタの中心との間のユークリッド距離として定義される。本実施形態では、異常度は「後処理」で計算され、異常度3以上が3秒以上継続した場合、機械1の異常とみなされる。
In cluster analysis, the "abnormality" is defined as the Euclidean distance between the position represented by the measurement data at each time and the center of the cluster closest to the position in the n-dimensional vector space. In the present embodiment, the degree of abnormality is calculated by “post-processing”, and when the degree of
なお、本実施形態でいう計測データは、センサ11から得られる実際の計測データだけでなく、その実際の計測データを「前処理」したデータであってもよい。例えば、ある計測データについて周波数解析の「前処理」を実施した場合には、その計測データの各周波数帯域のパワー値(スペクトル値)の時系列データもクラスタ分析対象の計測データとみなされる。
The measurement data in the present embodiment may be not only the actual measurement data obtained from the
図11は、異常診断部23が実行する異常診断処理の処理フローの例を示した図である。図11に示すように、異常診断部23は、まず、運転モード特定部22から供給される運転モードID取得する(ステップS41)。例えば、運転モード特定部22から供給される運転モードID「1」(起動運転モード:図4参照)を取得する。
FIG. 11 is a diagram showing an example of a processing flow of abnormality diagnosis processing executed by the
次に、異常診断部23は、異常モードデータ記憶部33の異常モードデータ331を参照して、その「運転モードID」の欄に前記運転モードID(ステップS41で取得した異常モードID)が含まれる行データの1つを選択する(ステップS42)。図9の例では、異常診断部23は、異常モードデータ331の「運転モードID」の欄に「1」が含まれる行の中から1行を選択して読み出す。例えば、1行目のデータ(異常モードが「軸受内輪傷」で診断手順IDが「1」のデータ)を読み出す。
Next, the
次に、異常診断部23は、前記読み出した異常モードデータの中に含まれている診断手順IDを抽出する(ステップS43)。図9の異常モードデータ331の1行目のデータの場合、診断手順IDが「1」が読み出され、また、その1行目のデータからは、診断手順ID「1」で指定される診断手順が、「軸受内輪傷」という異常モードの有無を診断する手順であることが分かる。
Next, the
次に、異常診断部23は、診断手順情報記憶部34から前記診断手順IDで指定される診断手順情報341を読み出し(ステップS44)、さらに、センサデータ記憶部31から前記診断手順情報341の「センサ」欄で指定されている診断対象の計測データを読み出す(ステップS45)。図10の診断手順情報341の例の場合、センサデータ記憶部31から「振動A」および「温度」の計測データが読み出される。
Next, the
次に、異常診断部23は、前記読み出した診断対象の計測データに対し、前記診断手順情報341で指定される「前処理」、「アルゴリズム」および「後処理」を施すことにより診断処理を実行する(ステップS46)。例えば、図10の診断手順の例では、異常診断部23は、「振動A」の計測データに対し「周波数解析」の前処理を施し、「振動A」および「温度」の計測データに対し「K平均法」のクラスタ分析を実施する。そして、そのクラスタ分析の結果に基づき、異常度3以上が3秒以上継続するケースを異常として検出するという後処理を実施する。
Next, the
次に、異常診断部23は、異常モードデータ331から前記異常モードID(ステップS41で取得した異常モードID)が含まれる行データを全て選択したか否かを判定する(ステップS47)。なお、この判定は、ステップS42の処理結果に対して行われる処理である。そこで、ステップS47の判定で、前記異常モードIDが含まれる行データを全て選択していなかった場合には(ステップS47でNo)、異常診断部23は、ステップS42以下の処理を再度繰り返して実行する。
Next, the
一方、ステップS47の判定で、前記異常モードIDが含まれる行データを全て選択していた場合には(ステップS47でYes)、異常診断部23は、ステップS46の診断処理で得られた診断結果を表示装置42に表示する(ステップS48)。
On the other hand, when all the line data including the abnormal mode ID is selected in the determination of step S47 (Yes in step S47), the
図12は、異常診断部23が表示装置42に表示する診断結果表示画面60の例を示した図である。異常診断部23は、図11の異常診断処理における診断結果表示処理(ステップS48)では、ステップS46の診断処理で検出した異常を異常発生状況リスト61として表示する。異常発生状況リスト61は、異常の発生時刻と、異常モードと、運転モードと異常度とを含んで構成され、それぞれの行のデータは、異常が検出されるたびに表示される。
FIG. 12 is a diagram showing an example of a diagnosis
なお、図12の例では、例えば、2014年9月27日15時05分00秒に「軸受内輪傷」の異常モードが検出され、そのときの運転モードが「定常運転モード」であり、異常度が「10」であったことが示されている。 In the example of FIG. 12, for example, the abnormal mode of “Bearing inside ring damage” is detected at 15:05:00 on September 27, 2014, and the operation mode at that time is “steady operation mode”, which is abnormal. It is shown that the degree was "10".
また、診断結果表示画面60には、「詳細表示」ボタン62および「終了」ボタン63が表示されており、「詳細表示」ボタン62がクリックされたときには、次に図13に示すような表示画面が表示される。一方、「終了」ボタン63クリックされたときには、異常発生状況リスト61が表示された診断結果表示画面60を閉じる。
Further, the “detail display”
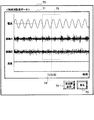
図13は、診断結果表示画面60のサブ画面として表示される計測データ詳細表示画面70の例を示した図である。図13に示すように、計測データ詳細表示画面70には、時系列計測データ71、「周波数表示」ボタン72および「戻る」ボタン73が表示される。ここで、時系列計測データ71として表示される計測データとしては、異常の診断処理(図11のステップS14)で診断対象となった計測データに加えて、運転モードの特定に用いられた計測データを含むものとする。
FIG. 13 is a diagram showing an example of the measurement data
ちなみに、図13の例では、診断対象となった計測データとして、「振動A」、「振動B」および「温度」の時系列計測データ71が表示され、運転モードの特定に用いられた計測データとして、「電流」の時系列計測データ71が表示されている。なお、このとき、時系列計測データ71は、波形データで表示され、表示される時間範囲は、例えば、異常発生時刻74を中心に、適宜、前後に伸縮可能であるとする。すなわち、計測データ詳細表示画面70には、時系列計測データ71を、例えば、異常発生時刻74を中心に、前後1秒分表示することもでき、あるいは、5秒分表示することもできる。
By the way, in the example of FIG. 13, time
さらに、ユーザは、計測データ詳細表示画面70に表示された時系列計測データ71を用いて、周波数分析対象の時間ウィンドウ75を適宜設定することができる。このとき、ユーザがさらに「周波数表示」ボタン72をクリックすると、表示装置42には、時間ウィンドウ75に含まれる時間範囲について、時系列計測データ71に表示されている計測データの周波数分析が行われ、次の図14に示すような周波数分析結果表示画面80が表示される。また、このとき、「戻る」ボタン73がクリックされると、図13の計測データ詳細表示画面70は閉じられ、上位の診断結果表示画面60に戻る。
Furthermore, the user can appropriately set the
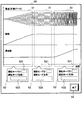
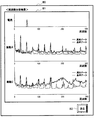
図14は、計測データ詳細表示画面70のサブ画面として表示される周波数分析結果表示画面80の例を示した図である。図14に示すように、周波数分析結果表示画面80には、計測データ詳細表示画面70に表示された時系列計測データ71の全部またはその一部を対象に、前記時間ウィンドウ75で指定された時間範囲についての周波数分析結果81が表示される。このとき、周波数分析結果81は、横軸に周波数、縦軸に所定の周波数帯域ごとのパワー値(スペクトル値)が表示される。
FIG. 14 is a diagram showing an example of a frequency analysis
さらに、ここでは、ユーザの便宜のために、異常が検出された時系列データ71および異常がない時系列データ71それぞれについての周波数分析結果のデータが同時に表示されるものとしている。図14では、異常が検出された時系列データ71の周波数分析結果は、「異常データ」として実線で表示され、異常がない時系列データ71の周波数分析結果は、「基準データ」として破線で表示されている。なお、このとき表示される基準データは、例えば、診断のクラスタ処理において当該異常データに最も近いとされるクラスタ内に含まれるデータから選ばれる。
Furthermore, here, for convenience of the user, it is assumed that the data of the frequency analysis result for each of the time-
また、図14の例では、「電流」は、例えば、50Hz近傍に安定したスペクトル値が現れているのに対し、「振動A」および「振動B」は、ほぼ全周波数帯域にわたって異常データのスペクトル値が基準データよりも上がっていることが分かる。とくに「振動B」については、150Hz以上の周波数帯域で両者のスペクトル値に大きな相違があることが分かる。このようなスペクトル値の挙動の相違は、「振動A」や「振動B」に何らかの異常があるために生じる。
従って、本実施形態では、ユーザは、診断処理で異常が検知された場合、周波数分析結果表示画面80を表示させることにより、異常データが基準データと相違する周波数帯域の状況などを速やかに確認することができる。Further, in the example of FIG. 14, for example, “spectrum A” and “oscillation B” have spectra of abnormal data over substantially the entire frequency band while “current” has a stable spectrum value appearing near 50 Hz, for example. It can be seen that the value is higher than the reference data. In particular, as for “vibration B”, it can be seen that there is a large difference between the spectral values of the two in a frequency band of 150 Hz or more. The difference in the behavior of such spectral values occurs because there is some abnormality in "vibration A" and "vibration B".
Therefore, in the present embodiment, when an abnormality is detected in the diagnosis process, the user promptly confirms the status of the frequency band or the like in which the abnormal data differs from the reference data by displaying the frequency analysis
なお、図14では、周波数分析結果表示画面80には、周波数分析結果81は、時間ウィンドウ75(図13参照)で指定された1つの時間範囲についての周波数分析結果81しか表示されていないが、所定の時間範囲ごと(例えば、1秒ごと)の複数の周波数分析結果を時系列的に表示されるものであってもよい。
In FIG. 14, the
また、周波数分析結果表示画面80には、周波数分析結果81とともに「戻る」ボタン82が表示されており、この「戻る」ボタン82がクリックされると、図14の周波数分析結果表示画面80は閉じられ、上位の計測データ詳細表示画面70に戻る。
In addition, a "Return"
以上、詳しく説明したように、本実施形態に係る機械診断装置2は、まず、機械1の運転モードを特定した上で、その運転モードで生じ得る異常モードが実際に生じているか否かを、運転モードごとの計測データを用いたクラスタ分析などに基づき判定する。従って、本実施形態では、センサ11からの計測データは、運転モードごとに別々に異常診断が行われるので、診断結果の誤報や失報を減少させることができる。
As described above in detail, the machine
また、本実施形態では、機械診断装置2は、センサ11から得られる計測データを用いて機械1の運転モードを特定する。そのため、機械診断装置2は、機械1の制御コンピュータなどから運転モードを識別する情報を取得する必要がない。よって、本実施形態は、制御仕様が不明の既設の機械1にも適用することができる。すなわち、本実施形態では、機械診断装置2を機械1の制御コンピュータに接続しなくても済む。
Further, in the present embodiment, the machine
1 機械
2 機械診断装置
3 保守員
4 管理者
11 センサ
21 センサデータ取得部
22 運転モード特定部
23 異常診断部
24 運転モードデータ作成部
25 ユーザIF部
31 センサデータ記憶部
32 運転モードデータ記憶部
33 異常モードデータ記憶部
34 診断手順情報記憶部
41 入力装置
42 表示装置
50 運転モード定義画面
60 診断結果表示画面
70 計測データ詳細表示画面
80 周波数分析結果表示画面DESCRIPTION OF
Claims (8)
前記機械の異常の部位および態様を表す異常モードと、前記機械の異常モードが発生し得る前記機械の運転モードと、前記機械の異常モードの診断に用いられる診断手順情報と、を予め対応付けて記憶した異常診断情報記憶部と、
前記センサから、そのセンサによって計測される時系列の計測データを取得するセンサデータ取得部と、
前記センサデータ取得部を介して過去に取得された少なくとも1つの前記時系列の計測データのうち、ユーザによって指定された範囲における振幅、周波数、前記振幅の変化量および前記周波数の変化量に基づき、前記機械の運転モードを定義する運転モードデータを作成し、記憶装置に格納する運転モードデータ作成部と、
前記センサデータ取得部を介して前記時系列の計測データを取得したときには、その計測データの振幅および周波数の時系列データを、前記記憶装置に格納されている前記運転モードデータと比較することにより、前記機械の運転モードを特定する運転モード特定部と、
前記異常診断情報記憶部を参照して、前記運転モード特定部で特定される運転モードに対応付けられている前記機械の全ての異常モードを求め、前記求めた全ての異常モードのそれぞれに対応付けられている前記診断手順情報を全て求め、前記求めた全ての診断手順情報に従って、前記センサデータ取得部を介して取得される前記時系列の計測データを処理し、前記機械の異常モードの発生の有無を診断する異常診断部と、
を備えること
を特徴とする機械診断装置。 A machine diagnostic apparatus for diagnosing an abnormality of a machine based on measurement data measured by a sensor attached to the machine having one or more operation modes, the machine diagnosis apparatus comprising:
The abnormal mode representing the abnormal part and mode of the machine, the operation mode of the machine in which the abnormal mode of the machine may occur, and the diagnostic procedure information used for diagnosing the abnormal mode of the machine are associated in advance A stored abnormality diagnosis information storage unit;
A sensor data acquisition unit that acquires time-series measurement data measured by the sensor from the sensor;
Among the at least one of the time series measurement data acquired in the past via the sensor data acquisition unit, the amplitude , the frequency, the amount of change of the amplitude , and the amount of change of the frequency in the range designated by the user An operation mode data creation unit that creates operation mode data that defines the operation mode of the machine and stores the operation mode data in a storage device;
When the measurement data of the time series is acquired through the sensor data acquisition unit, the time series data of the amplitude and frequency of the measurement data is compared with the operation mode data stored in the storage device. An operation mode identification unit that identifies an operation mode of the machine;
With reference to the abnormality diagnosis information storage unit, all the abnormality modes of the machine associated with the operation mode identified by the operation mode identification unit are determined, and are associated with each of all the determined abnormality modes. All the said diagnostic procedure information being obtained, processing said measurement data of said time series acquired via said sensor data acquisition unit according to all the diagnostic procedure information thus obtained, and generating the abnormal mode of said machine An abnormality diagnosis unit that diagnoses presence or absence,
A machine diagnostic apparatus comprising:
前記運転モードデータを作成するときには、前記センサデータ取得部を介して過去に取得された前記時系列の計測データの振幅および周波数の時系列データを表示装置に表示するとともに、前記表示された振幅および周波数の時系列データに基づいてユーザが入力する、それぞれの運転モードを切り出す区分情報を読み込み、その読み込んだ区分情報で指定される時間区間の情報と、その時間区間に含まれる前記計測データの振幅および周波数の時系列データと、を用いて前記運転モードデータを作成すること
を特徴とする請求項1に記載の機械診断装置。 The operation mode data creation unit
When the operation mode data is generated, time series data of the amplitude and frequency of the time series measurement data acquired in the past through the sensor data acquisition unit is displayed on a display device, and the displayed amplitude and The division information to cut out each operation mode input by the user based on the time series data of the frequency is read, the information of the time section specified by the read division information, and the amplitude of the measurement data included in the time section The machine diagnostic device according to claim 1, wherein the operation mode data is created using time series data of and frequency.
前記機械の異常を検出したときには、その異常モードとその異常が検出された時点で前記運転モード特定部によって特定された前記機械の運転モードとを含んで構成された診断結果データを表示装置に表示すること
を特徴とする請求項1に記載の機械診断装置。 The abnormality diagnosis unit
When an abnormality of the machine is detected, the display unit displays diagnosis result data including the abnormality mode and the operation mode of the machine specified by the operation mode specifying unit when the abnormality is detected. The machine diagnostic device according to claim 1, wherein:
前記表示装置に表示した1つ以上の診断結果データのうち1つの診断結果データを選択する入力を受け付けた場合には、前記異常が検出された時点を含む時間範囲について、前記センサデータ取得部で取得された前記時系列の計測データまたはその周波数分析結果をさらに表示すること
を特徴とする請求項3に記載の機械診断装置。 The abnormality diagnosis unit
When an input for selecting one diagnostic result data among the one or more diagnostic result data displayed on the display device is received, the sensor data acquisition unit is used for the time range including the time when the abnormality is detected. The machine diagnostic device according to claim 3, further displaying the acquired measurement data of the time series or the frequency analysis result thereof.
前記コンピュータは、
前記機械の異常の部位および態様を表す異常モードと、前記機械の異常モードが発生し得る前記機械の運転モードと、前記機械の異常モードの診断に用いられる診断手順情報と、を予め対応付けて記憶した異常診断情報記憶部を備え、
前記センサから、そのセンサによって計測される時系列の計測データを取得するセンサデータ取得処理と、
前記センサデータ取得処理を介して過去に取得された少なくとも1つの前記時系列の計測データのうち、ユーザによって指定された範囲における振幅、周波数、前記振幅の変化量および前記周波数の変化量に基づき、前記機械の運転モードを定義する運転モードデータを作成し、記憶装置に格納する運転モードデータ作成処理と、
前記センサデータ取得処理を介して前記時系列の計測データを取得したときには、その計測データの振幅および周波数の時系列データを、前記記憶装置に格納されている前記運転モードデータと比較することにより、前記機械の運転モードを特定する運転モード特定処理と、
前記異常診断情報記憶部を参照して、前記運転モード特定処理で特定される運転モードに対応付けられている前記機械の全ての異常モードを求め、前記求めた全ての異常モードのそれぞれに対応付けられている前記診断手順情報を全て求め、前記求めた全ての診断手順情報に従って、前記センサデータ取得処理を介して取得される前記時系列の計測データを処理し、前記機械の異常モードの発生の有無を診断する異常診断処理と、
を実行すること
を特徴とする機械診断方法。 A machine diagnosis method executed by a computer connected to a sensor attached to a machine having one or more operation modes and diagnosing abnormality of the machine based on measurement data measured by the sensor,
The computer is
The abnormal mode representing the abnormal part and mode of the machine, the operation mode of the machine in which the abnormal mode of the machine may occur, and the diagnostic procedure information used for diagnosing the abnormal mode of the machine are associated in advance And a stored abnormality diagnosis information storage unit;
Sensor data acquisition processing for acquiring time-series measurement data measured by the sensor from the sensor;
Among at least one of the time series measurement data acquired in the past through the sensor data acquisition process, the amplitude , the frequency, the amount of change of the amplitude , and the amount of change of the frequency in the range designated by the user Operation mode data creation processing for creating operation mode data defining the operation mode of the machine and storing the operation mode data in the storage device;
When the measurement data of the time series is acquired through the sensor data acquisition process, the time series data of the amplitude and frequency of the measurement data is compared with the operation mode data stored in the storage device. Operation mode identification processing for identifying the operation mode of the machine;
All abnormality modes of the machine associated with the operation mode identified in the operation mode identification process are determined with reference to the abnormality diagnosis information storage unit, and are associated with each of all the determined abnormality modes. All of the diagnostic procedure information being processed, processing the measurement data of the time series acquired through the sensor data acquisition process according to all the diagnostic procedure information determined, and generating the abnormal mode of the machine An abnormality diagnosis process that diagnoses the presence or absence of
A machine diagnostic method characterized in that:
前記運転モードデータ作成処理において、前記運転モードデータを作成するときには、前記センサデータ取得処理を介して過去に取得された前記時系列の計測データの振幅および周波数の時系列データを表示装置に表示するとともに、前記表示された振幅および周波数の時系列データに基づいてユーザが入力する、それぞれの運転モードを切り出す区分情報を読み込み、その読み込んだ区分情報で指定される時間区間の情報と、その時間区間に含まれる前記計測データの振幅および周波数の時系列データと、を用いて前記運転モードデータを作成すること
を特徴とする請求項5に記載の機械診断方法。 The computer is
In the operation mode data creation process, when the operation mode data is created, time series data of the amplitude and frequency of the measurement data of the time series acquired in the past through the sensor data acquisition process is displayed on a display device In addition, the division information that the user inputs based on the displayed time series data of the amplitude and frequency is read, and the information on the time section specified by the read division information and the time section are read The machine diagnostic method according to claim 5, wherein the operation mode data is created using time series data of the amplitude and frequency of the measurement data included in the measurement data.
前記異常診断処理において、前記機械の異常を検出したときには、その異常モードとその異常が検出された時点で前記運転モード特定処理によって特定された前記機械の運転モードとを含んで構成された診断結果データを表示装置に表示すること
を特徴とする請求項5に記載の機械診断方法。 The computer is
In the abnormality diagnosis process, when an abnormality of the machine is detected, a diagnosis result including the abnormal mode and the operation mode of the machine specified by the operation mode specifying process when the abnormality is detected The machine diagnostic method according to claim 5, wherein data is displayed on a display device.
前記異常診断処理において、前記表示装置に表示した1つ以上の診断結果データのうち1つの診断結果データを選択する入力を受け付けた場合には、前記異常が検出された時点を含む時間範囲について、前記センサデータ取得処理で取得された前記時系列の計測データまたはその周波数分析結果をさらに表示すること
を特徴とする請求項7に記載の機械診断方法。 The computer is
In the abnormality diagnosis process, when an input for selecting one diagnosis result data among the one or more diagnosis result data displayed on the display device is received, a time range including the time when the abnormality is detected, The machine diagnostic method according to claim 7, further displaying the measurement data of the time series acquired by the sensor data acquisition process or the frequency analysis result thereof.
Applications Claiming Priority (1)
| Application Number | Priority Date | Filing Date | Title |
|---|---|---|---|
| PCT/JP2015/051341 WO2016117021A1 (en) | 2015-01-20 | 2015-01-20 | Machine diagnosis device and machine diagnosis method |
Publications (2)
| Publication Number | Publication Date |
|---|---|
| JPWO2016117021A1 JPWO2016117021A1 (en) | 2017-07-13 |
| JP6514239B2 true JP6514239B2 (en) | 2019-05-15 |
Family
ID=56416587
Family Applications (1)
| Application Number | Title | Priority Date | Filing Date |
|---|---|---|---|
| JP2016570237A Active JP6514239B2 (en) | 2015-01-20 | 2015-01-20 | Machine diagnostic device and machine diagnostic method |
Country Status (3)
| Country | Link |
|---|---|
| US (1) | US10295995B2 (en) |
| JP (1) | JP6514239B2 (en) |
| WO (1) | WO2016117021A1 (en) |
Families Citing this family (10)
| Publication number | Priority date | Publication date | Assignee | Title |
|---|---|---|---|---|
| US10287909B2 (en) * | 2015-05-29 | 2019-05-14 | Pratt & Whitney Canada Corp. | Method and kit for preserving a fuel system of an aircraft engine |
| JP5875726B1 (en) * | 2015-06-22 | 2016-03-02 | 株式会社日立パワーソリューションズ | Preprocessor for abnormality sign diagnosis apparatus and processing method thereof |
| WO2017116627A1 (en) * | 2016-01-03 | 2017-07-06 | Presenso, Ltd. | System and method for unsupervised prediction of machine failures |
| JP6485428B2 (en) | 2016-10-06 | 2019-03-20 | 住友電気工業株式会社 | Management system, management apparatus, management method, and management program |
| CN106444631B (en) * | 2016-11-29 | 2019-02-19 | 重庆大学 | Intelligent machine tool operating state information acquisition platform and method based on ontology |
| JP6837893B2 (en) * | 2017-03-31 | 2021-03-03 | 住友重機械工業株式会社 | Failure diagnosis system |
| WO2020008533A1 (en) * | 2018-07-03 | 2020-01-09 | 三菱電機株式会社 | Data processing device and data processing method |
| JP2019096348A (en) * | 2019-02-20 | 2019-06-20 | 住友電気工業株式会社 | Management system, management device, management method, and management program |
| WO2021181469A1 (en) * | 2020-03-09 | 2021-09-16 | 富士通株式会社 | Processing selection program, processing selection system, and processing selection method |
| JP7328930B2 (en) * | 2020-05-11 | 2023-08-17 | 株式会社日立製作所 | Sensor device, data acquisition method and current monitoring system |
Family Cites Families (12)
| Publication number | Priority date | Publication date | Assignee | Title |
|---|---|---|---|---|
| US5739698A (en) * | 1996-06-20 | 1998-04-14 | Csi Technology, Inc. | Machine fault detection using slot pass frequency flux measurements |
| JP2000259222A (en) * | 1999-03-04 | 2000-09-22 | Hitachi Ltd | Device monitoring and preventive maintenance system |
| JP2002182736A (en) | 2000-12-12 | 2002-06-26 | Yamatake Sangyo Systems Co Ltd | Facility diagnosis device and facility diagnosis program storage medium |
| JP4182399B2 (en) | 2002-08-01 | 2008-11-19 | シムックス株式会社 | Machine tool operation information collection system |
| JP2004227357A (en) * | 2003-01-24 | 2004-08-12 | Hitachi Industries Co Ltd | Method and device for diagnosing deterioration of facilities |
| JP4032045B2 (en) * | 2004-08-13 | 2008-01-16 | 新キャタピラー三菱株式会社 | DATA PROCESSING METHOD, DATA PROCESSING DEVICE, DIAGNOSIS METHOD, AND DIAGNOSIS DEVICE |
| JP5337853B2 (en) * | 2011-09-12 | 2013-11-06 | 株式会社日立製作所 | Power plant diagnostic device and power plant diagnostic method |
| US9395270B2 (en) * | 2012-10-19 | 2016-07-19 | Florida Power & Light Company | Method and system for monitoring rotor blades in combustion turbine engine |
| JP5530045B1 (en) | 2014-02-10 | 2014-06-25 | 株式会社日立パワーソリューションズ | Health management system and health management method |
| GB201409590D0 (en) * | 2014-05-30 | 2014-07-16 | Rolls Royce Plc | Asset condition monitoring |
| JP6378419B2 (en) * | 2015-03-12 | 2018-08-22 | 株式会社日立製作所 | Machine diagnostic device and machine diagnostic method |
| US10464408B2 (en) * | 2017-06-08 | 2019-11-05 | Ford Global Technologies, Llc | System and methods for active engine mount diagnostics |
-
2015
- 2015-01-20 JP JP2016570237A patent/JP6514239B2/en active Active
- 2015-01-20 WO PCT/JP2015/051341 patent/WO2016117021A1/en active Application Filing
- 2015-01-20 US US15/544,298 patent/US10295995B2/en active Active
Also Published As
| Publication number | Publication date |
|---|---|
| US20180011480A1 (en) | 2018-01-11 |
| JPWO2016117021A1 (en) | 2017-07-13 |
| US10295995B2 (en) | 2019-05-21 |
| WO2016117021A1 (en) | 2016-07-28 |
Similar Documents
| Publication | Publication Date | Title |
|---|---|---|
| JP6514239B2 (en) | Machine diagnostic device and machine diagnostic method | |
| JP6378419B2 (en) | Machine diagnostic device and machine diagnostic method | |
| US20240068864A1 (en) | Systems and methods for monitoring of mechanical and electrical machines | |
| EP2570879B1 (en) | Condition monitoring system and method | |
| US6789025B2 (en) | Cyclic time averaging for machine monitoring | |
| US10670016B2 (en) | Pump monitoring apparatus and method | |
| JP5260343B2 (en) | Plant operating condition monitoring method | |
| JP4832609B1 (en) | Abnormal sign diagnosis device and abnormality sign diagnosis method | |
| US8720275B2 (en) | Detecting rotor anomalies | |
| US20090037121A1 (en) | System and method for detection of rotor eccentricity baseline shift | |
| JP2019045942A (en) | Failure diagnosis system | |
| JP2019160250A (en) | Information processor, information processing method, program, and mechanical device | |
| JP6714498B2 (en) | Equipment diagnosis device and equipment diagnosis method | |
| JP2013137797A (en) | Plant operation state monitoring method | |
| US10908014B2 (en) | Detecting rotor anomalies during transient speed operations | |
| EP3819608A1 (en) | Detecting rotor anomalies by determining vibration trends during transient speed operation | |
| JPWO2020129818A1 (en) | Mechanical equipment diagnostic system, mechanical equipment diagnostic method, and mechanical equipment diagnostic program | |
| JP6946409B2 (en) | Monitoring system for water treatment equipment | |
| JP2013101718A (en) | Plant operation state monitoring method |
Legal Events
| Date | Code | Title | Description |
|---|---|---|---|
| A621 | Written request for application examination |
Free format text: JAPANESE INTERMEDIATE CODE: A621 Effective date: 20170323 |
|
| A131 | Notification of reasons for refusal |
Free format text: JAPANESE INTERMEDIATE CODE: A131 Effective date: 20180206 |
|
| A521 | Request for written amendment filed |
Free format text: JAPANESE INTERMEDIATE CODE: A523 Effective date: 20180327 |
|
| A131 | Notification of reasons for refusal |
Free format text: JAPANESE INTERMEDIATE CODE: A131 Effective date: 20180828 |
|
| A521 | Request for written amendment filed |
Free format text: JAPANESE INTERMEDIATE CODE: A523 Effective date: 20181005 |
|
| TRDD | Decision of grant or rejection written | ||
| A01 | Written decision to grant a patent or to grant a registration (utility model) |
Free format text: JAPANESE INTERMEDIATE CODE: A01 Effective date: 20190402 |
|
| A61 | First payment of annual fees (during grant procedure) |
Free format text: JAPANESE INTERMEDIATE CODE: A61 Effective date: 20190411 |
|
| R150 | Certificate of patent or registration of utility model |
Ref document number: 6514239 Country of ref document: JP Free format text: JAPANESE INTERMEDIATE CODE: R150 |