JP6336471B2 - Method and apparatus for automated determination of vessel lumen contour - Google Patents
Method and apparatus for automated determination of vessel lumen contour Download PDFInfo
- Publication number
- JP6336471B2 JP6336471B2 JP2015547917A JP2015547917A JP6336471B2 JP 6336471 B2 JP6336471 B2 JP 6336471B2 JP 2015547917 A JP2015547917 A JP 2015547917A JP 2015547917 A JP2015547917 A JP 2015547917A JP 6336471 B2 JP6336471 B2 JP 6336471B2
- Authority
- JP
- Japan
- Prior art keywords
- diameter
- segment
- blood vessel
- stent
- cross
- Prior art date
- Legal status (The legal status is an assumption and is not a legal conclusion. Google has not performed a legal analysis and makes no representation as to the accuracy of the status listed.)
- Active
Links
Images


Classifications
-
- G—PHYSICS
- G16—INFORMATION AND COMMUNICATION TECHNOLOGY [ICT] SPECIALLY ADAPTED FOR SPECIFIC APPLICATION FIELDS
- G16H—HEALTHCARE INFORMATICS, i.e. INFORMATION AND COMMUNICATION TECHNOLOGY [ICT] SPECIALLY ADAPTED FOR THE HANDLING OR PROCESSING OF MEDICAL OR HEALTHCARE DATA
- G16H30/00—ICT specially adapted for the handling or processing of medical images
- G16H30/20—ICT specially adapted for the handling or processing of medical images for handling medical images, e.g. DICOM, HL7 or PACS
-
- A—HUMAN NECESSITIES
- A61—MEDICAL OR VETERINARY SCIENCE; HYGIENE
- A61B—DIAGNOSIS; SURGERY; IDENTIFICATION
- A61B5/00—Measuring for diagnostic purposes; Identification of persons
- A61B5/0059—Measuring for diagnostic purposes; Identification of persons using light, e.g. diagnosis by transillumination, diascopy, fluorescence
- A61B5/0062—Arrangements for scanning
- A61B5/0066—Optical coherence imaging
-
- A—HUMAN NECESSITIES
- A61—MEDICAL OR VETERINARY SCIENCE; HYGIENE
- A61B—DIAGNOSIS; SURGERY; IDENTIFICATION
- A61B5/00—Measuring for diagnostic purposes; Identification of persons
- A61B5/02—Detecting, measuring or recording pulse, heart rate, blood pressure or blood flow; Combined pulse/heart-rate/blood pressure determination; Evaluating a cardiovascular condition not otherwise provided for, e.g. using combinations of techniques provided for in this group with electrocardiography or electroauscultation; Heart catheters for measuring blood pressure
- A61B5/02007—Evaluating blood vessel condition, e.g. elasticity, compliance
-
- A—HUMAN NECESSITIES
- A61—MEDICAL OR VETERINARY SCIENCE; HYGIENE
- A61B—DIAGNOSIS; SURGERY; IDENTIFICATION
- A61B5/00—Measuring for diagnostic purposes; Identification of persons
- A61B5/103—Detecting, measuring or recording devices for testing the shape, pattern, colour, size or movement of the body or parts thereof, for diagnostic purposes
- A61B5/107—Measuring physical dimensions, e.g. size of the entire body or parts thereof
- A61B5/1076—Measuring physical dimensions, e.g. size of the entire body or parts thereof for measuring dimensions inside body cavities, e.g. using catheters
-
- A—HUMAN NECESSITIES
- A61—MEDICAL OR VETERINARY SCIENCE; HYGIENE
- A61F—FILTERS IMPLANTABLE INTO BLOOD VESSELS; PROSTHESES; DEVICES PROVIDING PATENCY TO, OR PREVENTING COLLAPSING OF, TUBULAR STRUCTURES OF THE BODY, e.g. STENTS; ORTHOPAEDIC, NURSING OR CONTRACEPTIVE DEVICES; FOMENTATION; TREATMENT OR PROTECTION OF EYES OR EARS; BANDAGES, DRESSINGS OR ABSORBENT PADS; FIRST-AID KITS
- A61F2/00—Filters implantable into blood vessels; Prostheses, i.e. artificial substitutes or replacements for parts of the body; Appliances for connecting them with the body; Devices providing patency to, or preventing collapsing of, tubular structures of the body, e.g. stents
- A61F2/82—Devices providing patency to, or preventing collapsing of, tubular structures of the body, e.g. stents
- A61F2/86—Stents in a form characterised by the wire-like elements; Stents in the form characterised by a net-like or mesh-like structure
-
- G—PHYSICS
- G16—INFORMATION AND COMMUNICATION TECHNOLOGY [ICT] SPECIALLY ADAPTED FOR SPECIFIC APPLICATION FIELDS
- G16H—HEALTHCARE INFORMATICS, i.e. INFORMATION AND COMMUNICATION TECHNOLOGY [ICT] SPECIALLY ADAPTED FOR THE HANDLING OR PROCESSING OF MEDICAL OR HEALTHCARE DATA
- G16H20/00—ICT specially adapted for therapies or health-improving plans, e.g. for handling prescriptions, for steering therapy or for monitoring patient compliance
- G16H20/40—ICT specially adapted for therapies or health-improving plans, e.g. for handling prescriptions, for steering therapy or for monitoring patient compliance relating to mechanical, radiation or invasive therapies, e.g. surgery, laser therapy, dialysis or acupuncture
-
- G—PHYSICS
- G16—INFORMATION AND COMMUNICATION TECHNOLOGY [ICT] SPECIALLY ADAPTED FOR SPECIFIC APPLICATION FIELDS
- G16H—HEALTHCARE INFORMATICS, i.e. INFORMATION AND COMMUNICATION TECHNOLOGY [ICT] SPECIALLY ADAPTED FOR THE HANDLING OR PROCESSING OF MEDICAL OR HEALTHCARE DATA
- G16H50/00—ICT specially adapted for medical diagnosis, medical simulation or medical data mining; ICT specially adapted for detecting, monitoring or modelling epidemics or pandemics
- G16H50/20—ICT specially adapted for medical diagnosis, medical simulation or medical data mining; ICT specially adapted for detecting, monitoring or modelling epidemics or pandemics for computer-aided diagnosis, e.g. based on medical expert systems
-
- A—HUMAN NECESSITIES
- A61—MEDICAL OR VETERINARY SCIENCE; HYGIENE
- A61B—DIAGNOSIS; SURGERY; IDENTIFICATION
- A61B90/00—Instruments, implements or accessories specially adapted for surgery or diagnosis and not covered by any of the groups A61B1/00 - A61B50/00, e.g. for luxation treatment or for protecting wound edges
- A61B90/06—Measuring instruments not otherwise provided for
- A61B2090/061—Measuring instruments not otherwise provided for for measuring dimensions, e.g. length
-
- A—HUMAN NECESSITIES
- A61—MEDICAL OR VETERINARY SCIENCE; HYGIENE
- A61F—FILTERS IMPLANTABLE INTO BLOOD VESSELS; PROSTHESES; DEVICES PROVIDING PATENCY TO, OR PREVENTING COLLAPSING OF, TUBULAR STRUCTURES OF THE BODY, e.g. STENTS; ORTHOPAEDIC, NURSING OR CONTRACEPTIVE DEVICES; FOMENTATION; TREATMENT OR PROTECTION OF EYES OR EARS; BANDAGES, DRESSINGS OR ABSORBENT PADS; FIRST-AID KITS
- A61F2/00—Filters implantable into blood vessels; Prostheses, i.e. artificial substitutes or replacements for parts of the body; Appliances for connecting them with the body; Devices providing patency to, or preventing collapsing of, tubular structures of the body, e.g. stents
- A61F2/82—Devices providing patency to, or preventing collapsing of, tubular structures of the body, e.g. stents
-
- A—HUMAN NECESSITIES
- A61—MEDICAL OR VETERINARY SCIENCE; HYGIENE
- A61F—FILTERS IMPLANTABLE INTO BLOOD VESSELS; PROSTHESES; DEVICES PROVIDING PATENCY TO, OR PREVENTING COLLAPSING OF, TUBULAR STRUCTURES OF THE BODY, e.g. STENTS; ORTHOPAEDIC, NURSING OR CONTRACEPTIVE DEVICES; FOMENTATION; TREATMENT OR PROTECTION OF EYES OR EARS; BANDAGES, DRESSINGS OR ABSORBENT PADS; FIRST-AID KITS
- A61F2230/00—Geometry of prostheses classified in groups A61F2/00 - A61F2/26 or A61F2/82 or A61F9/00 or A61F11/00 or subgroups thereof
- A61F2230/0063—Three-dimensional shapes
- A61F2230/0069—Three-dimensional shapes cylindrical
-
- A—HUMAN NECESSITIES
- A61—MEDICAL OR VETERINARY SCIENCE; HYGIENE
- A61F—FILTERS IMPLANTABLE INTO BLOOD VESSELS; PROSTHESES; DEVICES PROVIDING PATENCY TO, OR PREVENTING COLLAPSING OF, TUBULAR STRUCTURES OF THE BODY, e.g. STENTS; ORTHOPAEDIC, NURSING OR CONTRACEPTIVE DEVICES; FOMENTATION; TREATMENT OR PROTECTION OF EYES OR EARS; BANDAGES, DRESSINGS OR ABSORBENT PADS; FIRST-AID KITS
- A61F2240/00—Manufacturing or designing of prostheses classified in groups A61F2/00 - A61F2/26 or A61F2/82 or A61F9/00 or A61F11/00 or subgroups thereof
- A61F2240/001—Designing or manufacturing processes
-
- A—HUMAN NECESSITIES
- A61—MEDICAL OR VETERINARY SCIENCE; HYGIENE
- A61F—FILTERS IMPLANTABLE INTO BLOOD VESSELS; PROSTHESES; DEVICES PROVIDING PATENCY TO, OR PREVENTING COLLAPSING OF, TUBULAR STRUCTURES OF THE BODY, e.g. STENTS; ORTHOPAEDIC, NURSING OR CONTRACEPTIVE DEVICES; FOMENTATION; TREATMENT OR PROTECTION OF EYES OR EARS; BANDAGES, DRESSINGS OR ABSORBENT PADS; FIRST-AID KITS
- A61F2250/00—Special features of prostheses classified in groups A61F2/00 - A61F2/26 or A61F2/82 or A61F9/00 or A61F11/00 or subgroups thereof
- A61F2250/0058—Additional features; Implant or prostheses properties not otherwise provided for
- A61F2250/006—Additional features; Implant or prostheses properties not otherwise provided for modular
Description
関連出願
本出願は、2012年12月12日に出願された米国仮出願第61/736,226号の優先権を主張し、その全体でその開示を参照により本明細書に組み込む。
RELATED APPLICATION This application claims priority to US Provisional Application No. 61 / 736,226, filed December 12, 2012, the disclosure of which is incorporated herein by reference in its entirety.
背景
ほとんどの心臓専門医はステント法(stenting procedure)の間、血管造影法に頼って、正確に寸法を決め、ステントを位置させる。不幸なことに、血管造影プロジェクションを使用する場合には、内腔の断面の偏心が、ステントの寸法を決めるための血管径の正確な測定を困難にする。さらに、血管造影法は、血管壁中の血小板を直接可視化することができないため、び慢性病変中の正常および疾患セグメントの分化もまた困難である。血管造影法のこれらの制限により、適切なステントの寸法決めおよび位置決めが課題となる。不適切なステントの寸法決めにより、ステントが大きすぎる場合には血管に著しい損傷を与え得るか、またはステントが小さい場合には不十分な治療価値を生じ得る。
Background Most cardiologists rely on angiography during the stenting procedure to accurately dimension and position the stent. Unfortunately, when using angiographic projections, the eccentricity of the lumen cross section makes it difficult to accurately measure the vessel diameter to determine the stent dimensions. Furthermore, since angiography cannot directly visualize platelets in the vessel wall, differentiation of normal and disease segments in chronic lesions is also difficult. Due to these limitations of angiography, proper stent sizing and positioning becomes a challenge. Inappropriate stent sizing can cause significant damage to blood vessels if the stent is too large, or can result in insufficient therapeutic value if the stent is small.
光干渉断層撮影法(OCT)および血管内超音波法(IVUS)は、血管造影法に固有の制限を受けないが、OCTおよびIVUS画像診断技術は、血管内手法のわずかに小さな画分において、ステントの展開をガイドする。ステント展開のためのOCTおよびIVUS造影の制限された使用についての1つの理由は、ステントの最適な直径および長さを決定するための現在の手法が、主体的であり、時間がかかることである。適切に寸法を決めてステントを展開するための、血管内画像情報を適用して、正常な血管輪郭の最良の可能な復元を得るための簡易で迅速な方法についての必要性がある。 Optical coherence tomography (OCT) and intravascular ultrasound (IVUS) are not subject to the inherent limitations of angiography, but OCT and IVUS imaging techniques are in a slightly smaller fraction of endovascular procedures, Guide the deployment of the stent. One reason for the limited use of OCT and IVUS imaging for stent deployment is that current approaches for determining the optimal diameter and length of a stent are proactive and time consuming. . There is a need for a simple and quick method to apply intravascular image information to obtain the best possible restoration of normal vascular contours in order to properly dimension and deploy the stent.
本発明は、この必要性などに対処する。 The present invention addresses this need and the like.
本発明の要約
1つの側面において、本発明は、狭窄した血管の輪郭の復元のための、ステントの寸法を決めて調節するための方法に関する。一態様において、前記方法は、以下のステップ:前記血管を複数のセグメントに分割し、各セグメントを、前記血管の枝間の空間として定義すること;実質的に血小板を有しないと思われる出発点を選択すること;この点で最大径となる直径を定義すること;べき法則(power law)に従い、隣接する(next adjacent)セグメントの最大径を計算すること;隣接するセグメントの実際の直径を計算すること;どちらの直径がより大きいかにより、前記計算された最大径または前記測定された最大径のいずれかを選択すること;前記選択された最大径を使用して、この次のセグメントの最大径を見つけること;ステントが置かれる前記血管のセグメント毎を検査するまで、繰り返して継続すること;および、近位および遠位セグメントの直径に応じて、ステントを選択すること、を含む。
SUMMARY OF THE INVENTION In one aspect, the invention relates to a method for sizing and adjusting a stent for restoration of a constricted blood vessel profile. In one aspect, the method comprises the following steps: dividing the blood vessel into a plurality of segments and defining each segment as a space between the branches of the blood vessel; a starting point that appears to be substantially free of platelets. Define the maximum diameter at this point; calculate the maximum diameter of the next adjacent segment according to the power law; calculate the actual diameter of the adjacent segment Selecting either the calculated maximum diameter or the measured maximum diameter depending on which diameter is larger; using the selected maximum diameter, the maximum of this next segment Finding the diameter; continuing repeatedly until each segment of the vessel in which the stent is placed is examined; and depending on the diameter of the proximal and distal segments, Selecting a stent.
一態様において、セグメントの最大径を、その測定された直径、その計算された平均直径およびその質に応じて決定する。別の態様において、べき法則は、以下:
Dε(i+1)=Dε(i)+Db ε(i)
の式により与えられ、
式中、Dは、前記セグメントの直径であり、Dbは、前記枝の直径であり、εは、指数である。さらになお別の態様において、εは、約2.0〜約3.0の値を有する。別の態様において、前記組織の正常性を、自動化された組織性状診断(tissue characterization)、ユーザ識別および形態の群から選択された方法により、決定する。別の態様において、前記自動化された組織性状診断の方法は、血管の隣接領域間のOCTシグナルの相互相関を利用する。なお別の態様において、前記自動化された組織性状診断の方法は、OAに対するIM比を利用する。なお別の態様において、関心の対象であるフレームは、ガボールフィルタで第1にフィルタされる。さらになお別の態様において、前記自動化された組織性状診断の方法は、フレームに基づく強度プロファイルを利用する。別の態様において、前記方法は、血管に存在する疾患の量を決定することにより、前記血管中のどこで前記ステントを接触させるべきかを決定することをさらに含む。
In one embodiment, the maximum diameter of the segment is determined according to its measured diameter, its calculated average diameter and its quality. In another embodiment, the power law is the following:
D ε (i + 1) = D ε (i) + D b ε (i)
Given by
Where D is the diameter of the segment, D b is the diameter of the branch, and ε is an index. In still yet another aspect, ε has a value of about 2.0 to about 3.0. In another embodiment, the normality of the tissue is determined by a method selected from the group of automated tissue characterization, user identification and morphology. In another embodiment, the automated tissue characterization method utilizes cross-correlation of OCT signals between adjacent regions of blood vessels. In yet another aspect, the automated tissue characterization method utilizes an IM ratio to OA. In yet another aspect, the frames of interest are first filtered with a Gabor filter. In still yet another aspect, the automated tissue characterization method utilizes a frame-based intensity profile. In another embodiment, the method further comprises determining where in the blood vessel the stent should be contacted by determining the amount of disease present in the blood vessel.
別の態様において、本発明は、血管中での位置決めのための、ステントの寸法を決めるための装置に関する。一態様において、前記装置は、血管のための画像データを有するプロセッサを含み、前記プロセッサは、以下のステップ:前記血管を複数のセグメントに分割し、各セグメントを、前記血管の枝間の空間として定義すること;実質的に血小板を有しないと思われる出発点を選択すること;この点で最大径となる直径を定義すること;べき法則に従い、隣接するセグメントの最大径を測定すること;隣接するセグメントの実際の直径を計算すること;どちらの直径がより大きいかにより、前記計算された最大径または前記測定された最大径のいずれかを選択すること;前記選択された最大径を使用して、この次のセグメントの最大径を見つけること;およびステントが置かれる前記血管のセグメント毎を検査するまで、繰り返して継続すること;および、結果を表示して、近位および遠位セグメントの直径に応じて、ユーザがステントを選択することを可能にすること、を有するプログラムを実行する。 In another aspect, the invention relates to an apparatus for sizing a stent for positioning in a blood vessel. In one aspect, the apparatus includes a processor having image data for a blood vessel, wherein the processor divides the blood vessel into a plurality of segments, with each segment as a space between branches of the blood vessel. Defining; selecting a starting point that appears to be substantially free of platelets; defining the maximum diameter at this point; measuring the maximum diameter of adjacent segments according to power law; adjacent Calculating either the calculated maximum diameter or the measured maximum diameter depending on which diameter is larger; using the selected maximum diameter; Find the maximum diameter of this next segment; and continue repeatedly until each segment of the vessel where the stent is placed is examined And displays the results, depending on the diameter of the proximal and distal segments, the user can make it possible to select a stent, it executes a program having a.
一態様において、前記プロセッサは、セグメントの前記測定された直径、前記セグメントの前記計算された直径、および前記セグメントの質に応じて前記セグメントの最大径を決定する。別の態様において、前記プロセッサは、以下:
Dε(i+1)=Dε(i)+Db ε(i)
の式により与えられるべき法則から、セグメントの前記計算された直径を計算し、
式中、Dは、前記セグメントの直径であり、Dbは、前記枝の直径であり、εは、指数である。さらに別の態様において、εは、約2.0〜約3.0の値を有する。さらになお別の態様において、前記装置は、組織の正常性を、自動化された組織性状診断、ユーザ識別および形態の群から選択された方法により、決定する。一態様において、自動化された組織性状診断は、血管の隣接領域間の前記OCTシグナルの相互相関を利用する。別の態様において、自動化された組織性状診断は、OAに対するIM比を利用する。なお別の態様において、前記プロセッサは、ガボールフィルタを使用して、前記血管セグメントの画像データを第1にフィルタする。さらになお別の態様において、前記プロセッサは、自動化された組織性状診断を、フレームに基づく強度プロファイルを利用して行う。別の態様において、前記プロセッサは、前記血管に存在する疾患の量を決定することにより、前記血管中のどこで前記ステントを接触させるべきかを決定する。
In one aspect, the processor determines the maximum diameter of the segment as a function of the measured diameter of the segment, the calculated diameter of the segment, and the quality of the segment. In another embodiment, the processor is:
D ε (i + 1) = D ε (i) + D b ε (i)
Calculate the calculated diameter of the segment from the law to be given by
Where D is the diameter of the segment, D b is the diameter of the branch, and ε is an index. In yet another aspect, ε has a value of about 2.0 to about 3.0. In still yet another aspect, the apparatus determines tissue normality by a method selected from the group of automated tissue characterization, user identification and morphology. In one embodiment, automated tissue characterization utilizes the cross-correlation of the OCT signal between adjacent regions of the blood vessel. In another aspect, automated tissue characterization utilizes an IM ratio to OA. In yet another aspect, the processor first filters the image data of the blood vessel segment using a Gabor filter. In still yet another aspect, the processor performs automated tissue characterization using a frame-based intensity profile. In another aspect, the processor determines where in the blood vessel the stent should be contacted by determining the amount of disease present in the blood vessel.
別の側面において、本発明は、血管の断面の表現を表示する、プロセッサに基づく方法に関する。一態様において、前記方法は、光干渉断層撮影システムを使用して、前記血管の前記断面の距離の測定に応じた、1セットのデータを生じさせることを含み、前記セットは、前記断面に沿った複数の位置で複数の断面エリアを含み;第1軸および第2軸を有する第1パネルを表示し、前記第1パネルは、前記血管の第1の縦画像断面図(first longitudinal image view of the section)を含み、ここで、前記第1軸は、直径の値に相当し、ここで、前記第2軸は、前記血管の断面に沿った位置に相当し;および、前記血管の断面についての最小内腔面積を表示する。別の態様において、前記直径の値は、平均直径または測定された直径として表示される。なお別の態様において、前記第1縦図を発生させる前記ステップは、複数の平均断面直径を使用する。 In another aspect, the invention relates to a processor-based method for displaying a cross-sectional representation of a blood vessel. In one aspect, the method includes using an optical coherence tomography system to generate a set of data responsive to the measurement of the cross-sectional distance of the blood vessel, the set along the cross-section. A first panel having a first axis and a second axis, wherein the first panel displays a first longitudinal image view of the blood vessel. the section), wherein the first axis corresponds to a diameter value, wherein the second axis corresponds to a position along the cross section of the blood vessel; and for the cross section of the blood vessel Displays the minimum lumen area. In another embodiment, the diameter value is displayed as an average diameter or a measured diameter. In yet another aspect, the step of generating the first longitudinal view uses a plurality of average cross-sectional diameters.
別の態様において、前記方法は、第2パネルに、前記血管の縦断面図を表示することを含み、ここで、前記第1軸は、直径の値に相当し、ここで、前記第2軸は、垂直バーとしての、前記血管および前記血管の枝の断面に沿った位置に相当する。なお別の態様において、前記バーの幅は、前記枝の幅に等しくなるような寸法に決められる。 In another aspect, the method includes displaying a longitudinal cross-sectional view of the blood vessel on a second panel, wherein the first axis corresponds to a diameter value, wherein the second axis. Corresponds to the position along the cross-section of the vessel and the branch of the vessel as a vertical bar. In yet another aspect, the width of the bar is determined to be equal to the width of the branch.
図面は、必ずしも正確な縮尺ではなく、代わりに例示的原則により一般的に強調される。全ての側面において図面を例示的であるとして考慮すべきであり、本発明を限定することを意図せず、その範囲は、特許請求の範囲によってのみ定義される。 The drawings are not necessarily to scale, but instead are generally emphasized by example principles. In all aspects, the drawings should be considered as exemplary and are not intended to limit the invention, the scope of which is defined only by the claims.
詳細な説明
光干渉断層撮影法(OCT)、血管内超音波法(IVUS)および他の血管内画像診断は、血管の寸法および血小板特性についての有益な情報を提供する。しかしながら、現在の画像システムは、適切なステントの選択および展開について容易に解釈される方法で、この情報を提示しない。
DETAILED DESCRIPTION Optical coherence tomography (OCT), intravascular ultrasound (IVUS) and other intravascular imaging provide valuable information about vessel dimensions and platelet characteristics. However, current imaging systems do not present this information in a way that is easily interpreted for proper stent selection and deployment.
図1は、本発明に従って構築されたOCTシステム10の態様のブロック図である。前記システム10は、関心のある前記血管14中への挿入のために寸法決めされた光学プローブ12を含む。光が、前記プローブ12中を通過し、前記プローブ12から受け取った組織からの光の反射とともに、干渉電子モジュール16へ通過する(Light is passed into the probe 12 and light reflections from the tissue received from the probe 12 and passed to an interferometric and electronics module 16)。前記プローブ12から受け取った光に対応する前記電子シグナルが、プロセッサモジュール14へ送られ、本明細書において記載されるとおりに操作される。結果が、グラフィックディスプレイおよび制御ユニット20上に表示される。
FIG. 1 is a block diagram of an embodiment of an
図2aおよび2bは、冠状動脈から得られた画像を描く、商業的に入手可能なOCTシステムディスプレイの態様を示す。血管の単一横断面画像が、前記血管内でユーザ選択された角度および位置で、(図1bの前記縦画像を通る縦線(a−a’)として示される)単一縦断面に沿って、ユーザ選択された縦位置(図2a)で表示される。前記ユーザが、図2bの前記縦画像中で種々の位置を選択すると、その位置での前記断面が、図2aに現れる。 Figures 2a and 2b show embodiments of commercially available OCT system displays that depict images obtained from coronary arteries. A single cross-sectional image of a blood vessel is taken along a single vertical cross-section (shown as a vertical line (aa ′) through the vertical image in FIG. 1b) at a user-selected angle and position within the blood vessel. , Displayed in the vertical position (FIG. 2a) selected by the user. When the user selects various positions in the vertical image of FIG. 2b, the cross section at that position appears in FIG. 2a.
記録された画像をガイドとして使用して、心臓専門医は、典型的には、マルチステッププロセスを用いて、例えば、血小板により引き起こされる狭窄などの病変を処置するための、ステントの適切な寸法および長さを選択するのに必要な情報を抽出する。一般的に要求される前記ステップは:もっとも狭い内腔断面を見つけるための、画像のセットに目を通すこと;最小内腔面積(MLA)を測定すること;前記現在のMLAを有する前記フレームから出発する遠位方向で画像のセットに目を通して、最も低い血小板負荷および最も大きな内腔直径を有する前記血管断面を定める。次に、前記心臓専門医は、この断面の平均直径を遠位参照直径Ddとして測定して記録し、前記心臓専門医が、遠位方向の代わりに近位方向に前記画像のセットをスクロールすることを除いて、最も低い血小板負荷および最も大きな内腔直径を有する前記血管断面についての探索を繰り返す。この断面が見つかった場合には、前記心臓専門医は、この断面の平均直径を近位参照直径Dpとして測定して記録する。次に、前記心臓専門医は、前記縦切断面を回転させて、前記ステントの位置決めおよびその膨張直径に影響を与え得る、あらゆる大きな枝および血小板特性を定める。 Using the recorded images as a guide, cardiologists typically use a multi-step process to determine the appropriate dimensions and length of the stent to treat lesions such as stenosis caused by platelets, for example. The information necessary to select the size is extracted. The steps generally required are: looking through a set of images to find the narrowest lumen cross section; measuring the minimum lumen area (MLA); from the frame with the current MLA Look through the set of images in the starting distal direction to define the vessel cross section with the lowest platelet load and the largest lumen diameter. The cardiologist then measures and records the average diameter of this cross section as the distal reference diameter D d , and the cardiologist scrolls the set of images in the proximal direction instead of the distal direction. The search for the vessel cross-section with the lowest platelet load and the largest lumen diameter is repeated. If this section is found, the cardiologist records the average diameter of the cross section, measured as the proximal reference diameter D p. The cardiologist then rotates the longitudinal cutting plane to define any large branch and platelet characteristics that can affect the positioning of the stent and its expanded diameter.
必要な場合には、前記心臓専門医は、次いで、近くの枝の存在を説明するための(to account for)前記参照断面の位置を再調整する。これがいったん完了すると、前記心臓専門医は、次いで、前記近位および遠位参照断面間の拒理Lをmmで測定して、前記セグメント長さLより大きな長さを有し、DdおよびDp間の直径を有するステントを選択しなければならず、これにより、膨張後に、動脈壁を拡張し過ぎずに良好なストラット圧着(strut apposition)を確保するであろう。必要な場合には、前記心臓専門医は、次いで、バルーンカテーテルにより拡張後について計画して、前記ステントの直径をテーパー状にして、前記血管内腔の正常なテーパーを有する、より良好な適合性を達成しなければならない。 If necessary, the cardiologist then realigns the position of the reference cross section to account for the presence of nearby branches. Once this is complete, the cardiologist then measures the rejection L between the proximal and distal reference sections in mm to have a length greater than the segment length L, and D d and D p A stent with a diameter between must be selected, which will ensure a good strut apposition after expansion without over-expanding the arterial wall. If necessary, the cardiologist can then plan for post-dilation with a balloon catheter to taper the diameter of the stent to have a better fit with a normal taper of the vessel lumen. Must be achieved.
繁忙なカテーテル検査室では、これらのステップは、過剰に時間がかかり、確実に実行することが難しいものになり得る。前記病変がび慢性で血小板が画像化されたセグメント全体にわたって存在する場合に、または1つまたは2つ以上の大きな側枝が存在し、それにより参照フレームを識別することが困難で血管のテーパー状化の程度を評価することが困難である場合に、追加の合併症(added complication)が生じ得る。 In busy catheter laboratories, these steps can be overly time consuming and difficult to perform reliably. If the lesion is chronic and spans the entire imaged segment of the platelet, or one or more large side branches are present, thereby making it difficult to identify the reference frame and taper the vessel Additional complications can occur when it is difficult to assess the degree of.
OCTおよびIVUSが、予備介入ステント計画についての重要な方法であるだけでなく、OCTおよびIVUS造影もまた、移植後のステント膨張の質を評価するのに有益である。前記ステント展開手法におけるとおり、前記移植されたステントの近位および遠位に位置する血管断面を参照として使用して、前記ステントが適切に膨張したか否かを判断する。現在の実務では、これらの参照断面を、通常、上記で概説したものに類似する主体的な手動による手法を使用することにより見つける。結果として、内腔のテーパー状化および側枝との同様の困難性にしばしば遭遇し、これは、現在使用されているとおりのバルーン拡張のための標的直径の定量を妨げる。 Not only are OCT and IVUS important methods for pre-intervention stent planning, OCT and IVUS imaging are also useful for assessing the quality of stent expansion after implantation. As in the stent deployment procedure, vessel cross sections located proximal and distal to the implanted stent are used as a reference to determine whether the stent has been properly expanded. In current practice, these reference sections are usually found by using a proactive manual approach similar to that outlined above. As a result, lumen tapering and similar difficulties with side branches are often encountered, which hinders target diameter quantification for balloon expansion as currently used.
本発明は、血管内画像の自動化された加工を介して枝分かれした血管の平均直径プロファイルを構築するための特許出願(米国特許出願公開第2011/0071404号明細書)中に開示された方法に基づく。この先の出願を、その全体で参照により本明細書中に組み込む。図3は、従来技術に知られていた内腔の平均直径の表示の簡易バージョンの態様である。黒色で塗られた領域(solid black region)は、血管セグメントの内腔の平均直径のバリエーションならびに縦位置および前記セグメント内の側枝の直径を示す。横軸は、画像フレーム番号を表し、これは、血管の軸に沿った距離に相当する。 The present invention is based on the method disclosed in a patent application (US 2011/0071404) for building an average diameter profile of a branched blood vessel via automated processing of intravascular images. . This earlier application is incorporated herein by reference in its entirety. FIG. 3 is a simplified version of a representation of the average lumen diameter known in the prior art. The solid black region shows variations in the average diameter of the lumen of the blood vessel segment as well as the vertical position and the diameter of the side branch within the segment. The horizontal axis represents the image frame number, which corresponds to the distance along the vessel axis.
一態様において、内腔面積が最小である(MLA断面)画像フレームは、1つまたは2つ以上の参照フレームで測定される断面に対する、狭窄面積パーセント(percent area stenosis)の測定のためのマーカーとしての役割を果たす。前記参照直径は、前記血管および前記ステントの端部間の接触の許容し得る点である、前記血管のセグメント中の内腔の直径を表すことが意図される。接触の最良点は、内腔面積が局所最大であり、血小板が最小である、動脈の領域のものである(すなわち、内膜は薄くて均一である)。 In one aspect, an image frame with minimal lumen area (MLA cross section) as a marker for the measurement of percent area stenosis relative to a cross section measured in one or more reference frames To play a role. The reference diameter is intended to represent the diameter of the lumen in the segment of the vessel, which is an acceptable point of contact between the vessel and the end of the stent. The best point of contact is that of the region of the artery where the lumen area is the local maximum and the platelets are minimum (ie, the intima is thin and uniform).
平均直径プロファイルの表示は、動脈のステントのための有用なガイドを提供するが、このタイプの表示は、正常および疾患セグメント間を区別しない。さらに、平均直径プロファイルは、前記血管の自然なテーパー状化の確実な指標を提供しない。すなわち、血管の直径は、典型的には、心臓から離れて血管に沿って進むにつれて、テーパー状化する。好適な正常参照断面を定めるために、ユーザは、直径が最大である領域内の画像フレームのセットを通じて手動でなお探索して、最良の候補を選択しなければならない。いったん好適な参照フレームを定めると、前記血管中のテーパー状化の量の大まかな基準(measure)を、MLAフレームの近位におよび遠位に位置する、対の参照フレームでそれぞれ測定された平均直径の差から得ることができる。不幸なことに、多くの場合、単一の参照断面のみを見つけることができ、よって、前記標的セグメント内の血管テーパー状化の程度を測定することができない。平均直径プロファイルに示された前記枝の位置は、前記ステントの位置決めに有用であるが、血管のテーパー状化についての前記枝の効果を、容易に識別することはできない。 While the display of the mean diameter profile provides a useful guide for arterial stents, this type of display does not distinguish between normal and disease segments. Furthermore, the average diameter profile does not provide a reliable indicator of the natural taper of the vessel. That is, the diameter of the blood vessel typically tapers as it moves along the blood vessel away from the heart. In order to define a suitable normal reference cross-section, the user must still manually search through the set of image frames in the region with the largest diameter to select the best candidate. Once a suitable reference frame is defined, a rough measure of the amount of tapering in the vessel is measured as the average measured at each pair of reference frames located proximal and distal to the MLA frame. It can be obtained from the difference in diameter. Unfortunately, in many cases, only a single reference cross section can be found, and thus the degree of vessel taper within the target segment cannot be measured. The position of the branch shown in the mean diameter profile is useful for positioning the stent, but the effect of the branch on vessel taper cannot be easily identified.
本明細書において開示される本発明の意図は、ステント計画、評価および調整を、ステントされた血管の最適な内腔輪郭を決定するための手法を自動化することにより簡素化することである。この最適な輪郭は、ステントの寸法決め、展開およびステント後の評価についての客観的ガイドとしての役割を果たすことが意図される。前記最適な内腔輪郭の決定は、血小板の厚さ、側枝の寸法および位置ならびに血管のテーパー状化を説明する(account for)、定量的画像加工法に基づく。本発明の種々の態様は、正常参照断面の選択およびステント寸法を決めるためのテーパー状化された正常血管プロファイルの見積もりを伴う手動操作を排除することにより、OCTまたはIVUS誘導された平均直径データの有用性を拡張する。 The intent of the invention disclosed herein is to simplify stent planning, evaluation and adjustment by automating a technique for determining the optimal lumen contour of a stented blood vessel. This optimal profile is intended to serve as an objective guide for stent sizing, deployment and post-stent evaluation. The determination of the optimal lumen profile is based on quantitative imaging techniques that account for platelet thickness, side branch size and location, and vessel taper. Various aspects of the present invention eliminate the need for manual manipulation with selection of normal reference cross-sections and estimation of tapered normal vessel profiles to determine stent dimensions, thereby reducing the mean diameter data derived from OCT or IVUS. Extend usability.
図4を参照すると、一般的に、前記方法の一態様は、複数(N個)のセグメントに前記血管を分割する。各セグメントを、血管の枝間の空間として定義する。図4において、血管の外周の周りの枝の実際の配向にかかわらず、血管の各枝が、血管から下流に向かって広がる縦線として示される。枝の位置および直径を、血管断面の内腔輪郭の外周中の不連続を、自動的に定めて測定するソフトウエアアルゴリズムにより決定する。前記方法は、次いで、例えば、実質的に狭窄していないと思われる、ステントを位置させることが意図される一般的領域中の血管の最遠位セグメント(1)などの出発点を使用する。現在の最大径Dmax(1)が、この位置で定義されることが想定される。 Referring to FIG. 4, in general, one aspect of the method divides the blood vessel into multiple (N) segments. Each segment is defined as the space between the branches of the vessel. In FIG. 4, regardless of the actual orientation of the branches around the circumference of the vessel, each branch of the vessel is shown as a vertical line extending downstream from the vessel. The position and diameter of the branches is determined by a software algorithm that automatically determines and measures the discontinuities in the perimeter of the lumen profile of the vessel cross section. The method then uses a starting point such as, for example, the most distal segment (1) of the blood vessel in the general area where the stent is intended to be located, which appears to be substantially non-stenotic. It is assumed that the current maximum diameter D max (1) is defined at this position.
前記方法は、次いで、この場合には隣接近位セグメントである次のセグメント(2)を評価し、現在のセグメントの直径、前記セグメント間の枝の直径および血管が以下に記載されるとおりのベキの法則(power rule)によりテーパー状化されるという知見により、次の近位セグメント(2)の最大径がいくつにならなければならないかを計算する。次の近位セグメントの実際の直径を測定し、より大きな(測定されるかまたは計算された)直径を、この次のセグメントの最大径Dmax(2)として使用する。前記プロセスは、次いで、次の近位セグメントへ進み、ステントが置かれるべき血管の全長が検査されるまで続く。この点で、ステントの両端の膨張直径を定義する。 The method then evaluates the next segment (2), in this case the adjacent proximal segment, and the current segment diameter, the diameter of the branch between the segments and the blood vessel are determined as described below. With the knowledge that it is tapered by the power rule, calculate what the maximum diameter of the next proximal segment (2) must be. The actual diameter of the next proximal segment is measured and the larger (measured or calculated) diameter is used as the maximum diameter D max (2) of this next segment. The process then proceeds to the next proximal segment and continues until the entire length of the vessel in which the stent is to be placed is examined. In this regard, the expansion diameter at both ends of the stent is defined.
別の態様は、最大径の質(疾患の重篤性の程度)を決定することを除き、以前検討された態様と同様である。セグメント内で最大径を有するセグメントが、罹患したと思われる場合には、そのセグメント内の他の画像フレームを検査して、より罹患していないフレームを最大径に選択する。このようにして、使用される最大径フレームは、実際により小さな物理的直径を有し得るが、また、内腔のより小さな疾患部分を有し得、より実際の内腔直径を示すと思われる。 Another embodiment is similar to the previously discussed embodiment, except that it determines the maximum diameter quality (degree of disease severity). If a segment with the largest diameter within a segment appears to be affected, other image frames within that segment are examined and the less affected frame is selected as the largest diameter. In this way, the largest diameter frame used may actually have a smaller physical diameter, but may also have a smaller diseased portion of the lumen, and will likely exhibit a more actual lumen diameter. .
より詳細には、上記のとおり、自然の内腔のテーパー状化は、冠血管系中の血流の分析から誘導されるべきスケーリング法則(power scaling rule)に従い、冠状動脈の枝分かれから主にもたらされると予測される。この法則は:
Dε(i+1)=Dε(i)+Db ε(i) [方程式1]
で示され、
式中、D(i)およびD(i+1)は、それぞれi番目の枝への遠位および近位の血管セグメント中の内腔直径である。i番目の側枝は、直径Db(i)を有する。指数εは、経験的に決定されるとおり、約2〜約3.0の値を有する、べき法則スケーリング指数である。εの最良値の選択は、OCTの統計的分析および血管造影画像データベースに基づき、ここで、血管のテーパー状化およびそれらの血管の枝の直径を測定する。正常患者では、前記値は、典型的には、約2.5である。
More specifically, as noted above, the natural lumen tapering is primarily caused by coronary artery branching, following a power scaling rule that should be derived from analysis of blood flow in the coronary vasculature. It is predicted that The law is:
D ε (i + 1) = D ε (i) + D b ε (i) [ Equation 1]
Indicated by
Where D (i) and D (i + 1) are the lumen diameters in the distal and proximal vessel segments to the i th branch, respectively. The i th side branch has a diameter D b (i). The index ε is a power law scaling index having a value of about 2 to about 3.0, as determined empirically. Selection of the best value of ε is based on statistical analysis of OCT and angiographic image database, where the vessel tapers and their vessel branch diameters are measured. In normal patients, the value is typically about 2.5.
図4を参照すると、本発明の方法の一態様において、複数のフレームから構成される血管の画像を、N+1個の枝間のセグメントに分割し、ここで、Nは、側枝の数である。セグメント内の複数のフレームのそれぞれは、前記セグメントの断面に相当する。各枝間セグメントの平均直径を、次いで、前記セグメントを作り上げる前記フレームを検査することにより決定する。内腔直径が、そのセグメントの最大値に等しい、各セグメント中の画像フレームが、正常参照セグメントの候補となり、すなわち、狭窄のない血管内の最大径となる。未加工の血管内画像データに適用する場合には、例えば、米国特許出願公開第2011/0071404号明細書などに記載されるとおりの境界線追跡法(boundary tracing method)を使用して、平均内腔および枝直径を自動的に測定することができる。 Referring to FIG. 4, in one aspect of the method of the present invention, a blood vessel image composed of a plurality of frames is divided into segments between N + 1 branches, where N is the number of side branches. Each of the plurality of frames in the segment corresponds to a cross section of the segment. The average diameter of each inter-branch segment is then determined by examining the frame that makes up the segment. The image frame in each segment whose lumen diameter is equal to the maximum value of that segment is a candidate for a normal reference segment, i.e., the maximum diameter in a vessel without stenosis. When applied to raw intravascular image data, for example, using a boundary tracing method as described in US Patent Application Publication No. 2011/0071404 and the like, Cavity and branch diameters can be measured automatically.
手短にいえば、血管の内腔を検出する境界線追跡法の一態様には、まず画像マスクを作成して、内腔壁の一般的輪郭を定めることが含まれる。一態様において、前記マスクは、2成分である。前記マスクは、複数のスキャンラインから作製され、各スキャンラインは、組織エリアの始めと終わりを定義する。血液アーチファクトなどにより、スキャンラインは、1より多い組織の領域を含んでもよい場合があるので、重量は、組織の各領域に関連する。次に、秤量された組織のリストを作り出し、潜在的な輪郭を定義する。一態様において、最長の輪郭セグメントを、根本の輪郭セグメントとして定義する。時計回りおよび反時計回りの両方に隣接する輪郭セグメントを、次いで同定する。 Briefly, one aspect of a boundary tracking method for detecting the lumen of a blood vessel includes first creating an image mask to define a general contour of the lumen wall. In one embodiment, the mask is two-component. The mask is made from a plurality of scan lines, each scan line defining the beginning and end of a tissue area. Weight is associated with each region of tissue, as a scan line may include more than one region of tissue, such as due to blood artifacts. Next, a list of weighed tissues is created and potential contours are defined. In one aspect, the longest contour segment is defined as the root contour segment. Contour segments adjacent to both clockwise and counterclockwise are then identified.
有効な(valid)次の輪郭セグメントは、角度、半径方向およびユークリッドの距離および長さの両方の閾値を通ったものである。すなわち、その角度範囲は、特定の閾値よりも大きくなければならず;その半径方向の位置は、他のセグメントと同様でなければならず;および、隣接する輪郭セグメントへのその直接接続距離(ユークリッド距離)は、特定の閾値よりも大きくなければならない。最後に、潜在的な輪郭セグメントの長さを決定し、最長のものを、実際の輪郭セグメントとして選択する。輪郭セグメント間で欠落した輪郭データを、次いで内挿して、輪郭内の欠落部を除去する。この点で、内腔の全輪郭が、所定の血管セグメントの各フレーム中で定義された。 A valid next contour segment is one that has passed both angular, radial and Euclidean distance and length thresholds. That is, the angular range must be greater than a certain threshold; its radial position must be similar to other segments; and its direct connection distance (Euclidean to adjacent contour segments) Distance) must be greater than a certain threshold. Finally, the length of the potential contour segment is determined and the longest one is selected as the actual contour segment. The missing contour data between contour segments is then interpolated to remove missing portions in the contour. At this point, the full contour of the lumen was defined in each frame of a given vessel segment.
ここで生じ得る、上記で一般的に説明された前記方法の2つの態様に対応する2つの状況がある。1つの状況では、正常または非疾患領域を定義することができないような、血管についての不十分な情報があるかまたは情報がないことである。他の状況では、血管が損傷された血小板および正常組織エリアの両方を含む。 There are two situations that can arise here, corresponding to the two aspects of the method generally described above. In one situation, there is insufficient information or no information about the blood vessels that cannot define normal or non-disease areas. In other situations, blood vessels contain both damaged platelets and normal tissue areas.
壁中の血小板の特性についての情報が特定の血管セグメントの正常性の程度を決定するのに利用可能でない場合に、本発明の1つの特定の態様を第1の状況に適用する。造影診断により疾患または正常組織を区別できない場合に、または画像の質が劣化した場合に、この場合が生じ得る。 One particular aspect of the invention applies to the first situation when information about the properties of platelets in the wall is not available to determine the degree of normality of a particular vessel segment. This can occur when contrast diagnosis cannot distinguish disease or normal tissue, or when image quality is degraded.
図5を参照すると、フローチャートは、正常血管直径についての情報が入手可能でない場合に、血管の最適ステントプロファイルを決定するために使用される、計算および決定の一態様を示す。示される前記方法の1つの特徴は、前記方法が、ステントの過膨張を妨げるように設計されている一方で、なお全ての枝間セグメントからの情報を組み入れることである。まず、各セグメントおよび側枝の平均直径を測定する。(ステップ1)。平均直径は、前記セグメント中のその位置での血管の断面と同じ面積を有する円の直径である。 Referring to FIG. 5, a flow chart illustrates one aspect of the calculation and determination used to determine an optimal stent profile for a vessel when information about normal vessel diameter is not available. One feature of the method shown is that the method is designed to prevent stent overexpansion while still incorporating information from all inter-branch segments. First, the average diameter of each segment and side branch is measured. (Step 1). The average diameter is the diameter of a circle having the same area as the cross section of the blood vessel at that position in the segment.
出発条件として、血管画像の最遠位セグメント(所定の添え字(i=1)であるセグメント)におけるOCT画像を使用して測定されたとおりの最大平均直径(Dmax(1))を、最適遠位正常参照直径(np):Dnp(1)=Dmax(1)、として定義する(ステップ2)。この点から、遠位から近位への前記(N+1)個のセグメントのそれぞれの最適直径を、方程式2に示される形式の方程式1のべきスケーリング法則を使用して計算する(ステップ3)。
Dnp(i+1)=exp{(1/ε)ln[Dnp ε(i)+Db ε(i)]} [方程式2]
As a starting condition, the maximum mean diameter (D max (1)) as measured using the OCT image at the most distal segment of the blood vessel image (the segment with a given subscript (i = 1)) is optimal Define distal normal reference diameter (np): D np (1) = D max (1) (step 2). From this point, the optimal diameter of each of the (N + 1) segments from distal to proximal is calculated using the power scaling law of
D np (i + 1) = exp {(1 / ε) ln [D np ε (i) + D b ε (i)]} [Equation 2]
しかしながら、隣接する近位セグメントにおける計算された最適ステント直径である、Dnp(i+1)が、セグメント(i+1)の測定された最大径より小さい場合には、隣接する近位セグメント(i+1)を、Dmax(i+1)に設定する(ステップ4)。すなわち:
Dnp(i+1)<Dmax(i+1)]である場合には、Dnp(i+1)=Dmax(i+1) [方程式3]
である。
条件として方程式3を有する(with Eqn. 3 as a condition)、方程式2による計算の反復プロセスを、全てのセグメントが評価されるまで繰り返す(ステップ5)。方程式3により記載される条件が、入口部の疾患により、特に血小板負荷が重度の領域において狭窄した枝によりもたらされる、スケールされた直径の誤差を補償するために含まれる。
However, if D np (i + 1), which is the calculated optimal stent diameter in the adjacent proximal segment, is smaller than the measured maximum diameter of segment (i + 1), the adjacent proximal segment (i + 1) is Set to D max (i + 1) (step 4). Ie:
If D np (i + 1) <D max (i + 1)], then D np (i + 1) = D max (i + 1) [Equation 3]
It is.
Having
上記で検討された本発明の第2の態様を、特定の血管セグメントの正常性の程度を血小板の厚さおよび別の造影加工アルゴリズムにより血管内データから誘導された他の変数により格付けされた、より一般的な場合に適用する。前記方法の一態様において、前記格付けスキームは、1〜Kの段階の整数を各画像フレームに割り当て、ここで、1は、正常(罹患していない)を示し、Kは、正常でない(重度の罹患)を示す。Kは、典型的には、2〜5の小さな整数である。外周全体にわたって極めて薄い(数百マイクロメートルの厚み未満の)内膜を有する非疾患画像断面のみが、格付け1に割り当てられる。 The second aspect of the invention discussed above was graded on the degree of normality of a particular vascular segment by platelet thickness and other variables derived from intravascular data by another contrast processing algorithm, Applies to more general cases. In one aspect of the method, the rating scheme assigns an integer between 1 and K to each image frame, where 1 indicates normal (not affected) and K is not normal (severe Disease). K is typically a small integer between 2 and 5. Only non-diseased image sections with an intima that is very thin (less than a few hundred micrometers thick) across the entire circumference are assigned a rating of 1.
疾患断面に、内膜層の厚みおよび内膜肥大の角度範囲に従って、最大値Kまでより高い数字を割り当てる。例えば、内膜は、例えば、血管断面の外周の90°の弧にわたって有意な血小板を有しない薄いものであり、残りの270°にわたって(血小板の存在により)厚いものであると思われ得る。この断面は、例えば、180°にわたる薄い内膜および残りの180°の外周にわたって厚い内膜を有する血管より高い数字の格付け(より罹患している)を与えられるであろう。OCT画像データからのこれらの格付けを計算するための具体的な方法を、本明細書において記載する。 The disease cross section is assigned a higher number up to a maximum value K according to the intimal layer thickness and the angular range of intimal hypertrophy. For example, the intima can be considered thin, eg, without significant platelets over the 90 ° arc of the circumference of the vessel cross-section and thick (due to the presence of platelets) over the remaining 270 °. This cross-section would be given a higher numerical rating (more affected) than, for example, a blood vessel with a thin intima spanning 180 ° and a thick intima over the remaining 180 ° perimeter. Specific methods for calculating these ratings from OCT image data are described herein.
図6は、上記の本発明の態様による、最適化されたステント内腔輪郭を決定するプロセスのためのフローチャートであり、これは、各画像断面について以下:
1≦Ln≦K
の正常性の格付けを使用する。この態様において、(i)は、再びセグメント番号を示し、mmは、計数指標であり、kkは、記憶された指標であり、Nは、セグメントの合計数である。以前の態様におけるとおり、計算は、最遠位フレームで開始し、最適な直径を、方程式1により記載されるスケーリング法則により決定する。しかしながら、断面近くの正常性の格付けLnがより低い場合には、正常性の格付けを含むことは、現在のセグメントにおいて測定された最大径を超える遠位セグメント中のステントの膨張を許容する。所定のセグメントについての最良の参照直径を、より良好な正常性の格付けを有する、最近接近位セグメント中の最大径として選択する。最大径条件は、入口部の疾患により、狭窄した枝によりもたらされる、スケールされた直径の誤差を補償するために含まれる。
FIG. 6 is a flow chart for the process of determining an optimized stent lumen profile according to aspects of the invention described above, which for each image cross section:
1 ≦ L n ≦ K
Use a health rating of. In this embodiment, (i) again indicates the segment number, mm is the counting index, kk is the stored index, and N is the total number of segments. As in the previous aspect, the calculation starts at the most distal frame and the optimal diameter is determined by the scaling law described by
正常性を使用するこの方法は、他の態様におけるとおり、セグメントの平均直径および側枝データを獲得することにより開始する(ステップ1)。各枝間セグメントについての最大径を、次に決定する(ステップ2)。正常性の格付けを、最大径フレームのそれぞれにおいて決定する(ステップ3)。一時的な最適直径を、次いで決定する(ステップ4)。この点において、Dmaxがより正常で、正常性の格付けであるLnが、予め決定した閾値よりも低いセグメントについて、近位の探索がなされる(ステップ5)。各セグメントを、最大径について探索する(ステップ6)。前の最大径より大きな最大径を有するフレームが位置する場合には、それが新しい最適直径となる(ステップ7)。全てのフレームを探索した後(ステップ8)、セグメント内の最適直径を決定する(ステップ9)。全てのセグメントを探索した後、血管内のステントされた内腔についての最適直径が決定された。 The method using normality begins by obtaining the average diameter of the segment and side branch data, as in other embodiments (step 1). The maximum diameter for each inter-branch segment is then determined (step 2). A normality rating is determined for each of the largest diameter frames (step 3). A temporary optimal diameter is then determined (step 4). At this point, a proximal search is made for segments where D max is more normal and the normality rating L n is lower than a predetermined threshold (step 5). Each segment is searched for the maximum diameter (step 6). If a frame with a maximum diameter greater than the previous maximum diameter is located, it becomes the new optimal diameter (step 7). After searching all frames (step 8), the optimum diameter within the segment is determined (step 9). After searching all segments, the optimal diameter for the stented lumen within the vessel was determined.
図7は、図6に記載される本発明の態様に従ってOCTデータから誘導された、最適な内腔輪郭の例を示す。ハッチングで示されたエリアは、ステントの直径および長さを選択するためのガイドとしての役割を果たすことが意図される。最大平均直径フレームのそれぞれにおけるOCT画像の断面を、参照のために示す。この例において、内腔の直径は、フレーム255を中心とする側枝の存在により、血管セグメントの近位端部での直径において穏やかなステップで、平均で約2.84mmから約2.03mmに、比較的スムーズにテーパー状化する。計算された輪郭および血管内膜が最も薄い断面の内腔直径間の良好な適合性は、明らかである。約0.2mmのフレーム空間について、病変の最も重篤な部分を覆うのに必要なステント長さは、およそ27mmであり;すなわち、画像フレーム125から画像フレーム260までである。 FIG. 7 shows an example of an optimal lumen profile derived from OCT data in accordance with the aspects of the invention described in FIG. The area indicated by hatching is intended to serve as a guide for selecting the diameter and length of the stent. A cross section of the OCT image in each of the maximum average diameter frames is shown for reference. In this example, the lumen diameter averages from about 2.84 mm to about 2.03 mm in a gentle step in diameter at the proximal end of the vessel segment due to the presence of side branches centered on frame 255. Tapered relatively smoothly. A good fit between the calculated contour and the lumen diameter of the cross-section with the thinnest intima is obvious. For a frame space of about 0.2 mm, the stent length required to cover the most severe part of the lesion is approximately 27 mm; that is, from image frame 125 to image frame 260.
一態様において、ユーザは、ステントの端部の好ましい接触位置を設定するために計算された輪郭上で位置を選択してもよい。接触位置の計画を促進するために、高い正常性の格付けを有する画像の領域を、いくつかの態様において、色分けされたバーまたは他の指標として表示する。参照フレーム検出および格付け方法は、画像加工およびコンピュータ視覚アルゴリズムを使用して、内膜中膜(IM)の厚さおよび外膜(OA)領域を決定する。これは、未加工のAライン、画像の中心から外側へのスキャンデータ、および再構築されたフレームに直接作用するアプローチの組合せを使用してなされる。一態様において、前記システムは、遠位接触点が血管の実質的に正常な領域中にない場合には、ユーザに警告する。 In one aspect, the user may select a position on the calculated contour to set a preferred contact position for the end of the stent. To facilitate contact location planning, areas of the image with a high normality rating are displayed as color-coded bars or other indicators in some embodiments. Reference frame detection and grading methods use image processing and computer vision algorithms to determine intima-media (IM) thickness and adventitia (OA) region. This is done using a combination of raw A-line, image center-to-out scan data, and an approach that operates directly on the reconstructed frame. In one aspect, the system alerts the user if the distal contact point is not in a substantially normal region of the blood vessel.
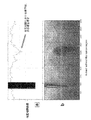
正常性を定義するための1つのアプローチは、光学閾値を決定することである。一態様において、最適強度閾値を、各フレーム中の全てのAラインに沿って組み合わせた画像強度プロファイルに基づいて決定する。閾値は、前記Aラインの強度プロファイル中の矢印により示される変曲(inflection)の領域のものとなるように選択される(図8a)。この閾値をまた、内腔壁から固定された距離(例えば、約0.56mmなど)での領域に相当する平均強度値を計算することにより決定することができる。この距離は、組織学研究において測定されたとおりの内膜中膜(IM)領域に相当する。血小板を有するフレームについては、強度プロファイルの肥大があり(図8b)、これは適切に閾値を修正する。変曲点の耐性因子(tolerance factor)内にある強度閾値を使用して、分離されたフォアグラウンドおよびバックグラウンドを有する二値画像を作り出す。前記二値画像の前記フォアグラウンドは、IM領域に相当し、その厚さが測定される。前記IM領域の平均の厚さは、正常性の程度を示す。血小板を有するフレームは、肥大したIM領域を有する一方で、正常な非疾患フレームは、均一で小さなIMの厚さを有する。 One approach to define normality is to determine an optical threshold. In one aspect, an optimal intensity threshold is determined based on the combined image intensity profile along all A lines in each frame. The threshold is selected to be in the inflection area indicated by the arrow in the A-line intensity profile (FIG. 8a). This threshold can also be determined by calculating an average intensity value corresponding to a region at a fixed distance from the lumen wall (eg, about 0.56 mm, etc.). This distance corresponds to the intima-media (IM) region as measured in histological studies. For frames with platelets, there is an intensity profile hypertrophy (FIG. 8b), which corrects the threshold appropriately. An intensity threshold that is within the tolerance factor of the inflection point is used to create a binary image with separated foreground and background. The foreground of the binary image corresponds to the IM region and its thickness is measured. The average thickness of the IM region indicates the degree of normality. A frame with platelets has an enlarged IM region, while a normal non-disease frame has a uniform and small IM thickness.
別のアプローチは、罹患していない参照フレームが、前記フレーム中の全てのAラインについて均一なテクスチャおよび強度特性を有することを考慮することである。この均一性の特性を、相互相関および構造類似性手法の両方を使用して捕捉する。各Aラインおよびその付近のAラインを一緒にしてグループ化し、何がAラインパッチと称されるか(what is termed an A−line patch)を作り出す。前記パッチを、次いで、正規化された相互相関を使用して、Aラインデータセット全体および相関数値を合わせて、相互相関させる。このプロセスを、Aラインパッチ毎にAラインデータ全体にわたって相互相関するまで、次の重複するAラインパッチにより繰り返す。 Another approach is to consider that an unaffected reference frame has uniform texture and intensity characteristics for all A-lines in the frame. This uniformity property is captured using both cross-correlation and structural similarity techniques. Each A-line and nearby A-lines are grouped together to produce what is termed an A-line patch. The patch is then cross-correlated using the normalized cross-correlation, combining the entire A-line data set and the correlation value. This process is repeated with the next overlapping A-line patch until every A-line patch is cross-correlated across the A-line data.
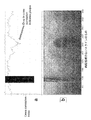
相関数値を、次いでプロットする(図9)。付近のAラインと比較してより低い相関数値を有するAラインは、非均一性を示し、血小板の存在を示唆する。正常な、非血小板フレームは、理想的には、全てのAラインにわたって均一な相関数値を有するであろう。グラフ中の黒色エリアは、誘導線の影の領域に相当する。例えば、相互相関に沿って強度類似性を測定する、Z. Wang et al.らの“Image quality assessment: From error visibility to structural similarity”, IEEE Trans. Image Proc, vol 14, no 4, 2004におけるものなどの、構造類似性評価基準(structure similarity metric)(SSIM)はまた、正常および疾患フレームを区別するのに使用することができる均一性の特性を提供するであろう。前記Wangのアプローチは、2つの隣接するパッチ中の各ピクセルに中心のあるウインドウ中の強度の平均および標準偏差を使用して、前記2つのパッチ間の構造の知覚的変化のための評価基準を計算する。全てのパッチにわたってより均一なSSIMを有するフレームは、正常である傾向がある一方で、血小板を有するものは、非均一なSSIM値を有するであろう。 The correlation values are then plotted (FIG. 9). An A line with a lower correlation value compared to a nearby A line shows non-uniformity, suggesting the presence of platelets. A normal, non-platelet frame would ideally have a uniform correlation value across all A lines. The black area in the graph corresponds to the shadow area of the guide line. For example, in Z. Wang et al. Et al. “Image quality assessment: From error visibility to structural similarity”, IEEE Trans. Image Proc, vol 14, no 4, 2004, which measures intensity similarity along cross-correlation. A structure similarity metric (SSIM), etc. will also provide uniformity characteristics that can be used to distinguish between normal and disease frames. The Wang approach uses the mean and standard deviation of the intensity in a window centered at each pixel in two adjacent patches to provide a metric for perceptual changes in structure between the two patches. calculate. Frames with a more uniform SSIM across all patches tend to be normal, while those with platelets will have non-uniform SSIM values.
正常性の別の基準は、OAに対するIM比である。この比を得るために、関心のあるフレームをまず、ローパスおよびガボールフィルタの組み合わせからなる(consists of a combination low pass and Gabor filters)フィルタバンクを使用して、まずフィルタする。基礎ガボールフィルタ(方程式4)は、正弦波関数で変調されたガウスフィルタである。これは、バンドパスフィルタとして振舞い、血管画像の周りの異なる半径方向に配向することができる。ガウスは、以下の方程式中の位相項を変化させることにより、予め決定された異なる配向に沿って向き、正常フレームの前記OA領域中で見られる特徴的な反射領域を捕捉する。前記フィルタの一般的形式は:

一態様において、学習のために、OA領域のセットを、ユーザにより識別し、ガボールフィルタを前記セットに適用する。例えば、前記φ、δxおよびδyなどの前記フィルタパラメータは、広範囲の値にわたって異なる。IM領域への低応答を有する前記OA領域に最も大きな応答を与える前記セットのパラメータを、最良のセットのパラメータとして選択して、前記OA領域をフィルタする。いったんこれらの最適なパラメータが決定されると、それらを全てのデータセットに使用することができる。正常フレーム中の前記IMおよびOA領域間の、主要な際立った特徴は、外膜中の緩いコラーゲン(loose collagen)または血管周囲脂肪の存在を示す反射特徴の存在である。前記フィルタは、いったん同調されると、これらの特徴を強調することを試みる一方で、他の全てを抑制する。 In one aspect, for learning, a set of OA regions is identified by a user and a Gabor filter is applied to the set. For example, the filter parameters such as φ, δ x and δ y differ over a wide range of values. The set of parameters that gives the greatest response to the OA region with a low response to the IM region is selected as the best set of parameters to filter the OA region. Once these optimal parameters are determined, they can be used for all datasets. The main distinguishing feature between the IM and OA regions in the normal frame is the presence of reflective features indicating the presence of loose collagen or perivascular fat in the outer membrane. Once tuned, the filter attempts to emphasize these features while suppressing all others.
上記のフィルタバンクを使用する前記フレームのフィルタ後、得られた前記IM領域および前記反射OA領域を、バックグラウンドと比較して、高輝度色(high intensity color)で強調する。次のステップで、2セットの輪郭を、前記フィルタした画像上で;一方を、前記画像の中心から外側へ、および他方を前記画像の外側境界線から内側へ、発現させる。すなわち、2セットの輪郭が発現し、一方は、前記IMおよびOA間の境界線を中心から外側に向かって移動して定義することを試み、一方は、外側から内側に向かって移動する。前記輪郭は、下部の画像の強度およびテクスチャ特性に基づいて伝播する。前記画像は、前記IMおよびOAテクスチャを強調してフィルタされる。前記IM輪郭は、下部の領域が、前記IM領域の特性である均一なテクスチャを有する場合には、一定の速度で伝播する。前記OA領域のテクスチャ特性により、領域に到達すると、その伝播は遅くなって停止する。前記画像の外側の境界線から出発する前記OA輪郭は、遅くなって停止する点である、前記OAテクスチャ領域に到達するまで、ノイズを経て伝播する。 After filtering the frame using the filter bank, the IM region and the reflective OA region obtained are enhanced with a high intensity color compared to the background. In the next step, two sets of contours are developed on the filtered image; one from the center of the image to the outside and the other from the outer boundary of the image to the inside. That is, two sets of contours appear, one trying to define the boundary between the IM and OA moving from the center to the outside and one moving from the outside to the inside. The contour propagates based on the intensity and texture characteristics of the underlying image. The image is filtered with emphasis on the IM and OA textures. The IM contour propagates at a constant velocity when the lower region has a uniform texture that is characteristic of the IM region. Due to the texture characteristics of the OA area, when it reaches the area, its propagation slows down and stops. The OA contour starting from the outer border of the image propagates through noise until it reaches the OA texture region, which is the point where it stops late.
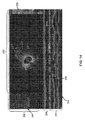
内側の輪郭は、外側に向かって内腔境界線から伝播し、これは、既に標準OCTソフトウエアにより検出されてきた。各点でのこの輪郭の伝播のためのステップの寸法を、前記画像中のその点での下部の強度特性に基づいて決定し;明るい均一な領域が大きなステップを示唆する一方で、低強度および高強度勾配は、小さなステップ寸法を示唆する。前記IM領域の端部に相当する端部勾配に到達したところで、前記輪郭は伝播を停止する。図10Cは、前記IMおよびOA領域を描く。 The inner contour propagates outward from the lumen boundary, which has already been detected by standard OCT software. The size of the step for propagation of this contour at each point is determined based on the intensity characteristics of the lower part at that point in the image; while the bright uniform area suggests a large step, the low intensity and A high intensity gradient suggests a small step size. When the edge gradient corresponding to the edge of the IM region is reached, the contour stops propagating. FIG. 10C depicts the IM and OA regions.
外側の輪郭は、中心に向かって前記画像の外側端部から伝播される。内側の輪郭と同様に、この輪郭の各ステップは、前記下部の強度特性に基づく。ここで、強度値が低い場合には、前記ステップ寸法は大きく、端部または高強度領域に到達すると、前記輪郭は伝播を停止させる。これは、典型的には、前記OA領域の前記端部に相当する。前記外側の輪郭は、前記内側の輪郭が発達を終えた後に成長する。前記OA領域中で不十分にフィルタされた反射特徴がある場合に生じる(典型的には血小板中で起こる)、前記外側の輪郭が、前記内側の輪郭に近づく場合には、その伝播は終了する。前記内側および外側の輪郭間の前記領域は、前記セグメントされたOA領域に相当する。血小板を有するフレームがより薄いOA領域を有するであろう一方で、血小板を有さず、前記テクスチャフィルタステップ後に強調される強い反射特徴を有するものは、より厚くなるであろう。 The outer contour is propagated from the outer edge of the image towards the center. As with the inner contour, each step of this contour is based on the intensity characteristic of the lower part. Here, when the intensity value is low, the step size is large, and when the edge or high intensity region is reached, the contour stops propagation. This typically corresponds to the end of the OA region. The outer contour grows after the inner contour has finished developing. Propagation ends when the outer contour approaches the inner contour, which occurs when there are poorly filtered reflection features in the OA region (typically in platelets). . The region between the inner and outer contours corresponds to the segmented OA region. Frames with platelets will have thinner OA regions, while those without platelets and having strong reflective features that are enhanced after the texture filtering step will be thicker.
これにより、2つの輪郭は、前記フレームのIMおよびOA領域中にパーティションまたはセグメンテーションを作り出す(図10b)。各Aラインにおける前記OA幅に対する前記IM幅の比により、正常性の指標が提供される(図10a)。血小板領域は、高いIMおよび極めて低いOA領域を有する一方で、正常領域は、ほぼ等しいIMおよびOA幅を有する。誘導線領域を無視して、前記フレーム中の全てのAラインについての平均の比は、図10aにクラスタリングにより例示されるとおりの正常性の指標である。血小板を有しないフレームは、OAに対するIMの低い平均の比を有する一方で、血小板を有するものは、OAに対するIMの大きな比を有する。 Thereby, the two contours create partitions or segmentations in the IM and OA regions of the frame (FIG. 10b). The ratio of the IM width to the OA width at each A line provides an indication of normality (FIG. 10a). The platelet region has a high IM and a very low OA region, while the normal region has approximately equal IM and OA widths. Ignoring the guideline region, the average ratio for all A lines in the frame is a measure of normality as illustrated by clustering in FIG. 10a. Frames without platelets have a low average ratio of IM to OA, while those with platelets have a large ratio of IM to OA.
より詳細には、図10aは、フレームのサンプリングについての、OAに対するIMの平均の比の散乱プロットを示す。OAに対するIMの比の上位50%およびOAに対するIMの比の上位33%の平均の散乱をまた、プロットする。約2よりも大きい、OAに対するIMの平均の比を有するフレームは、罹患である一方で、約2よりも低いものは正常である。約2よりも小さい比を有するこれらのフレームを、参照フレームとして使用する。種々の平均の比により、前記参照フレームの格付けとして使用される、正常性の基準が提供される。図10cにおいて、底部の前記フレームは、前記フィルタの出力および輪郭成長ステップであり、IMおよびOAの仕切りを示す。これを使用して、そのフレームについての前記OAに対するIMの比を計算する。血小板を有するフレームは、全体にわたってより小さなOAの厚さを示し、よって、そのOAに対するIMの比は、血小板を有しない前記フレームよりずっと高い。 More specifically, FIG. 10a shows a scatter plot of the average ratio of IM to OA for frame sampling. The average scatter of the top 50% of the ratio of IM to OA and the top 33% of the ratio of IM to OA is also plotted. Frames with an average ratio of IM to OA greater than about 2 are affected while those lower than about 2 are normal. Those frames having a ratio less than about 2 are used as reference frames. Various average ratios provide a measure of normality that is used as a rating for the reference frame. In FIG. 10c, the bottom frame is the output and contour growth step of the filter, showing the IM and OA dividers. This is used to calculate the ratio of IM to OA for that frame. The frame with platelets shows a smaller OA thickness throughout, so the ratio of IM to OA is much higher than the frame without platelets.
一態様において、1〜5の格付けを、各フレームに提供し、ここで、1は、正常組織の画像フレームを示し、5は、疾患組織の画像フレームを示す。前記格付けは、前記IM領域が、特定の閾値をより大きな厚みを有する象限の数に基づく。図11aに示される前記フレームは、1に格付けされる一方で、図11bに示される前記フレームは、5に格付けされる。前記内側の輪郭100および外側の輪郭110は、前記IMおよびOA領域をセグメントする、内側のおよび外側の輪郭である。各象限中の平均IMの厚みを、前記内側の輪郭に基づいて計算する。全ての象限中の厚いIMは、疾患を示し、より低い格付けを与えられる。
In one aspect, a rating of 1-5 is provided for each frame, where 1 indicates an image frame of normal tissue and 5 indicates an image frame of diseased tissue. The rating is based on the number of quadrants in which the IM region has a certain threshold and a greater thickness. The frame shown in FIG. 11a is rated 1 while the frame shown in FIG. 11b is rated 5. The
前記計算されたステントプロファイルを、前記内腔直径と比較して、前記計算された理想プロファイルおよび現在の内腔プロファイル間の誤差または偏差の基準を提供する指標値を決定する(図12および13参照)。各フレームにおいて、前記計算されたステントプロファイル面積および現在の内腔面積間のパーセントの差を計算する。
ステント膨張誤差指標=(面積理想−面積現在)/面積現在 方程式5
The calculated stent profile is compared with the lumen diameter to determine an index value that provides a measure of error or deviation between the calculated ideal profile and the current lumen profile (see FIGS. 12 and 13). ). In each frame, the percent difference between the calculated stent profile area and the current lumen area is calculated.
Stent expansion error index = (area ideal−area present) / area present Equation 5
各フレームにおいて計算された前記誤差を合わせて、プルバック(pullback)全体についての単一の指標を得る。より低い番号が、より小さな誤差を示すであろう(図13)。 The errors calculated in each frame are combined to obtain a single measure for the entire pullback. A lower number will indicate a smaller error (Figure 13).
図14を参照すると、前記システムの前記グラフィックインターフェース210の態様には、多数のパネルまたはサブスクリーンが含まれる。第1パネル214は、OCTにより画像化される血管の縦断面である。明るいエリア218は、前記血管の内腔壁を示す一方で、黒色エリア219は、血管の内腔である。第2パネル222は、前記白色縦線226により占めされる前記第1パネル214中の位置で示される血管の横断面である。
Referring to FIG. 14, the
前記システムまたはその構成要素により検出されたとおりの血管内腔は、破線でセグメントされた境界線(dotted segmented boundary)230により示される。前記画像中の影234は前記プローブを向けるのに使用される誘導線により生じた影である。前記プローブ238の中心を、同心円により囲まれる白色ドット242として画像化する。最も明るい同心円246は、前記プローブの前記壁内の酸化チタン目盛層である。ドット250を有する斜線は、血管の縦軸を通る画像切断面の配向を表す。最大径251および最小径252が表示される。さらに、一連の制御ボックス253が、オペレータが、種々の方法で前記画像を操作できるように表示される。
The vessel lumen as detected by the system or its components is indicated by a dotted segmented boundary 230. The shadow 234 in the image is the shadow caused by the guide line used to point the probe. The center of the probe 238 is imaged as a white dot 242 surrounded by a concentric circle. The brightest concentric circle 246 is the titanium oxide graduation layer in the wall of the probe. The diagonal line with
第3パネル254は、内腔の内部がより暗く[256]、内腔の外部がより明るい[257]、血管の内腔のシルエット表現である。縦の黒色領域258(説明のために1つのみをラベルしたもの)またはバーは、側枝であり、前記側枝を、それらが内腔から離れる際(as they leave the lumen)のそれらの実際の配向にかかわらず、前記内腔から縦にぶら下がって描かれる(depending vertically from the lumen)。縦の黒色領域の幅は、前記側枝の基準である。
The
第4パネル262は、第2パネル222中の内腔画像上に何が示されているかおよびあらゆる基準を示す情報パネルである。この例264において、前記内腔の面積を計算して、最大径および最小径の測定が表示される。
The
図15を参照すると、この例においては、ユーザは、(横断面フレーム214中の約45mmでの線287として示される)横断面位置指標を動かし、前記MLAが、パネル4中で前記MLAボックス273をチェックすることにより計算されなければならないことを示した。それに応じて、前記システムは、遠位境界線マーカー274および近位境界線マーカー278を発生させ、前記ユーザに、所望の場合には、各線をドラックしてドロップすることによりそれらの各線を別々に位置させることを可能にする。パネル3は、どこに遠位および近位境界線が位置するか282、283を示し、所定の内腔領域(白色ハッシュ線(white hashed lines))286についての標的内腔直径を表示する。前記標的内腔直径は、血管を断裂する可能性があるので、ステント直径を超えてはならない血管の最も大きな寸法である。側枝で内腔が減少するにつれて、前記白色ハッシュ線が、枝でステップダウンする(例えば、290などを参照)ことに留意せよ。さらに、前記実際の内腔壁および前記ハッシュ白色線で示された前記標的内腔直径の差として、前記システムは、例えば、ハッチングまたはコントラスト色などで、領域294中で次第に変化する。前記システムは、前記近位境界線および遠位境界線指標296間の距離を表示する。よって、一態様において、前記ソフトウエアを、所定のユーザインターフェースの一部として、実際の内腔壁および標的内腔直径間の差が、可視指標を使用して表示されるように構成することができる。
Referring to FIG. 15, in this example, the user moves a cross-sectional position indicator (shown as a line 287 at about 45 mm in the cross-sectional frame 214) so that the MLA is in the MLA box 273 in the panel 4. Showed that it should be calculated by checking. In response, the system generates a distal boundary marker 274 and a proximal boundary marker 278 that allows the user to separate each line by dragging and dropping each line, if desired. Allows to be positioned.
図16を参照すると、示されるとおり、前記ユーザは、下部境界線マーカー274および上部境界線マーカー278を動かし、前記システムは、この新たな範囲について前記MLAを再計算し、前記パネル中にそれ300を表示する。さらに、前記システムは、前記遠位および近位境界線指標間の差を再計算し、この測定296’を表示する。前記ユーザは、前記遠位および近位境界線指標について種々の位置を試すことを継続して(図17)、種々の測定をすることができ、これにより、前記ステントを置くための最良の位置、前記ステントがどのくらいの長さであるべきか、および前記ステントがどのくらいの半径であるべきかを判断することができる。このようにして、血管および内腔の前記OCT表現を、異なるステントの位置決めのシナリオを試験することが可能な、変形可能なまたは修正可能な表現として構成する。 Referring to FIG. 16, as shown, the user moves the lower border marker 274 and the upper border marker 278, and the system recalculates the MLA for this new range and displays it in the panel. Is displayed. In addition, the system recalculates the difference between the distal and proximal boundary indices and displays this measurement 296 '. The user can continue to experiment with different positions on the distal and proximal boundary indicators (FIG. 17) to make various measurements, thereby providing the best position for placing the stent. It can be determined how long the stent should be and how much radius the stent should be. In this way, the OCT representation of blood vessels and lumens is configured as a deformable or modifiable representation that can test different stent positioning scenarios.
結果として、前記ユーザは、1つより多いステントが必要かどうかを決定すること;前記ステントが多すぎる枝の血管をブロックするであろうか否か;および、前記ステントの端部の位置(「着地ゾーン」)により、それらが狭窄のエリアに置かれることをもたらすであろうか否か、を決定することができる。前記システムはまた、前記境界線指標282、282’のそれぞれにおいて、血管の直径297、297’をラベルする。存在する前記2つの番号は、現在の血管内腔直径(より小さい番号)および標的内腔直径(より大きい番号)である。前記システムはまた、現在の内腔直径(より小さい番号)および標的内腔直径(より大きい番号)(一般的には、303)を挙げる、前記内腔302中の所定の点についてのラベル300、前記MLA304ならびに狭窄の面積(AS)パーセント305を提供し、前記狭窄の面積(AS)パーセント305は、以下の方程式:
AS=(最適面積−現在の面積)/最適面積 方程式6
に7より与えられる。
As a result, the user may determine whether more than one stent is needed; whether the stent will block too many branch vessels; and the position of the end of the stent ("landing" The zone ") allows to determine whether they will result in being placed in the area of stenosis. The system also labels the vessel diameters 297, 297 ′ at each of the boundary indicators 282, 282 ′. The two numbers present are the current vessel lumen diameter (smaller number) and the target lumen diameter (larger number). The system also includes a
AS = (optimal area-current area) / optimal area Equation 6
Is given from 7.
前記システムはまた、前記ステント端部の前記標的ステント直径を決定することができる。前記標的ステントプロファイルを、前記血管内腔の前記直径を使用して計算する。これを行うために、前記アルゴリズムは、いくつかの推測をする。まず、枝間の前記内腔である、内腔セグメントの直径は一定である。前記内腔が枝を横切ると、前記内腔の直径は、前記内腔の近位直径が遠位直径より大きくなるように減少する。内腔のセグメント間での内腔直径の、この増加する減少は、前記内腔セグメント間の前記枝直径に比例する。最後に、前記式および直径計算の前記ソフトウエアに基づく実装および本明細書において記載される他のステップには、前記ステントの端部が、断裂し得る脂質またはカルシウム狭窄のエリア中に置かれたことを前記ユーザへ警告する警報が含まれる。 The system can also determine the target stent diameter at the stent end. The target stent profile is calculated using the diameter of the vessel lumen. To do this, the algorithm makes several guesses. First, the diameter of the lumen segment, which is the lumen between the branches, is constant. As the lumen traverses the branch, the diameter of the lumen decreases such that the proximal diameter of the lumen is greater than the distal diameter. This increasing decrease in lumen diameter between lumen segments is proportional to the branch diameter between the lumen segments. Finally, in the software-based implementation of the equation and diameter calculation and other steps described herein, the end of the stent was placed in an area of ruptured lipid or calcium stenosis. An alarm is included to warn the user of this.
結果として、遠位または近位ステント境界線を有するセグメント中の前記標的ステントプロファイルの直径は、その遠位または近位境界線における前記内腔の実際のものに、実質的に等しい。さらに、近位および遠位境界線間の前記面積の差は、前記セグメント間の枝の直径に比例する、前記2つの境界線間の前記セグメントの中に分布する。これは、2つのセグメント間の面積の減少が、前記2つのセグメント間の前記枝の直径に比例することを意味する。 As a result, the diameter of the target stent profile in a segment having a distal or proximal stent boundary is substantially equal to the actual one of the lumens at the distal or proximal boundary. Further, the area difference between the proximal and distal boundaries is distributed in the segment between the two boundaries, which is proportional to the diameter of the branch between the segments. This means that the area reduction between two segments is proportional to the diameter of the branch between the two segments.
N個の枝がある場合には、枝面積(枝An)を有する各枝(n)での前記ステントの面積δnの増加の変化を決定するためのトーン法(tone method)またはアルゴリズムは、以下:
Δ=近位端面積−遠位端面積 方程式7
であり、式中、Δは、面積の差である。これは、各枝における面積の増加の変化の合計に等しく、全ての(N個の)枝にわたって合計される。
Δ=ΣnからNまでδn 方程式8
δnは、枝Anに比例 方程式9
δn=(枝An*Δ)/ΣnからNまで枝An 方程式10
If there are N branches, the tone method or algorithm for determining the change in increase of the stent area δ n at each branch (n) with branch area (branch An ) is ,Less than:
Δ = proximal end area−distal end area Equation 7
Where Δ is the difference in area. This is equal to the sum of the change in area increase at each branch and is summed over all (N) branches.
Δ = Σ n to N δ n equation 8
δ n is proportional to branch A n Equation 9
[delta] n = (branch A n * delta) / sigma branch A n equations from n to N 10
よって、各枝における直径の変化は:
dn=√(4 δn/π) 方程式11
である。
Thus, the change in diameter at each branch is:
d n = √ (4 δ n / π) Equation 11
It is.
検討の価値のある、特別な場合がいくつかある。例えば、前記ステントが、1つのセグメント内に置かれるのに十分に小さい場合には、前記ステントプロファイルは、前記2つの端部に接続する直線であり、前記2つの端部は、同じ直径である。近位カーソルの前記内腔の直径が、遠位カーソルの直径より小さい場合には、ステントプロファイルは、前記2つの端部を接続する直線であるが、前記2つの端部は、異なる直径を有する。 There are some special cases that are worth considering. For example, if the stent is small enough to be placed in one segment, the stent profile is a straight line connecting the two ends, and the two ends are the same diameter . If the lumen diameter of the proximal cursor is smaller than the diameter of the distal cursor, the stent profile is a straight line connecting the two ends, but the two ends have different diameters .
図18を参照すると、前記標的ステントプロファイル310および標的内腔直径プロファイル286間の差を描く、グラフィックインターフェースの一部が示される。使用の際、前記内腔のOCTスキャンからのデータをデータベースから収集または読み出して、前記標的内腔プロファイルを、前記システム、方法または記載される別の構成要素により生成する。前記システムは、次いで1つまたは2つ以上のアルゴリズムおよび本明細書に記載される方法を使用して、前記標的ステント直径を計算する。代替的に、前記システムは、前記ユーザインターフェース中の前記ステント中でユーザが選択した位置に基づき、異なるステントの位置決めを試みることができる。 Referring to FIG. 18, a portion of a graphical interface depicting the difference between the target stent profile 310 and the target lumen diameter profile 286 is shown. In use, data from an OCT scan of the lumen is collected or retrieved from a database, and the target lumen profile is generated by the system, method or other component described. The system then calculates the target stent diameter using one or more algorithms and the methods described herein. Alternatively, the system can attempt to position different stents based on a user selected position in the stent in the user interface.
上記の説明は、本明細書に記載される本発明の前記方法を行うのに好適なデバイスハードウェアおよび他の操作構成要素の概要を提供することを意図する。この説明は、適用される環境または本発明の範囲を限定することを意図するものではない。同様に、前記ハードウエアおよび他の操作構成要素は、上記の装置の一部として好適であり得る。本発明を、パーソナルコンピュータ、マルチプロセッサシステム、マイクロプロセッサ系またはプログラマブル電子デバイス、ネットワークPC、ミニコンピュータ、メインフレームコンピュータなどを含む、他のシステム構成と共に実施することができる。 The above description is intended to provide an overview of device hardware and other operating components suitable for performing the methods of the invention described herein. This description is not intended to limit the environment to which it applies or the scope of the invention. Similarly, the hardware and other operating components may be suitable as part of the above apparatus. The present invention can be implemented with other system configurations including personal computers, multiprocessor systems, microprocessor-based or programmable electronic devices, network PCs, minicomputers, mainframe computers, and the like.
前記詳細な説明のいくつかの部分を、コンピュータメモリ内のデータビット上での操作のアルゴリズムおよび記号表現の観点から提示する。当業者は、これらのアルゴリズムの説明および表現を、前記コンピュータおよびソフトウエア関連分野中で使用することができる。一態様において、アルゴリズムを、一般的に、所望の結果を導く、首尾一貫したシーケンスの操作として定義する。方法ステップまたは本明細書において記載される別のものとして行われる操作は、物理量の物理的操作を必要とするものである。通常、必ずしも必要ではないが、これらの量は、保存、移動、組合せ、変換、比較および別の操作が可能な、電気的または磁気的シグナルの形式を取る。 Some portions of the detailed description are presented in terms of algorithms and symbolic representations of operations on data bits in computer memory. Those skilled in the art can use descriptions and representations of these algorithms in the computer and software related fields. In one aspect, an algorithm is generally defined as a consistent sequence of operations that leads to a desired result. Operations performed as method steps or otherwise described herein are those requiring physical manipulation of physical quantities. Usually, though not necessarily, these quantities take the form of electrical or magnetic signals capable of being stored, transferred, combined, converted, compared, and otherwise manipulated.
以下の検討から明らかなとおり、具体的に述べない限り、前記説明を通じて、例えば、「プロセシング」または「計算(computing)」または「表示」または「計算(caliculating)」または「比較」、「調整」、「生成」または「決定」または「表示」などの用語を使用する検討は、コンピュータシステムの作用およびプロセスまたは類似の電子計算デバイスを指すことが十分に理解され、これは、前記コンピュータシステムのレジスタおよびメモリ内の物理(電子的)量として表現されたデータを操作するか、あるいは、前記コンピュータシステムメモリまたはレジスタまたは他のかかる情報保存、伝送またはディスプレイデバイス内の物理量として同様に表現される他のデータに変換する。 As will be apparent from the discussion below, unless otherwise stated, throughout the description, for example, “processing” or “computing” or “display” or “calciculating” or “comparison”, “adjustment” It is well understood that a discussion using terms such as "generate" or "determine" or "display" refers to the operation and process of a computer system or similar electronic computing device, which is a register of the computer system And manipulating data expressed as physical (electronic) quantities in memory, or other similarly expressed as physical quantities in said computer system memory or registers or other such information storage, transmission or display devices Convert to data.
いくつかの態様において、本発明はまた、本明細書における前記操作を行うための装置に関する。この装置は、所望の目的のために具体的に構築され、または汎用コンピュータを含んでもよく、これは、前記コンピュータ中に保存されたコンピュータプログラムにより選択的に起動されるかまたは再構成される。 In some embodiments, the present invention also relates to an apparatus for performing the operations herein. The apparatus may be specifically constructed for the desired purpose or may include a general purpose computer, which is selectively activated or reconfigured by a computer program stored in the computer.
本明細書において提示される前記アルゴリズムおよびディスプレイは、いかなる特定のコンピュータまたは他の装置に、固有に関連するものではない。種々の汎用システムを、本明細書における教示に従って、プログラムと共に使用してもよく、またはより特別な装置を構築して所望の方法ステップを行うことが都合がよいことを証明し得る。種々のこれらのシステムについて所望される構造は、以下の説明から明らかであろう。 The algorithms and displays presented herein are not inherently related to any particular computer or other apparatus. Various general purpose systems may be used with the program in accordance with the teachings herein, or it may prove convenient to construct a more specific apparatus to perform the desired method steps. The desired structure for a variety of these systems will appear from the description below.
本発明の態様を、多くの異なる形態で具現化してもよく、これに限定されないが、プロセッサと使用するためのコンピュータプログラムロジック(例えば、マイクロプロセッサ、マイクロコントローラ、デジタルシグナルプロセッサまたは汎用コンピュータなど)、プログラマブル論理デバイスと使用するためのプログラマブル論理(例えば、フィールドプログラマブルゲートアレイ(Field Programmable Gate Array)(FPGA)または他のPLDなど)、個別部品、集積回路(例えば、特定用途向け集積回路(ASIC)など)、あるいはこれらのあらゆる組み合わせを含むあらゆる他の手段を含む。本発明の典型的な態様において、OCTプローブおよび前記プロセッサ系システムを使用して収集されたデータの、いくつかのまたは全てのプロセシングを、コンピュータプログラム指示のセットとして実装し、これは、コンピュータ実行可能形式に変換され、自体がコンピュータ可読媒体中に保存され、操作システムの制御の下でマイクロプロセッサにより実行される。よって、クエリー応答および入力データを、OCTデータの生成、輪郭の生成および伝播、データのフィルタ、領域の表示、面積および体積の測定、パラメータに基づくまたは応答する、医療用デバイス特有の作動、上記のその他の特徴および態様の実行、に好適な、プロセッサが理解可能な指示に変換する。 Aspects of the invention may be embodied in many different forms, including but not limited to computer program logic (eg, a microprocessor, microcontroller, digital signal processor, or general purpose computer) for use with a processor, Programmable logic for use with programmable logic devices (eg, Field Programmable Gate Array (FPGA) or other PLDs), discrete components, integrated circuits (eg, application specific integrated circuits (ASICs), etc.) ), Or any other means including any combination thereof. In an exemplary embodiment of the present invention, some or all processing of data collected using an OCT probe and the processor-based system is implemented as a set of computer program instructions that are computer-executable. Converted into a form, itself stored in a computer-readable medium, and executed by a microprocessor under the control of an operating system. Thus, query response and input data can be generated by OCT data generation, contour generation and propagation, data filtering, area display, area and volume measurement, parameter-based or responsive medical device specific operations, It translates into instructions understandable to the processor, suitable for implementation of other features and aspects.
本明細書において上に記載される機能性の全てまたは一部を実装するコンピュータプログラムロジックを、種々の形式で具現化してもよく、これに限定されないが、ソースコード形式、コンピュータ実行可能形式および種々の中間形式(例えば、アセンブラー、コンパイラー、リンカーまたはロケーターにより生成される形式など)を含む。ソースコードは、種々の操作システムまたは操作環境と使用するための、種々のプログラミング言語(例えば、オブジェクトコード、アセンブリ言語、または例えば、Fortran、C、C++、JAVA、またはHTMLなどの高レベル言語など)のいずれかで実装された一連のコンピュータプログラム指示を含んでもよい。前記ソースコードは、種々のデータ構造および通信メッセージを定義して使用してもよい。前記ソースコードは、(例えば、インタープリターなどにより)コンピュータ実行可能形式であってもよく、または前記ソースコードは、(例えば、トランスレーター、アセンブラーまたはコンパイラーなどにより)コンピュータ実行可能形式に変換されてもよい。 Computer program logic that implements all or part of the functionality described herein above may be embodied in various forms, including but not limited to source code form, computer-executable form, and various forms. Intermediate formats such as those generated by an assembler, compiler, linker or locator. The source code can be in various programming languages (eg, object code, assembly language, or high level languages such as Fortran, C, C ++, JAVA, or HTML) for use with various operating systems or operating environments. May include a series of computer program instructions implemented in any of the above. The source code may define and use various data structures and communication messages. The source code may be in a computer-executable format (eg, by an interpreter or the like), or the source code may be converted into a computer-executable format (eg, by a translator, assembler, compiler, etc.). .
前記コンピュータプログラムを、例えば、半導体メモリデバイス(例えば、RAM、ROM、PROM、EEPROMまたはフラッシュプログラマブルRAMなど)、磁気メモリデバイス(例えば、ディスケットまたは固定されたディスクなど)、光学メモリデバイス(例えば、CD−ROMなど)、PCカード(例えば、PCMCIAカードなど)または他のメモリデバイスなどの、有形保存媒体中に、永久的にまたは一時的に、のいずれかで、あらゆる形式(例えば、ソースコード形式、コンピュータ実行可能形式または中間形式など)で固定してもよい。前記コンピュータプログラムを、例えば、これに限定されないが、アナログ技術、デジタル技術、光学技術、ワイヤレス技術(例えば、Bluetoothなど)、ネットワーク技術、およびインターネットワーキング技術などを含む種々の通信技術のいずれかを使用して、コンピュータへ送信可能なあらゆるシグナルの形式で固定してもよい。前記コンピュータプログラムは、付随する印刷されたまたは電子文書(例えば、市販のソフトウエアなど)で取り外し可能な保存媒体としてのあらゆる形式で頒布されるか、(例えば、ROMまたは固定されたディスクなどに)コンピュータシステムで予めロードされるか、または通信システム(例えば、インターネットまたはワールドワイドウェブなど)上にサーバまたは電子掲示板から頒布されてもよい。 The computer program may be, for example, a semiconductor memory device (eg, RAM, ROM, PROM, EEPROM or flash programmable RAM), a magnetic memory device (eg, diskette or fixed disk), an optical memory device (eg, CD- ROM, etc., in any form (eg source code format, computer), either in a tangible storage medium, such as a PC card (eg PCMCIA card) or other memory device, either permanently or temporarily It may be fixed in an executable format or an intermediate format. The computer program uses any of a variety of communication technologies including, but not limited to, analog technology, digital technology, optical technology, wireless technology (eg, Bluetooth, etc.), network technology, internetworking technology, etc. Thus, it may be fixed in the form of any signal that can be transmitted to the computer. The computer program can be distributed in any form as a removable storage medium in an accompanying printed or electronic document (such as commercially available software) or (such as in a ROM or a fixed disk). It may be pre-loaded with a computer system or distributed from a server or bulletin board over a communication system (eg, the Internet or the World Wide Web).
プログラマブル論理を、例えば、半導体メモリデバイス(例えば、RAM、ROM、PROM、EEPROMまたはフラッシュプログラマブルRAMなど)、磁気メモリデバイス(例えば、ディスケットまたは固定されたディスクなど)、光学メモリデバイス(例えば、CD−ROMなど)またはその他のメモリデバイスなどの、有形保存媒体中に、永久的にまたは一時的に、のいずれかで固定してもよい。前記プログラマブル論理を、例えば、これに限定されないが、アナログ技術、デジタル技術、光学技術、ワイヤレス技術(例えば、Bluetoothなど)、ネットワーク技術、およびインターネットワーキング技術などを含む種々の通信技術のいずれかを使用して、コンピュータへ送信可能なシグナルの形式で固定してもよい。前記プログラマブル論理は、付随する印刷されたまたは電子文書(例えば、市販のソフトウエアなど)で取り外し可能な保存媒体として頒布されるか、(例えば、システムROMまたは固定されたディスクなどに)コンピュータシステムで予めロードされるか、または通信システム(例えば、インターネットまたはワールドワイドウェブなど)上にサーバまたは電子掲示板から頒布されてもよい。 Programmable logic, for example, semiconductor memory devices (such as RAM, ROM, PROM, EEPROM or flash programmable RAM), magnetic memory devices (such as diskettes or fixed disks), optical memory devices (such as CD-ROM) Or in other tangible storage media, such as other memory devices, either permanently or temporarily. The programmable logic may use any of a variety of communication technologies including, but not limited to, analog technology, digital technology, optical technology, wireless technology (eg, Bluetooth, etc.), network technology, internetworking technology, etc. Then, it may be fixed in the form of a signal that can be transmitted to the computer. The programmable logic may be distributed as a removable storage medium in accompanying printed or electronic documents (eg, commercially available software) or in a computer system (eg, on a system ROM or fixed disk). It may be pre-loaded or distributed from a server or bulletin board on a communication system (eg, the Internet or World Wide Web).
好適なプロセシングモジュールの種々の例を、以下でより詳細に検討する。本明細書において使用するとおり、モジュールは、特定のデータプロセシングまたはデータ送信タスクを行うのに好適なソフトウエア、ハードウエアまたはフィルムウエアを指す。典型的には、好ましい態様において、モジュールは、指示または例えば、測定されたプローブパラメータ、定量的パラメータ、エンコーディングスキーム、デコーディングスキーム、キャリブレーションデータ、プローブ長、プローブ測定、プローブ強度、および関心のある他の情報などの種々のタイプのデータを、受信、変換、ルーチン、およびプロセシングするのに好適な、ソフトウエアルーチン、プログラムまたは他のメモリ常駐用途を指す。 Various examples of suitable processing modules are discussed in more detail below. As used herein, a module refers to software, hardware or filmware suitable for performing a specific data processing or data transmission task. Typically, in preferred embodiments, the module is instructed or eg measured probe parameters, quantitative parameters, encoding schemes, decoding schemes, calibration data, probe lengths, probe measurements, probe strengths, and interests Refers to software routines, programs or other memory resident applications suitable for receiving, converting, routines, and processing various types of data such as other information.
本明細書において記載するコンピュータおよびコンピュータシステムには、例えば、データを入手し、プロセシングし、および/または通信するのに使用される、ソフトウエアアプリケーションを保存するためのメモリなどの、動作可能な関連コンピュータ可読媒体が含まれてもよい。かかるメモリは、その動作可能な関連コンピュータまたはコンピュータシステムに関し、内部、外部、リモートまたはローカルであり得ることが十分に理解されることができる。 The computers and computer systems described herein are operatively associated, such as, for example, a memory for storing software applications used to obtain, process, and / or communicate data. A computer readable medium may be included. It can be appreciated that such memory may be internal, external, remote or local with respect to its operable associated computer or computer system.
メモリにはまた、例えば、これに限定されないが、ハードディスク、光学ディスク、フロッピーディスク、DVD(デジタル多用途ディスク)、CD(コンパクトディスク)、メモリスティック、フラッシュメモリ、ROM(リードオンリーメモリ)、RAM(ランダムアクセスメモリ)、DRAM(ダイナミックランダムアクセスメモリ)、PROM(プログラマブルROM)、EEPROM(拡大された消去可能なPROM)、および/または他のコンピュータ可読媒体などを含む、ソフトウエアまたは他の指示を保存するためのあらゆる手段が含まれてもよい。 Examples of the memory include, but are not limited to, a hard disk, an optical disk, a floppy disk, a DVD (digital versatile disk), a CD (compact disk), a memory stick, a flash memory, a ROM (read only memory), a RAM ( Stores software or other instructions, including random access memory), DRAM (dynamic random access memory), PROM (programmable ROM), EEPROM (enlarged erasable PROM), and / or other computer readable media Any means for doing so may be included.
一般に、本明細書において記載する、本発明の態様に関連して適用されるコンピュータ可読メモリ媒体には、プログラマブル装置により実行される指示を保存することができる、あらゆるメモリ媒体が含まれてもよい。妥当な場合には、本明細書において記載する方法ステップを、コンピュータ可読メモリ媒体またはメモリ媒体上に保存された指示として、具現化または実行してもよい。これらの指示は、例えば、C++、C、Javaなどの種々のプログラミング言語、および/または本発明の態様に従って、指示を作り出すために適用され得る、種々の他の種類のソフトウエアプログラミング言語で具現化されたソフトウエアであってもよい。 In general, computer-readable memory media applied in connection with aspects of the present invention described herein may include any memory media that can store instructions executed by a programmable device. . Where appropriate, the method steps described herein may be embodied or performed as computer-readable memory media or instructions stored on a memory media. These instructions may be embodied in various programming languages such as, for example, C ++, C, Java, and / or various other types of software programming languages that may be applied to generate instructions in accordance with aspects of the invention. It may be software that has been updated.
本発明の前記側面、態様、特長および例は、全ての観点で例示的であると考えられなければならず、本発明を限定することを意図せず、その範囲は、特許請求の範囲にのみにより定義される。他の態様、修正、および使用は、請求項に係る発明の趣旨および範囲から逸脱せずに、当業者には明らかであろう。 The aspects, embodiments, features and examples of the present invention should be considered exemplary in all respects and are not intended to limit the present invention, the scope of which is limited only to the claims. Defined by Other aspects, modifications, and uses will be apparent to those skilled in the art without departing from the spirit and scope of the claimed invention.
本願における見出しおよびセクションの使用は、本発明を限定することを意図するものではなく;各セクションを、本発明のあらゆる側面、態様、または特徴に適用することができる。 The use of headings and sections in this application is not intended to limit the present invention; each section can be applied to any aspect, embodiment, or feature of the present invention.
本願を通じて、構成が、特定の構成要素を、有する、含む(including)、または含む(comprising)ものとして記載されている場合、あるいは、プロセスが、特定のプロセスステップを、有する、含む(including)、または含む(comprising)ものとして記載されている場合、本願の教示の前記構成はまた、実質的に前記記載された構成要素からなり、または前記記載された構成要素からなり、本願の教示の前記プロセスはまた、実質的に前記記載されたプロセスステップからなり、または前記記載されたプロセスステップからなる。 Throughout this application, where a configuration is described as having, including, or including a particular component, or where the process has a particular process step, including, Or the composition of the teachings of the present application also consists essentially of the described components, or consists of the described components, and the process of the teachings of the present application. Also consists essentially of the described process steps or consists of the described process steps.
本願において、要素または構成要素が、記載された要素または構成要素のリストに含まれる、および/または記載された要素または構成要素のリストから選択される、という場合には、前記要素または構成要素が、前記記載された要素または構成要素のいずれか1つであり得ること、および前記記載された要素または構成要素の2つまたは3つ以上からなる群から選択され得ることが理解されなければならない。さらに、本明細書において記載する、構成、装置、または方法の要素および/または特徴を、本明細書において明示的または黙示的であるか否かにかかわらず、本発明の教示の趣旨および範囲から逸脱せずに、種々の意味で組み合わせることができることが理解されなければならない。 In this application, if an element or component is included in and / or selected from the list of described elements or components, said element or component is It should be understood that any one of the described elements or components may be selected and selected from the group consisting of two or more of the described elements or components. Further, elements and / or features of any configuration, apparatus, or method described herein, whether expressed or implied in this specification, may be derived from the spirit and scope of the present teachings. It should be understood that various combinations can be made without departing.
用語「含む(include)」、「含む(includes)」、「含む(including)」、「有する(have)」、「有する(has)」または「有する(having)」の使用は、具体的な記載のない限り、一般に、オープンエンドおよび非限定的であるとして理解されなければならない。 The use of the terms “include”, “includes”, “including”, “have”, “has” or “having” is a specific description. Unless otherwise specified, it should generally be understood as open-ended and non-limiting.
本明細書における単数の使用には、具体的な記載のない限り、複数形が含まれる(およびその反対も同様)。さらに、単数形「a」、「an」および「the」には、文脈が明確に示さない限り、複数形が含まれる。さらに、用語「約」の使用が、定量的値の前である場合には、本願の教示にはまた、具体的な記載のない限り、具体的な定量的値自体が含まれる。 The use of the singular herein includes the plural (and vice versa) unless specifically stated otherwise. In addition, the singular forms “a”, “an”, and “the” include the plural unless the context clearly indicates otherwise. Further, where the use of the term “about” precedes a quantitative value, the teachings herein also include the specific quantitative value itself, unless specifically stated otherwise.
ステップの順番または特定の動作を行う順番は、本願の教示が動作可能である限り、無関係であることが理解されなければならない。さらに、2つまたは3つ以上のステップまたは動作を、同時に行ってもよい。 It should be understood that the order of steps or the order in which particular actions are performed is irrelevant as long as the teachings herein are operable. Furthermore, two or more steps or operations may be performed simultaneously.
値の範囲またはリストが提供される場合には、値のその範囲またはリストの上限および下限間の各中間値(intervening value)は、独立的と考えられ(individually contemplated)、各値が、本明細書において具体的に列挙されたものとして、本発明内に包含される。さらに、所定の範囲の上限および下限間の、および所定の範囲の上限および下限を含む、より小さな範囲は、本発明内であると考えられ、包含される。例示的な値または範囲の列挙は、所定の範囲の上限および下限間の、および所定の範囲の上限および下限を含む、他の値または範囲を除くものではない。 Where a range or list of values is provided, each intervening value between the upper and lower limits of that range or list of values is considered to be independent, and each value is It is included within the present invention as specifically recited in the document. Furthermore, smaller ranges between the upper and lower limits of a given range and including the upper and lower limits of the given range are considered and included within the present invention. The recitation of exemplary values or ranges does not exclude other values or ranges between the upper and lower limits of a given range and including the upper and lower limits of a given range.
Claims (29)
前記装置が、前記血管の画像を複数のセグメントに分割し、各セグメントを、前記血管の隣接の枝間の空間として定義すること;
前記装置が、実質的に血小板を有しないと思われる出発点を選択すること;
前記装置が、前記出発点で、前記内腔の最大径としての直径を定義すること;
前記装置が、べき法則に従い、隣接のセグメントの第1の最大径を計算すること;
前記装置が、前記隣接のセグメントの実際の直径を測定すること;
前記装置が、どちらの直径がより大きいかにより、前記計算された最大径または前記測定された最大径のいずれかに対応する、選択された最大径を選択すること;
前記装置が、前記選択された最大径を使用して、前記複数のセグメントの別のセグメントの第2の最大径を見つけること;
前記装置が、各セグメントについて、前記選択された最大径を反復して決定すること;および
前記装置が、近位端セグメントおよび遠位端セグメントの直径に応じて、ステントを選択すること、
を含む、作動方法。 A method of operating a device for determining the dimensions of the stent for positioning in the lumen of the blood vessel, the method of operation, the following:
The apparatus divides the image of the blood vessel into a plurality of segments, each segment being defined as a space between adjacent branches of the blood vessel;
Selecting a starting point at which the device appears to be substantially free of platelets;
The device defines a diameter as a maximum diameter of the lumen at the starting point;
The device calculates a first maximum diameter of adjacent segments according to a power law;
The device measures the actual diameter of the adjacent segment;
The device selects a selected maximum diameter corresponding to either the calculated maximum diameter or the measured maximum diameter, depending on which diameter is larger;
The apparatus finds a second maximum diameter of another segment of the plurality of segments using the selected maximum diameter;
The apparatus iteratively determines the selected maximum diameter for each segment; and
The device selects a stent depending on the diameter of the proximal end segment and the distal end segment;
Including an operation method.
Dε(i+1)=Dε(i)+Db ε(i)
であり、
式中、Dが、前記セグメントの前記直径であり、Dbが、前記枝の直径であり、εが、指数である、請求項1に記載の作動方法。 The power law is as follows:
D ε (i + 1) = D ε (i) + D b ε (i)
And
Wherein, D is the said diameter of the segment, D b is the diameter of the branch, epsilon is a index, method of operation according to claim 1.
前記血管のための画像データを有するプロセッサ、
を含み、前記プロセッサは、以下のステップ:
前記血管を複数のセグメントに分割し、各セグメントを、前記血管の枝間の空間として定義するステップ;
実質的に疾患を有しないと思われる出発点を選択するステップ;
最大径となる前記出発セグメントの直径を定義するステップ;
べき法則に従い、次に隣接するセグメントの最大径を計算するステップ;
次に隣接するセグメントの実際の直径を測定するステップ;
どちらの直径がより大きいかに応じて、前記計算された最大径または前記測定された最大径のいずれかを選択するステップ;
前記選択された最大径を使用して、次のセグメントの最大径を見つけるステップ;および
各セグメントが検査されるまで反復して続けるステップ;および
結果を表示して、ユーザが、近位端セグメントおよび遠位端セグメントの直径に応じて、ステントを選択することを可能にするステップ、
を有するプログラムを実行する、装置。 An apparatus for sizing a stent for positioning in a blood vessel, the apparatus comprising:
A processor having image data for the blood vessel;
The processor includes the following steps:
Dividing the blood vessel into a plurality of segments, each segment being defined as a space between branches of the blood vessel;
Selecting a starting point that appears to be substantially free of disease;
Defining the diameter of the starting segment to be the largest diameter;
Following the power law, then calculating the maximum diameter of the adjacent segment;
Then measuring the actual diameter of adjacent segments;
Selecting either the calculated maximum diameter or the measured maximum diameter depending on which diameter is larger;
Using the selected maximum diameter to find the maximum diameter of the next segment; and continuing iteratively until each segment is examined; and displaying the results so that the user Allowing the stent to be selected according to the diameter of the distal end segment;
An apparatus for executing a program comprising:
Dε(i+1)=Dε(i)+Db ε(i)
により与えられる、べき法則から、セグメントの前記計算された直径を計算し、
式中、Dが、前記セグメントの前記直径であり、Dbが、前記枝の前記直径であり、εが、指数である、
請求項11に記載の装置。 The processor has the following formula:
D ε (i + 1) = D ε (i) + D b ε (i)
Calculate the calculated diameter of the segment from the power law given by
Where D is the diameter of the segment, D b is the diameter of the branch, and ε is an index.
The apparatus of claim 11.
前記装置が、光干渉断層撮影システムにより計測可能な、前記血管の前記断面の距離に応じた、1セットのデータを生じさせ、前記セットは、前記断面に沿った複数の位置で複数の断面エリアを含むこと;
前記装置が、第1軸および第2軸を有する第1パネルを表示し、前記第1パネルは、前記血管の第1の縦画像断面図を含み、ここで、前記第1軸は、直径の値に相当し、ここで、前記第2軸は、前記血管の前記断面に沿った位置に相当すること;および
前記装置が、前記血管の前記断面についての最小内腔面積を表示すること、
を含む、作動方法。 A method of operating a device for displaying a representation of a cross section of a blood vessel, said method of operation being :
Said apparatus, measurable by an optical coherence tomography system, according to the distance of the cross-section of the vessel, 1 causes a set of data, said set comprises a plurality of cross-section at a plurality of locations along the cross-section Including areas;
The apparatus displays a first panel having a first axis and a second axis, the first panel including a first longitudinal image cross-sectional view of the blood vessel, wherein the first axis is The second axis corresponds to a position along the cross-section of the blood vessel; and
The device displays a minimum lumen area for the cross-section of the blood vessel;
Including an operation method.
Applications Claiming Priority (3)
| Application Number | Priority Date | Filing Date | Title |
|---|---|---|---|
| US201261736226P | 2012-12-12 | 2012-12-12 | |
| US61/736,226 | 2012-12-12 | ||
| PCT/US2013/030328 WO2014092755A1 (en) | 2012-12-12 | 2013-03-12 | Method and apparatus for automated determination of a lumen contour of a blood vessel |
Related Child Applications (1)
| Application Number | Title | Priority Date | Filing Date |
|---|---|---|---|
| JP2018088554A Division JP6765393B2 (en) | 2012-12-12 | 2018-05-02 | Methods and devices for automated determination of the lumen contour of blood vessels |
Publications (2)
| Publication Number | Publication Date |
|---|---|
| JP2016508750A JP2016508750A (en) | 2016-03-24 |
| JP6336471B2 true JP6336471B2 (en) | 2018-06-06 |
Family
ID=48096170
Family Applications (3)
| Application Number | Title | Priority Date | Filing Date |
|---|---|---|---|
| JP2015547917A Active JP6336471B2 (en) | 2012-12-12 | 2013-03-12 | Method and apparatus for automated determination of vessel lumen contour |
| JP2018088554A Active JP6765393B2 (en) | 2012-12-12 | 2018-05-02 | Methods and devices for automated determination of the lumen contour of blood vessels |
| JP2020117405A Pending JP2020179196A (en) | 2012-12-12 | 2020-07-07 | Method and apparatus for automated determination of lumen contour of blood vessel |
Family Applications After (2)
| Application Number | Title | Priority Date | Filing Date |
|---|---|---|---|
| JP2018088554A Active JP6765393B2 (en) | 2012-12-12 | 2018-05-02 | Methods and devices for automated determination of the lumen contour of blood vessels |
| JP2020117405A Pending JP2020179196A (en) | 2012-12-12 | 2020-07-07 | Method and apparatus for automated determination of lumen contour of blood vessel |
Country Status (8)
| Country | Link |
|---|---|
| US (1) | US11923067B2 (en) |
| EP (2) | EP3272282A3 (en) |
| JP (3) | JP6336471B2 (en) |
| CN (2) | CN105072980B (en) |
| AU (2) | AU2013360356B2 (en) |
| CA (1) | CA2892810C (en) |
| ES (1) | ES2641487T3 (en) |
| WO (1) | WO2014092755A1 (en) |
Families Citing this family (38)
| Publication number | Priority date | Publication date | Assignee | Title |
|---|---|---|---|---|
| WO2014077870A1 (en) | 2012-11-19 | 2014-05-22 | Lightlab Imaging, Inc. | Multimodel imaging systems, probes and methods |
| US20150305631A1 (en) * | 2014-04-25 | 2015-10-29 | Medtronic, Inc. | Real-Time Relationship Between Geometries of an Instrument and a Structure |
| EP3140757B1 (en) * | 2014-05-05 | 2020-06-24 | Siemens Healthcare GmbH | Method and system for non-invasive functional assessment of coronary artery stenosis using flow computations in models based on diseased patients and hypothetical normal anatomical models |
| WO2016014991A1 (en) * | 2014-07-24 | 2016-01-28 | Lightlab Imaging, Inc. | Stent and vessel visualization and diagnostic systems, devices, and methods |
| JP6669720B2 (en) * | 2015-02-25 | 2020-03-18 | テルモ株式会社 | Image diagnostic apparatus, operating method thereof, program, and computer-readable storage medium |
| ES2913531T3 (en) | 2015-04-16 | 2022-06-02 | Gentuity Llc | Micro-optic probes for neurology |
| US10109058B2 (en) | 2015-05-17 | 2018-10-23 | Lightlab Imaging, Inc. | Intravascular imaging system interfaces and stent detection methods |
| US10222956B2 (en) | 2015-05-17 | 2019-03-05 | Lightlab Imaging, Inc. | Intravascular imaging user interface systems and methods |
| US9996921B2 (en) | 2015-05-17 | 2018-06-12 | LIGHTLAB IMAGING, lNC. | Detection of metal stent struts |
| US10140712B2 (en) | 2015-05-17 | 2018-11-27 | Lightlab Imaging, Inc. | Detection of stent struts relative to side branches |
| US10646198B2 (en) | 2015-05-17 | 2020-05-12 | Lightlab Imaging, Inc. | Intravascular imaging and guide catheter detection methods and systems |
| CN112315427A (en) | 2015-07-25 | 2021-02-05 | 光学实验室成像公司 | Intravascular data visualization method |
| WO2017040484A1 (en) | 2015-08-31 | 2017-03-09 | Gentuity, Llc | Imaging system includes imaging probe and delivery devices |
| CA3005242A1 (en) | 2015-11-18 | 2017-05-26 | Lightlab Imaging, Inc. | Detection of stent struts relative to side branches |
| CN108292433B (en) | 2015-11-23 | 2022-12-27 | 光学实验室成像公司 | Detection and validation of shadows in intravascular images |
| ES2908571T3 (en) | 2016-04-14 | 2022-05-03 | Lightlab Imaging Inc | Identification of branches of a blood vessel |
| ES2854729T3 (en) | 2016-05-16 | 2021-09-22 | Lightlab Imaging Inc | Method and system for the detection of self-expanding endoprosthesis, or stent, absorbable intravascular |
| CN109716446B (en) * | 2016-09-28 | 2023-10-03 | 光学实验室成像公司 | Stent planning system and method using vascular manifestations |
| JP7160935B2 (en) | 2017-11-28 | 2022-10-25 | ジェンテュイティ・リミテッド・ライアビリティ・カンパニー | Imaging system |
| CN108335284B (en) * | 2018-01-09 | 2022-06-28 | 北京理工大学 | Coronary vessel center line matching method and system |
| WO2019175032A1 (en) * | 2018-03-14 | 2019-09-19 | Koninklijke Philips N.V. | Scoring intravascular lesions and stent deployment in medical intraluminal ultrasound imaging |
| JP7325430B2 (en) * | 2018-03-15 | 2023-08-14 | コーニンクレッカ フィリップス エヌ ヴェ | Determination and visualization of anatomical landmarks for intraluminal lesion assessment and treatment planning |
| JP7075371B2 (en) * | 2018-05-03 | 2022-05-25 | キヤノン ユーエスエイ,インコーポレイテッド | Devices, systems, and methods for highlighting areas of interest across multiple imaging modality |
| JP7304367B2 (en) * | 2018-05-29 | 2023-07-06 | ライトラボ・イメージング・インコーポレーテッド | Stent expansion display, system and method |
| CN109009001B (en) * | 2018-07-02 | 2019-07-09 | 博动医学影像科技(上海)有限公司 | Vascular pressure difference modification method, device and equipment |
| US20200129158A1 (en) * | 2018-10-26 | 2020-04-30 | Volcano Corporation | Graphical longitudinal display for intraluminal ultrasound imaging and associated devices, systems, and methods |
| JP2022522960A (en) | 2019-01-13 | 2022-04-21 | ライトラボ・イメージング・インコーポレーテッド | Systems and methods for classifying arterial imaging regions and their features |
| WO2020154904A1 (en) * | 2019-01-29 | 2020-08-06 | 深圳市科曼医疗设备有限公司 | Method for automatically measuring blood vessel diameter in ultrasound image |
| CA3133449A1 (en) * | 2019-03-17 | 2020-09-24 | Lightlab Imaging, Inc. | Arterial imaging and assessment systems and methods and related user interface based-workflows |
| JP7157098B2 (en) * | 2019-10-30 | 2022-10-19 | i-PRO株式会社 | Angioscope system and method for measuring blood vessel diameter |
| CN114901154A (en) * | 2019-12-10 | 2022-08-12 | 皇家飞利浦有限公司 | Intravascular image based vessel diameter determination and associated devices, systems, and methods |
| TWI740600B (en) * | 2020-08-10 | 2021-09-21 | 台灣基督長老教會馬偕醫療財團法人馬偕紀念醫院 | Method for estimating degree of arterial occlusion |
| CN114145733A (en) * | 2020-09-07 | 2022-03-08 | 先健科技(深圳)有限公司 | Measuring device, measuring system and measuring method |
| US20230190227A1 (en) * | 2021-12-16 | 2023-06-22 | Philips Image Guided Therapy Corporation | Plaque burden indication on longitudinal intraluminal image and x-ray image |
| US20240081781A1 (en) * | 2022-09-14 | 2024-03-14 | Boston Scientific Scimed, Inc. | Graphical user interface for intravascular ultrasound stent display |
| US20240086025A1 (en) * | 2022-09-14 | 2024-03-14 | Boston Scientific Scimed, Inc. | Graphical user interface for intravascular ultrasound automated lesion assessment system |
| WO2024071121A1 (en) * | 2022-09-28 | 2024-04-04 | テルモ株式会社 | Computer program, information processing method, and information processing device |
| CN117179894B (en) * | 2023-11-07 | 2024-03-15 | 北京唯迈医疗设备有限公司 | Device, system and storage medium for assisting in selecting and positioning interventional operation support |
Family Cites Families (134)
| Publication number | Priority date | Publication date | Assignee | Title |
|---|---|---|---|---|
| US5477858A (en) | 1986-07-30 | 1995-12-26 | Siemens Medical Systems, Inc. | Ultrasound blood flow/tissue imaging system |
| US5662109A (en) | 1990-12-14 | 1997-09-02 | Hutson; William H. | Method and system for multi-dimensional imaging and analysis for early detection of diseased tissue |
| US5054492A (en) | 1990-12-17 | 1991-10-08 | Cardiovascular Imaging Systems, Inc. | Ultrasonic imaging catheter having rotational image correlation |
| US6564087B1 (en) | 1991-04-29 | 2003-05-13 | Massachusetts Institute Of Technology | Fiber optic needle probes for optical coherence tomography imaging |
| US6111645A (en) | 1991-04-29 | 2000-08-29 | Massachusetts Institute Of Technology | Grating based phase control optical delay line |
| US6501551B1 (en) | 1991-04-29 | 2002-12-31 | Massachusetts Institute Of Technology | Fiber optic imaging endoscope interferometer with at least one faraday rotator |
| US6134003A (en) | 1991-04-29 | 2000-10-17 | Massachusetts Institute Of Technology | Method and apparatus for performing optical measurements using a fiber optic imaging guidewire, catheter or endoscope |
| US5748598A (en) | 1995-12-22 | 1998-05-05 | Massachusetts Institute Of Technology | Apparatus and methods for reading multilayer storage media using short coherence length sources |
| DE69227902T3 (en) | 1991-04-29 | 2010-04-22 | Massachusetts Institute Of Technology, Cambridge | DEVICE FOR OPTICAL IMAGING AND MEASUREMENT |
| US6485413B1 (en) | 1991-04-29 | 2002-11-26 | The General Hospital Corporation | Methods and apparatus for forward-directed optical scanning instruments |
| US5465147A (en) | 1991-04-29 | 1995-11-07 | Massachusetts Institute Of Technology | Method and apparatus for acquiring images using a ccd detector array and no transverse scanner |
| US5956355A (en) | 1991-04-29 | 1999-09-21 | Massachusetts Institute Of Technology | Method and apparatus for performing optical measurements using a rapidly frequency-tuned laser |
| US5325449A (en) | 1992-05-15 | 1994-06-28 | David Sarnoff Research Center, Inc. | Method for fusing images and apparatus therefor |
| US5509093A (en) | 1993-10-13 | 1996-04-16 | Micron Optics, Inc. | Temperature compensated fiber fabry-perot filters |
| US5531227A (en) | 1994-01-28 | 1996-07-02 | Schneider Medical Technologies, Inc. | Imaging device and method |
| US5797849A (en) | 1995-03-28 | 1998-08-25 | Sonometrics Corporation | Method for carrying out a medical procedure using a three-dimensional tracking and imaging system |
| US5619368A (en) | 1995-05-16 | 1997-04-08 | Massachusetts Inst. Of Technology | Optical frequency shifter |
| WO1997001167A1 (en) | 1995-06-21 | 1997-01-09 | Massachusetts Institute Of Technology | Apparatus and method for accessing data on multilayered optical media |
| US5810007A (en) | 1995-07-26 | 1998-09-22 | Associates Of The Joint Center For Radiation Therapy, Inc. | Ultrasound localization and image fusion for the treatment of prostate cancer |
| US5771895A (en) | 1996-02-12 | 1998-06-30 | Slager; Cornelis J. | Catheter for obtaining three-dimensional reconstruction of a vascular lumen and wall |
| US6148095A (en) | 1997-09-08 | 2000-11-14 | University Of Iowa Research Foundation | Apparatus and method for determining three-dimensional representations of tortuous vessels |
| US5989189A (en) | 1997-10-24 | 1999-11-23 | Mentor Corporation | Ophthalmic ultrasound imaging |
| US20020161351A1 (en) | 1998-09-01 | 2002-10-31 | Samson Wilfred J. | Method and apparatus for treating acute myocardial infarction with selective hypothermic perfusion |
| US6191862B1 (en) | 1999-01-20 | 2001-02-20 | Lightlab Imaging, Llc | Methods and apparatus for high speed longitudinal scanning in imaging systems |
| US6385332B1 (en) | 1999-02-19 | 2002-05-07 | The John P. Roberts Research Institute | Automated segmentation method for 3-dimensional ultrasound |
| US6471656B1 (en) | 1999-06-25 | 2002-10-29 | Florence Medical Ltd | Method and system for pressure based measurements of CFR and additional clinical hemodynamic parameters |
| US6381350B1 (en) | 1999-07-02 | 2002-04-30 | The Cleveland Clinic Foundation | Intravascular ultrasonic analysis using active contour method and system |
| US6445939B1 (en) | 1999-08-09 | 2002-09-03 | Lightlab Imaging, Llc | Ultra-small optical probes, imaging optics, and methods for using same |
| US6785409B1 (en) | 2000-10-24 | 2004-08-31 | Koninklijke Philips Electronics, N.V. | Segmentation method and apparatus for medical images using diffusion propagation, pixel classification, and mathematical morphology |
| AU2002230842A1 (en) | 2000-10-30 | 2002-05-15 | The General Hospital Corporation | Optical methods and systems for tissue analysis |
| US20020115931A1 (en) | 2001-02-21 | 2002-08-22 | Strauss H. William | Localizing intravascular lesions on anatomic images |
| US6768756B2 (en) | 2001-03-12 | 2004-07-27 | Axsun Technologies, Inc. | MEMS membrane with integral mirror/lens |
| US6570659B2 (en) | 2001-03-16 | 2003-05-27 | Lightlab Imaging, Llc | Broadband light source system and method and light source combiner |
| US6552796B2 (en) | 2001-04-06 | 2003-04-22 | Lightlab Imaging, Llc | Apparatus and method for selective data collection and signal to noise ratio enhancement using optical coherence tomography |
| US6585660B2 (en) | 2001-05-18 | 2003-07-01 | Jomed Inc. | Signal conditioning device for interfacing intravascular sensors having varying operational characteristics to a physiology monitor |
| US6697667B1 (en) | 2001-05-31 | 2004-02-24 | Advanced Cardiovascular Systems, Inc. | Apparatus and method for locating coronary sinus |
| US7532920B1 (en) | 2001-05-31 | 2009-05-12 | Advanced Cardiovascular Systems, Inc. | Guidewire with optical fiber |
| US6706004B2 (en) | 2001-05-31 | 2004-03-16 | Infraredx, Inc. | Balloon catheter |
| US7329223B1 (en) | 2001-05-31 | 2008-02-12 | Abbott Cardiovascular Systems Inc. | Catheter with optical fiber sensor |
| US6716178B1 (en) | 2001-05-31 | 2004-04-06 | Advanced Cardiovascular Systems, Inc. | Apparatus and method for performing thermal and laser doppler velocimetry measurements |
| US6879851B2 (en) | 2001-06-07 | 2005-04-12 | Lightlab Imaging, Llc | Fiber optic endoscopic gastrointestinal probe |
| US6947040B2 (en) | 2001-10-23 | 2005-09-20 | Siemens Corporate Research, Inc. | Vessel detection by mean shift based ray propagation |
| US6868736B2 (en) | 2002-02-22 | 2005-03-22 | Sentec Corporation | Ultra-miniature optical pressure sensing system |
| US7937660B2 (en) * | 2002-04-19 | 2011-05-03 | Medtronic Vascular, Inc. | Computer-based methods and structures for stent-graft selection |
| US7134994B2 (en) | 2002-05-20 | 2006-11-14 | Volcano Corporation | Multipurpose host system for invasive cardiovascular diagnostic measurement acquisition and display |
| US6891984B2 (en) | 2002-07-25 | 2005-05-10 | Lightlab Imaging, Llc | Scanning miniature optical probes with optical distortion correction and rotational control |
| US7359554B2 (en) | 2002-08-26 | 2008-04-15 | Cleveland Clinic Foundation | System and method for identifying a vascular border |
| EP1593087A4 (en) | 2003-01-30 | 2006-10-04 | Chase Medical Lp | A method and system for image processing and contour assessment |
| US8465452B2 (en) * | 2003-02-21 | 2013-06-18 | 3Dt Holdings, Llc | Devices, systems, and methods for removing stenotic lesions from vessels |
| JP2006518623A (en) | 2003-02-25 | 2006-08-17 | コーニンクレッカ フィリップス エレクトロニクス エヌ ヴィ | Intravascular imaging |
| US20100076320A1 (en) | 2003-04-25 | 2010-03-25 | Lightlab Imaging, Llc | Flush catheter with flow directing sheath |
| US7241286B2 (en) | 2003-04-25 | 2007-07-10 | Lightlab Imaging, Llc | Flush catheter with flow directing sheath |
| US7998188B2 (en) * | 2003-04-28 | 2011-08-16 | Kips Bay Medical, Inc. | Compliant blood vessel graft |
| DE10325298B4 (en) | 2003-06-04 | 2007-07-05 | Siemens Ag | Method and device for detecting the roughness of vessels |
| KR101384553B1 (en) | 2003-10-27 | 2014-04-11 | 더 제너럴 하스피탈 코포레이션 | Method and apparatus for performing optical imaging using frequency-domain interferometry |
| CA2449080A1 (en) | 2003-11-13 | 2005-05-13 | Centre Hospitalier De L'universite De Montreal - Chum | Apparatus and method for intravascular ultrasound image segmentation: a fast-marching method |
| JP4602993B2 (en) | 2004-01-16 | 2010-12-22 | ボストン サイエンティフィック リミテッド | Method and apparatus for medical imaging |
| US20050238067A1 (en) | 2004-04-26 | 2005-10-27 | Choi Youngmin A | Simple fiber optic cavity |
| US7397935B2 (en) | 2004-05-10 | 2008-07-08 | Mediguide Ltd. | Method for segmentation of IVUS image sequences |
| EP2272421A1 (en) | 2004-08-24 | 2011-01-12 | The General Hospital Corporation | Method and apparatus for imaging of vessel segments |
| WO2006037001A1 (en) | 2004-09-24 | 2006-04-06 | Lightlab Imaging, Inc. | Fluid occluding devices and methods |
| US8983582B2 (en) | 2004-12-20 | 2015-03-17 | Advanced Cardiovascular Systems, Inc. | Methods and apparatuses for positioning within an internal channel |
| EP1835855B1 (en) | 2005-01-11 | 2017-04-05 | Volcano Corporation | Vascular image co-registration |
| EP2264841B1 (en) | 2005-01-20 | 2016-01-20 | Massachusetts Institute of Technology (MIT) | Mode locking methods and apparatus |
| US8315282B2 (en) | 2005-01-20 | 2012-11-20 | Massachusetts Institute Of Technology | Fourier domain mode locking: method and apparatus for control and improved performance |
| WO2006079100A2 (en) | 2005-01-24 | 2006-07-27 | Thorlabs, Inc. | Compact multimode laser with rapid wavelength scanning |
| US8054075B2 (en) | 2005-02-03 | 2011-11-08 | The Johns Hopkins University | Method for magnetic resonance imaging using inversion recovery with on-resonant water suppression including MRI systems and software embodying same |
| EP1850735A2 (en) | 2005-02-10 | 2007-11-07 | Lightlab Imaging, Inc. | Optical coherence tomography apparatus and methods |
| US7892177B2 (en) | 2005-02-28 | 2011-02-22 | Scimed Life Systems, Inc. | Systems and methods for estimating the length and position of a stent to be applied within a patient |
| US7415049B2 (en) | 2005-03-28 | 2008-08-19 | Axsun Technologies, Inc. | Laser with tilted multi spatial mode resonator tuning element |
| CN1305448C (en) * | 2005-04-08 | 2007-03-21 | 北京思创贯宇科技开发有限公司 | Method and system for positioning blood vessel support and selecting support before operation |
| WO2007002685A2 (en) | 2005-06-24 | 2007-01-04 | Volcano Corporation | Co-registration of graphical image data representing three-dimensional vascular features |
| DE102005032961A1 (en) | 2005-07-14 | 2007-01-18 | Siemens Ag | Method and device for generating an image by means of optical coherence tomography |
| EP1937137B1 (en) | 2005-09-29 | 2022-06-15 | General Hospital Corporation | Method and apparatus for optical imaging via spectral encoding |
| US7450241B2 (en) | 2005-09-30 | 2008-11-11 | Infraredx, Inc. | Detecting vulnerable plaque |
| WO2007047457A2 (en) | 2005-10-13 | 2007-04-26 | Volcano Corporation | Component-based catheter lab intravascular ultrasound system |
| US7697740B2 (en) | 2005-10-21 | 2010-04-13 | Kabushiki Kaisha Toshiba | Medical image processing system and medical image processing method |
| US7729746B2 (en) | 2005-11-04 | 2010-06-01 | Siemens Aktiengesellschaft | Three-dimensional co-registration between intravascular and angiographic data |
| WO2007061769A2 (en) | 2005-11-18 | 2007-05-31 | Duke University | Method and system of coregistrating optical coherence tomography (oct) with other clinical tests |
| US7801343B2 (en) | 2005-11-29 | 2010-09-21 | Siemens Medical Solutions Usa, Inc. | Method and apparatus for inner wall extraction and stent strut detection using intravascular optical coherence tomography imaging |
| US7650179B2 (en) | 2005-12-09 | 2010-01-19 | Siemens Aktiengesellschaft | Computerized workflow method for stent planning and stenting procedure |
| US8184367B2 (en) * | 2006-02-15 | 2012-05-22 | University Of Central Florida Research Foundation | Dynamically focused optical instrument |
| US7619646B2 (en) | 2006-03-09 | 2009-11-17 | Visicon Inspection Technologies Llc | System and method to illuminate and image the inside diameter of a stent |
| WO2007109771A2 (en) | 2006-03-22 | 2007-09-27 | Volcano Corporation | Automated lesion analysis based upon automatic plaque characterization according to a classification criterion |
| US7785286B2 (en) | 2006-03-30 | 2010-08-31 | Volcano Corporation | Method and system for imaging, diagnosing, and/or treating an area of interest in a patient's body |
| CN1871998A (en) * | 2006-04-20 | 2006-12-06 | 北京思创贯宇科技开发有限公司 | Method and system for reconstructing 3 D blood vessels and posting virtual bracket |
| US7831078B2 (en) | 2006-07-24 | 2010-11-09 | Siemens Medical Solutions Usa, Inc. | System and method for statistical shape model based segmentation of intravascular ultrasound and optical coherence tomography images |
| US8029447B2 (en) | 2006-10-10 | 2011-10-04 | Volcano Corporation | Multipurpose host system for invasive cardiovascular diagnostic measurement acquisition including an enhanced dynamically configured graphical display |
| US8223143B2 (en) | 2006-10-27 | 2012-07-17 | Carl Zeiss Meditec, Inc. | User interface for efficiently displaying relevant OCT imaging data |
| WO2008057573A2 (en) | 2006-11-08 | 2008-05-15 | Lightlab Imaging, Inc. | Opto-acoustic imaging devices and methods |
| ES2534572T3 (en) | 2007-01-10 | 2015-04-24 | Lightlab Imaging, Inc. | Methods and apparatus for scanning optical coherence tomography |
| US20110282586A1 (en) * | 2007-01-23 | 2011-11-17 | Kassab Ghassan S | Systems and methods to determine optimal diameters of vessel segments in bifurcation |
| WO2008127732A2 (en) | 2007-04-12 | 2008-10-23 | The General Hospital Corporation | Biomimetic vascular network and devices using the same |
| US8582934B2 (en) | 2007-11-12 | 2013-11-12 | Lightlab Imaging, Inc. | Miniature optical elements for fiber-optic beam shaping |
| US7813609B2 (en) | 2007-11-12 | 2010-10-12 | Lightlab Imaging, Inc. | Imaging catheter with integrated reference reflector |
| JP5002429B2 (en) | 2007-11-20 | 2012-08-15 | テルモ株式会社 | Optical coherence tomography diagnostic equipment |
| US8983580B2 (en) | 2008-01-18 | 2015-03-17 | The Board Of Trustees Of The University Of Illinois | Low-coherence interferometry and optical coherence tomography for image-guided surgical treatment of solid tumors |
| WO2009097527A1 (en) | 2008-01-30 | 2009-08-06 | Transoma Medical, Inc. | Minimally invasive physiologic parameter recorder and introducer system |
| US9480826B2 (en) | 2008-03-21 | 2016-11-01 | Cagent Vascular, Llc | Intravascular device |
| US20110190586A1 (en) | 2008-03-28 | 2011-08-04 | Volcano Corporation | Methods and systems for intravascular imaging and flushing |
| CN102046071B (en) | 2008-06-02 | 2013-11-06 | 光学实验室成像公司 | Quantitative methods for obtaining tissue characteristics from optical coherence tomography images |
| DE102008045634A1 (en) | 2008-09-03 | 2010-03-04 | Ludwig-Maximilians-Universität München | Wavelength tunable light source |
| US8478387B2 (en) | 2008-10-14 | 2013-07-02 | Lightlab Imaging, Inc. | Methods for stent strut detection and related measurement and display using optical coherence tomography |
| CN101493940B (en) * | 2009-02-27 | 2011-02-16 | 东南大学 | Vascular parameter measurement method in medicine image based on elastic pellet dynamic balance |
| US8909323B2 (en) | 2009-08-06 | 2014-12-09 | Siemens Medical Solutions Usa, Inc. | System for processing angiography and ultrasound image data |
| US20180344174A9 (en) | 2009-09-23 | 2018-12-06 | Lightlab Imaging, Inc. | Lumen Morphology and Vascular Resistance Measurements Data Collection Systems, Apparatus and Methods |
| JP5721721B2 (en) * | 2009-09-23 | 2015-05-20 | ライトラボ・イメージング・インコーポレーテッド | Luminal morphology and vascular resistance measurement data collection system, apparatus and method |
| US8412312B2 (en) | 2009-09-23 | 2013-04-02 | Lightlab Imaging, Inc. | Apparatus, systems, and methods of in-vivo blood clearing in a lumen |
| US8206377B2 (en) | 2009-12-22 | 2012-06-26 | Lightlab Imaging, Inc. | Torque limiter for an OCT catheter |
| US8926590B2 (en) | 2009-12-22 | 2015-01-06 | Lightlab Imaging, Inc. | Torque limiter for an OCT catheter |
| US8478384B2 (en) | 2010-01-19 | 2013-07-02 | Lightlab Imaging, Inc. | Intravascular optical coherence tomography system with pressure monitoring interface and accessories |
| US8948613B2 (en) | 2010-03-17 | 2015-02-03 | Lightlab Imaging, Inc. | Intensity noise reduction methods and apparatus for interferometric sensing and imaging systems |
| US20110257545A1 (en) * | 2010-04-20 | 2011-10-20 | Suri Jasjit S | Imaging based symptomatic classification and cardiovascular stroke risk score estimation |
| US8750615B2 (en) | 2010-08-02 | 2014-06-10 | Case Western Reserve University | Segmentation and quantification for intravascular optical coherence tomography images |
| CN107669295B (en) * | 2010-09-10 | 2021-04-20 | 阿西斯特医疗系统有限公司 | Apparatus and method for medical image search |
| JP2012157384A (en) | 2011-01-28 | 2012-08-23 | Fujifilm Corp | Diagnosis support apparatus, diagnosis support method, lesion detection apparatus, and lesion detection method |
| US8582619B2 (en) | 2011-03-15 | 2013-11-12 | Lightlab Imaging, Inc. | Methods, systems, and devices for timing control in electromagnetic radiation sources |
| JP2012200532A (en) * | 2011-03-28 | 2012-10-22 | Terumo Corp | Imaging apparatus for diagnosis and display method |
| US9164240B2 (en) | 2011-03-31 | 2015-10-20 | Lightlab Imaging, Inc. | Optical buffering methods, apparatus, and systems for increasing the repetition rate of tunable light sources |
| EP2713858A1 (en) | 2011-05-27 | 2014-04-09 | Lightlab Imaging, Inc. | Optical coherence tomography and pressure based systems and methods |
| AU2012262258B2 (en) | 2011-05-31 | 2015-11-26 | Lightlab Imaging, Inc. | Multimodal imaging system, apparatus, and methods |
| EP2726136A1 (en) | 2011-06-30 | 2014-05-07 | Lightlab Imaging, Inc. | Catheter with flush valve and related systems and methods |
| US8582109B1 (en) | 2011-08-01 | 2013-11-12 | Lightlab Imaging, Inc. | Swept mode-hopping laser system, methods, and devices for frequency-domain optical coherence tomography |
| WO2013019840A1 (en) | 2011-08-03 | 2013-02-07 | Lightlab Imaging, Inc. | Systems, methods and apparatus for determining a fractional flow reserve |
| RU2014110702A (en) | 2011-08-20 | 2015-09-27 | Волкано Корпорэйшн | DEVICES, SYSTEMS AND METHODS OF VISUAL DISPLAY OF A VESSEL AND EVALUATION OF TREATMENT OPTIONS |
| US20130051728A1 (en) | 2011-08-31 | 2013-02-28 | Lightlab Imaging, Inc. | Optical Imaging Probes and Related Methods |
| US8581643B1 (en) | 2011-10-28 | 2013-11-12 | Lightlab Imaging, Inc. | Phase-lock loop-based clocking system, methods and apparatus |
| US8953911B1 (en) | 2011-10-28 | 2015-02-10 | Lightlab Imaging, Inc. | Spectroscopic imaging probes, devices, and methods |
| US8831321B1 (en) | 2011-11-07 | 2014-09-09 | Lightlab Imaging, Inc. | Side branch detection methods, systems and devices |
| US20140024931A1 (en) | 2012-07-20 | 2014-01-23 | Lightlab Imaging, Inc. | Data Encoders for Medical Devices and Related Methods |
| US8687201B2 (en) | 2012-08-31 | 2014-04-01 | Lightlab Imaging, Inc. | Optical coherence tomography control systems and methods |
| US20140142427A1 (en) | 2012-11-16 | 2014-05-22 | Lightlab Imaging, Inc. | Automated Fluid Delivery Catheter and System |
| WO2014077870A1 (en) | 2012-11-19 | 2014-05-22 | Lightlab Imaging, Inc. | Multimodel imaging systems, probes and methods |
| US9702762B2 (en) | 2013-03-15 | 2017-07-11 | Lightlab Imaging, Inc. | Calibration and image processing devices, methods, and systems |
-
2013
- 2013-03-12 CN CN201380072680.1A patent/CN105072980B/en active Active
- 2013-03-12 US US14/115,527 patent/US11923067B2/en active Active
- 2013-03-12 EP EP17183053.2A patent/EP3272282A3/en active Pending
- 2013-03-12 AU AU2013360356A patent/AU2013360356B2/en active Active
- 2013-03-12 WO PCT/US2013/030328 patent/WO2014092755A1/en active Application Filing
- 2013-03-12 ES ES13716492.7T patent/ES2641487T3/en active Active
- 2013-03-12 CA CA2892810A patent/CA2892810C/en active Active
- 2013-03-12 CN CN201810361340.5A patent/CN108836280B/en active Active
- 2013-03-12 JP JP2015547917A patent/JP6336471B2/en active Active
- 2013-03-12 EP EP13716492.7A patent/EP2931115B1/en active Active
-
2017
- 2017-07-17 AU AU2017206136A patent/AU2017206136B2/en active Active
-
2018
- 2018-05-02 JP JP2018088554A patent/JP6765393B2/en active Active
-
2020
- 2020-07-07 JP JP2020117405A patent/JP2020179196A/en active Pending
Also Published As
| Publication number | Publication date |
|---|---|
| EP3272282A3 (en) | 2018-05-02 |
| CN108836280A (en) | 2018-11-20 |
| CN105072980A (en) | 2015-11-18 |
| CN108836280B (en) | 2021-04-30 |
| WO2014092755A1 (en) | 2014-06-19 |
| EP2931115A1 (en) | 2015-10-21 |
| AU2017206136B2 (en) | 2019-10-31 |
| CA2892810C (en) | 2020-07-07 |
| US20150297373A1 (en) | 2015-10-22 |
| JP2016508750A (en) | 2016-03-24 |
| EP2931115B1 (en) | 2017-07-26 |
| AU2017206136A1 (en) | 2017-08-03 |
| JP2018140207A (en) | 2018-09-13 |
| CA2892810A1 (en) | 2014-06-19 |
| EP3272282A2 (en) | 2018-01-24 |
| JP6765393B2 (en) | 2020-10-07 |
| CN105072980B (en) | 2018-05-04 |
| JP2020179196A (en) | 2020-11-05 |
| US11923067B2 (en) | 2024-03-05 |
| AU2013360356A1 (en) | 2015-06-11 |
| ES2641487T3 (en) | 2017-11-10 |
| AU2013360356B2 (en) | 2017-04-20 |
Similar Documents
| Publication | Publication Date | Title |
|---|---|---|
| JP6336471B2 (en) | Method and apparatus for automated determination of vessel lumen contour | |
| Ughi et al. | Automatic segmentation of in-vivo intra-coronary optical coherence tomography images to assess stent strut apposition and coverage | |
| CN108135488B (en) | Intravascular imaging system and method for determining cross-sectional view angle of side branch | |
| JP5778579B2 (en) | Stent strut detection using optical coherence tomography and related methods for measurement and display | |
| US8831321B1 (en) | Side branch detection methods, systems and devices | |
| JP2024054120A (en) | System and method for displaying stent strut coverage in a vessel - Patents.com | |
| JP2015231526A (en) | Quantitative method for obtaining tissue characteristics from optical coherence tomography image | |
| CN114424290B (en) | Apparatus and method for providing a longitudinal display of coronary calcium loading | |
| Zahnd et al. | Quantification of fibrous cap thickness in intracoronary optical coherence tomography with a contour segmentation method based on dynamic programming | |
| WO2014137353A1 (en) | Stent visualization and malapposition detection systems, devices, and methods | |
| Shang et al. | Validation of semiautomated and locally resolved aortic wall thickness measurements from computed tomography | |
| Cheimariotis et al. | ARCOCT: Automatic detection of lumen border in intravascular OCT images | |
| WO2020222004A1 (en) | Method and apparatus for analysing intracoronary images | |
| JP2014158619A (en) | Detection data processing device and image display device | |
| Dubuisson et al. | Automated peroperative assessment of stents apposition from OCT pullbacks | |
| Wang et al. | Automatic segmentation of vessel lumen in intravascular optical coherence tomography images | |
| US11779277B2 (en) | Systems and methods for endovascular device detection and apposition measurement | |
| Ughi et al. | Automated volumetric stent analysis of in-vivo intracoronary Optical Coherence Tomography three-dimensional datasets | |
| Real et al. | Enhanced delineation of degradation in aortic walls through OCT |
Legal Events
| Date | Code | Title | Description |
|---|---|---|---|
| A621 | Written request for application examination |
Free format text: JAPANESE INTERMEDIATE CODE: A621 Effective date: 20160224 |
|
| A977 | Report on retrieval |
Free format text: JAPANESE INTERMEDIATE CODE: A971007 Effective date: 20161216 |
|
| A131 | Notification of reasons for refusal |
Free format text: JAPANESE INTERMEDIATE CODE: A131 Effective date: 20170104 |
|
| A601 | Written request for extension of time |
Free format text: JAPANESE INTERMEDIATE CODE: A601 Effective date: 20170403 |
|
| A521 | Request for written amendment filed |
Free format text: JAPANESE INTERMEDIATE CODE: A523 Effective date: 20170525 |
|
| A131 | Notification of reasons for refusal |
Free format text: JAPANESE INTERMEDIATE CODE: A131 Effective date: 20170919 |
|
| A601 | Written request for extension of time |
Free format text: JAPANESE INTERMEDIATE CODE: A601 Effective date: 20171213 |
|
| A601 | Written request for extension of time |
Free format text: JAPANESE INTERMEDIATE CODE: A601 Effective date: 20180213 |
|
| A521 | Request for written amendment filed |
Free format text: JAPANESE INTERMEDIATE CODE: A523 Effective date: 20180316 |
|
| TRDD | Decision of grant or rejection written | ||
| A01 | Written decision to grant a patent or to grant a registration (utility model) |
Free format text: JAPANESE INTERMEDIATE CODE: A01 Effective date: 20180403 |
|
| A61 | First payment of annual fees (during grant procedure) |
Free format text: JAPANESE INTERMEDIATE CODE: A61 Effective date: 20180502 |
|
| R150 | Certificate of patent or registration of utility model |
Ref document number: 6336471 Country of ref document: JP Free format text: JAPANESE INTERMEDIATE CODE: R150 |
|
| R250 | Receipt of annual fees |
Free format text: JAPANESE INTERMEDIATE CODE: R250 |
|
| R250 | Receipt of annual fees |
Free format text: JAPANESE INTERMEDIATE CODE: R250 |
|
| RD02 | Notification of acceptance of power of attorney |
Free format text: JAPANESE INTERMEDIATE CODE: R3D02 |
|
| R250 | Receipt of annual fees |
Free format text: JAPANESE INTERMEDIATE CODE: R250 |