JP6234185B2 - Apparatus, method for controlling apparatus, and program - Google Patents
Apparatus, method for controlling apparatus, and program Download PDFInfo
- Publication number
- JP6234185B2 JP6234185B2 JP2013241946A JP2013241946A JP6234185B2 JP 6234185 B2 JP6234185 B2 JP 6234185B2 JP 2013241946 A JP2013241946 A JP 2013241946A JP 2013241946 A JP2013241946 A JP 2013241946A JP 6234185 B2 JP6234185 B2 JP 6234185B2
- Authority
- JP
- Japan
- Prior art keywords
- image data
- image
- reading
- abnormality
- chart
- Prior art date
- Legal status (The legal status is an assumption and is not a legal conclusion. Google has not performed a legal analysis and makes no representation as to the accuracy of the status listed.)
- Expired - Fee Related
Links
Images


Classifications
-
- H—ELECTRICITY
- H04—ELECTRIC COMMUNICATION TECHNIQUE
- H04N—PICTORIAL COMMUNICATION, e.g. TELEVISION
- H04N1/00—Scanning, transmission or reproduction of documents or the like, e.g. facsimile transmission; Details thereof
- H04N1/00002—Diagnosis, testing or measuring; Detecting, analysing or monitoring not otherwise provided for
- H04N1/00005—Diagnosis, testing or measuring; Detecting, analysing or monitoring not otherwise provided for relating to image data
-
- H—ELECTRICITY
- H04—ELECTRIC COMMUNICATION TECHNIQUE
- H04N—PICTORIAL COMMUNICATION, e.g. TELEVISION
- H04N1/00—Scanning, transmission or reproduction of documents or the like, e.g. facsimile transmission; Details thereof
- H04N1/00002—Diagnosis, testing or measuring; Detecting, analysing or monitoring not otherwise provided for
- H04N1/00007—Diagnosis, testing or measuring; Detecting, analysing or monitoring not otherwise provided for relating to particular apparatus or devices
- H04N1/00013—Reading apparatus
-
- H—ELECTRICITY
- H04—ELECTRIC COMMUNICATION TECHNIQUE
- H04N—PICTORIAL COMMUNICATION, e.g. TELEVISION
- H04N1/00—Scanning, transmission or reproduction of documents or the like, e.g. facsimile transmission; Details thereof
- H04N1/00002—Diagnosis, testing or measuring; Detecting, analysing or monitoring not otherwise provided for
- H04N1/00007—Diagnosis, testing or measuring; Detecting, analysing or monitoring not otherwise provided for relating to particular apparatus or devices
- H04N1/00015—Reproducing apparatus
-
- H—ELECTRICITY
- H04—ELECTRIC COMMUNICATION TECHNIQUE
- H04N—PICTORIAL COMMUNICATION, e.g. TELEVISION
- H04N1/00—Scanning, transmission or reproduction of documents or the like, e.g. facsimile transmission; Details thereof
- H04N1/00002—Diagnosis, testing or measuring; Detecting, analysing or monitoring not otherwise provided for
- H04N1/00007—Diagnosis, testing or measuring; Detecting, analysing or monitoring not otherwise provided for relating to particular apparatus or devices
- H04N1/00023—Colour systems
-
- H—ELECTRICITY
- H04—ELECTRIC COMMUNICATION TECHNIQUE
- H04N—PICTORIAL COMMUNICATION, e.g. TELEVISION
- H04N1/00—Scanning, transmission or reproduction of documents or the like, e.g. facsimile transmission; Details thereof
- H04N1/00002—Diagnosis, testing or measuring; Detecting, analysing or monitoring not otherwise provided for
- H04N1/00026—Methods therefor
- H04N1/00034—Measuring, i.e. determining a quantity by comparison with a standard
-
- H—ELECTRICITY
- H04—ELECTRIC COMMUNICATION TECHNIQUE
- H04N—PICTORIAL COMMUNICATION, e.g. TELEVISION
- H04N1/00—Scanning, transmission or reproduction of documents or the like, e.g. facsimile transmission; Details thereof
- H04N1/00002—Diagnosis, testing or measuring; Detecting, analysing or monitoring not otherwise provided for
- H04N1/00026—Methods therefor
- H04N1/00045—Methods therefor using a reference pattern designed for the purpose, e.g. a test chart
-
- H—ELECTRICITY
- H04—ELECTRIC COMMUNICATION TECHNIQUE
- H04N—PICTORIAL COMMUNICATION, e.g. TELEVISION
- H04N1/00—Scanning, transmission or reproduction of documents or the like, e.g. facsimile transmission; Details thereof
- H04N1/00002—Diagnosis, testing or measuring; Detecting, analysing or monitoring not otherwise provided for
- H04N1/00026—Methods therefor
- H04N1/00053—Methods therefor out of service, i.e. outside of normal operation
-
- H—ELECTRICITY
- H04—ELECTRIC COMMUNICATION TECHNIQUE
- H04N—PICTORIAL COMMUNICATION, e.g. TELEVISION
- H04N1/00—Scanning, transmission or reproduction of documents or the like, e.g. facsimile transmission; Details thereof
- H04N1/00002—Diagnosis, testing or measuring; Detecting, analysing or monitoring not otherwise provided for
- H04N1/00026—Methods therefor
- H04N1/00063—Methods therefor using at least a part of the apparatus itself, e.g. self-testing
-
- H—ELECTRICITY
- H04—ELECTRIC COMMUNICATION TECHNIQUE
- H04N—PICTORIAL COMMUNICATION, e.g. TELEVISION
- H04N1/00—Scanning, transmission or reproduction of documents or the like, e.g. facsimile transmission; Details thereof
- H04N1/00002—Diagnosis, testing or measuring; Detecting, analysing or monitoring not otherwise provided for
- H04N1/00026—Methods therefor
- H04N1/00068—Calculating or estimating
-
- H—ELECTRICITY
- H04—ELECTRIC COMMUNICATION TECHNIQUE
- H04N—PICTORIAL COMMUNICATION, e.g. TELEVISION
- H04N2201/00—Indexing scheme relating to scanning, transmission or reproduction of documents or the like, and to details thereof
- H04N2201/0077—Types of the still picture apparatus
- H04N2201/0094—Multifunctional device, i.e. a device capable of all of reading, reproducing, copying, facsimile transception, file transception
Landscapes
- Engineering & Computer Science (AREA)
- Health & Medical Sciences (AREA)
- Biomedical Technology (AREA)
- General Health & Medical Sciences (AREA)
- Multimedia (AREA)
- Signal Processing (AREA)
- Control Or Security For Electrophotography (AREA)
- Facsimiles In General (AREA)
- Accessory Devices And Overall Control Thereof (AREA)
Description
本発明はプリンタに異常が発生した際にその原因を推定するための装置及び方法ならびに方法を実行するプログラムに関するものである。 The present invention relates to an apparatus and method for estimating the cause of an abnormality occurring in a printer, and a program for executing the method.
近年電子写真装置の性能向上に伴い印刷機と同等の画質を実現した装置が登場している。印刷機と同様に運用するためには高画質の維持が必須だが、長時間にわたって使用するとプリンタが劣化し、このプリンタから出力される画像において画質面での異常が発生する可能性がある。このような劣化等により「異常画像」が発生したとき、画像を見て異常と気付いたユーザがサービスマンへ連絡し、サービスマンがプリンタの設置場所を訪れて対応するケースが一般的である。このような場合に、劣化等により生じる異常画像の状態をユーザが言葉で表現することは難しく、例えば「ムラがある」といってもムラの発生する方向、頻度、周期等の詳細な情報がわからないとその原因を特定することができない。そのため、ユーザから異常画像の指摘を受けた際にサービスマンがプリンタの設置場所に行き、画質の異常を直接確認する必要があった。そして、サービスマンは確認した異常から故障箇所を予測して関係するサービスパーツを特定し、一度サービスの拠点に戻り、サービスパーツを入手してから再びユーザ先へ行って対応を行っていた。このようなやり取りを行うとサービスマンの移動にコストがかかるだけでなく、対応が終了するまで装置が使えなくなるためダウンタイムが発生し、ユーザの生産性を大きく低下させるという問題があった。 In recent years, with the improvement in performance of electrophotographic apparatuses, apparatuses that have achieved image quality equivalent to that of printing presses have appeared. In order to operate in the same way as a printing press, it is essential to maintain high image quality. However, if the printer is used for a long time, the printer may be deteriorated, and an image quality abnormality may occur in an image output from the printer. When an “abnormal image” occurs due to such deterioration or the like, a user who notices an abnormality by looking at the image contacts a serviceman, and the serviceman visits the place where the printer is installed to respond. In such a case, it is difficult for the user to express the state of the abnormal image caused by deterioration or the like in words. For example, even if “uneven” is present, detailed information such as the direction, frequency, and cycle in which unevenness occurs If you don't know, you can't identify the cause. For this reason, when an abnormal image is pointed out by the user, it is necessary for the service person to go to the place where the printer is installed and directly check the image quality abnormality. Then, the service person predicts the failure location from the confirmed abnormality, identifies the related service part, returns to the service base once, obtains the service part, and goes to the user again to deal with it. If such an exchange is performed, there is a problem that not only the movement of the service person is expensive, but also the apparatus cannot be used until the correspondence is completed, so that downtime occurs and the productivity of the user is greatly reduced.
そこで、特許文献1ではプリンタから画像を出力し、そのスキャン画像を取得し、異常を検出することで「異常画像」の特定を容易にする技術が開示されている。 Therefore, Patent Document 1 discloses a technique that facilitates specifying an “abnormal image” by outputting an image from a printer, acquiring the scanned image, and detecting an abnormality.
しかしながら、先行技術ではスキャン画像を取得する際に、何らかの異常画像を引き起こす原因があると、元々発生していた画像異常の他にさらに画像異常が重畳され、元々プリント画像に発生していた画像異常の検出を妨げる可能性については開示されていない。例えばデジタル複写機等の画像読取装置では、光学系の位置を固定し、自動原稿搬送装置(ADF:auto document feeder)によって原稿を搬送させながら画像を読み取る手法(流し読み方式)がある。 However, in the prior art, when a scan image is acquired, if there is a cause of some abnormal image, in addition to the image abnormality that originally occurred, an image abnormality is further superimposed, and the image abnormality that originally occurred in the print image The possibility of preventing the detection of is not disclosed. For example, in an image reading apparatus such as a digital copying machine, there is a technique (a flow reading method) in which an optical system is fixed and an image is read while an original is conveyed by an automatic document feeder (ADF).
このとき、原稿読み取り位置にゴミや埃が付着した場合又は傷や汚れがついた場合、読み取り光学系機器の位置が固定されているためゴミを読み取り続け、その結果、読み取り画像内に直線のスジが発生することがある。その他にも白板汚れやミラーユニット内のミラー汚れなども考えられる。 At this time, if dust or dirt adheres to the document reading position, or if scratches or dirt are attached, the position of the reading optical system is fixed, and the dust is continuously read. May occur. In addition, white plate dirt and mirror dirt in the mirror unit are also conceivable.
よって、上記の例のようにスキャン画像取得時に読取り系の異常が発生すると、元々発生していたプリント画像の画像異常の発生原因と画像をスキャンする際に発生した異常画像の発生原因との原因の切り分けが困難になる。さらには元々発生していた画像異常の検出の精度を劣化させる可能性がある。 Therefore, if an abnormality in the reading system occurs during scan image acquisition as in the above example, the cause of the image abnormality of the print image that originally occurred and the cause of the abnormality image that occurred when scanning the image It becomes difficult to isolate. Furthermore, there is a possibility of degrading the accuracy of detection of an image abnormality that has occurred originally.
そこで、本発明はスキャン画像を取得する場合に、プリント画像における異常画像に重畳して、画像異常が発生した場合であっても正しく「異常画像」の特定する画像診断システムを提供することを目的とする。 SUMMARY OF THE INVENTION Accordingly, an object of the present invention is to provide an image diagnostic system that correctly identifies an “abnormal image” even when an image abnormality occurs by superimposing it on an abnormal image in a print image when acquiring a scanned image. And
上記課題を解決すべく、本発明の装置は、読み取り手段により画像形成手段により画像が形成されていないチャートを読み取ることで得られる第1の画像データと前記読み取り手段により前記画像形成手段により形成されたチャートを読み取ることで得られる第2の画像データとを取得する取得手段と、前記第1の画像データを用いて前記第2の画像データを変更し、該変更した画像データを解析することで得られる特徴量から前記画像形成手段に発生した異常の原因の推定を行う推定手段と、を有し、前記第1の画像データを解析した結果が、前記読み取り手段に異常が発生したと判断された場合であっても、前記読み取り手段に発生した異常が前記装置に影響を与えないと判断された場合は、前記第2の画像データを変更せず、前記第2の画像データから特徴量を取得することを特徴とする。 In order to solve the above problems, the apparatus of the present invention is formed by the image forming unit with the first image data obtained by reading the chart on which the image is not formed by the image forming unit with the reading unit and the reading unit. Acquisition means for acquiring second image data obtained by reading the chart, and changing the second image data using the first image data, and analyzing the changed image data from the resulting features and estimating means for estimating the cause of the abnormality occurring in the image forming unit, a possess, as a result of analyzing the first image data, abnormality is judged to have occurred in the reading means Even if the second image data is determined not to affect the apparatus, the second image data is not changed and the second image data is not changed. And acquiring a feature quantity from the image data.
本発明によれば、スキャン画像取得時に画像異常が発生した場合であっても、画像を出力する際に発生するプリント画像の画像異常の発生原因と画像をスキャンする際に発生する異常画像の発生原因との原因の切り分けが容易になる。 According to the present invention, even when an image abnormality occurs at the time of scanning image acquisition, the cause of the image abnormality of the print image that occurs when the image is output and the occurrence of the abnormal image that occurs when the image is scanned It becomes easy to distinguish the cause from the cause.
さらにスキャン画像の画像異常が及ぼすプリント画像の画像異常の検出処理への影響を低減し、正しくプリント画像の画像異常を検出することが可能となる。よってサービスマンのコストの削減や異常画像発生後のユーザの生産性低下を軽減することができる。 Furthermore, it is possible to reduce the influence of the image abnormality of the scan image on the detection process of the image abnormality of the print image, and to correctly detect the image abnormality of the print image. Therefore, it is possible to reduce the cost of service personnel and the decrease in user productivity after the occurrence of an abnormal image.
以下、本発明を実施するための形態について図面を用いて説明する。 Hereinafter, embodiments for carrying out the present invention will be described with reference to the drawings.
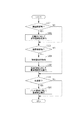
<システム構成図>
図1に本実施例における各画像形成装置の異常画像に関わる情報を主に通信するネットワークシステム構成図を記載する。本システムは画像形成装置101、102、103と画像診断装置110とを備える。画像形成装置101、102、103と画像診断装置110は、それぞれLAN10により相互に通信可能に接続されている。
<System configuration diagram>
FIG. 1 is a configuration diagram of a network system that mainly communicates information related to an abnormal image of each image forming apparatus in the present embodiment. This system includes
本実施例では、画像形成装置101、102、103で発生した異常画像に関する情報を、ネットワークを介して画像診断装置110に送信し、画像診断装置110で解析することで異常画像の原因を特定する。
In the present embodiment, information regarding abnormal images generated in the
<複写機の外観>
図2は、実施例1における画像形成装置の外観例を示す図である。
<Appearance of copier>
FIG. 2 is a diagram illustrating an appearance example of the image forming apparatus according to the first embodiment.
画像読取手段であるスキャナ140は、照明ランプの発光によって原稿上の画像を露光走査して得られた反射光をリニアイメージセンサ(CCDセンサ)に入力することで画像の情報を電気信号に変換する。スキャナ140はさらに電気信号をR、G、B各色からなる輝度信号に変換し、当該輝度信号を画像データとして後述するコントローラ200(図6)に出力する。
A
原稿は、原稿フィーダ141のトレイ142にセットされる。ユーザが操作ユニット160から読み取り開始を指示すると、コントローラ200は、スキャナ140に対して原稿読み取り指示を送る。スキャナ140は、この指示を受けとると原稿フィーダ141のトレイ142から原稿を1枚ずつフィードして原稿の読み取り動作を行う(以降この動作モードを流し読みモードと呼ぶ。)。また、原稿は後述する原稿台ガラス上に置くことで読み取ることもできる。
The document is set on the
プリンタ120は、コントローラ200から受取った画像データを用紙上に形成する画像形成デバイスである。
The
本実施例における画像形成方式は、感光体ドラムや現像器、定着器などを用いた電子写真方式である。これはドラム上へ付着させたトナーを紙へ転写、定着させる方式である。また、プリンタ120は、異なる用紙サイズ又は異なる用紙向きに対応可能な複数の用紙カセット121、122、123を備える。排紙トレイ124には印字後の用紙が排出される。これらスキャナ140やプリンタ120は、劣化や故障が生じた際にスキャン画像やプリント画像に異常が現れる可能性がある。
The image forming method in this embodiment is an electrophotographic method using a photosensitive drum, a developing device, a fixing device, and the like. This is a system in which the toner adhered on the drum is transferred and fixed on paper. The
<画像形成装置−スキャナ部>
図3は、本実施例におけるリニアイメージセンサを用いたスキャナ140の主要構成及び読取動作を示す概略図である。特に図3では原稿フィーダ141を動作させることによって原稿を読み取る“流し読み”の場合の主要構成及び読取動作の概略を示す。
<Image forming apparatus-scanner unit>
FIG. 3 is a schematic diagram showing the main configuration and reading operation of the
図3において、読み取られるべき原稿束100Pはトレイ142上に置かれている。また、原稿搬送方向の下部には、送り出しローラ1411と分離搬送ローラ1412、レジストローラ1413が配置されている。送り出しローラ1411は図示しない駆動源により回転され、トレイ142上に置かれた原稿束100Pを送り出す。次に送り出しローラ1411の下流に配置された分離搬送ローラ1412は搬送された原稿束100Pから最上位の原稿100を分離搬送する。分離搬送ローラ1412の下流に配置されたレジストローラ1413の回転開始は、以降の原稿100の搬送タイミングや画像読取タイミングの基準となる。
In FIG. 3, the
これら送り出しローラ1411、分離搬送ローラ1412、レジストローラ1413を駆動する駆動源は、例えばステッピングモータなどとなる。
A driving source for driving the
レジストローラ1413から排出された原稿100は、案内板1418に沿って進行し、回転する大径の搬送ドラム1415と従動ローラ1416a、1416b、1416cにより狭持され、搬送ドラム1415の外周に沿って搬送される。このとき、原稿100は、一度原稿台ガラス1401の面を通って図3の矢印の方向へ等速で搬送されることとなる。
The
後述する画像読取手段による原稿100の画像読取は、原稿100が原稿台ガラス1401の面を通過する際に行われる。
Image reading of the
画像読取後は、引き続き搬送ドラム1415の外周に沿って搬送され、排紙ローラ1417によって原稿フィーダ141上に排出される。
After the image reading, the image is continuously conveyed along the outer periphery of the
この流し読みモードにおいては、原稿を一定方向に移動させればよいだけなので、大量の原稿を連続して高速に読み取ることが可能となる。 In this flow-reading mode, since it is only necessary to move the document in a certain direction, a large number of documents can be continuously read at a high speed.
次に本実施例における画像読取手段について記載する。流し読みモードにおいて、原稿100は前述したように原稿台ガラス1401の面を通過する。このとき、第1ミラーユニット1409及び第2ミラーユニット1410はモータ1408により移動され、図に示した位置に固定配置されている。よって原稿100は原稿台ガラス1401の面に相対したときに第1ミラーユニット1409内の照明ランプ1402により照射され、その反射光はミラー1403、1404、1405を経て、レンズ1406によりCCDセンサ1407上に結像される。CCDセンサ1407に入力された反射光はセンサによって電気信号に変換され、その画素の電気信号は図示しないA/D変換器によってデジタルデータに変換され、コントローラ200に画素信号として入力される。
Next, image reading means in this embodiment will be described. In the flow-reading mode, the
この方式では棒状の光源を使用し、その長手方向と平行に読み取りラインを設定し、この読み取りラインに対して直角な方向に原稿を搬送する。なお読み取りラインと平行な方向を主走査方向と定義し、読み取りラインと直角な方向(原稿搬送方向)を副走査方向と定義する。 In this method, a rod-shaped light source is used, a reading line is set parallel to the longitudinal direction, and the document is conveyed in a direction perpendicular to the reading line. A direction parallel to the reading line is defined as a main scanning direction, and a direction perpendicular to the reading line (original transport direction) is defined as a sub-scanning direction.
また、上記流し読みモード以外に原稿台ガラス1401上に読み取られるべき原稿を置くことで画像読取を行う方式がある。この方式の場合、ミラー1403、照明ランプ1402を含む第1ミラーユニット1409は速度vで原稿の置かれた原稿台ガラス1401の下を移動する。さらに、ミラー1404、1405を含む第2ミラーユニット1410が速度1/2vで第1ミラーユニット1409と同様の方向に移動することにより、原稿100の前面を走査する。第1ミラーユニット1409及び第2ミラーユニット1410はモータ1408により駆動する。
In addition to the above-described flow reading mode, there is a method of performing image reading by placing a document to be read on the
なお、本実施例の後述する解析チャートのスキャン送信は、この流し読みモードにおいて、原稿の読み取りを行いながら実行される。 Note that the scan transmission of an analysis chart, which will be described later in the present embodiment, is executed while reading a document in this flow reading mode.
<スキャン時の異常画像の発生>
図4は、原稿台ガラス上へのゴミの滞留を例示する図である。本実施形態のような自動原稿搬送装置を備えた画像形成装置において、上述の流し読みモードにて原稿を読み取ると、原稿台ガラス1401上に付着したゴミを読み取ってしまい、読み取り画像にスジが発生する。これは第1ミラーユニット1409と搬送ドラム1415の間の原稿台ガラス1401(図の原稿台ガラス1401と点線の交点)にゴミが滞留することで発生する。このスジはゴミの滞留によって発生するもので原稿に記載された画像ではない。よって原稿内の周囲画素とは相関のないものとなる。
<Generation of abnormal images during scanning>
FIG. 4 is a diagram illustrating the stagnation of dust on the platen glass. In an image forming apparatus equipped with an automatic document feeder as in this embodiment, when a document is read in the above-described flow reading mode, dust adhering to the
次に図5は、原稿台ガラス上にゴミが付着した場合の読み取り画像の例を示す図である。図5は黒スジ(異常画素)の入った画像を示している。黒スジは図に示しているように、流し読み時のゴミの影響で主走査方向のある特定位置にある幅をもって現れ、副走査方向にスジとして伸びる。この場合、後述する異常画像の発生原因を解析するために用いられる解析チャートのスキャンおよびこの解析チャートのスキャンにより得られた画像データの送信処理に対して悪影響を及ぼすことが図から理解できる。 Next, FIG. 5 is a diagram showing an example of a read image when dust adheres to the platen glass. FIG. 5 shows an image containing black streaks (abnormal pixels). As shown in the figure, the black streaks appear with a width at a specific position in the main scanning direction due to the influence of dust during flow reading, and extend as streaks in the sub scanning direction. In this case, it can be understood from the drawings that the analysis chart scan used for analyzing the cause of occurrence of an abnormal image, which will be described later, and the transmission processing of the image data obtained by this analysis chart scan are adversely affected.
以下、画像やチャートをスキャンすることで得られる画像データをスキャン画像データと呼ぶ。 Hereinafter, image data obtained by scanning an image or a chart is referred to as scanned image data.
<画像形成装置−コントローラ>
図6は、本実施例において使用される画像形成装置のハードウェア構成、特にコントローラの構成例を詳細に示すブロック図である。
<Image forming apparatus-controller>
FIG. 6 is a block diagram illustrating in detail the hardware configuration of the image forming apparatus used in the present embodiment, particularly the configuration example of the controller.
コントローラ200は、画像入力デバイスであるスキャナ140や、画像出力デバイスであるプリンタ120や、LAN10や、公衆回線(WAN)11と接続され、画像形成装置の動作を統括的に制御すると共に画像情報やデバイス情報の入出力制御を行う。
The
CPU2100は、画像形成装置全体を制御するプロセッサであり、ROM2120に記憶された制御プログラム等に基づいて接続中の各種デバイスとのアクセスを統括的に制御する。さらに、CPU2100は、コントローラ200内部で行われる各種処理についても統括的に制御する。RAM2110は、CPU2100が動作するためのシステムワークメモリであり、画像データなどを一時記憶するための画像メモリでもある。ROM2120は、ブートROMであり、システムのブートプログラムを格納する。HDD2130は、ハードディスクドライブで、主に、コンピュータを起動・動作させるために必要な情報(システムソフトウェア)や画像データを格納する。これらのデータは、HDD2130に限らず、電源が切れても記憶保持可能な記録媒体に格納してもよい。
The
LANC(LANコントローラ)2200は、LAN10に接続し、図示しないユーザPCとの間で出力用画像データの入出力や機器制御にかかわる情報の入出力を行う。また、後述の画像診断装置110との間で異常画像に関わるデータの入出力を行う。MODEM2210は、公衆回線11に接続し、データの入出力を行う。
A LANC (LAN controller) 2200 is connected to the
プリンタIF画像処理部2300は、プリンタ120と接続し、プリンタ120に搭載されたCPUと通信を行う。また、プリンタIF画像処理部2300は、例えばハーフトーン処理といった画像データをプリント出力するための画像処理を行う。スキャナIF画像処理部2400は、原稿フィーダ141を含めたスキャナ140と接続し、スキャナ140に搭載されたCPUと通信を行う。また、スキャナIF画像処理部2400は、例えばシェーディング補正処理といった画像データをスキャン入力するための画像処理を行う。
A printer IF
RIP2500はLAN10を経由し外部のユーザPCから受信した画像データ(PDLコード)をビットマップデータに展開する。
The
操作部IF2600は、操作ユニット160に表示する画像データをコントローラ200から操作ユニット160に出力し、かつ、画像形成装置の使用者が操作ユニット160から入力した情報をコントローラ200に出力するためのインターフェースである。
The operation unit IF 2600 is an interface for outputting image data to be displayed on the
<プリント時の異常画像の発生>
図7は、画像形成装置を用いてプリントを行った場合に、出力画像にて発生するプリント時の画像問題の具体例である。例えば、出力した画像に小さな汚れ302が付着してしまうゴミ問題301、画像の縦方向または横方向に線304が入ってしまうスジ問題303、画像全体に点状、線状の異常306が視認されるムラ問題305などがある。さらには非図示の色味に関する色問題、主に細線などで発生する定着器の熱によるトナー飛び散り問題などもある。以上は代表的な画像問題の一例だが、この他にも画像形成装置103内部の様々な原因によってユーザが異常と感じる画像問題が発生する。これらの画像問題は、プリンタ120にて電子写真方式による画像形成を実現するための感光体ドラムや現像器、定着器といった様々な部品の故障や劣化によって引き起こされる。そして、これらの問題は発生箇所(以下、問題箇所とする)の大きさとこれらの問題が画像内にて発生する位置とで大きく分類できる。問題箇所が大きいのか小さいのか、発生する位置が画像全体なのか画像の一部なのかである。ゴミ問題301は、問題箇所が小さく、発生する位置は画像の一部である。ムラ問題305は発生箇所が大きく、発生する位置は画像全体である。スジ問題303は問題箇所が小さく(細く)、発生する位置は画像の縦または横の一方向にのみ全体である。
<Generation of abnormal images during printing>
FIG. 7 is a specific example of an image problem during printing that occurs in an output image when printing is performed using an image forming apparatus. For example, a
ここで、これらの発生原因を解析するため、画像問題を再現する必要がある。この再現に必要な画像について考察する。ゴミ問題301のように発生箇所が特定できず、かつ問題箇所が小さい画像問題の特定には、画像全体の解析が必要となる。しかし、スジ問題303は画像を横方向に見ていけば必ず現れる。また、ムラ問題305のように画像全体に現れる問題であれば、画像の一部だけを見ても画像問題が現れていると考えられる。以上の事から、検出したい画像問題の種別によって解析に必要な画像の大きさや種類も異なる。
Here, in order to analyze the cause of these occurrences, it is necessary to reproduce the image problem. Consider the image required for this reproduction. In order to identify an image problem that cannot be identified like the
本実施例の画像形成装置は、このような画像問題が発生した場合に、その問題を再現するための画像である解析チャートを出力する機能をプリンタ部120またはプリンタIF画像処理部2300に備えている。
The image forming apparatus according to the present exemplary embodiment includes a function for outputting an analysis chart, which is an image for reproducing the problem, in the
検出したい画像問題の種別によって、解析に用いられるチャートの種類は決定する。 The type of chart used for analysis is determined according to the type of image problem to be detected.
画像形成装置は、画像問題を再現させた解析チャートを出力し、それをスキャナ140、原稿フィーダ141を用いて読み取り、LANC2200を介してネットワーク上の画像診断装置110に読み取った画像データを送信する。
The image forming apparatus outputs an analysis chart in which an image problem is reproduced, reads the chart using the
<画像診断装置−ハード構成>
図8は、画像診断装置110のハードウェア構成図の一例を示す。画像診断装置110は、それぞれシステムバス1108で相互に接続されているCPU1101、RAM1102、ROM1103、HDD1104、ネットワーク部1107、IO部1105、操作部1106を有するように構成される。
<Diagnostic imaging device-hardware configuration>
FIG. 8 shows an example of a hardware configuration diagram of the
CPU1101は、OS(Operating System)やアプリケーションソフトなどのプログラムをHDD1104から読み出して実行することで種々の機能を提供する。さらにCPU1101は画像診断装置110が行う画像診断処理を統括的に制御する。RAM1102はCPU1101がプログラムを実行する際のシステムワークメモリである。ROM1103はBIOS(Basic Input Output System)やOSを起動するためのプログラム、設定ファイルを記憶している。HDD1104はハードディスクドライブであって、システムソフトウェアや、後述する画像診断処理を実現するためのプログラムが記憶されている。本プログラムは、記憶媒体に記憶され配布されたり、LAN10を介して接続された図示しないサーバからダウンロードされ、HDD1104にインストールされる。ネットワーク部1107はLAN10に接続され、画像形成装置101、102、103などの外部機器と通信(送受信)を行う。IO部1105は液晶ディスプレイやマウスなど図示しない入出力デバイスとから構成する操作部1106との情報を入出力するインターフェースである。液晶ディスプレイにはプログラムが指示する画面情報に基づき所定の解像度や色数等で所定の情報が描画される。例えば、GUI(Graphical User Interface)画面を形成し、操作に必要な各種ウィンドウやデータ等が表示される。
The
<画像診断装置−画像診断機能構成>
図9は、画像診断装置110が実行する画像診断プログラム1110の一例を示す図である。本プログラムは、HDD1104内に本画像診断装置が実現すべき機能として格納されている。本プログラムはCPU1101がブートプログラムを実行することにより、HDD1104からRAM1102へ読み出される。そしてCPU1101がRAM1102上に読み出したプログラムを実行することで処理される。
<Image diagnosis apparatus-image diagnosis function configuration>
FIG. 9 is a diagram illustrating an example of an
画像診断装置110の画像診断プログラム1110で実行される画像解析部1111について、解析に必要なチャートの例と共に説明する。図10にチャートの具体例を示す。401は全面一様な色で塗りつぶされたベタチャートの一例であり、プリント時の異常画像のゴミ問題301、スジ問題303やムラ問題305の解析に有用である。画像形成装置103は非図示の感光体ドラムと現像器、定着器を有しており、ドラム上へ付着させたトナーを紙へ転写、定着することで出力物を生成している。このドラムをCMYKの色ごとに持っている構成の画像形成装置103と、1つのドラムで全色に対応する構成の画像形成装置103がある。前者の場合には、特定の色のみで画像問題が発生する事もあるため、ベタチャート401は色ごとに必要となる。また、ベタチャート401の濃度はこの限りではなく、画像問題を検出しやすい濃度域に合わせたものとする。
The
検出しやすい濃度域について、具体的に説明する。 The concentration range that is easy to detect will be specifically described.
例えば、検出したい画像問題がゴミ問題301の場合について説明する。スキャン時に解析チャートと一緒に読み取られたゴミ(汚れ)部分の画像データは最大濃度に近い濃度を有している可能性が高い。よって、このゴミ(汚れ)部分の画像データを周囲から目立たせるためには、ベタチャート401の濃度は最大値ではなく、中間濃度程度の濃度が好ましい。
For example, a case where the image problem to be detected is the
一方、検出したい画像問題が、スジ問題303の場合、濃度が薄いスジを検出するためには、ベタチャート401の濃度は濃い方が好ましい。
On the other hand, when the image problem to be detected is the
このように、検出したい画像問題の濃度に応じて、ベタチャート401の濃度は変更する必要がある。よって、このベタチャート401は、検出すべき全ての問題画像に対応する濃度を有する1枚のベタチャートあってもよいし、1枚で全ての濃度を対応できない場合はベタチャートを何枚かに分けてもよい。
As described above, the density of the
複数の画像問題を想定した場合には、複数の濃度で作成したベタチャート401が必要となることもある。細線チャート402は前述した飛び散り問題などを検出するための細線を描画したチャートの一例である。細線チャート402に含まれる画像は細線に限らず、小さな文字や、細かい描画特有の問題を解析できるチャートであればよく、細線チャート402はこの限りではない。色パッチチャート403は色問題の解析に用いられるチャートの一例である。色パッチチャート403に含まれるパッチ404は単色のパッチや混色のパッチを必要に応じて並べたものである。縦方向や横方向の色の一様性を解析したい場合には、同じ色のパッチ404を縦または横方向に並べる必要がある。
When a plurality of image problems are assumed, a
ベタチャート401を用いた解析では、全面一様な画像中に、周囲と特徴量の異なる箇所があるか否かの判定が必要である。
In the analysis using the
例えば特徴量として、プリント時に画像異常が発生したベタチャート401のスキャン画像データの信号値のヒストグラムを取得する。そして、プリント時に画像異常が発生しなかったベタチャート401のスキャン画像データのヒストグラムと比較し、その差分を用いて解析する。また、同様に、ベタチャート401のスキャン画像データに対する周波数解析によって直流成分以外の成分が検出されるか否を解析する方法が考えられる。
For example, a histogram of signal values of the scanned image data of the
細線チャート402を用いた解析では、出力された細線チャート402の細線の回りに飛び散りやにじみがないか否かの判定が必要である。例えば、解析したい細線付近をミクロに見て、異常画像が発生していないとされた時に出力された細線チャート402のスキャン画像データとの差を判定する。エッジ検出や従来からよく知られる黒文字判定等を用いて、細線チャート402のスキャン画像データから細線領域を検出し、エッジのなまり具合やエッジ付近の紙白にトナーが飛び散った事による紙白との色の変化などを解析する方法が考えられる。
In the analysis using the
色パッチチャート403を用いた解析ではまず、色パッチチャート403のスキャン画像データに含まれる各パッチ404の画素値を取得する。通常、パッチ404内の小領域の画素値を平均化してパッチの画素値とする。
In the analysis using the
そして、異常画像が発生していないと判断された時に出力された色パッチチャート403のスキャン画像データのパッチの画素値との差を解析する。または、色パッチチャート403に同じ色のパッチ404が配置されている場合には、スキャン画像データにおけるそれらのパッチ404の画素値を比較して面内の一様性を解析したりする方法が考えられる。
Then, the difference between the patch pixel value of the scanned image data of the
これら各解析手法によって得られたチャート解析結果は特徴量として算出され、後段のプリンタ故障箇所推定部1113で使用される。
The chart analysis result obtained by each of these analysis methods is calculated as a feature amount and used by the printer failure
以上はあくまで解析方法の一例であり、診断したい画像問題を適切に解析出来る方法であればよい。 The above is only an example of an analysis method, and any method that can appropriately analyze an image problem to be diagnosed may be used.
また、後述するスキャナ異常箇所確認のため、白紙原稿をスキャンして得られる結果である白紙スキャンデータを用いてチャート解析と同様に特徴量を算出する。 In addition, in order to confirm an abnormal portion of the scanner, which will be described later, the feature amount is calculated in the same manner as the chart analysis using blank sheet scan data obtained by scanning a blank document.
ここで白紙とは、印字情報を含まない原稿のことである。 Here, the blank paper is a document that does not include print information.
これは、本来白紙を読み取って得られるスキャン画像データに白画素ではない画素が載っていた場合に異常画素として特定するものである。また、チャート解析と同様に算出した特徴量は後段のスキャナ故障箇所推定部1112で使用される。
This is specified as an abnormal pixel when a pixel that is not a white pixel is included in scan image data originally obtained by reading a blank sheet. Further, the feature amount calculated in the same manner as the chart analysis is used in the subsequent scanner failure
本実施例では、故障箇所推定処理の一例として画像解析部1111で算出した特徴量とデータベースとを用いてスキャナの故障箇所とプリンタの故障箇所を個別に特定する。
In this embodiment, as an example of the failure location estimation processing, the failure location of the scanner and the failure location of the printer are individually identified using the feature amount calculated by the
データベースとは前述の特徴量と実際の故障箇所との関係を、実績データを元に組み合わせたものである。 The database is a combination of the above-described feature quantity and the actual failure location based on the actual data.
このデータベースは、具体的には、プリンタ故障箇所推定部1113では定着器や現像器、感光体ドラムなどの故障箇所とその部品が故障した場合に過去に得られた特徴量とがデータベースとしてまとまっているものである。またスキャナ故障箇所推定部1112では原稿台ガラスの汚れや傷、ミラーユニット内のミラー汚れ、CCDセンサの異常などとそれらが発生した場合に過去に得られた特徴量とがデータベースとしてまとまっているものである。
More specifically, the printer failure
上述の周波数解析や色解析など解析手法に合わせて周波数特徴量と色特徴量など算出しているため、複数のデータベースが存在してもよい。もちろん、複数の特徴量から画像特徴量を算出してデータベースを作成してもよい。また、データベースは画像形成装置101、102、103で個別に扱ってもよいし、まとめて一つのデータベースとして扱ってもよい。これは、例えば画像形成装置101、102、103がそれぞれ共通機種で故障箇所と故障した場合に得られる特徴量との関係に共通性が得られるならばデータベースはまとめて扱う。しかし、例えば画像形成装置101、102、103がそれぞれ共通機種であっても環境の違いにより故障箇所と故障した場合に得られる特徴量との関係に共通性が得られないものであれば個別に扱う。
Since the frequency feature amount and the color feature amount are calculated in accordance with the analysis method such as frequency analysis and color analysis described above, a plurality of databases may exist. Of course, a database may be created by calculating image feature amounts from a plurality of feature amounts. The database may be handled individually by the
また、データベースはサービスマンが対応した実績だけでなく、予め設計時に予測されたデータや過去の製品のデータを用いて作成してもよい。 Further, the database may be created using not only the results supported by the service person but also data previously predicted at the time of design and data of past products.
データベースと得られた特徴量とから故障箇所を推定する方法としてベイズの展開公式が考えられる。これはあるデータ(本実施例では特徴量)が、原因(本実施例では故障箇所)から得られる確率を導き出す公式で一般的なものである。また、これ以外にも故障箇所を推定可能な手法であればどのような手法を用いてもよい。 A Bayesian expansion formula can be considered as a method of estimating a failure location from a database and the obtained feature quantity. This is a general formula for deriving the probability that certain data (feature amount in this embodiment) is obtained from the cause (failure location in this embodiment). In addition to this, any technique may be used as long as it can estimate the failure location.
また、本実施例において特徴量算出を画像診断装置110で行ったが、各画像形成装置(100、101、102)らで特徴量を算出し、算出した特徴量を送ってもよい。さらに、図示しない他のサーバを用いて特徴量の算出や故障箇所の推定を行ってもよい。
In the present embodiment, the feature amount calculation is performed by the image
また、本実施例においてスキャナ140を用いてスキャン画像を取得したが、他の測定デバイスを用いて取得した値及び取得した値から算出される値を特徴量としてもよい。
In this embodiment, the scan image is acquired using the
<画像形成装置のフローチャート>
図11は、本実施例における画像形成装置の処理の流れを示すフローチャートである。図11に示すフローチャートはHDD2130に格納されたプログラムに従って、CPU2100が実行する。なお、本フローチャートは画像形成装置で発生した異常による異常画像を解析チャートで再現させ、それを画像診断装置に送信する目的で実施される。
<Flowchart of image forming apparatus>
FIG. 11 is a flowchart showing the flow of processing of the image forming apparatus in this embodiment. The flowchart shown in FIG. 11 is executed by the
よって画像形成装置の印刷実行時に異常画像が発生した場合、画像形成装置を利用するユーザによって本フローが実施される。 Therefore, when an abnormal image occurs during printing of the image forming apparatus, this flow is performed by a user who uses the image forming apparatus.
まずS101において、どのようなチャートを出力するのかを示す解析チャートの情報を取得する。解析チャートは図10で説明した通り、解析の目的に応じて複数存在する。 First, in S101, information on an analysis chart indicating what kind of chart is output is acquired. As described with reference to FIG. 10, there are a plurality of analysis charts depending on the purpose of the analysis.
次にS102にてS101で準備した解析チャートを出力する。これは、プリンタ120を用いて画像形成装置の図示しないドラム上へ付着させたトナーを紙へ転写、定着させるものである。これにより解析チャートは紙に印刷され、排紙トレイ124から出力される。なお前述の通り、スジやムラなどのプリンタの異常により画像異常が発生していた場合は本解析チャートに画像異常が発生することになる。
Next, in S102, the analysis chart prepared in S101 is output. In this method, the toner attached on a drum (not shown) of the image forming apparatus is transferred and fixed on paper using the
次にS103では、CPU2100は操作ユニット160内の図示しない表示部にS102で出力した解析チャートおよび白紙のスキャン指示を表示する。具体的には、「印刷したチャートの先頭ページに白紙を挿入し、原稿フィーダ上に上向きにセットしてください。セット後に原稿読み取り開始ボタンを押下してください」といった内容である。これはユーザが解析チャートおよび白紙の原稿フィーダ141を正しくセットできるような指示であれば、図やグラフィックを用いて表示してもよい。また、画像形成装置にスキャン対象原稿の1ページ目が白紙か否かを判断する手段があるならば、それを用いて白紙の有無を判断し、白紙がないと判断された場合には操作ユニット160内の表示部に白紙挿入を促す警告を表示するようにしてもよい。
In step S103, the
S104ではユーザからのスキャン指示を受け付けて、原稿フィーダ141に置かれた原稿(白紙および解析チャート)のスキャンを実行する。スキャンはスキャナ140にて流し読みモードで実施される。これらの原稿をスキャンすることで得たスキャン画像データは、スキャナIF画像処理部2400にて適切に画像処理された後、HDD2130に格納される。前述の通り、流し読みモードではスキャン画像データに対してスジなどの画像異常を発生させる可能性があり、すでにプリント時の画像異常が発生している解析チャートのスキャン画像データに、さらに画像異常が重畳される可能性がある。
In step S <b> 104, a scan instruction from the user is received, and the document (blank sheet and analysis chart) placed on the
S105では、S104で読み取りHDD2130に格納されている解析チャートおよび白紙のスキャン画像データを画像診断装置110へ送信する。これはLANC2200を介してLAN10に接続されている画像診断装置110へデータ送信を行うものである。
In S <b> 105, the analysis chart read in S <b> 104 and stored in the
以上の処理により、画像形成装置で発生した画像異常が再現されている解析チャートおよび白紙のスキャン画像データが画像診断装置110に送ることができる。
Through the above processing, the analysis chart in which the image abnormality that has occurred in the image forming apparatus is reproduced and the blank scan image data can be sent to the image
<画像診断装置による画像診断フローチャート>
図12は、本実施例における画像診断装置110の画像診断処理の流れを示すフローチャートである。図12に示すフローチャートはHDD1104に格納されたプログラムに従って、CPU1101が実行する。なお、本フローチャートは画像形成装置で発生した異常画像の原因を特定する目的で実施される。
<Image diagnosis flowchart by image diagnosis apparatus>
FIG. 12 is a flowchart showing the flow of the image diagnosis process of the
S201では画像形成装置から送信される解析チャートおよび白紙をスキャンすることで得られたスキャン画像データを受信する。これは前述のS105の処理にて画像形成装置から送信されるものである。解析チャートおよび白紙をスキャンすることで得られたスキャン画像データを受信後、S202へ進む。 In S201, the analysis chart transmitted from the image forming apparatus and the scanned image data obtained by scanning the blank sheet are received. This is transmitted from the image forming apparatus in the process of S105 described above. After receiving the scanned image data obtained by scanning the analysis chart and the blank sheet, the process proceeds to S202.
S202ではCPU1101は受信したスキャン画像データのうち、白紙の原稿をスキャンすることで得られた白紙スキャン画像データの解析を実行する。これは、画像解析部1111の機能であり、スキャナ異常箇所確認のために白紙スキャン画像データを用いて特徴量を算出する。特徴量は前述の通り、本来白紙をスキャンして得られたであるはずの画像データに白画素ではない画素が含まれていた場合、この画素を異常画素として特定するものである。また、チャート解析と同様にそれらの解析結果を特徴量として算出しておく。
In step S202, the
S203では、S202の白紙解析の結果、スキャナ異常が検出されたか否かを判断する。スキャナ異常とはS105で画像形成装置が用いたスキャン処理において何らかの不具合が発生していたことを示すものである。これは、白紙スキャン画像データに異常画素が含まれていたか否かで判断する。異常が検出されたと判断された場合はS204へ進む。異常が検出されないと判断された場合はS206へ進む。 In S203, it is determined whether or not a scanner abnormality is detected as a result of the blank page analysis in S202. The scanner abnormality indicates that some trouble has occurred in the scan processing used by the image forming apparatus in S105. This is determined based on whether or not abnormal pixels are included in the blank paper scanned image data. If it is determined that an abnormality has been detected, the process proceeds to S204. If it is determined that no abnormality is detected, the process proceeds to S206.
S204では、CPU1101はスキャナ故障箇所推定部1112の機能に従いスキャナ故障箇所の推定処理を行う。これは前述の通り、ベイズの展開式などを用いてS202で得た特徴量からスキャナの故障箇所を推定するものである。推定する故障にはCCDセンサの異常のように部品を交換する必要のある内容のものから原稿台ガラスの汚れ、ミラーユニット内のミラー汚れのように部品を交換する必要はないが清掃などの対策が必要なものまで含む。よって、画像形成装置の保守・点検をするサービスマンは本画像診断装置を利用することで遠隔地から画像形成装置のスキャナ部に発生した画像異常の原因および対策(部品を交換・調整するか、清掃するかなど)を判断することが可能となる。これにより画像異常が解決するまでのダウンタイムを従来よりも削減することが可能となる。
In step S <b> 204, the
次にS205では、S202で発生した異常がプリンタ解析に影響を及ぼすか否かの判断をする。これは発生した白紙スキャン画像データにて異常画素がチャート解析による特徴量の抽出に影響を及ぼすか否かの判断である。例えば流し読みモードで読み取り位置にゴミが付着したため発生したスジなどの画像異常であれば、プリンタ120の故障や汚れなどで発生したスジの画像異常と区別がつきにくく、プリンタ120の故障と誤認識する可能性がある。この場合はプリンタ解析に影響を及ぼすと判断される。この場合はS207へ進む。一方、例えば発生した異常画素がチャートの解析に利用する領域外であった場合などではプリンタ解析に影響を及ぼさないと判断され、S206へ進む。
Next, in S205, it is determined whether or not the abnormality occurring in S202 affects the printer analysis. This is a determination as to whether or not an abnormal pixel affects the extraction of the feature amount by the chart analysis in the generated blank scan image data. For example, an image abnormality such as a streak generated due to dust adhering to the reading position in the flow reading mode is difficult to distinguish from a streak image abnormality generated due to a failure or contamination of the
S206ではCPU1101は画像形成装置から受信したチャートの解析を実行する。これにより、プリンタ120の故障箇所を推定するために必要となる特徴量を抽出する。S206の詳細な内容に関しては後述する。
In S206, the
S207では、CPU1101は画像形成装置から受信したチャートの解析をスキャナ異常画素の影響を低減させながら実行する。これにより、スキャナ異常画素を解析チャートのスキャン画像データに含んでしまっている場合でも、プリンタ120の故障箇所を推定するために必要となる特徴量を抽出することが可能となる。S207の詳細な内容に関しては後述する。
In step S207, the
S208ではCPU1101はプリンタ故障箇所推定部1113の機能に従いプリンタ故障箇所の推定処理を行う。これは前述の通り、ベイズの展開式などを用いてS206またはS207で得た特徴量からプリンタの故障箇所を推定するものである。推定する故障には現像器や感光体ドラム、定着器の故障など印刷に必要となる部品の故障などである。よって、画像形成装置の保守・点検をするサービスマンは本画像診断装置を利用することで遠隔地から画像形成装置のプリンタ部に発生した画像異常の原因および対策(部品を交換・調整するか、清掃するかなど)を判断することが可能となる。これにより画像異常が解決するまでのダウンタイムを従来よりも削減することが可能となる。
In step S <b> 208, the
<チャート解析のフローチャート>
図13は、本実施例における画像診断装置110のチャート解析処理の流れを示すフローチャートである。本フローチャートは図12のS206を詳細に説明したものであり、HDD1104に格納された画像診断プログラム1110の画像解析部1111の機能に従って、CPU1101が実行する。
<Flow chart of chart analysis>
FIG. 13 is a flowchart showing the flow of chart analysis processing of the
まず、S301では解析手法のひとつである実空間解析を行うか否かの判断をする。この判断は解析チャートの種類に応じており、現在注目しているスキャン画像データに対応する解析チャートが実空間解析を行う必要のあるチャートか否かで判断するものでよい。 First, in S301, it is determined whether to perform real space analysis, which is one of analysis methods. This determination depends on the type of analysis chart, and may be determined based on whether or not the analysis chart corresponding to the scan image data currently focused on is a chart that requires real space analysis.
S301にて実空間解析を行うと判断された場合、S302に進む。そしてS302にて全画素に対して実空間解析を実行する。これは、例えば解析チャートのスキャン画像データ内の全画素の信号値のヒストグラムを取得する。そして、予め保持している画像異常がないと判断された時に出力された解析チャートのスキャン画像データから得られたヒストグラムと比較し、その差分を特徴量として抽出する。 If it is determined in S301 that real space analysis is to be performed, the process proceeds to S302. In S302, real space analysis is executed for all pixels. For example, a histogram of signal values of all pixels in the scan image data of the analysis chart is acquired. Then, it is compared with the histogram obtained from the scan image data of the analysis chart output when it is determined that there is no image abnormality held in advance, and the difference is extracted as a feature amount.
次にS303では解析手法のひとつである周波数解析を行うか否かの判断をする。この判断は解析チャートの種類に応じており、現在注目しているスキャン画像データに対応する解析チャートが周波数解析を行う必要のあるチャートか否かで判断するものでよい。 In step S303, it is determined whether to perform frequency analysis, which is one of analysis methods. This determination depends on the type of analysis chart, and may be determined based on whether or not the analysis chart corresponding to the scan image data currently focused on is a chart that needs to be subjected to frequency analysis.
S304では、周波数解析領域の抽出をする。これは解析チャートのスキャン画像データから例えば512×512ピクセルなどの解析領域を抽出する処理である。抽出領域は基本的には正方形とし、検出したい画像異常の原因の特徴が抽出しやすいように大きさを決める。また、画像異常の発生の仕方に合わせて複数領域選択し、繰り返し周波数解析をしてもよい。なお、この領域抽出はCPU1101によって自動的に実行されるものであってもよいし、液晶ディスプレイやマウスなどの入出力デバイスとから構成する画像診断装置110の操作部1106から抽出領域が指示されるものであってもよい。
In S304, the frequency analysis region is extracted. This is a process of extracting an analysis region such as 512 × 512 pixels from the scan image data of the analysis chart. The extraction area is basically a square, and the size is determined so that the feature causing the image abnormality to be detected can be easily extracted. Further, a plurality of regions may be selected in accordance with the manner of occurrence of image abnormality, and repeated frequency analysis may be performed. This region extraction may be automatically executed by the
S305では、CPU1101はS304で抽出した解析チャートのスキャン画像データの領域に対して周波数解析を実行する。例えば周波数解析によって直流成分以外の成分が検出されるか否かを特徴量として抽出することなどが考えられる。
In step S305, the
次にS306では解析手法のひとつである色解析を行うか否かの判断をする。この判断は解析チャートの種類に応じており、現在注目しているスキャン画像データに対応する解析チャートが色解析を行う必要のあるチャート(例えば色パッチチャート)か否かで判断するものでよい。 Next, in S306, it is determined whether or not to perform color analysis, which is one of analysis methods. This determination depends on the type of analysis chart, and may be determined based on whether or not the analysis chart corresponding to the scan image data currently focused on is a chart (for example, a color patch chart) that needs to be subjected to color analysis.
S307では解析チャート内のパッチ領域に対して色解析を実行する。例えば解析チャートのスキャン画像データのうち、パッチ内の小領域の画素値を平均化して得たパッチの画素値を用いる。そして、この画素値と異常画像がないと判断された時に出力された解析チャートのスキャン画像データに含まれるパッチの画素値との差から特徴量を取得する。また、解析チャート内に同じ色のパッチを配置している場合には、それらのパッチの画素値を比較して面内の一様性を特徴量として抽出する。 In S307, color analysis is performed on the patch area in the analysis chart. For example, among the scanned image data of the analysis chart, the pixel value of the patch obtained by averaging the pixel values of the small areas in the patch is used. Then, the feature amount is acquired from the difference between the pixel value and the pixel value of the patch included in the scan image data of the analysis chart output when it is determined that there is no abnormal image. Further, when patches of the same color are arranged in the analysis chart, the pixel values of these patches are compared, and the in-plane uniformity is extracted as a feature amount.
以上が画像診断装置110のチャート解析処理の流れである。
The above is the chart analysis process flow of the
<チャート補正解析のフローチャート>
図14は、本実施例における画像診断装置110のチャート補正解析処理の流れを示すフローチャートである。本フローチャートは図12のS207を詳細に説明したものであり、HDD1104に格納された画像診断プログラム1110の画像解析部1111の機能に従って、CPU1101が実行する。
<Flow chart of chart correction analysis>
FIG. 14 is a flowchart showing the flow of chart correction analysis processing of the image
S401では図13のS301と同様で解析手法のひとつである実空間解析を行うか否かの判断をする。 In S401, as in S301 in FIG. 13, it is determined whether to perform real space analysis, which is one of analysis methods.
S402では、解析チャートのスキャン画像データに対してスキャン異常画素に対応する画素を除外して実空間解析を実行する。 In S402, the real space analysis is executed by excluding the pixels corresponding to the scan abnormal pixels from the scan image data of the analysis chart.
例えば解析チャートにて画像形成装置のスキャナ140の異常により図5のようなスジなどの異常が発生したとする。この場合、白紙のスキャン画像データにも図5のようなスジが発生する。よって、白紙のスキャン画像データから検知された異常画素に対応する位置にある、解析チャートのスキャン画像データの画素を除外したスキャン画像データを作成する。そして、このスキャン画像データの信号値のヒストグラムを取得する。これにより、ヒストグラムには画像形成装置のプリンタ120にて発生した異常のみ反映される。よって、これを予め保持している画像異常のないと判断された時に出力された解析チャートのスキャン画像データから得られたヒストグラムと比較し、その差分を特徴量として抽出する。
For example, assume that an abnormality such as a streak as shown in FIG. 5 occurs due to an abnormality in the
次にS403では図13のS303と同様で解析手法のひとつである周波数解析を行うか否かの判断をする。 Next, in S403, it is determined whether or not to perform frequency analysis, which is one of analysis methods, as in S303 in FIG.
S404では、解析チャートのスキャン画像データに対してスキャン異常画素に対応する画素を避けながら、解析チャートのスキャン画像データの周波数解析領域の抽出をする。例えばチャート内で画像形成装置のスキャナ140の不良により図5のようなスジなどの異常が発生したとする。この場合、白紙のスキャン画像データにも図5のようなスジが発生する。よって、白紙のスキャン画像データから検知された異常画素に対応する位置にある、解析チャートのスキャン画像データの画素を避けたスキャン画像データを作成する。そしてこのスキャン画像データから、例えば、画像データから512×512ピクセルなどの解析対象領域を抽出する。抽出領域は基本的には正方形とし、検出したい画像異常の原因の特徴が抽出しやすいように大きさを決める。また、画像異常の発生の仕方に合わせて複数領域選択し、繰り返し周波数解析をしてもよい。
In S404, the frequency analysis region of the scan image data of the analysis chart is extracted while avoiding the pixels corresponding to the scan abnormal pixels in the scan image data of the analysis chart. For example, assume that an abnormality such as a streak as shown in FIG. 5 occurs due to a defect in the
なお、この領域抽出はCPU1101によって自動的にスキャナ140の不良による異常画素を避けるように実行されるものであってよい。または、液晶ディスプレイやマウスなどの入出力デバイスとから構成する画像診断装置110の操作部1106から抽出領域が指示されるものであってもよい。その場合は液晶ディスプレイなどには異常画素位置は選択不可となるようにCPU1101が調整する。
Note that this region extraction may be executed automatically by the
S405では、図13のS305と同様でCPU1101はS404で抽出した領域に対して周波数解析を実行する。周波数解析において、もし異常画素を線形補間などで補正処理をして周波数解析の抽出領域に含んでしまうと本来抽出されるべきではない補正による周波数成分を得てしまう可能性があるので、S204にて検出された異常画素を避けることが適している。
In S405, similar to S305 in FIG. 13, the
次にS406では図13のS306と同様で解析手法のひとつである色解析を行うか否かの判断をする。 Next, in S406, as in S306 of FIG. 13, it is determined whether or not to perform color analysis, which is one of analysis methods.
S407では、解析チャートのスキャン画像データに対してスキャン異常画素に対応する画素の補間処理を実行する。これは、例えば解析チャートのスキャン画像データにて画像形成装置のスキャナ140の不具合により図5のようなスジなどの異常が発生したとする。この場合、白紙のスキャン画像データにも図5のようなスジが発生する。よって、白紙のスキャン画像データから検知された異常画素に対応する位置にある、解析チャートのスキャン画像データの画素を、その画素の周辺画素を用いて補正する。
In S407, interpolation processing of pixels corresponding to scan abnormal pixels is performed on the scan image data of the analysis chart. For example, it is assumed that an abnormality such as a streak as shown in FIG. 5 occurs due to a defect in the
これはスキャン画像データに含まれる異常画素の左右の隣接画素を用いて線形補間を実施し、異常画素を線形補間の演算結果と置き換えるなどの処理である。 This is a process such as performing linear interpolation using the left and right adjacent pixels of the abnormal pixel included in the scan image data, and replacing the abnormal pixel with the result of linear interpolation.
S408では図13のS307と同様で解析チャート内のパッチ領域に対して色解析を実行する。パッチなどの小さな領域では異常画素を避けて特徴量を抽出することが困難なので補間処理による補正が適している。 In step S408, color analysis is performed on the patch area in the analysis chart, similar to step S307 in FIG. In a small region such as a patch, it is difficult to extract a feature quantity by avoiding abnormal pixels, and correction by interpolation processing is suitable.
以上がチャート補正解析処理の流れである。 The above is the flow of the chart correction analysis process.
本フローチャートにおける処理は図13のフローチャートにおける処理と異なり、スキャン異常画素のチャート解析への影響を低減するために解析手法に合わせて適切にスキャン異常画素の除外や回避、補正手段を選択している。 The processing in this flowchart is different from the processing in the flowchart of FIG. 13, in order to reduce the influence of the abnormal scanning pixels on the chart analysis, the scanning abnormal pixels are appropriately excluded, avoided, or corrected according to the analysis method. .
つまり、画像形成装置で解析チャートをスキャンした場合にスキャナ140の故障や汚れなどによる画像異常が発生した場合、解析チャートのスキャン画像データから得られる値を、白紙のスキャン画像データから得られる値で修正をしている。
That is, when an image chart is scanned by the image forming apparatus and an image abnormality occurs due to a failure or contamination of the
この修正された解析チャートのスキャン画像データから得られる値を用いてプリンタ故障個所の推定を行うことができる。 The printer failure location can be estimated using the value obtained from the scanned image data of the modified analysis chart.
これにより画像形成装置で解析チャートをスキャンした場合にスキャナ140の故障や汚れなどによる画像異常が発生した場合でも、その影響を低減し適切に解析チャートを用いてプリンタ部の故障推定を実施することが可能となる。
As a result, even when an image abnormality is caused by a failure or contamination of the
実施例1では、画像形成装置から送信されたスキャン画像データに含まれる異常画素がスキャナ140で発生したものかプリンタ120で発生したものか判断するために白紙挿入する方法について述べた。実施例2では、白紙の原稿を挿入せずに画像形成装置から送信されたスキャン画像データに含まれる異常画素がスキャナ140で発生したものかプリンタ120で発生したものか判断する。これにより白紙の原稿を挿入するためにかかるユーザビリティの低下を軽減させたものに関して説明する。
In the first embodiment, a blank paper insertion method has been described in order to determine whether abnormal pixels included in the scanned image data transmitted from the image forming apparatus are generated by the
本実施例では実施例1に対して、画像形成装置の処理フローが異なる。画像形成装置および画像診断装置のハードウェア構成は実施例1と同様である。以下、実施例1との差分について本実施例を詳細に説明する。 In this embodiment, the processing flow of the image forming apparatus is different from that of the first embodiment. The hardware configurations of the image forming apparatus and the image diagnostic apparatus are the same as those in the first embodiment. Hereinafter, the present embodiment will be described in detail with respect to differences from the first embodiment.
<画像形成装置のフローチャート>
図15は、実施例2における画像形成装置の処理の流れを示すフローチャートである。図15に示すフローチャートは画像形成装置のHDD2130に格納されたプログラムに従って、CPU2100が実行する。なお、本フローチャートは画像形成装置で発生した異常によって発生する異常画像を解析チャートで再現させ、それを画像診断装置に送信する目的で実施される。よって本フローは、画像形成装置の印刷実行時に異常画像が発生した場合に、画像形成装置を利用するユーザによって実施される。
<Flowchart of image forming apparatus>
FIG. 15 is a flowchart illustrating a process flow of the image forming apparatus according to the second exemplary embodiment. The flowchart shown in FIG. 15 is executed by the
まずS501において、どのような解析チャートを出力するのかを示す解析チャートの情報を取得する。解析チャートは図10で説明した通り、解析の目的に応じて複数存在する。 First, in S501, information on an analysis chart indicating what kind of analysis chart is output is acquired. As described with reference to FIG. 10, there are a plurality of analysis charts depending on the purpose of the analysis.
次にS502にてS501で準備した解析チャートを出力する。これは、プリンタ120を用いて画像形成装置の図示しないドラム上へ付着させたトナーを紙へ転写、定着させるものである。これにより解析チャートは紙に印刷され、排紙トレイ124から出力される。なお前述の通り、スジやムラなどの画像異常が発生していた場合は本解析チャートにも画像異常が発生することになる。
Next, in S502, the analysis chart prepared in S501 is output. In this method, the toner attached on a drum (not shown) of the image forming apparatus is transferred and fixed on paper using the
次にS503では、CPU2100は操作ユニット160内の図示しない表示部にS502で出力した解析チャートのスキャン指示を表示する。具体的には、「印刷したチャートを原稿フィーダ上に上向きにセットしてください。セット後に原稿読み取り開始ボタンを押下してください」といった内容である。これはユーザが解析チャートを正しくセットできるような指示であれば、図やグラフィックを用いて表示してもよい。そしてこのとき、CPU2100は原稿読み取りモードを両面原稿スキャンに強制的に設定する。または、操作ユニット160内の表示部に「原稿読み取りモードを両面原稿にセットしてください」と表示し、ユーザによって両面スキャン設定されるようにしてもよい。
In step S <b> 503, the
S504ではユーザからのスキャン指示を受け付けて、原稿フィーダ141に置かれた原稿(解析チャート)の両面スキャンを実行する。スキャンはスキャナ140にて流し読みモードで実施され、スキャナIF画像処理部2400にて適切に画像処理された後、HDD2130に格納される。前述の通り、流し読みモードではスジなどのスキャナ異常による画像異常が発生する可能性がある。よって、すでにプリント時の画像異常が発生している解析チャートに、さらに画像異常が重畳される可能性がある。このとき、両面スキャンが実行され、解析チャートの裏面もスキャンされる。これは、スキャナ140に異常が発生しているか否か判断するために裏面を読み取るものである。少なくとも本両面スキャンによって裏面を利用される解析チャートは片面のみ印字された原稿となる。つまり、本実施例における画像形成装置は、白紙である裏面を読み取るものである。この実施例において、解析チャートの裏面は常に白紙である。これは、白データ面である裏面を実施例1の白紙スキャンの代替とし、特に表面も裏面も共通のイメージセンサで読み取るような画像形成装置で有効的な効果が得られる。
In step S <b> 504, a scan instruction from the user is accepted, and duplex scanning of the document (analysis chart) placed on the
S505では、S504で読み取りHDD2130に格納されている解析チャートの画像データを画像診断装置110へ送信する。このとき、裏面の画像データも合わせて送信する。これはLANC2200を介してLAN10に接続されている画像診断装置110へデータ送信を行うものである。
In step S <b> 505, the analysis chart image data read in step S <b> 504 and stored in the
以上の処理により、画像形成装置で発生した画像異常が再現されている解析チャートおよびその裏面のスキャン画像データが画像診断装置110に送ることができる。以上で本フローチャートは終了となる。
Through the above processing, the analysis chart in which the image abnormality that has occurred in the image forming apparatus is reproduced and the scanned image data on the back surface thereof can be sent to the image
なお、図12における画像診断装置110での処理フローにおいて、実施例1におけるS202の白紙スキャン画像データの解析は、実施例2では、解析チャートの裏面の画像のスキャン画像データを用いて実施される。このとき、裏面のスキャン画像データは先頭ページの解析チャートの裏面のスキャン画像データ1枚分のみとし、その結果をすべてのチャート解析に利用するものとしてよい。また、すべての解析チャートの裏面が白紙であれば、解析チャートの表面と裏面を一つの対とし、裏面のスキャン画像データの解析結果を表面のチャート解析に利用するものとしてもよい。
In the processing flow of the image
以上の処理により、画像形成装置から送信されたスキャン画像データに含まれる異常画素がスキャナ140で発生したものかプリンタ120で発生したものか、白紙挿入せずに判断することが可能となった。よって実施例1に比べ白紙挿入にかかるユーザビリティの低下を軽減させることが可能となっている。
With the above processing, it is possible to determine whether an abnormal pixel included in the scanned image data transmitted from the image forming apparatus is generated by the
また、本実施例は解析チャートの裏面をスキャンする方法を、白紙を挿入してスキャンする方法の代替手段とした。しかし、原稿搬送前にスキャンを実行し得られる画像データ(搬送ドラム1415上の白色面を読み取って得られる画像データ)を白紙挿入の代替手段とする構成としてもよい。その場合でも白紙挿入時と同じ効果が得られる。 In this embodiment, the method of scanning the back surface of the analysis chart is used as an alternative to the method of scanning by inserting blank paper. However, image data obtained by executing scanning before document conveyance (image data obtained by reading the white surface on the conveyance drum 1415) may be used as an alternative means for inserting blank paper. Even in that case, the same effect as when inserting a blank sheet can be obtained.
(その他の実施例)
また、実施例1および実施例2では図12における画像診断処理を画像診断装置が実行するとしたが、画像形成装置自身でHDD2130に格納されたプログラムに従って、CPU2100が実行するとしてもよい。
(Other examples)
Further, in the first and second embodiments, the image diagnosis apparatus in FIG. 12 executes the image diagnosis processing in FIG. 12, but the
また、本発明は、以下の処理を実行することによっても実現される。即ち、上述した実施形態の機能を実現するソフトウェア(プログラム)を、ネットワーク又は各種記憶媒体を介してシステム或いは装置に供給し、そのシステム或いは装置のコンピュータ(またはCPUやMPU等)がプログラムを読み出して実行する処理である。 The present invention can also be realized by executing the following processing. That is, software (program) that realizes the functions of the above-described embodiments is supplied to a system or apparatus via a network or various storage media, and a computer (or CPU, MPU, or the like) of the system or apparatus reads the program. It is a process to be executed.
Claims (18)
前記第1の画像データを用いて前記第2の画像データを変更し、該変更した画像データを解析することで得られる特徴量から前記画像形成手段に発生した異常の原因の推定を行う推定手段と、を有し、
前記第1の画像データを解析した結果が、前記読み取り手段に異常が発生したと判断された場合であっても、前記読み取り手段に発生した異常が前記装置に影響を与えないと判断された場合は、前記第2の画像データを変更せず、前記第2の画像データから特徴量を取得することを特徴とする装置。 First image data obtained by reading a chart on which no image is formed by the image forming means by the reading means, and second image data obtained by reading the chart formed by the image forming means by the reading means And an acquisition means for acquiring
Estimating means for changing the second image data using the first image data and estimating the cause of the abnormality that has occurred in the image forming means from the feature quantity obtained by analyzing the changed image data and, the possess,
Even when it is determined that an abnormality has occurred in the reading unit as a result of analyzing the first image data, it is determined that an abnormality occurring in the reading unit does not affect the apparatus The apparatus obtains a feature amount from the second image data without changing the second image data .
前記推定手段は、前記第2の画像データのうち、前記第1の画像データに含まれる異常画素に対応する画素を除外し、該画素が除外された第2の画像データを解析することで得られる特徴量を用いて推定を行うこと特徴とする請求項1に記載の装置。 When the analysis method of the second image data is real space analysis,
The estimation means is obtained by excluding pixels corresponding to abnormal pixels included in the first image data from the second image data and analyzing the second image data from which the pixels are excluded. The apparatus according to claim 1, wherein the estimation is performed using the obtained feature amount.
前記推定手段は、前記第2の画像データのうち、前記第1の画像データに含まれる異常画素に対応する画素を除外し、該画素が除外された第2の画像データから解析対象領域を決定し、該領域の画像データを解析して得られる特徴量を用いて推定を行うことを特徴とする請求項1に記載の装置。 When the analysis method of the second image data is frequency analysis,
The estimation unit excludes pixels corresponding to abnormal pixels included in the first image data from the second image data, and determines an analysis target region from the second image data from which the pixels are excluded. The apparatus according to claim 1, wherein estimation is performed using a feature amount obtained by analyzing image data of the region.
前記推定手段は、前記第2の画像データのうち、前記第1の画像データに含まれる異常画素に対応する画素を該画素に隣接する画素で補間し、該画素が補間された第2の画像データを解析することで得られる特徴量を用いて推定を行うことを特徴とする請求項1に記載の装置。 When the second image data analysis method is color analysis,
The estimation means interpolates a pixel corresponding to an abnormal pixel included in the first image data in the second image data with a pixel adjacent to the pixel, and a second image obtained by interpolating the pixel The apparatus according to claim 1, wherein estimation is performed using a feature amount obtained by analyzing data.
前記第1の画像データを用いて前記第2の画像データを変更し、該変更した画像データを解析することで得られる特徴量から前記画像形成手段に発生した異常の原因の推定を行う推定手段と、を有し、
前記第1の画像データを解析した結果が、前記読み取り手段に異常が発生したと判断された場合であっても、前記読み取り手段に発生した異常が前記装置に影響を与えないと判断された場合は、前記第2の画像データを変更せず、前記第2の画像データから特徴量を取得することを特徴とする装置。 Acquisition of obtaining first image data obtained by reading a white surface at a reading position by a reading means and second image data obtained by reading a chart formed by the image forming means by the reading means. Means,
Estimating means for changing the second image data using the first image data and estimating the cause of the abnormality that has occurred in the image forming means from the feature quantity obtained by analyzing the changed image data and, the possess,
Even when it is determined that an abnormality has occurred in the reading unit as a result of analyzing the first image data, it is determined that an abnormality occurring in the reading unit does not affect the apparatus The apparatus obtains a feature amount from the second image data without changing the second image data .
前記第1の画像データを用いて前記第2の画像データを変更し、該変更した画像データを解析することで得られる特徴量から前記画像形成手段に発生した異常の原因の推定を行う推定ステップと、を有し、
前記第1の画像データを解析した結果が、前記読み取り手段に異常が発生したと判断された場合であっても、前記読み取り手段に発生した異常が前記装置に影響を与えないと判断された場合は、前記第2の画像データを変更せず、前記第2の画像データから特徴量を取得することを特徴とする装置の制御方法。 First image data obtained by reading a chart on which no image is formed by the image forming means by the reading means, and second image data obtained by reading the chart formed by the image forming means by the reading means And an acquisition step to acquire
An estimation step of changing the second image data using the first image data and estimating the cause of the abnormality that has occurred in the image forming means from the feature amount obtained by analyzing the changed image data and, the possess,
Even when it is determined that an abnormality has occurred in the reading unit as a result of analyzing the first image data, it is determined that an abnormality occurring in the reading unit does not affect the apparatus The method for controlling an apparatus , wherein the feature amount is acquired from the second image data without changing the second image data .
前記第1の画像データを用いて前記第2の画像データを変更し、該変更した画像データを解析することで得られる特徴量から前記画像形成手段に発生した異常の原因の推定を行う推定ステップと、を有し、
前記第1の画像データを解析した結果が、前記読み取り手段に異常が発生したと判断された場合であっても、前記読み取り手段に発生した異常が前記装置に影響を与えないと判断された場合は、前記第2の画像データを変更せず、前記第2の画像データから特徴量を取得することを特徴とする装置の制御方法。 Acquisition of obtaining first image data obtained by reading a white surface at a reading position by a reading means and second image data obtained by reading a chart formed by the image forming means by the reading means. Steps,
An estimation step of changing the second image data using the first image data and estimating the cause of the abnormality that has occurred in the image forming means from the feature amount obtained by analyzing the changed image data and, the possess,
Even when it is determined that an abnormality has occurred in the reading unit as a result of analyzing the first image data, it is determined that an abnormality occurring in the reading unit does not affect the apparatus The method for controlling an apparatus , wherein the feature amount is acquired from the second image data without changing the second image data .
Priority Applications (3)
| Application Number | Priority Date | Filing Date | Title |
|---|---|---|---|
| JP2013241946A JP6234185B2 (en) | 2013-11-22 | 2013-11-22 | Apparatus, method for controlling apparatus, and program |
| US14/548,176 US9699326B2 (en) | 2013-11-22 | 2014-11-19 | Apparatus for identifying abnormalities in an image system and, method for controlling apparatus, and storage medium |
| US15/604,525 US10397412B2 (en) | 2013-11-22 | 2017-05-24 | Image processing apparatus, image processing method for estimating cause of abnormality having occurrenced in image processing apparatus |
Applications Claiming Priority (1)
| Application Number | Priority Date | Filing Date | Title |
|---|---|---|---|
| JP2013241946A JP6234185B2 (en) | 2013-11-22 | 2013-11-22 | Apparatus, method for controlling apparatus, and program |
Publications (3)
| Publication Number | Publication Date |
|---|---|
| JP2015103909A JP2015103909A (en) | 2015-06-04 |
| JP2015103909A5 JP2015103909A5 (en) | 2017-01-05 |
| JP6234185B2 true JP6234185B2 (en) | 2017-11-22 |
Family
ID=53182462
Family Applications (1)
| Application Number | Title | Priority Date | Filing Date |
|---|---|---|---|
| JP2013241946A Expired - Fee Related JP6234185B2 (en) | 2013-11-22 | 2013-11-22 | Apparatus, method for controlling apparatus, and program |
Country Status (2)
| Country | Link |
|---|---|
| US (2) | US9699326B2 (en) |
| JP (1) | JP6234185B2 (en) |
Families Citing this family (11)
| Publication number | Priority date | Publication date | Assignee | Title |
|---|---|---|---|---|
| JP6234185B2 (en) * | 2013-11-22 | 2017-11-22 | キヤノン株式会社 | Apparatus, method for controlling apparatus, and program |
| JP6632250B2 (en) * | 2015-08-19 | 2020-01-22 | キヤノン株式会社 | Image processing apparatus, image processing method, and program |
| KR20170076335A (en) * | 2015-12-24 | 2017-07-04 | 에스프린팅솔루션 주식회사 | Image forming apparatus, guide providing method of thereof, cloud server and error analysing method of thereof |
| JP6646257B2 (en) * | 2016-02-08 | 2020-02-14 | 富士ゼロックス株式会社 | Terminal device, diagnostic system and program |
| JP6752614B2 (en) | 2016-04-28 | 2020-09-09 | キヤノン株式会社 | Image forming apparatus, image forming system, image forming apparatus control method, and program |
| JP7091677B2 (en) * | 2018-01-31 | 2022-06-28 | コニカミノルタ株式会社 | Image inspection equipment |
| JP2019174758A (en) * | 2018-03-29 | 2019-10-10 | 株式会社リコー | Failure diagnosis device, failure diagnosis method, failure diagnosis program, and failure diagnosis system |
| JP7039377B2 (en) * | 2018-04-18 | 2022-03-22 | キヤノン株式会社 | Information processing device, control method of information processing device, and program |
| JP7313897B2 (en) | 2019-05-09 | 2023-07-25 | キヤノン株式会社 | image forming device |
| JP7317594B2 (en) * | 2019-06-28 | 2023-07-31 | キヤノン株式会社 | image forming device |
| JP2022134809A (en) * | 2021-03-04 | 2022-09-15 | 株式会社リコー | Image inspection device and image forming apparatus |
Family Cites Families (14)
| Publication number | Priority date | Publication date | Assignee | Title |
|---|---|---|---|---|
| US5214470A (en) * | 1992-04-09 | 1993-05-25 | Xerox Corporation | Method and apparatus for compensating for dirt or etched areas on a document platen |
| JPH1139486A (en) * | 1997-07-24 | 1999-02-12 | Ricoh Co Ltd | Picture quality evaluating method for image |
| US6035072A (en) * | 1997-12-08 | 2000-03-07 | Read; Robert Lee | Mapping defects or dirt dynamically affecting an image acquisition device |
| JP3907847B2 (en) * | 1998-09-30 | 2007-04-18 | 株式会社リコー | Image processing device |
| US7183532B2 (en) * | 2001-04-30 | 2007-02-27 | Hewlett-Packard Development Company, L.P. | Detecting a defect in an image scanner |
| US20030090742A1 (en) * | 2001-10-26 | 2003-05-15 | Hiroaki Fukuda | Image processing apparatus and image scanning apparatus |
| US6873728B2 (en) * | 2002-01-16 | 2005-03-29 | Eastman Kodak Company | Vertical black line removal implementation |
| JP4334873B2 (en) * | 2003-01-15 | 2009-09-30 | 株式会社リコー | Dot measuring apparatus, dot measuring method and program |
| JP2005269432A (en) * | 2004-03-19 | 2005-09-29 | Sharp Corp | Image forming device and image formation system |
| US7465047B2 (en) * | 2005-05-09 | 2008-12-16 | Silverbrook Research Pty Ltd | Mobile telecommunication device with a printhead and media sheet position sensor |
| JP4687614B2 (en) * | 2005-09-20 | 2011-05-25 | 富士ゼロックス株式会社 | Failure diagnosis system, image forming apparatus, and failure diagnosis method |
| JP4872979B2 (en) * | 2008-07-25 | 2012-02-08 | 富士ゼロックス株式会社 | Image processing apparatus, image forming apparatus, and program |
| JP5598130B2 (en) | 2010-07-16 | 2014-10-01 | 富士ゼロックス株式会社 | Image quality abnormality inspection device, image quality abnormality inspection system, and program |
| JP6234185B2 (en) * | 2013-11-22 | 2017-11-22 | キヤノン株式会社 | Apparatus, method for controlling apparatus, and program |
-
2013
- 2013-11-22 JP JP2013241946A patent/JP6234185B2/en not_active Expired - Fee Related
-
2014
- 2014-11-19 US US14/548,176 patent/US9699326B2/en active Active
-
2017
- 2017-05-24 US US15/604,525 patent/US10397412B2/en not_active Expired - Fee Related
Also Published As
| Publication number | Publication date |
|---|---|
| JP2015103909A (en) | 2015-06-04 |
| US10397412B2 (en) | 2019-08-27 |
| US20150146264A1 (en) | 2015-05-28 |
| US9699326B2 (en) | 2017-07-04 |
| US20170257494A1 (en) | 2017-09-07 |
Similar Documents
| Publication | Publication Date | Title |
|---|---|---|
| JP6234185B2 (en) | Apparatus, method for controlling apparatus, and program | |
| JP4055385B2 (en) | Image inspection device | |
| JP6642161B2 (en) | Inspection device, inspection method and program | |
| US8223385B2 (en) | Printer job visualization | |
| US8150106B2 (en) | Printer characterization, monitoring and diagnosis using dynamic test patterns generated by sensing and analyzing customer documents | |
| US9143629B2 (en) | Systems and methods for streak detection in image array scanning | |
| US10187532B2 (en) | Image processing apparatus, image processing method, and storage medium | |
| KR102056967B1 (en) | Image forming apparatus, method for controlling image forming apparatus, image processing system, and program | |
| US10686945B2 (en) | Diagnosis system, diagnosis method and storage medium | |
| JP5919788B2 (en) | Image forming apparatus, printing system, and image adjustment method | |
| JP6632250B2 (en) | Image processing apparatus, image processing method, and program | |
| JP4529453B2 (en) | Image forming apparatus abnormality detection device, abnormality detection method, and abnormality detection program | |
| JP4517651B2 (en) | Image forming apparatus abnormality detection device, abnormality detection method, and abnormality detection program | |
| JP2017096835A (en) | Image inspection device and image forming system | |
| JP2016046595A (en) | Image processing apparatus, image processing method and program | |
| CN112565553A (en) | Image inspection device, image forming apparatus, image inspection method, and program | |
| JP2012078795A (en) | Image forming apparatus | |
| JP4415918B2 (en) | Image processing method and apparatus | |
| JP2016019244A (en) | Image processing system, image processing method and program | |
| JP2015085533A (en) | Image forming apparatus and abnormal image sample outputting method | |
| JP2016025646A (en) | Image processing device, image processing method, and program | |
| JP2021082938A (en) | Image diagnostic device, fault diagnostic device, and program | |
| JP2020008543A (en) | Inspection device, image reading device, image formation device, inspection method, and program | |
| JP2018078426A (en) | Image forming apparatus and method | |
| JP7263844B2 (en) | Image forming apparatus, abnormality identification method, abnormality identification program, and abnormality identification system |
Legal Events
| Date | Code | Title | Description |
|---|---|---|---|
| A521 | Request for written amendment filed |
Free format text: JAPANESE INTERMEDIATE CODE: A523 Effective date: 20161117 |
|
| A621 | Written request for application examination |
Free format text: JAPANESE INTERMEDIATE CODE: A621 Effective date: 20161117 |
|
| A977 | Report on retrieval |
Free format text: JAPANESE INTERMEDIATE CODE: A971007 Effective date: 20170804 |
|
| A131 | Notification of reasons for refusal |
Free format text: JAPANESE INTERMEDIATE CODE: A131 Effective date: 20170829 |
|
| A521 | Request for written amendment filed |
Free format text: JAPANESE INTERMEDIATE CODE: A523 Effective date: 20170913 |
|
| TRDD | Decision of grant or rejection written | ||
| A01 | Written decision to grant a patent or to grant a registration (utility model) |
Free format text: JAPANESE INTERMEDIATE CODE: A01 Effective date: 20170926 |
|
| A61 | First payment of annual fees (during grant procedure) |
Free format text: JAPANESE INTERMEDIATE CODE: A61 Effective date: 20171024 |
|
| R151 | Written notification of patent or utility model registration |
Ref document number: 6234185 Country of ref document: JP Free format text: JAPANESE INTERMEDIATE CODE: R151 |
|
| LAPS | Cancellation because of no payment of annual fees |