JP6016588B2 - Image processing apparatus, recording apparatus, and image processing method - Google Patents
Image processing apparatus, recording apparatus, and image processing method Download PDFInfo
- Publication number
- JP6016588B2 JP6016588B2 JP2012252265A JP2012252265A JP6016588B2 JP 6016588 B2 JP6016588 B2 JP 6016588B2 JP 2012252265 A JP2012252265 A JP 2012252265A JP 2012252265 A JP2012252265 A JP 2012252265A JP 6016588 B2 JP6016588 B2 JP 6016588B2
- Authority
- JP
- Japan
- Prior art keywords
- recording
- granularity
- unit
- quantization
- recording element
- Prior art date
- Legal status (The legal status is an assumption and is not a legal conclusion. Google has not performed a legal analysis and makes no representation as to the accuracy of the status listed.)
- Active
Links
- 238000012545 processing Methods 0.000 title claims description 185
- 238000003672 processing method Methods 0.000 title claims description 8
- 238000013139 quantization Methods 0.000 claims description 63
- 238000012937 correction Methods 0.000 claims description 44
- 238000005259 measurement Methods 0.000 claims description 25
- 238000001454 recorded image Methods 0.000 claims description 15
- 238000004364 calculation method Methods 0.000 claims description 6
- 235000019580 granularity Nutrition 0.000 description 134
- 238000000034 method Methods 0.000 description 68
- 239000000976 ink Substances 0.000 description 43
- 239000000758 substrate Substances 0.000 description 24
- 238000010586 diagram Methods 0.000 description 18
- 238000006243 chemical reaction Methods 0.000 description 16
- 210000003128 head Anatomy 0.000 description 9
- 238000004519 manufacturing process Methods 0.000 description 8
- 239000003086 colorant Substances 0.000 description 7
- 239000007787 solid Substances 0.000 description 6
- 230000000007 visual effect Effects 0.000 description 6
- 238000003860 storage Methods 0.000 description 5
- 230000005540 biological transmission Effects 0.000 description 3
- 230000007423 decrease Effects 0.000 description 3
- 238000009792 diffusion process Methods 0.000 description 3
- 239000011159 matrix material Substances 0.000 description 3
- 238000001228 spectrum Methods 0.000 description 3
- 238000012546 transfer Methods 0.000 description 3
- WBMKMLWMIQUJDP-STHHAXOLSA-N (4R,4aS,7aR,12bS)-4a,9-dihydroxy-3-prop-2-ynyl-2,4,5,6,7a,13-hexahydro-1H-4,12-methanobenzofuro[3,2-e]isoquinolin-7-one hydrochloride Chemical compound Cl.Oc1ccc2C[C@H]3N(CC#C)CC[C@@]45[C@@H](Oc1c24)C(=O)CC[C@@]35O WBMKMLWMIQUJDP-STHHAXOLSA-N 0.000 description 2
- 238000003491 array Methods 0.000 description 2
- 230000003247 decreasing effect Effects 0.000 description 2
- 230000031700 light absorption Effects 0.000 description 2
- 238000012935 Averaging Methods 0.000 description 1
- 239000006185 dispersion Substances 0.000 description 1
- 238000009826 distribution Methods 0.000 description 1
- 230000000694 effects Effects 0.000 description 1
- 238000002474 experimental method Methods 0.000 description 1
- 230000003287 optical effect Effects 0.000 description 1
Images


Classifications
-
- H—ELECTRICITY
- H04—ELECTRIC COMMUNICATION TECHNIQUE
- H04N—PICTORIAL COMMUNICATION, e.g. TELEVISION
- H04N1/00—Scanning, transmission or reproduction of documents or the like, e.g. facsimile transmission; Details thereof
- H04N1/46—Colour picture communication systems
-
- H—ELECTRICITY
- H04—ELECTRIC COMMUNICATION TECHNIQUE
- H04N—PICTORIAL COMMUNICATION, e.g. TELEVISION
- H04N1/00—Scanning, transmission or reproduction of documents or the like, e.g. facsimile transmission; Details thereof
- H04N1/40—Picture signal circuits
- H04N1/401—Compensating positionally unequal response of the pick-up or reproducing head
- H04N1/4015—Compensating positionally unequal response of the pick-up or reproducing head of the reproducing head
-
- H—ELECTRICITY
- H04—ELECTRIC COMMUNICATION TECHNIQUE
- H04N—PICTORIAL COMMUNICATION, e.g. TELEVISION
- H04N1/00—Scanning, transmission or reproduction of documents or the like, e.g. facsimile transmission; Details thereof
- H04N1/40—Picture signal circuits
- H04N1/405—Halftoning, i.e. converting the picture signal of a continuous-tone original into a corresponding signal showing only two levels
- H04N1/4051—Halftoning, i.e. converting the picture signal of a continuous-tone original into a corresponding signal showing only two levels producing a dispersed dots halftone pattern, the dots having substantially the same size
Description
本発明は、画像処理装置、記録装置および画像処理方法に関し、詳しくは、ヘッドシェーディングなど、記録素子間の記録特性のばらつきに起因した濃度むらを抑制するための補正処理が施された画像データに対する、ディザ法などによる量子化処理に関するものである。 The present invention relates to an image processing apparatus, a recording apparatus, and an image processing method, and more particularly, to image data that has been subjected to correction processing for suppressing density unevenness due to variations in recording characteristics between recording elements, such as head shading. The present invention relates to a quantization process using a dither method.
この種の濃度むらを抑制する補正処理の一例として、特許文献1に記載されるようなヘッドシェーディング(HS)技術が知られている。このHS技術は、記録素子としての、ノズル個々のインク吐出特性(記録特性)に関する情報に応じて補正を行う処理である。例えば、画像データに対して、あるノズルの吐出量が標準より多いという情報である場合には、そのノズルに対応した上記画像データが示す階調値を小さくする補正を行う。逆に、あるノズルの吐出量が標準より少ない場合には、そのノズルに対応した画像データが示す階調値を大きくする補正を行う。これにより、最終的に記録されるインクドットの数を増、減させ、画像データに対して記録画像において実現される濃度をノズル間でほぼ均一にすることができる。
As an example of correction processing for suppressing this type of density unevenness, a head shading (HS) technique as described in
しかしながら、上記HS技術などの補正処理を行うと、その補正された画像データが量子化されて最終的に記録されるドットの数が吐出量などの記録特性の大小に応じて異なるため、ドットの配置パターン、すなわち空間周波数が、記録素子間で異なることがある。その結果、記録素子ごとの濃度むらは低減できても、新たに記録素子間の空間周波数の違いによるむらを生じることがある。 However, when correction processing such as the HS technique is performed, the number of dots that are finally recorded after the corrected image data is quantized differs depending on the size of the recording characteristics such as the ejection amount. The arrangement pattern, that is, the spatial frequency may be different among the recording elements. As a result, even if the density unevenness of each recording element can be reduced, a new unevenness due to the difference in the spatial frequency between the recording elements may occur.
例えば、記録素子としてのノズルAのインク吐出量は標準であり、それに隣接するノズルBの吐出量は標準よりも多い場合、ノズルBが記録する位置にはノズルAによるドットよりも大きなドットが形成される。そして、このような記録ヘッドに対し、HS処理による補正を行うと、その補正したデータを量子化して得られる記録データに基づく記録では、ノズルBの記録位置には、ノズルAが記録するドットの数よりも少ない数のドットが記録される。この結果、ノズルAがドットを記録する一定の面積の領域とノズルBがドットを記録する同じ面積の領域との間でドット数が異なり、同じ量子化処理を行っても、それらのドット配置パターンが異なる。そして、このようなドット配置パターンの相違がドットの空間周波数の差となり、その差が周波数むらとして視認されることになる。すなわち、HS処理によって、ノズルごとの濃度むらは解決できても、記録されるドットの空間周波数がノズルごとに異なってしまい、その結果として周波数むらという新たな問題を派生する。 For example, when the ink discharge amount of the nozzle A as a recording element is standard and the discharge amount of the nozzle B adjacent thereto is larger than the standard, a dot larger than the dot by the nozzle A is formed at the position where the nozzle B records. Is done. When correction by HS processing is performed on such a recording head, in the recording based on the recording data obtained by quantizing the corrected data, the dot recorded by the nozzle A is located at the recording position of the nozzle B. A smaller number of dots is recorded. As a result, even if the number of dots is different between the area of a certain area where the nozzle A records dots and the area of the same area where the nozzle B records dots, even if the same quantization processing is performed, those dot arrangement patterns Is different. Such a difference in the dot arrangement pattern is a difference in dot spatial frequency, and the difference is visually recognized as frequency unevenness. That is, even if the density unevenness for each nozzle can be solved by the HS process, the spatial frequency of the recorded dots differs for each nozzle, resulting in a new problem of frequency unevenness.
本発明は、この問題を解決し、複数の記録素子を用いて画像を記録する際に、記録素子間の記録特性のばらつきを補正することに起因した周波数むらを低減することが可能な画像処理装置、記録装置および画像処理方法を提供することを目的とする。 The present invention solves this problem, and when image recording is performed using a plurality of recording elements, image processing capable of reducing frequency unevenness due to correction of variations in recording characteristics between recording elements It is an object to provide an apparatus, a recording apparatus, and an image processing method.
そのために本発明では、複数の記録素子を配列した記録素子列を用いて記録媒体に記録を行うための記録データを生成する画像処理装置であって、前記記録素子列の複数の記録素子を分割して得られる複数の記録素子群であって、記録媒体の互いに異なる単位領域を記録するために用いられる複数の記録素子群にそれぞれ対応した複数の処理単位のそれぞれについて、当該記録素子群の記録素子に対応した画素の画像データを当該記録素子群の記録素子の記録特性に応じて補正する補正手段と、前記単位領域に対応する記録素子群の記録素子の記録特性に基づいて、前記単位領域間の粒状度の差に関する情報を取得する取得手段と、前記補正手段によって補正された画像データを、量子化マスクを用いて量子化する手段であって、前記単位領域に対応する記録素子群のための画像データを量子化するための量子化マスクを、前記取得手段によって取得された前記情報に基づいて、空間周波数特性が異なる少なくとも2つの量子化マスクの中から選択して量子化を行う量子化手段と、を具えたことを特徴とする。 Therefore, in the present invention, an image processing apparatus for generating recording data for recording on a recording medium using a recording element array in which a plurality of recording elements are arranged, the plurality of recording elements in the recording element array being divided A plurality of recording element groups obtained by performing recording on the recording element group for each of a plurality of processing units respectively corresponding to the plurality of recording element groups used for recording different unit areas of the recording medium. Based on the recording means of the recording element of the recording element group corresponding to the unit area, the correction unit for correcting the image data of the pixel corresponding to the element according to the recording characteristic of the recording element of the recording element group, the unit area An acquisition means for acquiring information relating to a difference in granularity between the image data, and a means for quantizing the image data corrected by the correction means using a quantization mask; A quantization mask for quantizing the image data for the recording element group corresponding to is selected from at least two quantization masks having different spatial frequency characteristics based on the information acquired by the acquisition unit And a quantization means for performing quantization.
以上の構成によれば、処理単位ごとに記録素子群で記録した単位領域の記録画像において求められる粒状度の、単位領域の間の差がより小さくなる量子化マスクが、空間周波数特性が異なる量子化マスクの中から選択されて量子化が行われる。これにより、複数の記録素子を用いて画像を記録する際に、記録素子間の記録特性のばらつきを補正することに起因した周波数むらを低減することが可能となる。 According to the above configuration, the quantization mask in which the granularity required in the recorded image of the unit area recorded by the recording element group for each processing unit is smaller between the unit areas, the quantum mask having different spatial frequency characteristics. The quantization mask is selected and quantization is performed. As a result, when recording an image using a plurality of recording elements, it is possible to reduce frequency unevenness caused by correcting variations in recording characteristics among the recording elements.
以下、図面を参照して本発明の実施形態を詳細に説明する。 Hereinafter, embodiments of the present invention will be described in detail with reference to the drawings.
図1は、本発明の一実施形態に係るインクジェット記録装置であるプリンタを模式的に示す図である。本実施形態のプリンタはフルラインタイプの記録装置であり、図1に示すように、記録ヘッド101〜104を備える。記録ヘッド101〜104の夫々には、図2にて後述されるように、記録媒体106の幅に対応した同じ種類のインクを吐出する複数の、記録素子としてのノズルを図のx方向に配列したノズル列(記録素子列)が設けられている。記録ヘッド101〜104は、それぞれブラック(K)、シアン(C)、マゼンタ(M)、イエロー(Y)のインクを吐出する記録ヘッドである。これら複数種類のインクを吐出する記録ヘッド101〜104は、記録媒体の搬送方向である図のy方向に沿って配列している。
FIG. 1 is a diagram schematically illustrating a printer which is an ink jet recording apparatus according to an embodiment of the present invention. The printer of this embodiment is a full line type recording apparatus, and includes recording
図2は、記録ヘッド101〜104それぞれのノズル配列の詳細を示す図である。図2に示すように、それぞれの記録ヘッド(101)には、複数の吐出基板1011〜1013が、図1に示すx方向に沿って配列されている。そして、個々の吐出基板にノズルおよび吐出のための熱エネルギーを発生するヒータ、インク流路などが設けられている。それぞれの記録ヘッド(101)において、1つの吐出基板は、600dpiで図中x方向に配列する複数のノズルからなるノズル列を、相互に2400dpi相当の距離だけずれて4列配列している(不図示)。これにより、各記録ヘッドは、全体として2400dpiの密度でx方向に配列する複数のノズルからなるノズル列を構成している。すなわち、図2は、図示の簡略化のため、上記4列のノズル列をつなぎ合わせたノズル配列を、2400dpiの密度で配列する1列のノズル列(10111〜10114、10121〜10124、10131〜10134)として示している。また、図2は、1つの基板あたりのノズル数を、図示および説明の簡略化のため4つとして示している。
FIG. 2 is a diagram illustrating details of the nozzle arrangement of each of the
図1を再び参照すると、記録媒体106は、搬送ローラ105(および他の不図示のローラ)がモータ(不図示)の駆動力によって回転することにより、図中x方向と交差するy方向に搬送される。記録媒体106が搬送される間に、記録ヘッド101〜104それぞれの複数のノズルからは、記録媒体106の搬送速度に対応した周波数で、記録データに従った吐出動作が行われる。これにより、各色のドットが記録データに対応して所定の解像度で形成され、記録媒体106上に画像が記録される。
Referring again to FIG. 1, the
y方向における記録ヘッド101〜104よりも搬送方向下流側の位置には、スキャナ107が備えられている。このスキャナ107は、x方向に所定のピッチで読み取り素子を配列し、図8(a)にて後述されるHS処理の補正パラメータを生成する際に記録媒体に記録したパッチの濃度を読み取るなど、画像読み取りに用いられる。そして、読み取り結果としてRGBデータを出力する。
A
なお、本発明を適用可能な記録装置は、以上説明したフルラインタイプの装置に限られない。例えば、記録ヘッドやスキャナを記録媒体の搬送方向と交差する方向に走査して記録を行う、いわゆるシリアルタイプの記録装置にも本発明を適用することができる。また、本実施形態はインク色毎に記録ヘッドを備える例を用いているが、1つの記録ヘッドから複数色のインクを吐出する形態であってもよい。さらに、1つの吐出基板上に複数色のインクに対応したノズル列を配列した形態であってもよい。 The recording apparatus to which the present invention is applicable is not limited to the full line type apparatus described above. For example, the present invention can be applied to a so-called serial type recording apparatus in which recording is performed by scanning a recording head or a scanner in a direction intersecting the conveyance direction of the recording medium. Further, although this embodiment uses an example in which a recording head is provided for each ink color, a form in which a plurality of colors of ink are ejected from one recording head may be used. Furthermore, the form which arranged the nozzle row corresponding to the ink of multiple colors on one discharge substrate may be sufficient.
図3は、図1に示したプリンタとホスト装置としてのパーソナルコンピュータ(PC)300を有して構成される記録システムを示すブロック図である。 FIG. 3 is a block diagram showing a recording system including the printer shown in FIG. 1 and a personal computer (PC) 300 as a host device.
ホストPC300は、主に以下の要素を有して構成される。CPU301は、記憶部であるHDD303やRAM302に保持されているプログラムに従った処理を実行する。RAM302は、揮発性の記憶部であり、プログラムやデータを一時的に保持する。HDD303は、不揮発性の記憶部であり、同じくプログラムやデータを保持する。データ転送I/F(インターフェース)304はプリンタ100との間におけるデータの送受信を制御する。このデータ送受信の接続方式としては、USB、IEEE1394、LAN等を用いることができる。キーボード・マウスI/F305は、キーボードやマウス等のHID(Human Interface Device)を制御するI/Fであり、ユーザは、このI/Fを介して入力を行うことができる。ディスプレイI/F306は、ディスプレイ(不図示)における表示を制御する。
The
一方、プリンタ100は、主に以下の要素を有して構成される。CPU311は、ROM313やRAM312に保持されているプログラムに従い、後述するHS処理に関する実施形態の処理を実行する。RAM312は、揮発性の記憶部であり、プログラムやデータを一時的に保持する。ROM313は不揮発性の記憶部であり、後述するHS処理で使用するテーブルデータやプログラムを保持することができる。
On the other hand, the
データ転送I/F314はPC300との間におけるデータの送受信を制御する。ヘッドコントローラ315は、図1に示したそれぞれの記録ヘッド101〜104に対して記録データを供給するとともに、記録ヘッドの吐出動作を制御する。具体的には、ヘッドコントローラ315は、RAM312の所定のアドレスから制御パラメータと記録データを読み込む。そして、CPU311が、制御パラメータと記録データをRAM312の所定のアドレスに書き込むことにより、ヘッドコントローラ315によって処理が起動され、記録ヘッドからのインク吐出が行われる。スキャナコントローラ317は、図1に示したスキャナ107の個々の読み取り素子を制御しつつ、これらから得られたRGBデータをCPU311に出力する。
The data transfer I /
画像処理アクセラレータ316は、CPU311よりも高速に画像処理を実行可能なハードウェアである。具体的には、画像処理アクセラレータ316は、RAM312の所定のアドレスから画像処理に必要なパラメータとデータを読み込む。そして、CPU311が上記パラメータとデータをRAM312の上記所定のアドレスに書き込むことにより、画像処理アクセラレータ316が起動され、上記データに対し所定の画像処理が行われる。本実施形態では、後述されるHS処理部で用いる補正テーブルのパラメータを作成する処理をCPU311によるソフトウェアで行う。一方、HS処理部の処理を含む、記録の際の画像処理については、画像処理アクセラレータ316によるハードウェア処理で行う。なお、画像処理アクセラレータ316は必須な要素ではく、プリンタの仕様などに応じて、CPU311による処理のみで上記のテーブルパラメータの作成処理および画像処理を実行してもよいことはもちろんである。
The
以上説明した記録システムにおいて、複数のノズル間の吐出特性のばらつきに起因した濃度むらを補正するHS処理によって生じる空間周波数むらを低減するための実施形態を以下に説明する。 In the recording system described above, an embodiment for reducing spatial frequency unevenness caused by HS processing for correcting uneven density due to variations in ejection characteristics among a plurality of nozzles will be described below.
図4(a)および(b)は、HS処理の処理単位であるノズル群(記録素子群)の4つのノズルの吐出量が同じ記録ヘッドと、そこから吐出されたインクによって形成されるドットの配置パターンを説明する図である。図4(a)は、ブラックインクを吐出する記録ヘッド101におけるノズル配列を示している。同図は、説明および図示の簡略化のため、図2にて上述した記録ヘッドにおけるノズル列のうち、8つのノズルのみが示されている。それぞれ4つのノズル(10111〜10114、10121〜10124)からなるそれぞれのノズル群1011、1012は後述されるHS処理の処理単位に対応し、その配列密度は600dpiである。また、ノズル群1011、1012は、それぞれ相互に異なる吐出基板1011、1012におけるノズル群として示されている(図4(a)では、この点で、同じ参照符号を用いている)。以上の図4(a)に示す例は、各ノズル群の4つのノズルが同じ、標準的な吐出量で、かつノズル群間でも吐出量が同じ例を示している。
FIGS. 4A and 4B show the dots formed by the recording head having the same ejection amount of the four nozzles of the nozzle group (recording element group), which is the processing unit of the HS process, and the ink ejected therefrom. It is a figure explaining an arrangement pattern. FIG. 4A shows a nozzle arrangement in the
なお、以下の説明は、ノズル群の吐出基板が異なるか否かに係わらず妥当するものであることはそれらの説明から明らかである。すなわち、吐出基板が異なる場合、製造精度などの点から基板ごとに吐出特性(吐出量)が異なる場合があり得る。しかし、基板が同じであってもそれに設けられる複数のノズル間で、製造上の誤差や使用履歴などによって吐出特性が異なることがあり、このような場合にも本発明が適用できることはもちろんである。 In addition, it is clear from those explanations that the following explanation is appropriate regardless of whether or not the ejection substrates of the nozzle group are different. That is, when the discharge substrates are different, the discharge characteristics (discharge amount) may be different for each substrate in terms of manufacturing accuracy. However, even if the substrate is the same, the ejection characteristics may differ between a plurality of nozzles provided on the substrate due to manufacturing errors, usage histories, etc. Of course, the present invention can also be applied to such a case. .
図4(b)は、図4(a)に示す記録ヘッドを用いて、記録媒体106に記録された50%デューティのベタ画像におけるドット配置を示す図である。なお、図4(a)および(b)は、個々のノズルの大きさとそれぞれのノズルによって記録されるドットの大きさを、等しい大きさで示しているが、これは説明上両者を対比するためであって、実際の記録ヘッドないし装置においてこれらの大きさが等しいわけではないことはもちろんである。また、各ノズルからの吐出量はノズル径以外の原因によっても異なり得るものであるため、必ずしもノズル径が異なるとは限らないが、本図では、吐出量が大きいノズルを大きな円で示して説明する。
FIG. 4B is a diagram showing a dot arrangement in a solid image with 50% duty recorded on the
記録ヘッド101の8つのノズル10111〜10114、10121〜10124は、総て標準的な量のインクを標準的な方向に吐出可能であり、記録媒体106には同じ大きさのドットが一定の間隔で記録される。その結果、記録媒体106における、同じ所定の面積を有した領域1061および領域1062にそれぞれ記録されるドットの配置パターンは等しく、それぞれの領域間の空間周波数は等しいものとなる。つまり、HS処理単位に対応した、隣接するノズル群1011、1012で記録される領域1061と領域1062との間で空間周波数の差はなく、よって周波数むらは生じない。すなわち、この場合、HS処理単位のノズル群1011、1012それぞれの吐出量が標準的な量であることから、図8(a)にて後述される処理で生成されるHSパラメータは、補正量がゼロ(画像データの補正をしない)となるものである。その結果、50%デューティのベタ画像の画像データに対してHS処理を行っても、図4(b)に示すパターンと同じドット配置パターンが記録されることになる。
The eight
一方、図5(a)および(b)は、ノズル群1011とノズル群1012との間で、吐出量が異なる記録ヘッドと、そこから吐出されたインクによって記録されるドットの配置パターンを表す図であり、図4(a)および(b)と同様の図である。図5(b)に示すドット配置パターンも50%デューティのベタ画像の記録状態を示している。
On the other hand, FIGS. 5A and 5B are diagrams showing an arrangement pattern of dots recorded by the recording heads having different ejection amounts and the ink ejected therefrom, between the
ここで、図5(a)に示す記録ヘッドは、ノズル群1011の4つのノズル10111〜10114は標準の吐出量で、ノズル群1012の4つのノズル10121〜10124は標準よりも多い吐出量であるとする。このような記録ヘッドを用いる場合、上記ノズル群に対応した領域ごとに異なる濃度として視認されることがある。図に示す例では、ノズル群1011の4つのノズルを用いて記録される領域1061では、濃度が標準なベタ画像が記録される。一方、ノズル群1012の4つノズルを用いて記録される領域1062では、吐出量が多いことによって形成される個々のドットが標準の場合より大きくなり、領域1061に比べて濃度が高いベタ画像が記録される。つまり、領域1061と領域1062との間で、視認される濃度が異なることがある。なお、図5(b)に示す例は、各ノズル群の4つのノズル間で吐出量が同じ例を示しているが、4つのノズル間で吐出量が異なり、その結果、形成されるドットの大きさが異なることもあることはもちろんである。図5(b)に示す例は、説明を簡略化するための例示である。また、HS処理では、後述されるように、処理単位である各ノズル群の吐出特性(上例では吐出量)は4つのノズルの特性の平均で表されることから、各ノズル群について1つの吐出量として扱っても支障はない。
Here, in the recording head shown in FIG. 5A, the four
図5(a)および(b)で上述したような吐出特性を有する記録ヘッドを用いる場合、図8(a)で後述する処理で生成されるHSパラメータは、補正量がゼロでない(画像データの補正をする)ものである。そして、その結果として、HS処理では、補正量がゼロでない、画像データの補正が行われる。 When a recording head having the ejection characteristics as described above with reference to FIGS. 5A and 5B is used, the HS parameter generated in the process described later with reference to FIG. Correction). As a result, in the HS processing, correction of image data is performed with a correction amount that is not zero.
図6(a)および(b)は、このようにHS処理によって画像データの補正が行われた画像データに対して、ディザマスクの従来の適用を行って量子化したデータに基づく記録を説明する図である。 FIGS. 6A and 6B illustrate recording based on data quantized by applying a conventional dither mask to image data that has been corrected for image data by HS processing as described above. FIG.
図6(a)は、図5(a)と同じ内容を示しており、HS処理単位に対応するノズル群ごとに吐出特性(記録特性)が異なる記録ヘッドであることを示している。この記録ヘッドを用いる場合、HS処理では、ノズル群1012に対応する処理単位の画像データに対して、その画素値(階調値)を小さくする補正が行われる。より詳細には、処理単位の画像データにおける4つのノズルに対応するそれぞれの画素の階調値を小さくする補正が行われる。
FIG. 6A shows the same content as FIG. 5A and shows that the recording head has different ejection characteristics (recording characteristics) for each nozzle group corresponding to the HS processing unit. When this recording head is used, in the HS processing, correction is performed to reduce the pixel value (gradation value) of the image data of the processing unit corresponding to the
そして、このHSの補正が行われた画像データに対して、ディザマスクの従来の適用を行って量子化したデータに基づく記録を行うと、図6(b)に示すドットの配置が得られる。すなわち、ノズル群1012に対応する領域1062に記録されるドットの数が、ノズル群1011に対応する領域1061に記録されるドットの数よりも少なくなる記録が行われる。なお、図6(b)は、図5(b)に示す例と同じく、50%デューティのベタ画像の画像データを記録する例を示している。
When recording based on the quantized data by applying the conventional application of the dither mask to the image data subjected to the HS correction, the dot arrangement shown in FIG. 6B is obtained. That is, printing is performed in which the number of dots recorded in the
ここで、図において右側のノズル群1012のノズル10121〜10124から吐出されるインクで形成されるそれぞれのドットの面積が、左側のノズル群1011のノズル10111〜10114から吐出されるインクで形成されるそれぞれのドットの面積の2倍であるとする。この場合、HS処理によって、ノズル群1012のノズル10121〜10124それぞれで所定領域1062に記録するドットの数を、ノズル群1011のノズル10111〜10114それぞれで領域1061に記録するドットの数の約1/2(2ドット→1ドット)とする。この結果、記録媒体に対するドットの被覆面積を、領域間でほぼ同等にすることができる。このように、HS処理では、記録媒体上の領域ごとに検出される濃度がほぼ一様になるように、各領域に記録されるドット数を調整する。なお、実際には、被覆面積と検出される濃度は必ずしも比例関係になっていないが、本実施形態では、2倍の面積のドットの数を1/2とする例を用いて説明する。
Here, in the figure, the area of each dot formed by the ink ejected from the
図6(b)に示すように、HS処理で画像データが補正されない記録データに基づく領域1061では標準の大きさのドットが1つおきに規則正しく配置されている。図に示す例では、領域1061の単位面積(最大ドット数4×4=16)あたり8個のドットが配置されている。これに対し、HS処理で画像データの画素値が小さくされた記録データに基づく領域1062では標準より大きいドットが領域1061とは異なる(領域1061より疎となる)位置に配置されることになる。図に示す例では、単位面積あたり4個のドットが配置されている。このようにドットの配置パターンが異なることによって、領域ごとにドット配置の空間周波数が異なる。そして領域間での空間周波数の差が、周波数むらとなって視認されることがある。図6(b)に示す例では、領域1061のドット配置パターンはドットが密に並んでいるのでより高周波、領域1062のドット配置パターンはドットが疎に並んでいるのでより低周波となる。また、ドットが単位面積の半分以上を占めるようになると、ドットが配置されない部分が疎になるため、その空間周波数は低周波になる。つまり、ドットが全く記録されない領域と、ドットで埋め尽くされた領域の空間周波数は等しくなる。そして、このドット配置パターンの空間周波数から、ドットの粒状性を算出することができる。その算出方法は、例えば、既知のRMS粒状度やウィナースペクトルなどを用いることができる。
As shown in FIG. 6B, every other standard size dot is regularly arranged in the
以上説明したように、HS処理では、領域1061に記録されるドットの面積の和=領域1062に記録されるドットの面積の和となるように、記録されるドットの数が調整される。これにより、領域1061の光吸収特性によって観察される濃度が、領域1062の光吸収特性によって観察される濃度を等しくし、両方の領域はほぼ同色で同じ濃度として視認される。
As described above, in the HS process, the number of dots to be recorded is adjusted so that the sum of the areas of the dots recorded in the
しかしながら、上述したように、領域1061と領域1062とでは、ドット配置パターンが異なることによって空間周波数が異なり、それが周波数むらとして視認され記録画像の画質の低下を招くことがある。
However, as described above, the
なお、このような吐出特性のばらつきは、例えば大、中、小の3段階のドットによって記録を行う4値の記録装置など、ドットの大きさを変更できる多値の記録装置においても生じることがある。従って、2値の記録装置に限らず3値以上の多値記録装置にも本発明を適用することができる。 Such variation in ejection characteristics may also occur in a multi-value recording apparatus that can change the size of the dots, such as a four-value recording apparatus that performs recording using three stages of large, medium, and small dots. is there. Therefore, the present invention can be applied not only to a binary recording apparatus but also to a multi-value recording apparatus having three or more values.
以下で説明する本発明のそれぞれの実施形態は、量子化処理によって、以上のような空間周波数の差を低減するものである。 Each embodiment of the present invention described below reduces the above spatial frequency difference by quantization processing.
(第1実施形態)
図7は、本発明の第1実施形態にかかる、インクジェットプリンタが実行する画像処理の構成を示すブロック図である。すなわち、本実施形態は、図3に示したプリンタ100の制御、処理のための各要素によって画像処理部を構成するものである。なお、本発明の適用はこの形態に限られないことはもちろんである。例えば、図3に示したPC300において画像処理部が構成されてもよく、あるいは画像処理部の一部がPC300において構成され、その他の部分がプリンタ100において構成されてもよい。本明細書では、これらの画像処理部を画像処理装置と称する。
(First embodiment)
FIG. 7 is a block diagram showing a configuration of image processing executed by the ink jet printer according to the first embodiment of the present invention. That is, in this embodiment, an image processing unit is configured by each element for control and processing of the
図7に示すように、入力部401はホストPC300から受信した画像データを、画像処理部402へ出力する。画像処理部402は、入力色変換処理部403、インク色変換処理部404、HS処理部405、TRC処理部406、量子化処理部407を有して構成される。
As shown in FIG. 7, the
画像処理部402において、先ず、入力色変換処理部403は、入力部401から受信した入力画像データを、プリンタの色再現域に対応した画像データに変換する。入力する画像データは、本実施形態では、モニタの表現色であるsRGB等の色空間座標中の色座標(R,G,B)を示すデータである。入力色変換処理部403は、各8ビットのR,G,Bの入力画像データを、マトリクス演算処理や三次元LUTを用いた処理等、既知の手法によって、プリンタの色再現域の画像データ(R´,G´,B´)に変換する。本実施形態では、三次元ルックアップテーブル(3DLUT)を用い、これに補間演算を併用して変換処理を行う。なお、本実施形態において、画像処理部402において扱われる8ビットの画像データの解像度は2400dpiであり、量子化処理部407の量子化によって得られる2値データの解像度も2400dpiである。
In the
インク色変換処理部404は、入力色変換処理部403によって処理されたR、G、B各8ビットの画像データをプリンタで用いるインクの色信号データによる画像データに変換する。本実施形態のプリンタ100はブラック(K)、シアン(C)、マゼンタ(M)、イエロー(Y)のインクを用いることから、RGB信号の画像データは、K、C、M、Yの各8ビットの色信号からなる画像データに変換される。この色変換も、上述の入力色変換処理部と同様、三次元ルックアップテーブルに補間演算を併用して行う。なお、他の変換手法として、上述と同様、マトリクス演算処理等の手法を用いることもできる。
The ink color
HS(Head Shading)処理部405は、インク色信号の画像データを入力して、インク色ごとにそれぞれ8ビットデータに対して、上述したように、記録ヘッドを構成する各ノズルの吐出特性に応じた補正をする処理を行う。
An HS (Head Shading)
TRC(Tone Reproduction Curve)処理部406は、HS処理された各8ビットのインク色信号からなる画像データに対して、インク色毎に、出力部408で記録されるドットの数を調整するための補正を行う。一般に、記録媒体に記録されるドットの数と、その数のドットによって記録媒体で実現される光学濃度は線形関係にない。このため、TRC処理部407は、この関係を線形にすべく各8ビットの画像データを補正して記録媒体に記録されるドットの数を調整する。
A TRC (Tone Reproduction Curve)
量子化処理部407は、TRC処理部407で処理された各8ビット256値のインク色の画像データに対して量子化処理を行い、記録「1」または非記録「0」を表す1ビットの2値データを生成する。なお、例えば、8ビットの画像データを、直接2値データ(ドットデータ)に変換する形態に限られず、一度数ビットの多値データに量子化してから、ドット配列パターンを用いて最終的に2値データに変換する形態であってもよい。また、量子化処理の方法も、本実施形態のようにディザ法を用いてもよいし、誤差拡散法などの他の疑似中間調による処理化方法を用いてもよい。
The
この量子化処理部407は、図12以降で後述されるように、上記HS処理で補正するノズルの吐出特性のばらつき(違い)に応じて、その量子化処理の態様を切り替える。
As will be described later with reference to FIG. 12 and thereafter, the
出力部408は、量子化によって得られた2値データ(ドットデータ)に基づいて、記録ヘッドを駆動し記録媒体に各色のインクを吐出して記録を行う。本実施形態において、出力部408は、図1に示した記録ヘッド101〜104を備えた記録機構によって構成される。
Based on binary data (dot data) obtained by quantization, the
上述したHS処理部405で用いる補正パラメータの生成処理について次に説明する。HS処理は、記録媒体上の、HS処理単位に対応したノズル群で記録する単位領域ごとに測定される濃度に応じて生成される補正パラメータによって、その処理単位の画像データを補正する処理である。
The correction parameter generation process used in the above-described
図8(a)は、本実施形態のHS処理部405で用いる変換テーブルの補正パラメータを生成するための、CPU311が実行する処理を示すフローチャートである。本実施形態では、このパラメータ生成処理を、プリンタの製造時やプリンタを所定期間使用したとき、あるいは所定量の記録を行ったときに、強制的あるいは選択的に実行する。また、例えば、記録を行うたびに、その動作前に実行するようにしてもよい。すなわち、この生成処理はいわゆるキャリブレーションとして行うことができ、これにより、変換テーブルの内容であるテーブルパラメータを更新することができる。
FIG. 8A is a flowchart illustrating processing executed by the
HS処理部のテーブルパラメータ生成処理が開始されると、先ず、ステップS502で、図1に示した各記録ヘッドの総てのノズルからインクを吐出して記録媒体に測定用画像(パッチ)を記録する。この場合、C、M、Y、Kそれぞれについて、信号値が0または255の測定用画像を用いる。例えば、シアンインクの濃度を測定するための測定用画像は、(C,M,Y,K)=(255,0,0,0)とし、マゼンタインクの濃度を測定するための測定用画像は、(C,M,Y,K)=(0,255,0,0)とすることができる。 When the table parameter generation processing of the HS processing unit is started, first, in step S502, ink is ejected from all the nozzles of each recording head shown in FIG. 1 to record a measurement image (patch) on the recording medium. To do. In this case, for each of C, M, Y, and K, a measurement image with a signal value of 0 or 255 is used. For example, the measurement image for measuring the density of cyan ink is (C, M, Y, K) = (255, 0, 0, 0), and the measurement image for measuring the density of magenta ink is , (C, M, Y, K) = (0, 255, 0, 0).
以下、図7に示した各部に対応付けて、測定用画像の記録を説明する。測定用画像を記録する際、入力部401は、所定のメモリから測定用画像データを読み出す。この測定用画像データは、上述した、インク色C、M、Y、Kのデータである。そして、この測定用画像データは、入力色変換処理部403、インク色変換処理部404、HS処理部405の処理を経ずに、TRC処理部406に入力する(以下、デバイス色画像データD[X]という)。このような経路は、図7においてバイパス経路として破線409で示されている。バイパス経路による処理は、例えば入力値=出力値となるようなテーブルを用意し、デバイス色画像データD[X]はTRC処理部406に入力されるが、Xによらず入力値のまま出力されるような処理が行われてもよい。
Hereinafter, recording of the measurement image will be described in association with each unit illustrated in FIG. When recording a measurement image, the
その後、TRC処理部406、および後述する本実施形態のディザマスク切り替えをしない、通常の処理の量子化処理部407によって、通常の記録時の画像データに対する処理と同様の処理を行い、出力部408で記録媒体106に測定用画像を記録する。
Thereafter, the
ここで、Xは、HS処理の処理単位を特定する値であり、処理単位のx方向における位置を示している。すなわち、Xは、図1で示した記録ヘッド101〜104それぞれにおいて、x方向に配列する複数のノズルを、4ノズルからなるノズル群に分けたときの各ノズル群に対応する画像データを補正する際の処理単位を示している。そして、デバイス色画像データD[X]は、処理単位Xに対応する4ノズルで記録するべき4ノズルそれぞれに対応した画像データである。 Here, X is a value that identifies the processing unit of the HS processing, and indicates the position of the processing unit in the x direction. That is, X corrects image data corresponding to each nozzle group when a plurality of nozzles arranged in the x direction are divided into nozzle groups each consisting of four nozzles in each of the recording heads 101 to 104 shown in FIG. The processing unit is shown. The device color image data D [X] is image data corresponding to each of the four nozzles to be recorded by the four nozzles corresponding to the processing unit X.
図9(a)は、処理単位ごとの対応するノズル群を示している。これらノズル群ごとに、その処理単位の画像データに対してHS処理を行うための、補正パラメータとしての一次元ルックアップテーブルが割り当てられている。 FIG. 9A shows a corresponding nozzle group for each processing unit. For each of these nozzle groups, a one-dimensional lookup table is assigned as a correction parameter for performing HS processing on the image data of the processing unit.
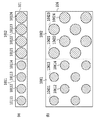
図9(b)は、上述したステップS502で記録された測定用画像の記録状態を説明する図である。それぞれのノズル群に対応した単位領域(以下、「エリア」ともいう)は、HS処理の処理単位Xに対応付けられている。図9(b)に示す例は、ノズルのうち、第2エリア1012に対応する第2ノズル群1012の4つのノズルが標準より多い吐出量である例を示している。その結果、吐出量が標準より多いノズルを含む第2エリアの濃度が他のエリアの標準的な濃度より高い測定用画像が記録される。
FIG. 9B illustrates the recording state of the measurement image recorded in step S502 described above. A unit area (hereinafter also referred to as “area”) corresponding to each nozzle group is associated with a processing unit X of HS processing. The example illustrated in FIG. 9B illustrates an example in which four nozzles of the
再び図8(a)を参照すると、次のステップS503では、ステップS502で記録媒体106に記録された測定用画像の濃度をスキャナ107で測定し、エリア[X]ごとの濃度情報B[X]を得る。本実施形態において、スキャナの解像度すなわちスキャナに配列する読み取り素子の配列ピッチは特に限定されるものではない。記録ヘッドの記録解像度2400dpiより高解像であってもよいし低解像であっても良い。また、スキャナ107は、図1で示したように、必ずしも記録ヘッドと同様のフルラインタイプでなく、図1のx方向に移動しながら所定の周期で側色を行うシリアルタイプのものであっても良い。また、プリンタとは別体に用意されているスキャナであっても構わない。この場合、例えば、スキャナとプリンタを信号接続しスキャナから測定結果を自動的に入力するようにしてもよい。さらに、濃度情報B[X]は、必ずしもRGB情報でなくてもよく、例えば、測色器で測定したL*a*b*等、いずれの形式であってもよい。どのような形態でどのような解像度で測色を行うにせよ、平均化などの様々な処理を施すことによって、4ノズル分に相当するエリアの測色結果B[X]が適切に得られれば、本実施形態に適用することができる。このように、デバイス色画像データD[X]が測定用画像として記録媒体に記録され、図1に示した記録ヘッド101により記録される。そして、スキャナ107によって、各ノズル群(本実施形態では4ノズル)に対応したエリア(単位領域)ごとに、濃度情報B[X]が取得される。ちなみに、記録ヘッド101はブラックインクを吐出する記録ヘッドであり、そのデバイス色画像データD[X]を(C,M,Y,K)=(0,0,0,255)とすれば、ブラックインクのみを吐出した測定用画像となる。
Referring to FIG. 8A again, in the next step S503, the density of the measurement image recorded on the
以下、第1エリアに対応する処理単位をX=1、第2エリアに対応する処理単位をX=2で特定し、また、第1エリアの濃度情報をB[1]=(R1,G1,B1)、第2エリアの濃度情報をB[2]=(R2,G2,B2)として説明する。 Hereinafter, the processing unit corresponding to the first area is specified by X = 1, the processing unit corresponding to the second area is specified by X = 2, and the density information of the first area is B [1] = (R1, G1, B1), the density information of the second area will be described as B [2] = (R2, G2, B2).
ステップS504では、目標濃度A=(Rt,Gt,Bt)とステップS503で取得した濃度色情報B[X]から、エリア[X]の濃度変動量T[X]を算出する。ここで、目標濃度Aは、例えばブラックインクの場合、(C,M,Y,K)=(0,0,0,0)の信号を、本実施形態のプリンタで記録および測色した場合の目標となる測色値である。実際には、標準吐出量のノズルを用いて記録した画像をスキャナ107で測色した結果とすることができる。
In step S504, the density variation amount T [X] of the area [X] is calculated from the target density A = (Rt, Gt, Bt) and the density color information B [X] acquired in step S503. Here, the target density A is, for example, in the case of black ink, when the signal of (C, M, Y, K) = (0, 0, 0, 0) is recorded and measured by the printer of this embodiment. This is the target colorimetric value. Actually, it is possible to obtain a result obtained by measuring the color of an image recorded using a nozzle having a standard discharge amount by the
本処理では、最初に、濃度色情報B[X]と目標濃度Aの差分を濃度差分量S[X]とし、その値を算出する。
濃度差分量S[1]=B[1]−A=(R1−Rt,G1−Gt,B1−Bt)
濃度差分量S[2]=B[2]−A=(R2−Rt,G2−Gt,B2−Bt)
本実施形態において、第1エリアに対応する第1ノズル群(図9(a))は、標準吐出量であるので、基本的にR1=Rt、G1=Gt、B1=Btとなり、濃度差分量はS[1]=0となる。一方、第2エリアに対応するノズル群は、標準より大きな吐出量で記録されるので、目標濃度A(Rt,Gt,Bt)より値の小さい(濃度の高い)値が検出される。次に、この濃度差分量Sから濃度変動量Tを求める。これは、目標濃度(標準吐出量)と比較した吐出量の変動量を相対的に表したものであり、標準吐出量からの増減割合で示す。図10は、各エリア[X]に対する濃度変動量T[X]の関係を示す図である。濃度変動量Tの算出方法は、予め濃度差分量Sと濃度変動量Tの関係をテーブルデータ化しておきテーブル判定で求めてもよいし、例えば濃度差分量S[X]/目標濃度Aのように関数的に求めてもよい。
In this process, first, the difference between the density color information B [X] and the target density A is set as a density difference amount S [X], and the value is calculated.
Density difference amount S [1] = B [1] -A = (R1-Rt, G1-Gt, B1-Bt)
Density difference amount S [2] = B [2] -A = (R2-Rt, G2-Gt, B2-Bt)
In the present embodiment, since the first nozzle group (FIG. 9A) corresponding to the first area has the standard discharge amount, R1 = Rt, G1 = Gt, and B1 = Bt, and the density difference amount. Becomes S [1] = 0. On the other hand, since the nozzle group corresponding to the second area is recorded with a discharge amount larger than the standard, a value smaller (higher density) than the target density A (Rt, Gt, Bt) is detected. Next, a density fluctuation amount T is obtained from the density difference amount S. This relatively represents the fluctuation amount of the discharge amount compared with the target density (standard discharge amount), and is indicated by a rate of increase / decrease from the standard discharge amount. FIG. 10 is a diagram illustrating the relationship of the density variation amount T [X] with respect to each area [X]. As a method of calculating the density fluctuation amount T, the relationship between the density difference amount S and the density fluctuation amount T may be converted into table data in advance and obtained by table determination. For example, density difference amount S [X] / target density A It may be obtained functionally.
再び図8(a)を参照すると、次に、ステップS505で、各エリア[X]の濃度変動量T[X]から、吐出量レベル値H[X]を求める。本実施形態では、簡単に、濃度変動量T[X]に対する閾値判定を行い、その結果に応じて吐出量レベル値H[X]を決定する。この閾値判定は、図10に示すように、濃度変動量がどの範囲(・・・、0%〜+5%、5%〜+10%、・・・)に属するかに応じて吐出量レベル値H[X]を定めるものである。例えば、標準的な吐出量に比べて吐出量が+2%のエリア[8]では、図11に示すように吐出量レベル値が3となる。次に、以上のように求めた吐出量レベル値H[X]に基づいて、プリンタ100のRAM312に、予め保持してある、吐出量に応じた複数の一次元ルックアップテーブルの中から、一次元ルックアップテーブルを決定する。図11は、この決定された、各エリア[X]に対する吐出量レベル値H[X]の関係を示す図である。例えば、図10に示す例において、標準的な吐出量に比べて吐出量が+2%のエリア[8]では、図11に示すように吐出量レベル値が3となる。そして、この吐出量レベル値3に対応して、HDD303に保持された3番目の一次元ルックアップテーブルを選択し、このテーブルをエリア[8]に適用する。ところで、濃度変動量T[X]からエリアごとの一次元ルックアップテーブルを決定する方法は、上述した閾値判定だけでなく、濃度変動量T[X]に応じて動的に作成してもよい。
Referring to FIG. 8A again, next, in step S505, the discharge amount level value H [X] is obtained from the density variation amount T [X] of each area [X]. In the present embodiment, the threshold value determination for the density fluctuation amount T [X] is simply performed, and the discharge amount level value H [X] is determined according to the result. In this threshold determination, as shown in FIG. 10, the discharge amount level value H depends on which range (..., 0% to + 5%, 5% to + 10%,. [X] is determined. For example, in area [8] where the discharge amount is + 2% compared to the standard discharge amount, the discharge amount level value is 3 as shown in FIG. Next, based on the discharge amount level value H [X] obtained as described above, a primary is selected from a plurality of one-dimensional lookup tables corresponding to the discharge amount, which is stored in the
次に、ステップS506では、処理単位Xに対応するエリア[X]の吐出量レベル値H[X]から決定された、処理単位Xごとの一次元ルックアップテーブルを、HS処理の補正パラメータとし、これをRAM312に記憶する。
Next, in step S506, the one-dimensional lookup table for each processing unit X determined from the discharge amount level value H [X] of the area [X] corresponding to the processing unit X is used as a correction parameter for HS processing. This is stored in the
図8(b)は、図8(a)に示す処理で生成した補正パラメータを用いたHS処理およびそれに基づく記録処理を示すフローチャートである。図7にて上述したように、HS処理部405は、先ず、ステップS507で、処理単位Xごとにそれに対応する補正パラメータを用いて、デバイス色画像データD[X]を補正し、補正後のデバイス色画像データD’[X]を生成する。詳しくは、デバイス色画像データD[X]における4つの画素それぞれの画素値を、処理単位Xに対応する同じ補正パラメータで補正し、4つの画素の補正後のそれぞれの画素値からなるデバイス色画像データD’[X]を得る。
FIG. 8B is a flowchart showing the HS process using the correction parameter generated by the process shown in FIG. 8A and the recording process based on the HS process. As described above with reference to FIG. 7, the
次に、ステップS508で、この画像データD’[X]の4つの画素の画素値に対して、TRC処理部406の処理および、量子化処理部407による、図12以降で後述される、ディザマスクの切り替え処理を含む量子化処理を行い、出力部408で記録媒体106に画像を記録する。なお、上例では、HSの処理単位を4ノズルからなるノズル群に対応するものとしたが、処理単位に対応するノズルの数は問わない。また、記録ヘッド全域に渡って吐出量を判定した結果は、PC303のHDD303に格納しておく。これは、後述する量子化処理の切り換えにおいて、参照するパラメータとなる。
Next, in step S508, dithering, which will be described later in FIG. 12 and later, is performed on the pixel values of the four pixels of the image data D ′ [X] by the processing of the
以上説明したHS処理の補正パラメータの生成では、図6(a)に示したノズル群1012の4つのノズル10121〜10124の場合、図6(b)の領域1062に示すように、ドット数が約半数に抑えられるようなパラメータが作成される。また、ノズル群1011の4つのノズル10111〜10114の場合、図6(b)の領域1061に示すように、ドット数が変更されないようなパラメータが作成される。つまり、吐出量レベル値が標準値に比べて大きいほど、記録媒体に記録するドット数は低減される。一方、吐出量レベル値が標準値に比べて小さいほど、記録媒体に記録するドット数は増加される。
In the generation of the correction parameter for the HS processing described above, in the case of the four
以上説明したように、処理単位XごとにHS処理を行うことにより、ドット数制御が行われる。それにより、それぞれの処理単位に対応するエリア間で濃度はおおよそ一様になる。しかし、図6(b)などで前述したように、エリア[X]ごとに、ドット配置パターンの空間周波数が異なることがある。その結果、そのエリア[X]間の周波数の差が周波数むらとなって現れる。このドット配置パターンの差が大きいほど、周波数むらの視認性が高まる。つまり、図11において、吐出量レベル値H[X]のそれぞれの差分値が大きいほど、周波数むらが大きくなる。 As described above, the dot number control is performed by performing the HS process for each processing unit X. Thereby, the density is approximately uniform between the areas corresponding to the respective processing units. However, as described above with reference to FIG. 6B and the like, the spatial frequency of the dot arrangement pattern may be different for each area [X]. As a result, the frequency difference between the areas [X] appears as frequency unevenness. The greater the difference in dot arrangement pattern, the higher the visibility of frequency unevenness. That is, in FIG. 11, the frequency unevenness increases as the difference value of each discharge amount level value H [X] increases.
以下に、本発明の一実施形態に係る、量子化処理の切り変えによって周波数むらを低減する処理ついて説明する。最初に、図11に示したエリア[X]の吐出量レベル値H[X]から、吐出量のばらつき度合い(吐出量の差)を算出する。上述したように、この吐出量のばらつき度合いが大きいと、記録媒体に記録される画像の周波数むらが視認されやすくなり、逆にばらつき度合いが小さいと周波数むらは視認されにくくなる。 Hereinafter, processing for reducing frequency unevenness by switching quantization processing according to an embodiment of the present invention will be described. First, the degree of variation in the discharge amount (difference in discharge amount) is calculated from the discharge amount level value H [X] in the area [X] shown in FIG. As described above, when the variation degree of the ejection amount is large, the frequency unevenness of the image recorded on the recording medium is easily recognized, and conversely, when the variation degree is small, the frequency unevenness becomes difficult to be visually recognized.
本実施形態では、吐出量のばらつき度合いを、吐出量レベル値H[X]の最大値と最小値との差分として定義する。図11に示すような吐出量レベル値H[X]の分布では、最大値が第3エリアの吐出量レベル値H[3]=5であり、最小値が第4エリアの吐出量レベル値H[4]=1となる。従って、吐出量レベル値の差分値ΔHは、
吐出量レベル値の差分値ΔH=|H[3]−H[4]|=4
となる。この差分値が大きいほど、記録媒体に記録される画像のドット配置パターンが異なる。一方、吐出量レベル値H[X]の最大値と最小値との差がない場合、すなわちΔH=0の場合、エリア[X]間の吐出量差はほぼ均一であり、HS処理を行っても周波数むらは発生しにくい。
In the present embodiment, the degree of variation in the discharge amount is defined as the difference between the maximum value and the minimum value of the discharge amount level value H [X]. In the distribution of the discharge amount level value H [X] as shown in FIG. 11, the maximum value is the discharge amount level value H [3] = 5 of the third area, and the minimum value is the discharge amount level value H of the fourth area. [4] = 1. Therefore, the difference value ΔH of the discharge amount level value is
Difference value ΔH = | H [3] −H [4] | = 4 of the discharge amount level value
It becomes. The larger the difference value, the different the dot arrangement pattern of the image recorded on the recording medium. On the other hand, when there is no difference between the maximum value and the minimum value of the discharge amount level value H [X], that is, when ΔH = 0, the discharge amount difference between the areas [X] is almost uniform, and the HS process is performed. However, frequency unevenness is less likely to occur.
なお、吐出量のばらつき度合いは、上述のように吐出量レベル値H[X]の最大値と最小値の差分でもよいし、各エリア[X]ごとに隣接する吐出量レベル値H[X]の差分値を総和した値と定義してもよい。また、比較する吐出量レベル値は隣接する値に限らず、例えば、記録媒体に記録される画像において、任意の距離ごとに吐出量レベル値H[X]を抽出し、その差分値を総和した値として定義してもよい。この任意の距離とは、例えば人間の視覚特性を考慮した距離が一例として考えられる。人間の目には、およそ1.0cycle/mmの空間周波数のむらが最も視認しやすい。これを考慮して、むらが最も視認しやすい距離を設定し、その距離ごとの吐出量レベル値H[X]の差分値を取ってもよい。算出された吐出量のばらつき度合いは、プリンタ100のRAM312に格納される。
The degree of variation in the discharge amount may be the difference between the maximum value and the minimum value of the discharge amount level value H [X] as described above, or the discharge amount level value H [X] adjacent to each area [X]. May be defined as the sum of the difference values. Further, the discharge amount level values to be compared are not limited to adjacent values. For example, in the image recorded on the recording medium, the discharge amount level value H [X] is extracted for each arbitrary distance, and the difference values are summed. It may be defined as a value. As this arbitrary distance, for example, a distance in consideration of human visual characteristics can be considered as an example. For human eyes, the unevenness of the spatial frequency of about 1.0 cycle / mm is the most visible. In consideration of this, a distance where unevenness is most visible can be set, and a difference value of the discharge amount level value H [X] for each distance may be taken. The calculated variation degree of the ejection amount is stored in the
量子化処理部407における量子化処理の切り換えは、以上説した吐出量のばらつき度合いに応じて行う。具体的には、例えば、PC300のHDD303から複数のディザマスクを予め読み出してこれらをプリンタ100のRAM312に保持しておく。保持しておく複数のディザマスクは、空間周波数の異なるマスクである。そして、吐出量のばらつき度合いに基づいて、周波数むらが最も低減される1つのディザマスクを選択する。ここで、ディザマスクの空間周波数とは、本実施形態では、8ビットの画像データの画素値である階調値の範囲0〜255の中央値128を入力したときに、ドットを記録する旨の2値データ“1”を出力するそれぞれのディザ閾値の配置パターンの空間周波数と定義されるものである。
Switching of the quantization processing in the
一般的に、空間周波数の高いディザマスクほど、それによって量子化された記録データに基づく記録画像は粒状性の低い高画質な画像となる。ところが、空間周波数の高いディザマスクを用いると、ドット数またはそれらの配置が異なる2種類のドット配置パターンがある場合、その空間周波数の差分値、すなわち粒状度の違いが大きくなる。一方、空間周波数の低いディザマスクほど記録媒体に記録される画像の粒状性は高くなるが、ドット数またはそれらの配置が異なる2種類のドット配置パターンがある場合、その粒状度の違いは空間周波数の高いディザマスクを用いる場合に比べて小さくなる。 In general, the higher the spatial frequency of the dither mask, the higher the quality of the recorded image based on the recording data quantized thereby. However, when a dither mask having a high spatial frequency is used, if there are two types of dot arrangement patterns having different numbers of dots or their arrangement, the difference in spatial frequency, that is, the difference in granularity becomes large. On the other hand, the dither mask with a lower spatial frequency has a higher granularity of the image recorded on the recording medium, but when there are two types of dot arrangement patterns with different numbers of dots or their arrangement, the difference in granularity is the spatial frequency. This is smaller than when using a high dither mask.
以下に、このようなドット配置パターンの違いに起因した粒状度の違いが、空間周波数の低いディザマスクほど小さくなる、という着想に基づいたディザマスクの切り換えについて説明する。以下の説明では、標準的な吐出量(吐出量差0%)に対して、吐出量が10%多いノズル群(最大吐出ノズル群)、吐出量が10%少ないノズル群(最小吐出ノズル群)を例に挙げる。そして、これらのうち2つのノズル群からなるドット配置パターンの空間周波数の差を周波数むらとする。
In the following, dither mask switching based on the idea that the difference in granularity due to such a difference in dot arrangement pattern becomes smaller as the dither mask with a lower spatial frequency is described. In the following description, a nozzle group (maximum discharge nozzle group) having a
先ず、空間周波数の異なる複数のディザマスクを予め定め、これらをRAM312に格納する。先ず、一例として、吐出量が標準的な場合のノズル群に対して、粒状度を最も低くすることができるディザマスクAを用意する。このディザマスクAを基準とし、その閾値配置パターンの空間周波数を所定量低くしたディザマスクをディザマスクBとする。本実施形態で用意するディザマスクは少なくとも2つ以上を用意する。ディザマスクAを基準に、さらに段階的に空間周波数を低くしていったものを、ディザマスクC、ディザマスクDとして複数用意することが望ましい。
First, a plurality of dither masks having different spatial frequencies are determined in advance and stored in the
次に、吐出量が異なる複数のノズル群を用意する。例えば、標準的なノズル群、最大吐出量のノズル群、最小吐出量のノズル群ほか、吐出量が段階的に多くあることが望ましい。 Next, a plurality of nozzle groups having different discharge amounts are prepared. For example, it is desirable that the discharge amount be increased stepwise in addition to a standard nozzle group, a nozzle group having a maximum discharge amount, and a nozzle group having a minimum discharge amount.
そして、画像処理部402(図7)において、例えば、図8(a)にて前述したように、HS処理405(図7)を実行せず、また、上記用意した複数のディザマスクを切り替えて用いて量子化を行い、その結果に基づいて、上記複数のノズル群を用いて記録媒体に画像をそれぞれ記録する。記録画像は、図8(a)にて前述したように、測定用画像が望ましい。 Then, in the image processing unit 402 (FIG. 7), for example, as described above with reference to FIG. 8A, the HS processing 405 (FIG. 7) is not executed, and the prepared dither masks are switched. Quantization is performed, and based on the result, an image is recorded on the recording medium using the plurality of nozzle groups. The recorded image is preferably a measurement image as described above with reference to FIG.
以上の処理によって、ディザマスクの個数とノズル群の個数を乗算した数の測定用画像が記録される。そして、それぞれの測定用画像をスキャナ107で読み取り、読み取り結果に基づいてディザマスクと吐出量との組み合わせごとの粒状度を算出する。この結果をテーブルパラメータとして、プリンタ100のRAM312に格納しておく。これにより、ノズル群の吐出量が分かれば、各ディザマスクを用いた量子化による記録画像の粒状度を得ることができる。
Through the above processing, the number of measurement images is recorded by multiplying the number of dither masks by the number of nozzle groups. Then, each measurement image is read by the
さらに、本実施形態では、画質的に許容できる粒状度を予め調べておき、粒状度閾値を作成しておく。これは、実際に様々な粒状度の画像を記録し、人間の視覚にどの粒状度まで許容できるか否かによって実験的に求めることができる。この粒状度閾値をRThとする。上述したディザマスクA〜Dに対して、最大吐出量のノズル群と最小吐出量のノズル群における粒状度をそれぞれ求め、これらと粒状度閾値RThと比較する。そして、粒状度が、粒状度閾値RThを下回るディザマスクのみを、プリンタ100のRAM312に保持しておく。例えば、ディザマスクA、Bの粒状度は粒状度閾値RThを下回り、ディザマスクC、Dの粒状度が粒状度閾値RThを上回る場合、RAM312にはディザマスクA、Bのみを保持する。これにより、吐出量が製造工程においてばらつく範囲内(+10%〜−10%)であれば、RAM312に格納されているディザマスクのいずれかを使用することにより、記録される画像の粒状度は許容できる範囲内のものとなる。
Furthermore, in this embodiment, granularity that is acceptable in terms of image quality is checked in advance, and a granularity threshold value is created. This can be experimentally obtained by actually recording images with various granularities and determining to what granularity human vision is acceptable. Let this granularity threshold be RTh. With respect to the dither masks A to D described above, the granularities in the nozzle group with the maximum discharge amount and the nozzle group with the minimum discharge amount are respectively obtained and compared with the granularity threshold value RTh. Only the dither mask whose granularity is lower than the granularity threshold value RTh is held in the
以上のように、ディザマスクと吐出量の組み合わせごとの粒状度を記載したテーブルパラメータを保持することにより、画像を記録媒体に記録することなく、粒状度を求めることができる。 As described above, by holding the table parameters describing the granularity for each combination of the dither mask and the discharge amount, the granularity can be obtained without recording an image on a recording medium.
次に、以上のようにして用意された複数のディザマスクの中から、周波数むらを低減する最適なディザマスクを選択する。先ず、予め人間の目に周波数むらとして視認できる閾値の粒状度差を定めておく。これは、記録媒体に記録された異なる2つのドット配置パターンを用い、その粒状度差を算出する。このような粒状度差が異なる複数のドット配置パターンの組についてそれらの粒状度差を求める。そして、粒状度差を順に変化させて行き、周波数むらとして視認できる粒状度差の最小値を判定閾値ΔRThとする。このようにΔRThは実験的に求めることが望ましいが、その方法は問わない。本実施形態では、ΔRTh=3として以下に説明する。 Next, an optimum dither mask that reduces frequency unevenness is selected from the plurality of dither masks prepared as described above. First, a granularity difference of threshold values that can be visually recognized as human frequency unevenness is determined in advance. This uses two different dot arrangement patterns recorded on the recording medium and calculates the granularity difference. The granularity difference is obtained for a group of a plurality of dot arrangement patterns having different granularity differences. Then, the granularity difference is sequentially changed, and the minimum value of the granularity difference that can be visually recognized as frequency unevenness is set as a determination threshold value ΔRTh. As described above, ΔRTh is desirably obtained experimentally, but the method is not limited. In the present embodiment, the following description will be made assuming that ΔRTh = 3.
図12は、吐出量レベル値が異なる2つのノズル群によって、空間周波数が異なる2つのディザマスクA、Bによって量子化された記録データに基づき、それぞれ記録されるドット配置パターンを説明する図である。ここでは、ディザマスクのサイズは16×16画素(=256画素)とし、量子化される画像データの画素値は総ての画素について「128」である。また、ディザマスクAは、上述したように高周波マスクで、ディザマスクBがディザマスクAに比べて低周波のマスクである。画素値が「128」の画像データの入力に対して、吐出量が標準的な場合のノズル群についてはHS処理で補正がなされずにそのままの、画素値が「128」の画像データが出力される。この画像データに対する量子化において、吐出量が標準的な場合のノズル群に対して最も粒状度を低くできるディザマスクAと、それより周波数が低いディザマスクBを用いると、それぞれ図12(a)、(b)に示すドット配置パターンが得られる。これらの図を比較して明らかなように、ディザマスクAで形成されるドット配置パターンの方が、ディザマスクBのそれに比べて、空間周波数は高くなる。また、同じ画素値が「128」の画像データの入力に対して、吐出量が最大吐出量レベルのノズル群についてはHS処理で画素値が小さくされる補正がなされて、画素値が「115」の画像データが出力される。この画像データに対する量子化において、同じく、ディザマスクAとディザマスクBを用いると、それぞれ図12(c)、(d)に示すドット配置パターンが得られる。 FIG. 12 is a diagram for explaining dot arrangement patterns to be recorded based on recording data quantized by two dither masks A and B having different spatial frequencies by two nozzle groups having different ejection amount level values. . Here, the size of the dither mask is 16 × 16 pixels (= 256 pixels), and the pixel value of the image data to be quantized is “128” for all the pixels. The dither mask A is a high frequency mask as described above, and the dither mask B is a low frequency mask compared to the dither mask A. With respect to the input of image data with a pixel value of “128”, for the nozzle group when the ejection amount is standard, the image data with the pixel value of “128” is output without being corrected by the HS processing. The In the quantization of the image data, when the dither mask A that can reduce the granularity to the lowest nozzle group and the dither mask B that has a lower frequency than that of the nozzle group when the discharge amount is standard are used, FIG. , (B) dot arrangement pattern is obtained. As is clear from comparison of these figures, the spatial frequency of the dot arrangement pattern formed by the dither mask A is higher than that of the dither mask B. Further, with respect to the input of image data having the same pixel value “128”, correction is performed to reduce the pixel value by HS processing for the nozzle group having the maximum discharge amount, and the pixel value is “115”. Image data is output. Similarly, when the dither mask A and the dither mask B are used in the quantization for the image data, the dot arrangement patterns shown in FIGS. 12C and 12D are obtained, respectively.
上記で比較される2つのノズル群の吐出量は、図10に示すように、0%と+10%であるため、言い換えれば10%の吐出量差がある。標準吐出レベルのノズル群が128ドット打つ場合、記録媒体に記録される濃度とドット数が比例関係にあると仮定すると、HS処理によって、最大吐出レベルのノズル群に対応する画素値「128」は、90%の画素値「115」に補正される。そして、その補正された画像データディザマスクを用いて量子化されそれに基づいて記録が行われる。この場合の、ディザマスクA、Bで形成されるドットの配置パターンは、それぞれ図12(c)、(d)に示すものとなる。 As shown in FIG. 10, the discharge amounts of the two nozzle groups compared above are 0% and + 10%. In other words, there is a discharge amount difference of 10%. When the nozzle group of the standard discharge level hits 128 dots, assuming that the density recorded on the recording medium and the number of dots are in a proportional relationship, the pixel value “128” corresponding to the nozzle group of the maximum discharge level is obtained by HS processing. , 90% of the pixel value is corrected to “115”. Then, quantization is performed using the corrected image data dither mask, and recording is performed based on the quantized image data dither mask. In this case, the arrangement patterns of the dots formed by the dither masks A and B are as shown in FIGS. 12C and 12D, respectively.
図13(a)および(b)は、上記で示した標準吐出量レベルと最大吐出量レベルにおける、ドット配置パターンの空間周波数特性を説明する図である。これらの図の横軸はドット配置パターンの空間周波数、縦軸はその周波数成分(スペクトル)を示している。図13(a)はディザマスクAを、図13(b)はディザマスクBをそれぞれ用いる場合の周波数特性を示している。また、図13(a)および(b)において、標準吐出量レベルの周波数特性が実線で示され、最大吐出量レベルの周波数特性が点線で示されている。さらに、これらの図において、スペクトルが現れる周波数、すなわち、ドット配置パターンの空間周波数をそれぞれfA115、fA128で示されている。 FIGS. 13A and 13B are diagrams illustrating the spatial frequency characteristics of the dot arrangement pattern at the standard discharge amount level and the maximum discharge amount level shown above. In these figures, the horizontal axis indicates the spatial frequency of the dot arrangement pattern, and the vertical axis indicates the frequency component (spectrum). FIG. 13A shows frequency characteristics when the dither mask A is used, and FIG. 13B shows frequency characteristics when the dither mask B is used. In FIGS. 13A and 13B, the frequency characteristic of the standard discharge amount level is indicated by a solid line, and the frequency characteristic of the maximum discharge amount level is indicated by a dotted line. Furthermore, in these figures, the frequencies at which the spectrum appears, that is, the spatial frequencies of the dot arrangement pattern are indicated by fA115 and fA128, respectively.
図13(a)および(b)において、ディザマスクAとディザマスクBによる特性を最大吐出量レベルにおいて比較すると、ディザマスクAの方が高周波であるため、fA115>fB115である。また、標準吐出量レベルにおいて比較しても、ディザマスクAの方が空間周波数は高く、fA128>fB128の関係である。 13A and 13B, when the characteristics of the dither mask A and the dither mask B are compared at the maximum discharge amount level, since the dither mask A has a higher frequency, fA115> fB115. Further, even when compared at the standard discharge amount level, the dither mask A has a higher spatial frequency and has a relationship of fA128> fB128.
ところで、一般にディザマスクは、それによって形成されるドット配置パターンが、ドット数が0から255まで増えるに従い、その空間周波数も一様に上がり、およそ中間階調において最も高周波になるよう設計される。それに従えば、高周波数のディザマスクほど、ドット数の変化による空間周波数の差Δfが大きくなる。ドット数が128ドットと115ドットでの、ディザマスクA、Bの空間周波数の差をそれぞれΔfA、ΔfBとすると、
ΔfA=fA128−fA115
ΔfB=fB128−fB115
となり、図13(a)および(b)に示すように、ΔfA>ΔfBとなる。
By the way, in general, the dither mask is designed so that the dot arrangement pattern formed thereby increases the spatial frequency uniformly as the number of dots increases from 0 to 255, and becomes the highest frequency in the middle gradation. According to this, the higher the frequency dither mask, the larger the spatial frequency difference Δf due to the change in the number of dots. When the difference in spatial frequency between the dither masks A and B when the number of dots is 128 dots and 115 dots is ΔfA and ΔfB, respectively,
ΔfA = fA128−fA115
ΔfB = fB128−fB115
Thus, as shown in FIGS. 13A and 13B, ΔfA> ΔfB.
すなわち、空間周波数が低いディザマスクBの方が、ドット数ないしドット配置パターンが変化した場合の、ドット配置パターン間の周波数差は小さくなる。換言すれば、空間周波数が低いディザマスクを用いることによって、異なるドット配置パターンの空間周波数の差を低減することができる。このように、吐出量差が大きいほど、空間周波数の低いディザマスクを使用することにより、粒状度差、すなわち周波数むらを低減することができる。 That is, the dither mask B having a lower spatial frequency has a smaller frequency difference between the dot arrangement patterns when the number of dots or the dot arrangement pattern changes. In other words, the use of a dither mask having a low spatial frequency can reduce the spatial frequency difference between different dot arrangement patterns. As described above, the larger the ejection amount difference is, the more the granularity difference, that is, the frequency unevenness can be reduced by using the dither mask having a lower spatial frequency.
図11に示すように、エリア[X]ごとに吐出量レベル値が決定され、これに基づいて、デバイス画像データの階調値に対してディザマスクA、Bで量子化処理した場合のドットの数、すなわちドット配置パターンを求めることができる。その結果、ディザマスクごとにエリア[X]における粒状度を決定することができる。 As shown in FIG. 11, the ejection amount level value is determined for each area [X], and based on this, the dot values when the gradation values of the device image data are quantized with the dither masks A and B are used. The number, that is, the dot arrangement pattern can be obtained. As a result, the granularity in the area [X] can be determined for each dither mask.
図14は、図11に示すエリア[X]ごとの吐出量レベルから求めた、ディザマスクAとディザマスクBで量子化した場合の粒状度差を示す図である。ディザマスクAを用いた場合の、エリア[X]における粒状度をRa[X]とし、隣接するエリア間の粒状度差をΔRa[X]とするとき、以下のように粒状度差を求めることができる。
粒状度差ΔRa[X]=|Ra[X]−Ra[X−1]|
図において、このディザマスクAを用いた場合の粒状度差は黒丸で示されている。ディザマスクBにおける粒状度差ΔRb[X]も、同様に求めることができ、図において、ディザマスクBを用いた場合の粒状度差は白丸で示されている。
FIG. 14 is a diagram showing the granularity difference when quantized with the dither mask A and the dither mask B, obtained from the ejection amount level for each area [X] shown in FIG. When the granularity in the area [X] is Ra [X] and the granularity difference between adjacent areas is ΔRa [X] when the dither mask A is used, the granularity difference is obtained as follows. Can do.
Granularity difference ΔRa [X] = | Ra [X] −Ra [X−1] |
In the figure, the granularity difference when this dither mask A is used is indicated by black circles. The granularity difference ΔRb [X] in the dither mask B can be obtained in the same manner. In the figure, the granularity difference when the dither mask B is used is indicated by white circles.
図14に示すディザマスクAを用いた場合の例において、ΔRa[X]が最も大きいのは、第2エリアと第3エリアとの間の粒状度差ΔRa[2]と、第3エリアと第4エリアとの間の粒状度差ΔRa[3]であり、その値は4である。一方、ディザマスクAを用いた場合の粒状度差ΔRb[X]が最も大きい位置は、ディザマスクAと同様にX=2とX=3であるが、その値は2である。 In the example using the dither mask A shown in FIG. 14, ΔRa [X] has the largest granularity difference ΔRa [2] between the second area and the third area, and the third area and the second area. The granularity difference ΔRa [3] between the four areas is 4, and the value thereof is 4. On the other hand, the position where the granularity difference ΔRb [X] is the largest when the dither mask A is used is X = 2 and X = 3 as in the dither mask A, but the value is 2.
ここで、上述したように、粒状度差の視認限界ΔRThを本実施形態ではΔRTh=3としている。図14において、ΔRa[X]の最大値は4であり、ΔRThを超える。つまり、図11に示す例の吐出量レベルにおいてディザマスクAを使用すると、第2エリアと第3エリアの間で周波数むらが視認されることになる。一方、ディザマスクBに係るΔRb[X]の最大値は2であるため、総てのエリアに渡ってΔRThを超えるエリアが存在しない。すなわち、視認される周波数むらが生じないことになる。また、ディザマスクBは、図11に示す吐出量レベルにおいて、予め定めた画質的に許容できる粒状度閾値を下回っているので、ディザマスクBを使用することにより、粒状度を許容しつつ周波数むらを視認限界以下に低減することができる。 Here, as described above, the visual recognition limit ΔRTh of the granularity difference is set to ΔRTh = 3 in the present embodiment. In FIG. 14, the maximum value of ΔRa [X] is 4, which exceeds ΔRTh. That is, when the dither mask A is used at the discharge amount level in the example shown in FIG. 11, frequency unevenness is visually recognized between the second area and the third area. On the other hand, since the maximum value of ΔRb [X] related to the dither mask B is 2, there is no area exceeding ΔRTh over all areas. That is, the frequency unevenness that is visually recognized does not occur. Further, since the dither mask B is lower than a predetermined granularity threshold that is acceptable in terms of image quality at the ejection amount level shown in FIG. 11, by using the dither mask B, frequency unevenness is allowed while allowing granularity. Can be reduced below the visual recognition limit.
図15は、以上説明した、周波数むらを低減するディザマスクを選択する処理を示すフローチャートである。先ず、ステップS602で、PC300のHDD303から読み出してRAM312に保持している複数のディザマスクの中から最も空間周波数の高い1つのディザマスクを選択する。次に、ステップS603で、選択されたディザマスクと、エリアごとの吐出量レベル値T[X]とから、上述したテーブルを参照して、粒状度R[X]を求める。さらに、ステップS604で、隣接する各エリア間の粒状度差ΔR[X]をエリア全域にわたって算出する。
FIG. 15 is a flowchart showing the above-described processing for selecting a dither mask that reduces frequency unevenness. First, in step S602, one dither mask having the highest spatial frequency is selected from a plurality of dither masks read from the
ステップS605では、ステップS604で求めた粒状度ΔR[X]の中の最大値を求め、この最大粒状度差と判定閾値ΔRThと比較する。ΔR[X]の最大値が閾値ΔRThを下回れば、選択しているディザマスクを使用することを決定し、処理を終了する。一方、ΔR[X]の最大値が閾値ΔRTh以上のときは、ステップS606で、選択しているディザマスクより空間周波数が低いディザマスクがRAM312にあるか否かを判定する。ないときは、選択しているディザマスクを使用することを決定し、処理を終了する。空間周波数がより低いディザマスクがあるときは、ステップS607で、選択中のディザマスクより空間周波数が1段階低いディザマスクを選択する。そして、ステップS603に戻り、新しく選択されたディザマスクについて上記処理を繰り返す。
In step S605, the maximum value of the granularity ΔR [X] obtained in step S604 is obtained, and this maximum granularity difference is compared with the determination threshold value ΔRTh. If the maximum value of ΔR [X] is below the threshold value ΔRTh, it is decided to use the selected dither mask, and the process is terminated. On the other hand, when the maximum value of ΔR [X] is equal to or larger than the threshold value ΔRTh, it is determined in step S606 whether or not the
以上の処理によって、粒状度が許容できる複数のディザマスクの中から、周波数むらが視認限界を下回る中で画像を記録できるディザマスクを決定することができる。その結果、決定されたディザマスクを量子化処理部407で使用することにより、HS処理405を行ったことにより発生する周波数むらを、粒状度の許容範囲内で低減することができる。
By the above processing, a dither mask capable of recording an image can be determined from among a plurality of dither masks whose granularity is allowable, while the frequency unevenness is below the visual recognition limit. As a result, by using the determined dither mask in the
以上のように、ディザマスクと吐出量レベル値H[X]の組み合わせから粒状度を算出するテーブルパラメータを予め保持しておき、最大吐出量レベル値での粒状度と最小吐出量レベル値での粒状度の差分値ΔRから最適なディザマスクを選択する方法について述べた。本実施形態では、ΔR[X]を算出する際に、隣接したエリア間で差分を取ったが、上述したように人間の視覚特性を考慮し、例えば記録媒体上で1.0cycle/mmの間隔で差分を取ってもよい。本発明では、ディザマスクを用いて説明を行ったが、それに限らず、誤差拡散法などの他の疑似中間調処理を用いてもよい。さらには、粒状度の差分ではなく、最大吐出量レベル値での粒状度と最小吐出量レベル値での粒状度の比率を用いてもよい。 As described above, table parameters for calculating the granularity from the combination of the dither mask and the discharge amount level value H [X] are stored in advance, and the granularity at the maximum discharge amount level value and the minimum discharge amount level value are stored. The method for selecting the optimum dither mask from the difference value ΔR of the granularity has been described. In this embodiment, when calculating ΔR [X], a difference is taken between adjacent areas. However, as described above, human visual characteristics are taken into account, for example, an interval of 1.0 cycle / mm on a recording medium. You may take the difference. Although the present invention has been described using a dither mask, the present invention is not limited to this, and other pseudo halftone processing such as an error diffusion method may be used. Furthermore, the ratio of the granularity at the maximum discharge amount level value and the granularity at the minimum discharge amount level value may be used instead of the difference in granularity.
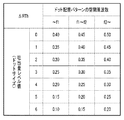
なお、本実施形態において、記録ヘッドの吐出量が標準(0%)に比べて+10%〜−10%の範囲でばらつくプリントシステムA、+16%〜−16%の範囲でばらつくプリントシステムBを想定し、粒状度のシミュレートを行った。まず、空間周波数が異なる4つのディザマスクA、B、C、D(256×256画素)を用意する。ディザマスクAとは一般的に知られるブルーノイズマスクであり、その空間周波数に対して、空間周波数を3.125%下げたマスクをディザマスクB、6.25%下げたマスクをディザマスクC、9.375%下げたマスクをディザマスクDとする。それらを用いて、吐出量が+10%のノズル群と+16%のノズル群における、それぞれの粒状度Rを算出した。その結果を図16に示す。ここで、入力されるインク信号値は160(8bit)とした。本実験では、許容できる粒状度閾値をRThが1.00になるよう、算出された粒状度を規格化している。図16から分かるように、ディザマスクAは高画質な高周波マスクのため、吐出量が標準(0%)から最大吐出量+16%までばらついても、その粒状度Rは全て許容できる範囲内にある。また、ディザマスクBも粒状度Rは全て許容できる。一方、ディザマスクCまで空間周波数が下がると、標準吐出量(0%)のヘッドでは粒状度Rが許容できるものの、+10%ではその粒状度Rが許容限界RThを超えてしまう。図16より、プリントシステムA、Bにおいては、ディザマスクA、Bを使用する限りでは、それらの粒状度は許容できるが、ディザマスクC以上に空間周波数が下がるマスクでは、使用できないことが言える。 In this embodiment, a printing system A in which the ejection amount of the recording head varies in a range of + 10% to −10% and a printing system B in a range of + 16% to −16% as compared with the standard (0%) is assumed. Then, the granularity was simulated. First, four dither masks A, B, C, and D (256 × 256 pixels) having different spatial frequencies are prepared. The dither mask A is a generally known blue noise mask. A dither mask B is a mask obtained by lowering the spatial frequency by 3.125% with respect to the spatial frequency, and a dither mask C is provided by reducing the mask by 6.25%. 9. A dither mask D is a mask lowered by 375%. Using these, the granularity R of each of the nozzle group having a discharge amount of + 10% and the nozzle group having a + 16% was calculated. The result is shown in FIG. Here, the input ink signal value is 160 (8 bits). In this experiment, the calculated granularity is normalized so that the allowable granularity threshold is RTh 1.00. As can be seen from FIG. 16, since the dither mask A is a high-quality high-frequency mask, even if the discharge amount varies from the standard (0%) to the maximum discharge amount + 16%, the granularity R is all within an allowable range. . Also, the dither mask B can accept all the granularities R. On the other hand, when the spatial frequency is reduced to the dither mask C, the granularity R is acceptable for the standard ejection amount (0%) head, but at + 10%, the granularity R exceeds the allowable limit RTh. From FIG. 16, it can be said that the printing systems A and B can accept the granularity as long as the dither masks A and B are used, but cannot use the mask with a spatial frequency lower than that of the dither mask C.
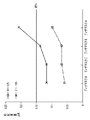
次に、図17に、上記4つのディザマスクにおける、プリントシステムAとBの粒状度差ΔRとの関係を示す。図中の実線は、プリントシステムAにおいて標準吐出量(0%)と最大吐出量(+10%)の粒状度差ΔRを、図中の破線は、プリントシステムBにおいて標準吐出量(0%)と最大吐出量(+16%)の粒状度差ΔRをそれぞれ表す。ここで、許容できる粒状度差ΔRThを図中に示す値(0.15)とする。この値は経験的に求めればよい。全てのディザマスクにおいて、吐出量差が16%の粒状度差の方が、10%の粒状度差より値が大きくなっている。これは前述したとおり、吐出量の差が大きい方が、記録媒体上で視認される粒状度の差も大きくなってしまうことを示している。図17から、ディザマスクAにおける吐出量16%の粒状度差が、許容できる粒状度差ΔRThを上回ってしまうことが分かる。すなわち、標準吐出量のヘッドと最大吐出量+16%のヘッドが隣接した場合、ディザマスクAを使用すると、周波数むらが目立ってしまうと言える。 Next, FIG. 17 shows the relationship between the granularity difference ΔR between the printing systems A and B in the above four dither masks. The solid line in the drawing indicates the granularity difference ΔR between the standard discharge amount (0%) and the maximum discharge amount (+ 10%) in the printing system A, and the broken line in the drawing indicates the standard discharge amount (0%) in the printing system B. This represents the granularity difference ΔR of the maximum discharge amount (+ 16%). Here, the allowable granularity difference ΔRTh is set to a value (0.15) shown in the figure. This value may be obtained empirically. In all dither masks, the granularity difference with a discharge amount difference of 16% has a larger value than the granularity difference of 10%. As described above, this indicates that the larger the difference in ejection amount, the larger the difference in granularity visually recognized on the recording medium. From FIG. 17, it can be seen that the granularity difference of 16% discharge amount in the dither mask A exceeds the allowable granularity difference ΔRTh. That is, when the head with the standard discharge amount and the head with the maximum discharge amount + 16% are adjacent, using the dither mask A, it can be said that the frequency unevenness becomes conspicuous.
ディザマスクを指定する場合、図16に示す許容できる粒状度RThと、図17に示す許容できる粒状度差ΔRThの両方を満たさなければ、プリントシステムで使用することはできない。上記2つの図より、プリントシステムAにおいては、ディザマスクAとBを使用することができる。ただし、ディザマスクAの方が高画質な高周波マスクのため、この場合はディザマスクAを用いることが望ましい。一方、プリントシステムBの場合、ディザマスクAを使用すると、許容できる粒状度差ΔRThを超えてしまう。すなわち周波数むらが視認されてしまうことになる。この場合はディザマスクBを使用することにより、RTh、ΔRThともに満たすことができる。 When the dither mask is designated, it cannot be used in the printing system unless both the allowable granularity RTh shown in FIG. 16 and the allowable granularity difference ΔRTh shown in FIG. 17 are satisfied. From the above two drawings, the dither masks A and B can be used in the printing system A. However, since the dither mask A is a high-frequency mask with higher image quality, it is desirable to use the dither mask A in this case. On the other hand, in the case of the printing system B, if the dither mask A is used, the allowable granularity difference ΔRTh is exceeded. That is, frequency unevenness will be visually recognized. In this case, by using the dither mask B, both RTh and ΔRTh can be satisfied.
図18および図19は、プリントシステムAにおける吐出量が−10%、プリントシステムBにおける吐出量が−16%の場合を示す図である。吐出量が標準より減少する記録ヘッドを用いても、上記と定性的に同様のことが言える。 18 and 19 are diagrams illustrating a case where the ejection amount in the printing system A is -10% and the ejection amount in the printing system B is -16%. The same can be said qualitatively as described above even when a recording head whose discharge amount is reduced from the standard is used.
以上説明したように、本実施形態によれば、複数ノズルを用いて画像を記録する際に、複数のノズル間の吐出特性のばらつきをHS処理にて補正したことに起因するドット配置パターンの違い、すなわち周波数むらを低減することが可能となる。すなわち、この周波数むらを低減するために、ノズル間の吐出特性から粒状度を算出し、隣接するエリア間の粒状度差を求める。この粒状度差に応じて、予め保持した複数の量子化処理の中から1つを選択し、量子化処理を行う。これにより、従来のHS処理では解決できなかった、周波数むらを低減することができる。高画質化を図る上では、単位領域は1ノズルに対応する領域であることが望ましいが、処理速度やメモリ容量を考慮して適宜領域を設定することが可能である。 As described above, according to the present embodiment, when an image is recorded using a plurality of nozzles, the difference in dot arrangement pattern resulting from correcting the variation in ejection characteristics between the plurality of nozzles by HS processing. That is, it becomes possible to reduce frequency unevenness. That is, in order to reduce this frequency unevenness, the granularity is calculated from the ejection characteristics between nozzles, and the granularity difference between adjacent areas is obtained. In accordance with the granularity difference, one is selected from a plurality of quantization processes held in advance, and the quantization process is performed. As a result, frequency unevenness that cannot be solved by the conventional HS processing can be reduced. In order to achieve high image quality, the unit area is desirably an area corresponding to one nozzle, but it is possible to set the area appropriately in consideration of the processing speed and the memory capacity.
また、以上では、HS処理の処理単位に対応するノズル群の4つのノズルが総て同じ吐出量である場合を例に説明したが、1つのノズル群の中で各ノズルの吐出特性がまちまちであることは十分あり得る。このような場合であっても、同一エリアにおける平均の粒状度を取得し、それに基づく色差を4つのノズルの全てによって補正するような変換処理を行えば、上述した効果を得ることができる。 In the above description, the case where all the four nozzles of the nozzle group corresponding to the processing unit of the HS process have the same discharge amount has been described as an example. However, the discharge characteristics of each nozzle in the nozzle group vary. There can be enough. Even in such a case, the above-described effects can be obtained by obtaining an average granularity in the same area and performing a conversion process in which the color difference based on the average granularity is corrected by all four nozzles.
また、周波数むらを低減できるディザマスクを複数保持することは、記録ヘッドの製造工程によって発生する吐出量のばらつきの制限値(本実施形態では+10%〜−10%)を上げることも可能になる。図16、17を用いて説明する。仮にディザマスクAしか持たないプリントシステムの場合、図17に示すように吐出量のばらつきが+10%生じる記録ヘッドを使用する限りにおいては、粒状度差ΔRはΔRThを下回り、周波数むらを発生させることなく画像を記録することができる。一方、吐出量のばらつきが+16%生じる記録ヘッドになると、粒状度差ΔRがΔRThを上回ってしまう。この場合、プリントシステムにディザマスクAしか所持していないと、吐出量のばらつきが+16%〜−16%の記録ヘッドは、粒状度の最大値がたとえ許容できる粒状度(RTh)を下回っていても、使用できないことになる。ところが、図17のようにディザマスクBを持つことにより、たとえ吐出量のばらつきが+16%%生じる記録ヘッドであっても、許容できる粒状度(RTh)を満たしつつ粒状度差ΔRをΔRTh以下に抑えることができる。つまり、空間周波数の異なるディザマスクを複数持つことで、従来に比べて記録ヘッドの製造工程における吐出量のばらつきの制限値を上げることが可能となる。 In addition, holding a plurality of dither masks that can reduce frequency unevenness can increase the limit value of the variation in the ejection amount generated in the recording head manufacturing process (in this embodiment, + 10% to −10%). . This will be described with reference to FIGS. If the printing system has only the dither mask A, as shown in FIG. 17, the granularity difference ΔR will be less than ΔRTh and cause frequency unevenness as long as the recording head in which the variation in ejection amount is + 10% is used. An image can be recorded without any problem. On the other hand, when the recording head has a variation in ejection amount of + 16%, the granularity difference ΔR exceeds ΔRTh. In this case, if only the dither mask A is possessed in the printing system, the maximum granularity of the recording head having a variation in ejection amount of + 16% to −16% is below the allowable granularity (RTh). Will be unusable. However, by having the dither mask B as shown in FIG. 17, even with a recording head in which the variation in the ejection amount is + 16%%, the granularity difference ΔR is made ΔRTh or less while satisfying the acceptable granularity (RTh). Can be suppressed. That is, by providing a plurality of dither masks having different spatial frequencies, it becomes possible to increase the limit value of the variation in the ejection amount in the manufacturing process of the recording head as compared with the conventional case.
(第2実施形態)
上述した第1の実施形態では、エリア[X]ごとの粒状度R[X]を求める際に、予め作成したテーブルパラメータを参照する例について説明した。本実施形態では、任意のディザマスクを選択し、測定用画像を記録媒体に記録し、それをスキャナで読み取り、その読み取り結果からエリア[X]ごとの粒状度R[X]を求める例に関するものである。
(Second Embodiment)
In the first embodiment described above, an example in which a table parameter created in advance is referred to when the granularity R [X] for each area [X] is obtained has been described. The present embodiment relates to an example in which an arbitrary dither mask is selected, a measurement image is recorded on a recording medium, read by a scanner, and a granularity R [X] for each area [X] is obtained from the read result. It is.
図20は、本実施形態に係るディザマスクを選択する処理を示すフローチャートである。先ず、ステップS702で、HS処理405を行い、その処理単位に対応するノズル群の吐出特性に応じて画像データの補正を行う。次に、ステップS703で、PC300のHDD303から読み出してRAM312に保持している複数のディザマスクの中から最も空間周波数の高い1つを選択し、画像処理アクセラレータ316に設定する。そして、ステップS704で、TRC処理406と、選択しているディザマスクによる量子化処理407を行い、記録媒体に画像を記録する。
FIG. 20 is a flowchart showing processing for selecting a dither mask according to the present embodiment. First, in step S702, HS processing 405 is performed, and image data is corrected according to the ejection characteristics of the nozzle group corresponding to the processing unit. In step S <b> 703, one of the plurality of dither masks read from the
次に、ステップS705で、記録された画像をスキャナで読み取り、エリアごとに粒状度R[X]を算出する。さらに、ステップS706で、隣接する各エリア間の粒状度差ΔR[X]をエリア全域に渡って算出する。 In step S705, the recorded image is read by a scanner, and the granularity R [X] is calculated for each area. In step S706, the granularity difference ΔR [X] between adjacent areas is calculated over the entire area.
ステップS707では、以上のように求めた粒状度差ΔR[X]の最大値を求め、閾値ΔRThと比較する。粒状度差ΔR[X]の最大値がΔRThを下回れば、選択しているディザマスクを使用することを決定し、処理を終了する。粒状度差ΔR[X]の最大値がΔRTh以下であるときは、ステップS708で、選択しているディザマスクより空間周波数が低いディザマスクがRAM312にあるか否かを判定する。ないときは、選択しているディザマスクを使用することを決定し、本処理を終了する。より空間周波数が低いディザマスクがあるときは、ステップS709で、選択しているディザマスクより空間周波数が1段階低いディザマスクを選択し、画像処理アクセラレータ316に設定する。続いて再びステップS704に戻り、新しく選択されたディザマスクにて上記処理を繰り返す。
In step S707, the maximum value of the granularity difference ΔR [X] obtained as described above is obtained and compared with the threshold value ΔRTh. If the maximum value of the granularity difference ΔR [X] is less than ΔRTh, it is decided to use the selected dither mask, and the process is terminated. If the maximum value of the granularity difference ΔR [X] is equal to or less than ΔRTh, it is determined in step S708 whether or not the
以上の処理によれば、粒状度が許容できる複数のディザマスクの中から、周波数むらが視認限界を下回る中で画像を記録できるディザマスクを決定することができる。その結果、決定されたディザマスクを量子化処理部407で使用することにより、HS処理405を行ったことにより発生する周波数むらを、粒状度の許容範囲内で最小に低減することができる。
According to the above processing, a dither mask capable of recording an image can be determined from among a plurality of dither masks with acceptable granularity while the frequency unevenness is below the visibility limit. As a result, by using the determined dither mask in the
以上のように、HS処理を行って記録媒体に記録された画像をスキャナ107で読み取って粒状度を算出し、使用可能なディザマスクを判定する形態について説明した。この形態では、記録媒体から直接粒状度を測定するので、プリントシステムの個体誤差に左右されず、第1の実施形態と比べてより精度の高い粒状度判定を行うことができる。本実施形態では、ΔR[X]を算出する際に、隣接したエリア間で差分を取ったが、上述したように人間の視覚特性を考慮し、例えば記録媒体上で1.0cycle/mmの間隔で差分を取ってもよい。本発明では、ディザマスクを用いて説明を行ったが、それに限らず、誤差拡散法などの他の疑似中間調処理を用いてもよい。
As described above, the mode in which the dither mask that can be used is determined by performing the HS processing, calculating the granularity by reading the image recorded on the recording medium by the
(第3実施形態)
上記第1の実施形態では、ディザマスクの切り換えに用いる粒状度差の閾値ΔRThを、予め定めた一意の値とするものである。そして、どの吐出量レベル値、どの空間周波数においても常時ΔRThを用いて判定を行う形態に関するものである。本実施形態は、この閾値判定に用いる粒状度差ΔRThを、吐出量レベル値と空間周波数の2つの要因によって求める形態に関するものである。
(Third embodiment)
In the first embodiment, the granularity difference threshold ΔRTh used for dither mask switching is set to a predetermined unique value. The present invention relates to a mode in which determination is always performed using ΔRTh at any discharge amount level value and any spatial frequency. The present embodiment relates to a form in which the granularity difference ΔRTh used for the threshold determination is obtained from two factors of the discharge amount level value and the spatial frequency.
ドットサイズが人間の視覚的に十分無視できるほど小さい場合は、粒状度差を判定する処理(図15のステップS605)において一意に判定閾値ΔRThを設定することができる。しかし、ドットサイズが大きくなるにつれて視認しやすくなり、その粒状性が高まる。このため、ドットサイズが粒状度に大きく影響を及ぼすほどになると、それに応じて判定閾値ΔRThを変化させることが望ましい。本実施形態では、ドットサイズを吐出量レベル値を用いて判定する。すなわち、ドットサイズが大きくなるほど、吐出量レベル値が上がるため、吐出量レベル値が大きくなるほどΔRThの値を小さくする。このΔRThの設定は、製造工程の吐出量のばらつき範囲内において、実験的に求めてもよいし、RMS粒状度など一般に知られた粒状度算出方法を用いて求めてもよい。 If the dot size is small enough to be ignored by human eyes, the determination threshold ΔRTh can be uniquely set in the process of determining the granularity difference (step S605 in FIG. 15). However, as the dot size increases, it becomes easier to see and the graininess increases. For this reason, when the dot size has a great influence on the granularity, it is desirable to change the determination threshold value ΔRTh accordingly. In this embodiment, the dot size is determined using the ejection amount level value. That is, as the dot size increases, the discharge amount level value increases. Therefore, as the discharge amount level value increases, the value of ΔRTh is decreased. The setting of ΔRTh may be obtained experimentally within a range of variation in the ejection amount in the manufacturing process, or may be obtained using a generally known granularity calculation method such as RMS granularity.
一方、ディザマスクによって形成されるドット配置パターンも、その空間周波数によって上記同様に判定閾値ΔRThを変えることが望ましい。例えば、ドットが密集した配置パターン、すなわちドット配置パターンが低周波である場合、ドット同士が近づくためにそれが大きなドットとして視認されやすくなる。つまり、粒状性が高まることになる。そのため、粒状度差を判定する処理(図15のステップS605)では、ドット配置パターンの空間周波数が低いほど、判定閾値ΔRThの値を大きくする。ドット配置パターンの空間周波数が少しでも低くなれば、粒状性が目立ってしまうので、次のディザマスクに切り換えやすくすることが望ましい。逆に、ドット配置パターンの空間周波数が高いほど、判定閾値ΔRThの値を小さくする。空間周波数が高いほど粒状性は目立ちにくく、従ってディザマスクを切り換える頻度を下げればよい。すなわちΔRThの値を大きくすればよい。これにより、粒状度差を判定する処理(図15のステップS605)の工程数を減らすことができ、また用意する空間周波数の高いディザマスクの数を減らすこともできる。具体的な方法としては、ディザマスクごとに、入力される画素値とドット配置パターンの空間周波数の関係を、テーブルデータとして保持しておく。これは予め実験的に作成することができる。使用するディザマスクと入力される画素値から、テーブルパラメータを参照してドット配置パターンの空間周波数を求める。 On the other hand, for the dot arrangement pattern formed by the dither mask, it is desirable to change the determination threshold value ΔRTh according to the spatial frequency as described above. For example, when the arrangement pattern in which the dots are dense, that is, the dot arrangement pattern has a low frequency, the dots are close to each other, so that the dots are easily visually recognized. That is, the graininess is increased. Therefore, in the process of determining the granularity difference (step S605 in FIG. 15), the value of the determination threshold ΔRTh is increased as the spatial frequency of the dot arrangement pattern is lower. If the spatial frequency of the dot arrangement pattern is as low as possible, the graininess becomes conspicuous, so it is desirable to make it easy to switch to the next dither mask. Conversely, the higher the spatial frequency of the dot arrangement pattern, the smaller the determination threshold value ΔRTh. The higher the spatial frequency, the less noticeable the graininess. Therefore, the frequency of switching the dither mask may be lowered. That is, the value of ΔRTh may be increased. As a result, the number of processes for determining the granularity difference (step S605 in FIG. 15) can be reduced, and the number of dither masks having a high spatial frequency can be reduced. As a specific method, the relationship between the input pixel value and the spatial frequency of the dot arrangement pattern is held as table data for each dither mask. This can be created experimentally in advance. The spatial frequency of the dot arrangement pattern is obtained from the dither mask to be used and the input pixel value with reference to the table parameter.
以上、吐出量レベル値とドット配置パターンの空間周波数の2つの変数によって、粒状度差の判定閾値ΔRThを決定する形態について説明した。図21は、この2つの変数と判定閾値ΔRThとの関係を示す図である。同図において、縦方向に吐出量レベル値、横方向にドット配置パターンの空間周波数を記す。表中のΔRThの数値は、図17に示したのと同様に、規格化した数値を示している。吐出量レベル値が上がるほど(図の下へ行くほど)ΔRThは小さくなる。これは、ドットサイズが大きくなるにつれて粒状性が目立ちやすくなるため、より最適なディザマスクに切り換えやすくするためである。一方、ドット配置パターンの空間周波数が上がるほど(図の右へ行くほど)ΔRThは大きくなる。空間周波数が高くなるにつれて粒状性が低下するので、必要以上にディザマスクを切り換えなくて済むよう設定される。 The form in which the determination threshold ΔRTh for the granularity difference is determined based on the two variables of the ejection amount level value and the spatial frequency of the dot arrangement pattern has been described above. FIG. 21 is a diagram showing the relationship between these two variables and the determination threshold value ΔRTh. In the figure, the ejection amount level value is indicated in the vertical direction, and the spatial frequency of the dot arrangement pattern is indicated in the horizontal direction. The numerical value of ΔRTh in the table is a standardized numerical value as shown in FIG. ΔRTh decreases as the discharge amount level value increases (lower in the figure). This is because the graininess becomes more conspicuous as the dot size increases, so that it is easier to switch to a more optimal dither mask. On the other hand, ΔRTh increases as the spatial frequency of the dot arrangement pattern increases (goes to the right in the figure). Since the granularity decreases as the spatial frequency increases, the dither mask is set so as not to be switched more than necessary.
また、記録ヘッドの特性やプリントシステムの容量などに応じて、吐出量レベル値とドット配置パターンの空間周波数のうち、いずれか一つだけでΔRThを決定しても構わない。HS処理を行う際のディザマスクに応じて、ΔRThを変えてもよい。 Further, ΔRTh may be determined by only one of the ejection amount level value and the spatial frequency of the dot arrangement pattern according to the characteristics of the recording head, the capacity of the printing system, and the like. ΔRTh may be changed according to the dither mask when performing the HS processing.
(第4実施形態)
上記第1実施形態では、図2にて説明したような複数の吐出基板1011〜1013がノズル配列方向に隣接して配置されている記録ヘッドを用いる形態に関するものである。本実施形態では、図22に示すように、複数の吐出基板が互い違いに配置されている記録ヘッドを用いる形態に関する。この記録ヘッドは、吐出基板が1つおきにノズル配列垂直方向にずれていて、隣同士の吐出基板が一定の幅だけ重複した場所に配置された構造となっている。図22では、吐出基板1011の右端と吐出量基板1012の左端がノズル群(4ノズル)2つ分重複している。重複するノズル群の数は本実施形態では問わない。
(Fourth embodiment)
The first embodiment relates to a form using a recording head in which a plurality of
図23(a)は、図22の記録ヘッドの重複部分を拡大した図である。吐出基板1011のノズル群10112と、吐出基板1012のノズル群10121が重複し、ノズル群10113とノズル群10122が重複する構造となる。このような記録ヘッドの構造では、インクの吐出量の組み合わせ比率を、図23(b)に示すようにすることが望ましい。単位面積あたり12ドット記録する画素値が入力された場合を想定する。吐出基板1011において、ノズル群10111は12ドットを記録する。ノズル群10112は12ドットの2/3倍、すなわち8ドットを記録する。この場合、例えば1ノズルにつき2ドット記録すればよい。ノズル群10113は12ドットの1/3倍、すなわち4ドットを記録する。この場合、例えば1ノズルにつき1ドット記録すればよい。一方、吐出基板1012においては、ノズル群10121は12ドットの1/3倍、すなわち4ドットを記録する。ノズル群10122は12ドットの2/3倍、すなわち8ドットを記録する。ノズル群10123は12ドットを記録する。こうして、ノズル群ごとの組み合わせ比率を変えることで、各エリアでは全て12ドットが記録されることになる。
FIG. 23A is an enlarged view of an overlapping portion of the recording head of FIG. The
ところが、ノズル群10112と10121でドットサイズが異なる場合、HS処理によって、第2エリア(X=2)では、記録されるドット配置パターン内でサイズの異なるドットが点在することになる。つまり、第1の実施形態と比べて、ノズル群が重複するエリア[X]の粒状度は高くなる。そのため、図23(a)の重複するエリア[X]に対しては、第1の実施形態で用いた粒状度判定と異なるテーブルパラメータで粒状度を判定する。1つの例としては、ノズル群10112の吐出量を隣接するノズル群10111の吐出量と略同一とみなし、ドット配置パターンにおいてノズル群10111の吐出量のドットが全体の2/3ドット記録されると仮定する。一方、ノズル群10121の吐出量を、ノズル群が重複しない最も近いノズル群10123の吐出量と略同一とみなし、ドット配置パターンにおいてノズル群10121の吐出量のドットが全体の1/3ドット記録されると仮定する。予め、それぞれの吐出量レベル値と、それぞれの組み合わせ比率との関係をテーブルパラメータとして保持しておき、それを参照することで、粒状度をより精度よく求めることができる。記録ヘッドの製造工程において、同一の吐出基板内の隣接するノズル群間の吐出量ばらつきより、異なる吐出基板同士の吐出量ばらつきの方が、一般的に大きいため、こうした処理方法を取ることが望ましい。また、別の例として、第2の実施形態に記載したように、HS処理を行って記録媒体に記録された画像をスキャナ107で読み取って粒状度を算出することで、吐出量レベル値からテーブルパラメータを参照して粒状度を推定するより、同様の結果が得られる。
However, when the dot sizes of the
さらには、粒状度差を判定する処理においても、ノズル群が重複するエリアと重複しないエリアとで、異なる判定処理を行うこともできる。一例として、重複するエリアに対しては、第3の実施形態に記載したように、吐出量レベル値とドット配置パターンの空間周波数の2つの変数によって得られた粒状度差の判定閾値ΔRThを用いてもよい。図21に示すテーブルパラメータを、上述した組み合わせ比率ごとに作成する方法が考えられる。 Furthermore, even in the process of determining the granularity difference, different determination processes can be performed for areas where nozzle groups overlap and areas where they do not overlap. As an example, for overlapping areas, as described in the third embodiment, a granularity difference determination threshold value ΔRTh obtained by two variables of a discharge amount level value and a spatial frequency of a dot arrangement pattern is used. May be. A method of creating the table parameters shown in FIG. 21 for each combination ratio described above can be considered.
なお、各吐出基板において、吐出量のばらつきがドット配置パターンの粒状度に影響を及ぼさない範囲であれば、図22に示す記録ヘッドにおける粒状度判定ならびに粒状度差判定は、第1の実施形態の記録ヘッドを用いた場合と同様の処理を行ってもよい。 If the variation in the ejection amount does not affect the granularity of the dot arrangement pattern in each ejection substrate, the granularity determination and granularity difference determination in the recording head shown in FIG. 22 are performed in the first embodiment. The same processing as when the recording head is used may be performed.
(他の実施形態)
なお、これまで第1の実施形態〜第4の実施形態を説明してきたが、それぞれの処理内容についてはあくまで一例である。記録ヘッドの全長における周波数むらの低減が実現できる構成であれば、どのような構成をも用いることができる。本発明の実施形態では、複数の量子化マスクの中から1つを選択したが、例えば、記録ヘッド全長においてエリアごとにそれぞれ異なる量子化マスクを用いて量子化処理を行うことができれば、本発明が課題とするような周波数むらは目立たなくなるため、必ずしも全てのエリアを1つの量子化マスクで行わなくても良い。
(Other embodiments)
In addition, although 1st Embodiment-4th Embodiment has been demonstrated so far, each processing content is an example to the last. Any configuration can be used as long as it can reduce frequency unevenness in the entire length of the recording head. In the embodiment of the present invention, one of the plurality of quantization masks is selected. For example, if quantization processing can be performed using different quantization masks for each area in the entire recording head length, the present invention However, it is not always necessary to use one quantization mask for all areas.
また、以上の実施形態では、ノズル列をノズルの配列方向に複数に分割して複数のノズル群とし、1ノズル群を4つのノズルとした。そして、1ノズル群によって規定される記録媒体上の単位領域を1つのエリアとし、粒状度判定を行う最小単位として設定した。前述したように本発明はこのような単位に限定されるものではなく、より多くのノズルで規定される領域を一単位としてもよいし、1ノズルを1ノズル群としても構わない。更に、個々のエリアに含まれるノズル数は必ずしも同数でなくても良く、個々のエリアに含まれるノズル数をデバイスの特性に応じて適宜設定してもよい。複数のインクを吐出する複数のノズル列において、記録媒体上の同じ領域を記録するノズル群の組みごとにそれぞれ変換テーブルが対応していればよい。 In the above embodiment, the nozzle row is divided into a plurality of nozzle groups in the nozzle arrangement direction to form a plurality of nozzle groups, and one nozzle group has four nozzles. A unit area on the recording medium defined by one nozzle group is set as one area and set as a minimum unit for determining the granularity. As described above, the present invention is not limited to such a unit, and an area defined by more nozzles may be a unit, or one nozzle may be a group of nozzles. Furthermore, the number of nozzles included in each area does not necessarily have to be the same, and the number of nozzles included in each area may be appropriately set according to the characteristics of the device. In a plurality of nozzle arrays that eject a plurality of inks, the conversion table only needs to correspond to each group of nozzle groups that record the same region on the recording medium.
また、本実施形態では、シアン、マゼンタ、イエロー、ブラックの4色のインクを用いる形態で説明したが、本発明はこれに限るものではなく、2色以上のインクを用いる形態であればよい。例えば、前述の4色の他に、レッド、グリーン、ブルー、オレンジ、バイオレット、ライトシアン、ライトマゼンタ、グレイ、ライトグレイのインクのうちのいずれかを用いる形態であってもよい。 Further, in the present embodiment, the description has been given in the form of using four colors of cyan, magenta, yellow, and black, but the present invention is not limited to this, and any form that uses two or more colors of ink may be used. For example, in addition to the four colors described above, any of inks of red, green, blue, orange, violet, light cyan, light magenta, gray, and light gray may be used.
また、上記実施形態は、ディザマトリクスが2値化に用いられる形態に関するものであるが、本発明の適用はこの形態に限られない。例えば、256値の画像データを4値のデータに量子化し、この4値のデータが示す各レベルに対応したドット配置パターンを用いて2値化を行う形態であってよい。また、上述した実施形態は、インクジェット方式の記録装置に関するものであるが、この形態に限られず、例えば熱転写などによってドットを形成する方式の記録装置であってもよい。 Moreover, although the said embodiment is related with the form in which a dither matrix is used for binarization, application of this invention is not restricted to this form. For example, 256-value image data may be quantized into 4-value data, and binarization may be performed using a dot arrangement pattern corresponding to each level indicated by the 4-value data. The above-described embodiment relates to an ink jet recording apparatus, but is not limited to this form, and may be a recording apparatus that forms dots by, for example, thermal transfer.
100 プリンタ
101〜104 記録ヘッド
107 スキャナ
311 CPU
312 RAM
313 ROM
318 画像処理アクセラレータ
300 PC
303 HDD
DESCRIPTION OF
312 RAM
313 ROM
318
303 HDD
Claims (19)
前記記録素子列の複数の記録素子を分割して得られる複数の記録素子群であって、記録媒体の互いに異なる単位領域を記録するために用いられる複数の記録素子群にそれぞれ対応した複数の処理単位のそれぞれについて、当該記録素子群の記録素子に対応した画素の画像データを当該記録素子群の記録素子の記録特性に応じて補正する補正手段と、
前記単位領域に対応する記録素子群の記録素子の記録特性に基づいて、前記単位領域間の粒状度の差に関する情報を取得する取得手段と、
前記補正手段によって補正された画像データを、量子化マスクを用いて量子化する手段であって、前記単位領域に対応する記録素子群のための画像データを量子化するための量子化マスクを、前記取得手段によって取得された前記情報に基づいて、空間周波数特性が異なる少なくとも2つの量子化マスクの中から選択して量子化を行う量子化手段と、
を具えたことを特徴とする画像処理装置。 An image processing apparatus that generates recording data for recording on a recording medium using a recording element array in which a plurality of recording elements are arranged,
A plurality of recording element groups obtained by dividing a plurality of recording elements of the recording element array, each of which corresponds to a plurality of recording element groups used for recording different unit areas of a recording medium For each unit, correction means for correcting the image data of the pixels corresponding to the recording elements of the recording element group according to the recording characteristics of the recording elements of the recording element group;
An acquisition means for acquiring information relating to the difference in granularity between the unit areas based on the recording characteristics of the recording elements of the recording element group corresponding to the unit areas;
A means for quantizing the image data corrected by the correction means using a quantization mask, the quantization mask for quantizing the image data for the recording element group corresponding to the unit area, Quantization means for performing quantization by selecting from at least two quantization masks having different spatial frequency characteristics based on the information acquired by the acquisition means;
An image processing apparatus comprising:
前記取得手段は、前記粒状度算出手段によって算出された粒状度に基づいて前記情報を取得し、前記記録画像は、前記補正手段によって前記処理単位のそれぞれについて補正された画像データに基づいて記録されることを特徴とする請求項1に記載の画像処理装置。 Further comprising a granularity calculating means for calculating the granularity of a recorded image recorded in each of the unit areas based on the recording characteristics of the recording element group for each processing unit corresponding to the recording element group;
The acquisition unit acquires the information based on the granularity calculated by the granularity calculation unit, and the recorded image is recorded based on image data corrected for each of the processing units by the correction unit. The image processing apparatus according to claim 1.
前記記録素子列を備えた記録ヘッドと、
前記記録素子列の複数の記録素子を分割して得られる複数の記録素子群であって、記録媒体の互いに異なる単位領域を記録するために用いられる複数の記録素子群にそれぞれ対応した複数の処理単位のそれぞれについて、当該記録素子群の記録素子に対応した画素の画像データを当該記録素子群の記録素子の記録特性に応じて補正する補正手段と、
前記単位領域に対応する記録素子群の記録素子の記録特性に基づいて、前記単位領域間の粒状度の差に関する情報を取得する取得手段と、
前記補正手段によって補正された画像データを、量子化マスクを用いて量子化する手段であって、前記単位領域に対応する記録素子群のための画像データを量子化するための量子化マスクを、前記取得手段によって取得された前記情報に基づいて、空間周波数特性が異なる少なくとも2つの量子化マスクの中から選択して量子化を行う量子化手段と、
を具えたことを特徴とする記録装置。 A recording device that performs recording based on recording data using a recording element array in which a plurality of recording elements are arranged,
A recording head comprising the recording element array;
A plurality of recording element groups obtained by dividing a plurality of recording elements of the recording element array, each of which corresponds to a plurality of recording element groups used for recording different unit areas of a recording medium For each unit, correction means for correcting the image data of the pixels corresponding to the recording elements of the recording element group according to the recording characteristics of the recording elements of the recording element group;
An acquisition means for acquiring information relating to the difference in granularity between the unit areas based on the recording characteristics of the recording elements of the recording element group corresponding to the unit areas;
A means for quantizing the image data corrected by the correction means using a quantization mask, the quantization mask for quantizing the image data for the recording element group corresponding to the unit area, Quantization means for performing quantization by selecting from at least two quantization masks having different spatial frequency characteristics based on the information acquired by the acquisition means;
A recording apparatus characterized by comprising:
前記取得手段は、前記粒状度算出手段によって算出された粒状度に基づいて前記情報を取得し、前記記録画像は、前記補正手段によって前記処理単位のそれぞれについて補正された画像データに基づいて記録されることを特徴とする請求項11に記載の記録装置。 Further comprising a granularity calculating means for calculating the granularity of a recorded image recorded in each of the unit areas based on the recording characteristics of the recording element group for each processing unit corresponding to the recording element group;
The acquisition unit acquires the information based on the granularity calculated by the granularity calculation unit, and the recorded image is recorded based on image data corrected for each of the processing units by the correction unit. The recording apparatus according to claim 11.
前記記録素子列の複数の記録素子を分割して得られる複数の記録素子群であって、記録媒体の互いに異なる単位領域を記録するために用いられる複数の記録素子群にそれぞれ対応した複数の処理単位のそれぞれについて、当該記録素子群の記録素子に対応した画素の画像データを当該記録素子群の記録素子の記録特性に応じて補正する補正工程と、
前記単位領域に対応する記録素子群の記録素子の記録特性に基づいて、前記単位領域間の粒状度の差に関する情報を取得する取得工程と、
前記補正工程で補正された画像データを、量子化マスクを用いて量子化する工程であって、前記単位領域に対応する記録素子群のための画像データを量子化するための量子化マスクを、前記取得工程で取得された前記情報に基づいて、空間周波数特性が異なる少なくとも2つの量子化マスクの中から選択して量子化を行う量子化工程と、
を有したことを特徴とする画像処理方法。 An image processing method for generating recording data for recording using a recording element array in which a plurality of recording elements are arranged,
A plurality of recording element groups obtained by dividing a plurality of recording elements of the recording element array, each of which corresponds to a plurality of recording element groups used for recording different unit areas of a recording medium For each unit, a correction step of correcting the image data of the pixels corresponding to the recording elements of the recording element group according to the recording characteristics of the recording elements of the recording element group;
Based on the recording characteristics of the recording elements of the recording element group corresponding to the unit area, an acquisition step of acquiring information on the difference in granularity between the unit areas;
A step of quantizing the image data corrected in the correction step using a quantization mask, wherein a quantization mask for quantizing the image data for the recording element group corresponding to the unit region is provided. A quantization step of performing quantization by selecting from at least two quantization masks having different spatial frequency characteristics based on the information acquired in the acquisition step;
An image processing method characterized by comprising:
Priority Applications (2)
| Application Number | Priority Date | Filing Date | Title |
|---|---|---|---|
| JP2012252265A JP6016588B2 (en) | 2012-11-16 | 2012-11-16 | Image processing apparatus, recording apparatus, and image processing method |
| US14/076,710 US9007655B2 (en) | 2012-11-16 | 2013-11-11 | Image processing apparatus, printing apparatus, and image processing method |
Applications Claiming Priority (1)
| Application Number | Priority Date | Filing Date | Title |
|---|---|---|---|
| JP2012252265A JP6016588B2 (en) | 2012-11-16 | 2012-11-16 | Image processing apparatus, recording apparatus, and image processing method |
Publications (3)
| Publication Number | Publication Date |
|---|---|
| JP2014100795A JP2014100795A (en) | 2014-06-05 |
| JP2014100795A5 JP2014100795A5 (en) | 2016-01-28 |
| JP6016588B2 true JP6016588B2 (en) | 2016-10-26 |
Family
ID=50727657
Family Applications (1)
| Application Number | Title | Priority Date | Filing Date |
|---|---|---|---|
| JP2012252265A Active JP6016588B2 (en) | 2012-11-16 | 2012-11-16 | Image processing apparatus, recording apparatus, and image processing method |
Country Status (2)
| Country | Link |
|---|---|
| US (1) | US9007655B2 (en) |
| JP (1) | JP6016588B2 (en) |
Families Citing this family (14)
| Publication number | Priority date | Publication date | Assignee | Title |
|---|---|---|---|---|
| JP6247242B2 (en) * | 2015-03-16 | 2017-12-13 | 富士フイルム株式会社 | Reading apparatus, correction value calculation method thereof, program, and ink jet recording apparatus |
| JP6498019B2 (en) * | 2015-04-10 | 2019-04-10 | キヤノン株式会社 | Image recording apparatus and control method thereof |
| US10150296B2 (en) * | 2015-09-17 | 2018-12-11 | Konica Minolta, Inc. | Inkjet recording device and inkjet recording method |
| JP6366143B2 (en) * | 2015-09-18 | 2018-08-01 | 富士フイルム株式会社 | Dither mask generation method and apparatus, and program |
| JP6342372B2 (en) * | 2015-09-18 | 2018-06-13 | 富士フイルム株式会社 | Dither mask generation method and apparatus, and program |
| JP6780350B2 (en) * | 2016-07-29 | 2020-11-04 | 船井電機株式会社 | Image processing device |
| JP6831004B2 (en) * | 2017-03-30 | 2021-02-17 | 富士フイルム株式会社 | Image processing method, device and image recording device |
| JP2019119052A (en) * | 2017-12-28 | 2019-07-22 | コニカミノルタ株式会社 | Discharge setting method, data processing apparatus, inkjet recording apparatus |
| JP7309427B2 (en) | 2019-04-15 | 2023-07-18 | キヤノン株式会社 | Inkjet recording device, recording method, and program |
| JP7271282B2 (en) | 2019-04-15 | 2023-05-11 | キヤノン株式会社 | INKJET RECORDING DEVICE, CONTROL METHOD, AND PROGRAM |
| JP7301584B2 (en) | 2019-04-15 | 2023-07-03 | キヤノン株式会社 | Image processing device, image processing method, and program |
| US10846574B1 (en) * | 2019-07-12 | 2020-11-24 | Electronics For Imaging, Inc. | Variable smoothing in printing |
| JP7362365B2 (en) | 2019-08-30 | 2023-10-17 | キヤノン株式会社 | Image processing device, image processing method and program |
| JP7459533B2 (en) | 2020-02-03 | 2024-04-02 | コニカミノルタ株式会社 | Image forming apparatus, image forming method and program |
Family Cites Families (11)
| Publication number | Priority date | Publication date | Assignee | Title |
|---|---|---|---|---|
| JP3530680B2 (en) | 1996-06-18 | 2004-05-24 | キヤノン株式会社 | Image processing apparatus and method |
| US7330291B2 (en) * | 2001-03-02 | 2008-02-12 | Dai Nippon Printing Co., Ltd. | Dither mask creating method and creating device |
| JP4614076B2 (en) * | 2005-03-22 | 2011-01-19 | 富士フイルム株式会社 | Image forming apparatus and image processing method |
| JP4534963B2 (en) * | 2005-11-18 | 2010-09-01 | セイコーエプソン株式会社 | Image forming method, image forming apparatus, image forming system, printing method, printed matter generating method, and computer program for controlling image forming apparatus |
| JP4506652B2 (en) * | 2005-11-18 | 2010-07-21 | セイコーエプソン株式会社 | High quality halftone processing |
| JP4568748B2 (en) * | 2007-10-15 | 2010-10-27 | シャープ株式会社 | Image processing method, image processing apparatus, image forming apparatus, computer program, and recording medium |
| JP5402006B2 (en) * | 2009-01-15 | 2014-01-29 | セイコーエプソン株式会社 | Printing device |
| JP5473779B2 (en) * | 2010-05-24 | 2014-04-16 | キヤノン株式会社 | Image processing apparatus and image processing method |
| JP5780736B2 (en) * | 2010-10-05 | 2015-09-16 | キヤノン株式会社 | Image processing apparatus and image processing method |
| JP5691591B2 (en) * | 2011-02-09 | 2015-04-01 | コニカミノルタ株式会社 | Quantization apparatus, quantization method, and image forming apparatus |
| JP5741112B2 (en) * | 2011-03-24 | 2015-07-01 | セイコーエプソン株式会社 | Printing apparatus, printing method, print data generation program, and dither mask generation method |
-
2012
- 2012-11-16 JP JP2012252265A patent/JP6016588B2/en active Active
-
2013
- 2013-11-11 US US14/076,710 patent/US9007655B2/en active Active
Also Published As
| Publication number | Publication date |
|---|---|
| US9007655B2 (en) | 2015-04-14 |
| US20140139855A1 (en) | 2014-05-22 |
| JP2014100795A (en) | 2014-06-05 |
Similar Documents
| Publication | Publication Date | Title |
|---|---|---|
| JP6016588B2 (en) | Image processing apparatus, recording apparatus, and image processing method | |
| US10022983B2 (en) | Image processor, printing apparatus, and image processing method | |
| JP5436388B2 (en) | Image processing apparatus, image processing method, and image recording apparatus | |
| US8743420B2 (en) | Image processor and image processing method | |
| JP5780735B2 (en) | Image processing apparatus and image processing method | |
| JP6021600B2 (en) | Image processing apparatus and image processing method | |
| JP5479219B2 (en) | Image processing apparatus and image processing method | |
| JP5436389B2 (en) | Image processing apparatus and image processing method | |
| US8896883B2 (en) | Image processing apparatus, printing apparatus, and image processing method | |
| US20120081443A1 (en) | Inkjet printing apparatus, inkjet printing method, image processor and image processing method | |
| US11090932B2 (en) | Image processing apparatus, image processing method and storage medium | |
| JP2021024275A (en) | Image processing device, recording device, image processing method and program | |
| JP6012425B2 (en) | Image processing apparatus and image processing method | |
| US20160205285A1 (en) | Image processing device, printing apparatus, image processing method, and program | |
| JP2021053995A (en) | Image processing device, image processing method and program | |
| JP7362365B2 (en) | Image processing device, image processing method and program | |
| JP7471791B2 (en) | Image processing device, image processing method, and program | |
| JP2021053866A (en) | Image processing device, image processing method and program | |
| JP2017081108A (en) | Image processing device and image processing method |
Legal Events
| Date | Code | Title | Description |
|---|---|---|---|
| A621 | Written request for application examination |
Free format text: JAPANESE INTERMEDIATE CODE: A621 Effective date: 20151111 |
|
| A521 | Request for written amendment filed |
Free format text: JAPANESE INTERMEDIATE CODE: A523 Effective date: 20151204 |
|
| A977 | Report on retrieval |
Free format text: JAPANESE INTERMEDIATE CODE: A971007 Effective date: 20160815 |
|
| TRDD | Decision of grant or rejection written | ||
| A01 | Written decision to grant a patent or to grant a registration (utility model) |
Free format text: JAPANESE INTERMEDIATE CODE: A01 Effective date: 20160830 |
|
| A61 | First payment of annual fees (during grant procedure) |
Free format text: JAPANESE INTERMEDIATE CODE: A61 Effective date: 20160927 |
|
| R151 | Written notification of patent or utility model registration |
Ref document number: 6016588 Country of ref document: JP Free format text: JAPANESE INTERMEDIATE CODE: R151 |