JP6002747B2 - Ventilation sufficiency detection - Google Patents
Ventilation sufficiency detection Download PDFInfo
- Publication number
- JP6002747B2 JP6002747B2 JP2014500202A JP2014500202A JP6002747B2 JP 6002747 B2 JP6002747 B2 JP 6002747B2 JP 2014500202 A JP2014500202 A JP 2014500202A JP 2014500202 A JP2014500202 A JP 2014500202A JP 6002747 B2 JP6002747 B2 JP 6002747B2
- Authority
- JP
- Japan
- Prior art keywords
- histogram
- ventilation
- hypoventilation
- controller
- peaks
- Prior art date
- Legal status (The legal status is an assumption and is not a legal conclusion. Google has not performed a legal analysis and makes no representation as to the accuracy of the status listed.)
- Active
Links
- 238000009423 ventilation Methods 0.000 title claims description 237
- 238000001514 detection method Methods 0.000 title claims description 22
- 206010021133 Hypoventilation Diseases 0.000 claims description 99
- 238000000034 method Methods 0.000 claims description 86
- 238000005259 measurement Methods 0.000 claims description 77
- 238000011282 treatment Methods 0.000 claims description 52
- 230000000241 respiratory effect Effects 0.000 claims description 36
- 238000011156 evaluation Methods 0.000 claims description 29
- 238000012545 processing Methods 0.000 claims description 24
- 238000009826 distribution Methods 0.000 claims description 22
- 208000000122 hyperventilation Diseases 0.000 claims description 21
- 230000000870 hyperventilation Effects 0.000 claims description 21
- 230000029058 respiratory gaseous exchange Effects 0.000 claims description 13
- 238000002560 therapeutic procedure Methods 0.000 claims description 12
- 230000008569 process Effects 0.000 claims description 11
- 238000002644 respiratory therapy Methods 0.000 claims description 10
- 206010062519 Poor quality sleep Diseases 0.000 claims description 8
- 230000000737 periodic effect Effects 0.000 claims description 8
- 230000000007 visual effect Effects 0.000 claims description 5
- 230000006870 function Effects 0.000 description 34
- 238000005516 engineering process Methods 0.000 description 21
- 239000007789 gas Substances 0.000 description 20
- 238000013459 approach Methods 0.000 description 19
- 238000004458 analytical method Methods 0.000 description 12
- 238000004364 calculation method Methods 0.000 description 8
- 208000008784 apnea Diseases 0.000 description 7
- QVGXLLKOCUKJST-UHFFFAOYSA-N atomic oxygen Chemical compound [O] QVGXLLKOCUKJST-UHFFFAOYSA-N 0.000 description 7
- 239000008280 blood Substances 0.000 description 7
- 210000004369 blood Anatomy 0.000 description 7
- 239000001301 oxygen Substances 0.000 description 7
- 229910052760 oxygen Inorganic materials 0.000 description 7
- 230000002902 bimodal effect Effects 0.000 description 6
- 238000004422 calculation algorithm Methods 0.000 description 5
- 238000002496 oximetry Methods 0.000 description 5
- 230000002051 biphasic effect Effects 0.000 description 4
- 238000013500 data storage Methods 0.000 description 4
- 208000001797 obstructive sleep apnea Diseases 0.000 description 4
- 230000001225 therapeutic effect Effects 0.000 description 4
- 206010021079 Hypopnoea Diseases 0.000 description 3
- 208000004166 Obesity Hypoventilation Syndrome Diseases 0.000 description 3
- 206010035004 Pickwickian syndrome Diseases 0.000 description 3
- 230000008859 change Effects 0.000 description 3
- 230000007423 decrease Effects 0.000 description 3
- 238000010586 diagram Methods 0.000 description 3
- 238000012360 testing method Methods 0.000 description 3
- 206010021143 Hypoxia Diseases 0.000 description 2
- 238000013480 data collection Methods 0.000 description 2
- 230000003247 decreasing effect Effects 0.000 description 2
- 208000018875 hypoxemia Diseases 0.000 description 2
- 238000012544 monitoring process Methods 0.000 description 2
- 230000000422 nocturnal effect Effects 0.000 description 2
- 238000001441 oximetry spectrum Methods 0.000 description 2
- 238000005192 partition Methods 0.000 description 2
- 238000002106 pulse oximetry Methods 0.000 description 2
- 230000004044 response Effects 0.000 description 2
- 238000012546 transfer Methods 0.000 description 2
- 208000006545 Chronic Obstructive Pulmonary Disease Diseases 0.000 description 1
- 230000002159 abnormal effect Effects 0.000 description 1
- 230000008901 benefit Effects 0.000 description 1
- 230000015572 biosynthetic process Effects 0.000 description 1
- 238000007664 blowing Methods 0.000 description 1
- 238000012512 characterization method Methods 0.000 description 1
- 238000007635 classification algorithm Methods 0.000 description 1
- 238000004891 communication Methods 0.000 description 1
- 238000012790 confirmation Methods 0.000 description 1
- 238000011157 data evaluation Methods 0.000 description 1
- 238000003745 diagnosis Methods 0.000 description 1
- 238000002405 diagnostic procedure Methods 0.000 description 1
- 201000010099 disease Diseases 0.000 description 1
- 208000037265 diseases, disorders, signs and symptoms Diseases 0.000 description 1
- 238000000605 extraction Methods 0.000 description 1
- 238000001914 filtration Methods 0.000 description 1
- 238000009499 grossing Methods 0.000 description 1
- 238000010438 heat treatment Methods 0.000 description 1
- 230000003284 homeostatic effect Effects 0.000 description 1
- 230000000977 initiatory effect Effects 0.000 description 1
- 230000003434 inspiratory effect Effects 0.000 description 1
- 238000012986 modification Methods 0.000 description 1
- 230000004048 modification Effects 0.000 description 1
- 238000005457 optimization Methods 0.000 description 1
- 230000002085 persistent effect Effects 0.000 description 1
- 238000007781 pre-processing Methods 0.000 description 1
- 230000003252 repetitive effect Effects 0.000 description 1
- 238000012552 review Methods 0.000 description 1
- 238000005070 sampling Methods 0.000 description 1
- 238000012216 screening Methods 0.000 description 1
- 230000011218 segmentation Effects 0.000 description 1
- 230000000153 supplemental effect Effects 0.000 description 1
- 230000009466 transformation Effects 0.000 description 1
- 238000013022 venting Methods 0.000 description 1
Images


Classifications
-
- A—HUMAN NECESSITIES
- A61—MEDICAL OR VETERINARY SCIENCE; HYGIENE
- A61M—DEVICES FOR INTRODUCING MEDIA INTO, OR ONTO, THE BODY; DEVICES FOR TRANSDUCING BODY MEDIA OR FOR TAKING MEDIA FROM THE BODY; DEVICES FOR PRODUCING OR ENDING SLEEP OR STUPOR
- A61M16/00—Devices for influencing the respiratory system of patients by gas treatment, e.g. mouth-to-mouth respiration; Tracheal tubes
- A61M16/0051—Devices for influencing the respiratory system of patients by gas treatment, e.g. mouth-to-mouth respiration; Tracheal tubes with alarm devices
-
- A—HUMAN NECESSITIES
- A61—MEDICAL OR VETERINARY SCIENCE; HYGIENE
- A61B—DIAGNOSIS; SURGERY; IDENTIFICATION
- A61B5/00—Measuring for diagnostic purposes; Identification of persons
- A61B5/08—Detecting, measuring or recording devices for evaluating the respiratory organs
- A61B5/083—Measuring rate of metabolism by using breath test, e.g. measuring rate of oxygen consumption
-
- A—HUMAN NECESSITIES
- A61—MEDICAL OR VETERINARY SCIENCE; HYGIENE
- A61B—DIAGNOSIS; SURGERY; IDENTIFICATION
- A61B5/00—Measuring for diagnostic purposes; Identification of persons
- A61B5/08—Detecting, measuring or recording devices for evaluating the respiratory organs
- A61B5/087—Measuring breath flow
-
- A—HUMAN NECESSITIES
- A61—MEDICAL OR VETERINARY SCIENCE; HYGIENE
- A61M—DEVICES FOR INTRODUCING MEDIA INTO, OR ONTO, THE BODY; DEVICES FOR TRANSDUCING BODY MEDIA OR FOR TAKING MEDIA FROM THE BODY; DEVICES FOR PRODUCING OR ENDING SLEEP OR STUPOR
- A61M16/00—Devices for influencing the respiratory system of patients by gas treatment, e.g. mouth-to-mouth respiration; Tracheal tubes
- A61M16/0057—Pumps therefor
- A61M16/0066—Blowers or centrifugal pumps
- A61M16/0069—Blowers or centrifugal pumps the speed thereof being controlled by respiratory parameters, e.g. by inhalation
-
- A—HUMAN NECESSITIES
- A61—MEDICAL OR VETERINARY SCIENCE; HYGIENE
- A61M—DEVICES FOR INTRODUCING MEDIA INTO, OR ONTO, THE BODY; DEVICES FOR TRANSDUCING BODY MEDIA OR FOR TAKING MEDIA FROM THE BODY; DEVICES FOR PRODUCING OR ENDING SLEEP OR STUPOR
- A61M16/00—Devices for influencing the respiratory system of patients by gas treatment, e.g. mouth-to-mouth respiration; Tracheal tubes
- A61M16/021—Devices for influencing the respiratory system of patients by gas treatment, e.g. mouth-to-mouth respiration; Tracheal tubes operated by electrical means
- A61M16/022—Control means therefor
- A61M16/024—Control means therefor including calculation means, e.g. using a processor
-
- A—HUMAN NECESSITIES
- A61—MEDICAL OR VETERINARY SCIENCE; HYGIENE
- A61B—DIAGNOSIS; SURGERY; IDENTIFICATION
- A61B5/00—Measuring for diagnostic purposes; Identification of persons
- A61B5/72—Signal processing specially adapted for physiological signals or for diagnostic purposes
- A61B5/7235—Details of waveform analysis
- A61B5/7264—Classification of physiological signals or data, e.g. using neural networks, statistical classifiers, expert systems or fuzzy systems
-
- A—HUMAN NECESSITIES
- A61—MEDICAL OR VETERINARY SCIENCE; HYGIENE
- A61M—DEVICES FOR INTRODUCING MEDIA INTO, OR ONTO, THE BODY; DEVICES FOR TRANSDUCING BODY MEDIA OR FOR TAKING MEDIA FROM THE BODY; DEVICES FOR PRODUCING OR ENDING SLEEP OR STUPOR
- A61M16/00—Devices for influencing the respiratory system of patients by gas treatment, e.g. mouth-to-mouth respiration; Tracheal tubes
- A61M16/0003—Accessories therefor, e.g. sensors, vibrators, negative pressure
- A61M2016/0027—Accessories therefor, e.g. sensors, vibrators, negative pressure pressure meter
-
- A—HUMAN NECESSITIES
- A61—MEDICAL OR VETERINARY SCIENCE; HYGIENE
- A61M—DEVICES FOR INTRODUCING MEDIA INTO, OR ONTO, THE BODY; DEVICES FOR TRANSDUCING BODY MEDIA OR FOR TAKING MEDIA FROM THE BODY; DEVICES FOR PRODUCING OR ENDING SLEEP OR STUPOR
- A61M16/00—Devices for influencing the respiratory system of patients by gas treatment, e.g. mouth-to-mouth respiration; Tracheal tubes
- A61M16/0003—Accessories therefor, e.g. sensors, vibrators, negative pressure
- A61M2016/003—Accessories therefor, e.g. sensors, vibrators, negative pressure with a flowmeter
- A61M2016/0033—Accessories therefor, e.g. sensors, vibrators, negative pressure with a flowmeter electrical
- A61M2016/0039—Accessories therefor, e.g. sensors, vibrators, negative pressure with a flowmeter electrical in the inspiratory circuit
-
- A—HUMAN NECESSITIES
- A61—MEDICAL OR VETERINARY SCIENCE; HYGIENE
- A61M—DEVICES FOR INTRODUCING MEDIA INTO, OR ONTO, THE BODY; DEVICES FOR TRANSDUCING BODY MEDIA OR FOR TAKING MEDIA FROM THE BODY; DEVICES FOR PRODUCING OR ENDING SLEEP OR STUPOR
- A61M2205/00—General characteristics of the apparatus
- A61M2205/15—Detection of leaks
-
- A—HUMAN NECESSITIES
- A61—MEDICAL OR VETERINARY SCIENCE; HYGIENE
- A61M—DEVICES FOR INTRODUCING MEDIA INTO, OR ONTO, THE BODY; DEVICES FOR TRANSDUCING BODY MEDIA OR FOR TAKING MEDIA FROM THE BODY; DEVICES FOR PRODUCING OR ENDING SLEEP OR STUPOR
- A61M2205/00—General characteristics of the apparatus
- A61M2205/18—General characteristics of the apparatus with alarm
-
- A—HUMAN NECESSITIES
- A61—MEDICAL OR VETERINARY SCIENCE; HYGIENE
- A61M—DEVICES FOR INTRODUCING MEDIA INTO, OR ONTO, THE BODY; DEVICES FOR TRANSDUCING BODY MEDIA OR FOR TAKING MEDIA FROM THE BODY; DEVICES FOR PRODUCING OR ENDING SLEEP OR STUPOR
- A61M2205/00—General characteristics of the apparatus
- A61M2205/35—Communication
- A61M2205/3546—Range
- A61M2205/3553—Range remote, e.g. between patient's home and doctor's office
-
- A—HUMAN NECESSITIES
- A61—MEDICAL OR VETERINARY SCIENCE; HYGIENE
- A61M—DEVICES FOR INTRODUCING MEDIA INTO, OR ONTO, THE BODY; DEVICES FOR TRANSDUCING BODY MEDIA OR FOR TAKING MEDIA FROM THE BODY; DEVICES FOR PRODUCING OR ENDING SLEEP OR STUPOR
- A61M2205/00—General characteristics of the apparatus
- A61M2205/50—General characteristics of the apparatus with microprocessors or computers
- A61M2205/502—User interfaces, e.g. screens or keyboards
-
- A—HUMAN NECESSITIES
- A61—MEDICAL OR VETERINARY SCIENCE; HYGIENE
- A61M—DEVICES FOR INTRODUCING MEDIA INTO, OR ONTO, THE BODY; DEVICES FOR TRANSDUCING BODY MEDIA OR FOR TAKING MEDIA FROM THE BODY; DEVICES FOR PRODUCING OR ENDING SLEEP OR STUPOR
- A61M2230/00—Measuring parameters of the user
- A61M2230/40—Respiratory characteristics
- A61M2230/43—Composition of exhalation
- A61M2230/435—Composition of exhalation partial O2 pressure (P-O2)
Landscapes
- Health & Medical Sciences (AREA)
- Life Sciences & Earth Sciences (AREA)
- General Health & Medical Sciences (AREA)
- Public Health (AREA)
- Veterinary Medicine (AREA)
- Biomedical Technology (AREA)
- Heart & Thoracic Surgery (AREA)
- Engineering & Computer Science (AREA)
- Pulmonology (AREA)
- Animal Behavior & Ethology (AREA)
- Emergency Medicine (AREA)
- Hematology (AREA)
- Anesthesiology (AREA)
- Physiology (AREA)
- Physics & Mathematics (AREA)
- Biophysics (AREA)
- Pathology (AREA)
- Medical Informatics (AREA)
- Molecular Biology (AREA)
- Surgery (AREA)
- Obesity (AREA)
- Measurement Of The Respiration, Hearing Ability, Form, And Blood Characteristics Of Living Organisms (AREA)
Description
[関連出願の相互参照]
本出願は、参照により本明細書に組み込まれている、2011年3月23日に出願された米国仮特許出願第61/466,560号の優先権を主張するものである。
[Cross-reference of related applications]
This application claims priority from US Provisional Patent Application No. 61 / 466,560, filed Mar. 23, 2011, which is incorporated herein by reference.
[発明の分野]
本技術は、正常な患者の換気、過換気または低換気などの呼吸換気の充足度または不足度を検出するための方法および装置に関する。
[Field of the Invention]
The present technology relates to a method and apparatus for detecting sufficiency or lack of respiratory ventilation, such as normal patient ventilation, hyperventilation or hypoventilation.
通常、閉塞性睡眠時無呼吸(OSA)の患者のための一種の圧力治療は、接続ホースおよびマスクを介して送風機(圧縮機)により加えられる持続気道陽圧(CPAP)である。陽圧を使用して、吸気中に患者の気道が潰れることを防止することにより、反復性の無呼吸または呼吸低下およびその続発症を防止することができる。このような呼吸治療装置は、清浄な呼吸可能ガス(通常、酸素補給を含む空気または含まない空気)の供給を治療圧力で生じさせるよう機能することができる。この圧力は、様々な事象を治療するために変化し得るが、患者の呼吸サイクル(すなわち、吸気および呼気)の所与のサイクルにわたってほぼ一定のままであり得、または各呼気中の快適性のために低下し得る(例えば、二相性CPAP)。 Typically, one type of pressure therapy for patients with obstructive sleep apnea (OSA) is continuous positive airway pressure (CPAP) applied by a blower (compressor) through a connecting hose and mask. Positive pressure can be used to prevent repetitive apnea or hypopnea and its sequelae by preventing the patient's airways from collapsing during inspiration. Such respiratory therapy devices can function to produce a supply of clean breathable gas (usually with or without supplemental oxygen) at therapeutic pressure. This pressure may vary to treat various events, but may remain approximately constant over a given cycle of the patient's breathing cycle (ie, inspiration and expiration), or the comfort level during each expiration (Eg biphasic CPAP).
呼吸治療装置は、通常、流れ発生装置、空気フィルタ、マスクまたはカニューレ、流れ発生装置をマスクに接続する空気送出導管、種々のセンサ、およびマイクロプロセッサベースのコントローラを備えることができる。流れ発生装置は、サーボ制御モータおよびインペラを備えることができる。また、流れ発生装置は、モータ速度制御の代わりとして患者に送られる圧力を変化させるための手段として、空気を大気に排出することが可能な弁を備えることができる。センサは、特に、モータ速度、ガス体積流量、および出口圧力を、圧力変換器、流量センサなどにより測定する。装置は、任意選択として、空気送出回路の通路に加湿器および/または発熱体を備えることができる。コントローラは、統合データ検索/転送および表示機能のある、またはないデータ記憶容量を有することができる。 A respiratory treatment device typically can include a flow generator, an air filter, a mask or cannula, an air delivery conduit connecting the flow generator to the mask, various sensors, and a microprocessor-based controller. The flow generator can include a servo control motor and an impeller. The flow generator can also include a valve capable of venting air to the atmosphere as a means for changing the pressure delivered to the patient as an alternative to motor speed control. The sensor specifically measures motor speed, gas volume flow, and outlet pressure with a pressure transducer, flow sensor, and the like. The device can optionally include a humidifier and / or a heating element in the passage of the air delivery circuit. The controller can have data storage capacity with or without integrated data retrieval / transfer and display capabilities.
無呼吸または呼吸低下に加えて、CPAP治療などの圧力治療を受ける患者は、低換気になるおそれもある。低換気は、周期的な休止または無呼吸とは対照的に、持続性低換気の発生であると考えることができる。このような低換気の事象は、患者または患者を管理する臨床医もしくは医師によって記録されず認識されないおそれがある。 In addition to apnea or hypopnea, patients undergoing pressure treatment such as CPAP treatment may also become hypoventilated. Hypoventilation can be considered the occurrence of persistent hypoventilation, as opposed to periodic pauses or apnea. Such hypoventilation events may not be recorded and recognized by the patient or the clinician or physician managing the patient.
CPAP治療を受けている患者の場合、以下の複数の理由で低換気が生じ得る。 In patients undergoing CPAP treatment, hypoventilation can occur for several reasons:
(a)患者が肥満低換気症候群(OHS)の一次診断を受けた可能性があり、治療としてCPAPを試している。多くの患者は、このような治療で数か月かけて回復する。夜間血中酸素飽和度(SpO2)を記録することが、有効性を特定する標準的な方法であるが、これは、費用が掛かり煩雑になるおそれがある。 (A) The patient may have received a primary diagnosis of obesity-hypoventilation syndrome (OHS) and is trying CPAP as a treatment. Many patients recover over months with such treatment. Recording nocturnal blood oxygen saturation (SpO 2 ) is a standard way of identifying effectiveness, but this can be expensive and cumbersome.
(b)患者が、基礎疾患の経過により徐々に低換気を発症するおそれがある(例えば、慢性閉塞性肺疾患(COPD)の進行または閉塞性睡眠時無呼吸(OSA)からのOHSの進行)。 (B) The patient may gradually develop hypoventilation over the course of the underlying disease (eg, progression of chronic obstructive pulmonary disease (COPD) or progression of OHS from obstructive sleep apnea (OSA)) .
(c)患者が、低換気のない、または例えば、低換気のある睡眠状態(例えば、仰臥位睡眠)に入らない、限定された診断検査を受けた可能性がある。 (C) The patient may have undergone a limited diagnostic test without hypoventilation or, for example, not entering a sleep state with hypoventilation (e.g., supine sleep).
換気を評価するための装置または呼吸圧力治療を生じさせるための装置においても実施可能な、患者の換気を評価するための方法を開発することが望ましいとされている。 It would be desirable to develop a method for assessing patient ventilation that could also be implemented in a device for assessing ventilation or a device for producing respiratory pressure therapy.
本技術の一部の実施形態の第1の態様は、換気を評価するための方法およびデバイスを提供することである。 A first aspect of some embodiments of the present technology is to provide methods and devices for assessing ventilation.
本技術の一部の実施形態の別の態様は、流量センサからの呼吸流量の測定値に基づいて装置内の換気ヒストグラムを決定することである。 Another aspect of some embodiments of the present technology is to determine a ventilation histogram within the device based on a measure of respiratory flow from a flow sensor.
本技術のさらなる態様は、換気ヒストグラムに基づき、または換気ヒストグラムに応じて、持続気道陽圧デバイスなどの呼吸治療装置内の換気充足度の検出を実施することである。 A further aspect of the present technology is to perform ventilation sufficiency detection in a respiratory treatment device, such as a continuous positive airway pressure device, based on or in response to a ventilation histogram.
本技術の別の態様は、(i)流量の測定値を決定するステップと、(ii)前記流量の測定値から換気の測定値を算出するステップと、(iii)前記換気の測定値の確率分布を決定するステップと、(iv)低換気を検出するために確率分布を分析するステップとを含む、低換気を検出するための方法である。 Another aspect of the present technology includes: (i) determining a flow rate measurement; (ii) calculating a ventilation measurement from the flow measurement; and (iii) a probability of the ventilation measurement. A method for detecting hypoventilation comprising: determining a distribution; and (iv) analyzing a probability distribution to detect hypoventilation.
本技術の一部の実施形態は、プロセッサを制御して、呼吸可能ガスの測定された流量から換気の充足度を評価するための方法を含む。このようなプロセッサの方法は、患者の呼吸を表す呼吸可能ガスの流量の測定値にアクセスするステップと、流量の測定値から換気の測定値を引き出すステップと、プロセッサにより、換気の測定値に基づいてヒストグラムを決定するステップとを含む。 Some embodiments of the present technology include a method for controlling a processor to assess the sufficiency of ventilation from a measured flow rate of breathable gas. Such a processor method includes accessing a breathable gas flow measurement representative of patient breathing, deriving a ventilation measurement from the flow measurement, and a processor based on the ventilation measurement. Determining a histogram.
このような方法は、視覚表示デバイスにヒストグラムのグラフを表示するステップを含むこともできる。任意選択として、ヒストグラムは、治療セッション中に取得される換気値の度数分布を表すことができ、各換気値は時間間隔にわたる容量の測定値である。時間間隔は、治療セッションの時間よりも短くすることができる。任意選択として、時間間隔は約1分とすることができ、治療セッションの時間は約数時間とすることができる。 Such a method may also include displaying a histogram graph on a visual display device. Optionally, the histogram can represent a frequency distribution of ventilation values acquired during a treatment session, each ventilation value being a measure of volume over a time interval. The time interval can be shorter than the time of the treatment session. Optionally, the time interval can be about 1 minute and the duration of the treatment session can be about a few hours.
一部の実施形態では、方法が、プロセッサにおいて、ヒストグラムに関連するデータを処理して歪度指数を算出するステップと、歪度指数を閾値と比較するステップと、比較に基づいて低換気または過換気を示すステップとをさらに含むことができる。 In some embodiments, the method includes processing, in a processor, processing data associated with the histogram to calculate a skewness index, comparing the skewness index to a threshold, and based on the comparison, hypoventilation or hyperventilation. And a step of indicating ventilation.
一部の場合には、方法が、プロセッサにおいて、ヒストグラムに関連するデータを処理してヒストグラムのピークの数を検出するステップと、検出されたピークの数に基づいて低換気の有無を示すステップとをさらに含むことができる。 In some cases, the method includes processing at a processor to process data associated with the histogram to detect the number of peaks in the histogram and to indicate the presence or absence of hypoventilation based on the number of detected peaks. Can further be included.
さらなる場合には、方法が、プロセッサにおいて、ヒストグラムに関連するデータを処理して尖度指数を決定するステップと、尖度指数を閾値と比較するステップと、比較に基づいて低換気の有無を示すステップとをさらに含む。 In a further case, the method, in the processor, processes data associated with the histogram to determine a kurtosis index, compares the kurtosis index to a threshold, and indicates the presence or absence of hypoventilation based on the comparison. A step.
任意選択として、このような方法は、流量センサによる呼吸可能ガスの流量の測定を、プロセッサにより制御するステップをさらに含むことができる。 Optionally, such a method may further comprise the step of controlling by the processor the measurement of the flow of breathable gas by the flow sensor.
一部の場合には、方法が、ヒストグラムを表すデータを処理して、低換気事象の発生を表す低換気インジケータを生成するステップを含むことができる。任意選択として、低換気インジケータは確率値を含むことができる。処理は、ヒストグラムのピークの検出を含むことができる。処理は、ヒストグラムのピーク間の距離を算出するステップと、距離を確率空間に変換するステップとをさらに含むことができる。処理は、ヒストグラムのピーク間の勾配を算出するステップをさらに含むことができる。処理は、勾配に対する面積を算出するステップと、面積を確率空間に変換するステップとをさらに含むことができる。処理は、ヒストグラムの1組の特徴を算出するステップと、1組の特徴の評価に基づいてインジケータを生成するステップとをさらに含むことができる。1組の特徴は、以下の特徴、すなわち、2つの最大ピーク間の勾配、最大ピークと中心点との間の勾配、2番目に大きなピークと中心点との間の勾配、2つの最大ピーク間の面積、最大ピークと中心点との間の面積、2番目に大きなピークと中心点との間の面積、形状特徴、尖度値、および歪度値のうちの1つまたは複数を含むことができる。 In some cases, the method can include processing data representing the histogram to generate a hypoventilation indicator that represents the occurrence of a hypoventilation event. Optionally, the hypoventilation indicator can include a probability value. Processing can include detection of peaks in the histogram. The processing may further include calculating a distance between the peaks of the histogram and converting the distance to a probability space. The processing can further include calculating a slope between the peaks of the histogram. The processing can further include calculating an area for the gradient and converting the area to a probability space. The processing can further include calculating a set of features of the histogram and generating an indicator based on the evaluation of the set of features. One set of features includes the following features: the slope between the two largest peaks, the slope between the largest peak and the center point, the slope between the second largest peak and the center point, and the distance between the two largest peaks 1, the area between the largest peak and the center point, the area between the second largest peak and the center point, the shape feature, the kurtosis value, and the skewness value. it can.
一部のこのような場合には、方法が、漏れの測定値を決定するステップと、例えばヒストグラムを分割してそれに応じて表示すること、および/または漏れの期間に対応する換気の測定値を無視することにより、漏れの測定値に基づいてヒストグラムのための換気の測定値を区別するステップとをさらに含むことができる。さらなる場合には、方法が、換気安定性の測定値を決定するステップと、例えばヒストグラムを分割してそれに応じて表示すること、および/または安定していない期間に対応する換気の測定値を無視することにより、安定性の測定値に基づいてヒストグラムのための換気の測定値を区別するステップとを含むことができる。一部のこのような場合には、換気安定性の測定値を決定するステップが、覚醒期間、無呼吸事象、周期性呼吸事象、および覚醒事象の検出のうちのいずれか1つまたは複数を含むことができる。 In some such cases, the method determines a leak measurement and, for example, splits the histogram and displays it accordingly, and / or measures the ventilation corresponding to the duration of the leak. Ignoring may further include distinguishing ventilation measurements for the histogram based on the leak measurements. In a further case, the method determines a measure of ventilation stability and, for example, divides the histogram and displays it accordingly, and / or ignores the measure of ventilation corresponding to an unstable period Thereby distinguishing ventilation measurements for the histogram based on the stability measurements. In some such cases, the step of determining ventilation stability measurements includes any one or more of wakefulness, apnea events, periodic respiratory events, and detection of wakefulness events. be able to.
本技術の一部の実施形態は、換気評価装置を備えることができる。装置は、典型的には、患者の呼吸に起因する呼吸可能ガスの測定された流量を表すデータにアクセスするための、少なくとも1つのプロセッサを有するコントローラを備えることができ、コントローラは、(a)換気の測定値を流量の測定値から引き出し、(b)換気の測定値に基づいてヒストグラムを決定するようにさらに構成されている。 Some embodiments of the present technology may include a ventilation evaluation device. The apparatus can typically comprise a controller having at least one processor for accessing data representative of the measured flow of breathable gas due to patient breathing, the controller comprising: A ventilation measurement is derived from the flow measurement and (b) further configured to determine a histogram based on the ventilation measurement.
装置の一部のこのような実施形態では、コントローラが、視覚表示デバイスにヒストグラムのグラフを表示するようにさらに構成されてもよい。このような場合には、ヒストグラムが、治療セッション中に取得される換気値の度数分布を表すことができ、各換気値が時間間隔にわたる容量の測定値であり得る。時間間隔は、治療セッションの時間よりも短くすることができる。任意選択として、時間間隔は約1分とすることができ、治療セッションの時間は約数時間とすることができる。 In some such embodiments of the apparatus, the controller may be further configured to display a histogram graph on the visual display device. In such cases, the histogram can represent a frequency distribution of ventilation values acquired during a treatment session, where each ventilation value can be a measure of volume over a time interval. The time interval can be shorter than the time of the treatment session. Optionally, the time interval can be about 1 minute and the duration of the treatment session can be about a few hours.
装置の一部の実施形態では、コントローラが、ヒストグラムに関連するデータを処理して歪度指数を算出し、歪度指数を閾値と比較し、比較に基づいて低換気または過換気の発生を示すように構成されてもよい。 In some embodiments of the device, the controller processes data associated with the histogram to calculate a skewness index, compares the skewness index to a threshold, and indicates the occurrence of hypoventilation or hyperventilation based on the comparison. It may be configured as follows.
任意選択として、コントローラは、ヒストグラムに関連するデータを処理してヒストグラムのピークの数を検出し、検出されたピークの数に基づいて低換気の有無を示すようにも構成されてもよい。コントローラは、ヒストグラムに関連するデータを処理して尖度指数を決定し、尖度指数を閾値と比較し、比較に基づいて低換気の有無を示すように構成されてもよい。 Optionally, the controller may also be configured to process data associated with the histogram to detect the number of peaks in the histogram and to indicate the presence or absence of hypoventilation based on the number of detected peaks. The controller may be configured to process data associated with the histogram to determine a kurtosis index, compare the kurtosis index to a threshold, and indicate the presence or absence of hypoventilation based on the comparison.
一部のこのような実施形態では、装置が流量センサをさらに備えることができ、コントローラが、流量センサによる呼吸可能ガスの流量の測定を制御するように構成されてもよい。 In some such embodiments, the apparatus may further comprise a flow sensor, and the controller may be configured to control the measurement of the flow of breathable gas by the flow sensor.
さらに、装置は、大気圧よりも高い圧力で患者のための呼吸可能ガスを発生させるように構成された流れ発生装置をさらに備えることができる。このような場合に、コントローラは、流れ発生装置を制御して、(a)ヒストグラム、(b)ヒストグラムのピークの数、(c)ヒストグラムに関連するデータから決定された尖度指数、および(d)ヒストグラムに関連するデータから決定された歪度指数のうちのいずれか1つまたは複数の評価に基づいて、圧力治療法により呼吸可能ガスを発生させるようにも構成され得る。 Further, the device can further comprise a flow generator configured to generate breathable gas for the patient at a pressure greater than atmospheric pressure. In such a case, the controller controls the flow generator to (a) the histogram, (b) the number of peaks in the histogram, (c) the kurtosis index determined from the data associated with the histogram, and (d ) It may also be configured to generate respirable gas by pressure therapy based on the evaluation of any one or more of the skewness indices determined from the data associated with the histogram.
任意選択として、コントローラは、ヒストグラムを表すデータを処理して、低換気事象の発生を表す低換気インジケータを生成するように構成されてもよい。低換気インジケータは確率値を含むことができる。コントローラは、ヒストグラムのピークを検出するように構成されてもよい。コントローラは、ヒストグラムのピーク間の距離を算出し、距離を確率空間に変換するように構成されてもよい。コントローラは、ヒストグラムのピーク間の勾配を算出するように構成されてもよい。コントローラは、勾配に対する面積を算出し、面積を確率空間に変換するように構成されてもよい。一部の場合には、コントローラは、ヒストグラムの1組の特徴を算出し、1組の特徴の評価に基づいてインジケータを生成するように構成されてもよい。1組の特徴は、以下の特徴、すなわち、2つの最大ピーク間の勾配、最大ピークと中心点との間の勾配、2番目に大きなピークと中心点との間の勾配、2つの最大ピーク間の面積、最大ピークと中心点との間の面積、2番目に大きなピークと中心点との間の面積、形状特徴、尖度値、および歪度値のうちの1つまたは複数を含むことができる。 Optionally, the controller may be configured to process data representing the histogram to generate a hypoventilation indicator that represents the occurrence of a hypoventilation event. The hypoventilation indicator can include a probability value. The controller may be configured to detect a peak of the histogram. The controller may be configured to calculate a distance between peaks of the histogram and convert the distance to a probability space. The controller may be configured to calculate a slope between the peaks of the histogram. The controller may be configured to calculate an area for the gradient and convert the area to a probability space. In some cases, the controller may be configured to calculate a set of features in the histogram and generate an indicator based on the evaluation of the set of features. One set of features includes the following features: the slope between the two largest peaks, the slope between the largest peak and the center point, the slope between the second largest peak and the center point, and the distance between the two largest peaks 1, the area between the largest peak and the center point, the area between the second largest peak and the center point, the shape feature, the kurtosis value, and the skewness value. it can.
任意選択として、一部の場合には、コントローラが、漏れの測定値を決定し、漏れの測定値に基づいてヒストグラムのための換気の測定値を区別するように構成されてもよい。さらに、コントローラは、換気安定性の測定値を決定し、安定性の測定値に基づいてヒストグラムのための換気の測定値を区別するように構成されてもよい。コントローラは、覚醒期間、無呼吸事象、周期性呼吸事象、および覚醒事象のうちのいずれか1つまたは複数を検出することにより、換気安定性の測定値を決定することができる。 Optionally, in some cases, the controller may be configured to determine a measurement of the leak and differentiate the ventilation measurement for the histogram based on the leak measurement. Further, the controller may be configured to determine ventilation stability measurements and to distinguish ventilation measurements for the histogram based on the stability measurements. The controller can determine a measure of ventilation stability by detecting any one or more of a wake period, an apneic event, a periodic respiratory event, and a wake event.
本技術の別の実施形態は、換気評価システムを含むことができる。システムは、治療セッション中に患者の呼吸に起因する呼吸可能ガスの流量を測定するための手段と、換気の測定値を流量の測定値から引き出すための手段と、換気の測定値に基づいてヒストグラムを決定するための手段とを備えることができる。 Another embodiment of the present technology may include a ventilation assessment system. The system includes means for measuring the flow of breathable gas due to patient breathing during a treatment session, means for extracting ventilation measurements from the flow measurements, and histograms based on the ventilation measurements. Means for determining.
このようなシステムは、ヒストグラムの視覚グラフを表示するための手段をさらに備えることができる。システムは、ヒストグラムに関連するデータに基づいて歪度指数を評価して、低換気または過換気の発生を検出するための手段を備えることもできる。システムは、ヒストグラムに関連するデータからヒストグラムのピークの数を評価して、低換気の発生を検出するための手段を備えることもできる。システムは、ヒストグラムに関連するデータに基づいて尖度指数を評価して、低換気の有無を検出するための手段を備えることもできる。一部の実施形態では、システムは、(a)ヒストグラム、(b)ヒストグラムのピークの数、(c)ヒストグラムに関連するデータから決定された尖度指数、および(d)ヒストグラムに関連するデータから決定された歪度指数のうちのいずれか1つまたは複数の評価に基づいて、大気圧よりも高い圧力で患者のための呼吸可能ガスを発生させるための手段を備えることもできる。 Such a system may further comprise means for displaying a visual graph of the histogram. The system can also comprise means for evaluating the skewness index based on data associated with the histogram to detect the occurrence of hypoventilation or hyperventilation. The system may also include means for evaluating the number of histogram peaks from data associated with the histogram to detect the occurrence of hypoventilation. The system can also include means for evaluating the kurtosis index based on data associated with the histogram to detect the presence or absence of hypoventilation. In some embodiments, the system includes (a) a histogram, (b) the number of peaks in the histogram, (c) a kurtosis index determined from data associated with the histogram, and (d) from data associated with the histogram. Means may also be provided for generating a breathable gas for the patient at a pressure above atmospheric pressure based on the evaluation of any one or more of the determined skewness indices.
システムは、ヒストグラムを表すデータを処理して、低換気事象の発生を表す低換気インジケータを生成するための手段を備えることもできる。低換気インジケータは確率値を含むことができる。システムは、ヒストグラムのピークを検出するための手段を備えることもできる。システムは、ヒストグラムのピーク間の距離を算出し、距離を確率空間に変換するための手段を備えることもできる。システムは、ヒストグラムのピーク間の勾配を算出するための手段を備えることもできる。システムは、勾配に対する面積を算出し、面積を確率空間に変換するための手段を備えることもできる。システムは、ヒストグラムの1組の特徴を算出し、1組の特徴の評価に基づいてインジケータを生成するための手段を備えることもできる。1組の特徴は、以下の特徴、すなわち、2つの最大ピーク間の勾配、最大ピークと中心点との間の勾配、2番目に大きなピークと中心点との間の勾配、2つの最大ピーク間の面積、最大ピークと中心点との間の面積、2番目に大きなピークと中心点との間の面積、形状特徴、尖度値、および歪度値のうちの1つまたは複数を含むことができる。 The system can also comprise means for processing the data representing the histogram to generate a hypoventilation indicator representing the occurrence of a hypoventilation event. The hypoventilation indicator can include a probability value. The system may also comprise means for detecting histogram peaks. The system can also comprise means for calculating the distance between the peaks of the histogram and converting the distance to a probability space. The system can also comprise means for calculating the slope between the peaks of the histogram. The system can also comprise means for calculating an area for the gradient and converting the area into a probability space. The system may also comprise means for calculating a set of features of the histogram and generating an indicator based on the evaluation of the set of features. One set of features includes the following features: the slope between the two largest peaks, the slope between the largest peak and the center point, the slope between the second largest peak and the center point, and the distance between the two largest peaks 1, the area between the largest peak and the center point, the area between the second largest peak and the center point, the shape feature, the kurtosis value, and the skewness value. it can.
一部の場合には、システムが、漏れの測定値を決定するための漏れ検出器を備えることができる。システムは、漏れの測定値に基づいてヒストグラムのための換気の測定値を区別するように構成されてもよい。同様に、システムは、換気安定性検出器を備えることができる。システムは、安定性の測定値に基づいてヒストグラムのための換気の測定値を区別するように構成されてもよい。一部のこのような場合には、換気安定性検出器が、覚醒期間、無呼吸事象、周期性呼吸事象、および覚醒事象のうちのいずれか1つまたは複数を検出するための手段を備えることができる。 In some cases, the system can include a leak detector for determining a leak measurement. The system may be configured to distinguish ventilation measurements for the histogram based on leak measurements. Similarly, the system can include a ventilation stability detector. The system may be configured to distinguish ventilation measurements for the histogram based on stability measurements. In some such cases, the ventilation stability detector comprises means for detecting any one or more of a wake period, apnea event, periodic respiratory event, and wake event Can do.
本換気評価技術のさらなる特徴が、以下の詳細な説明、図面、および特許請求の範囲を検討することにより明らかになろう。 Further features of this ventilation assessment technique will become apparent upon review of the following detailed description, drawings, and claims.
本技術は、例として示されたものであり、限定するためのものではない。添付図面において、同一の参照符号は同一の要素を示している。 This technique is provided by way of example and not limitation. In the accompanying drawings, the same reference numerals denote the same elements.
図1に示すように、本技術の実施形態は、コントローラ104を有する換気評価デバイス102または装置を備えることができ、コントローラ104は、本明細書でより詳細に説明するアルゴリズムなどの特定の換気評価方法を実施するための1つまたは複数のプロセッサを備えることができる。一部のこのような実施形態では、換気評価は、例えば過換気または低換気の事象を決定することによって、換気の充足度の決定を行うことができる。換気評価は、任意選択として、換気ヒストグラムを発生させ、または分析することなどによりこのような決定を行うための情報を提供することもできる。プロットされた換気ヒストグラム110の例が図1に示されている。これらの目的を達成するために、デバイスまたは装置は、集積チップ、メモリおよび/または他の制御指示、データまたは情報記憶媒体を含むことができる。例えば、評価方法を含むプログラムされた指示をデバイスまたは装置のメモリ内の集積チップにコード化して、特定用途集積チップ(ASIC)を形成することができる。また、または代替として、このような指示を、適切なデータ記憶媒体を使用して、ソフトウェアまたはファームウェアとしてロード(load)することができる。
As shown in FIG. 1, embodiments of the technology may comprise a
このようなコントローラまたはプロセッサにより、デバイスを流量信号からのデータを処理するために使用することができる。したがって、本明細書でより詳細に記載する実施形態において説明するように、プロセッサは、先行する睡眠セッションから測定されかつ記録された呼吸流量データへのアクセスに基づいて、患者の換気の評価を制御することができる。あるいは、睡眠セッション中に、呼吸流量信号の測定と同時に換気評価を行うことが可能である。これにより、一部の実施形態では、デバイスまたは装置自体を、任意選択として、実施された方法で使用する流量信号を測定するための流量センサ106により実施することができる。例えば、鼻カニューレ108またはマスクへの流量またはこれらを通る流量を、呼吸気流計および差圧変換器、または流量信号を引き出すためにチューブまたはダクトの束を使用するものなどの同様のデバイスを使用して、測定することができる。任意選択として、流量センサが患者の呼吸流量に加えてガス流量を測定する場合などに、流量センサにより生じる全流量の測定値から、換気流量および漏れ流量の推定測定値を減算することにより、患者の呼吸流量信号を決定することができる。任意選択として、その全体が相互参照により本明細書に組み込まれている、2005年11月2日に出願されたPCT/AU2005/001688、およびその国内段階である米国特許出願第12/294,957号に記載されたモータ電流センサなどの他のセンサから、流量信号を推測することができる。同様に、パルス無線周波数トランシーバおよび反射パルス無線周波数信号の信号処理などによる非接触センサ、または超音波スクリーニングセンサにより、流量信号を生成することができる。例えば、センサは、超音波センサの使用などにより音を監視して、センサにより測定された信号から呼吸流量信号などの呼吸パラメータを検出することが可能である。
With such a controller or processor, the device can be used to process data from the flow signal. Accordingly, as described in the embodiments described in more detail herein, the processor controls the assessment of patient ventilation based on access to respiratory flow data measured and recorded from previous sleep sessions. can do. Alternatively, the ventilation evaluation can be performed simultaneously with the measurement of the respiratory flow signal during a sleep session. Thereby, in some embodiments, the device or apparatus itself can optionally be implemented with a
(A)例示的な換気評価特徴
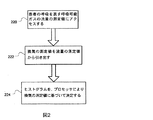
図2のフローチャートに示すように、本技術の一部の実施形態では、評価デバイスによる換気の自動評価が、呼吸可能ガスの流量の測定値を表すデータまたは呼吸流量信号に基づかせること可能な換気ヒストグラムの決定または算出を含むことができる。例えば、220で、コントローラまたはプロセッサは、夜間睡眠または数時間の治療などの治療セッション中に取得することのできる患者の呼吸を表す呼吸可能ガスの流量の測定値にアクセスすることができる、222で、コントローラまたはプロセッサが、患者の換気の測定値または換気の測定値を、流量の測定値から引き出すことができる。換気の測定値は、典型的には、ある期間にわたって吸入または吐出される空気の容量を表す信号とすることができる。例えば、このような測定値を、呼吸流量のローパスフィルタリングされた絶対値として決定することができる。このようなローパスフィルタを、約数分の時定数で実施することができる。例えば、時定数は60から200秒の範囲とすることができるが、好ましくは約180秒である。測定値を分割またはサンプリングして、離散測定値を換気信号から決定することができる。任意選択として、これらの換気の測定値の各値を、1分間に吸入または吐出されるリットル数として表すことができる(例えば、分時換気量の測定値)。あるいは、換気の測定値を、1サイクル当たりのリットルなどの、治療セッション中の各呼吸サイクルについて測定された1回換気量とすることができる。
(A) Exemplary Ventilation Assessment Features As shown in the flow chart of FIG. 2, in some embodiments of the present technology, automatic assessment of ventilation by the assessment device is a data or breath that represents a measure of the flow of breathable gas. The determination or calculation of a ventilation histogram that can be based on the flow signal can be included. For example, at 220, the controller or processor can access a measure of breathable gas flow that represents patient breathing that can be acquired during a treatment session, such as night sleep or a few hours of treatment, at 222. A controller or processor can derive a patient's ventilation measurements or ventilation measurements from the flow measurements. A ventilation measurement can typically be a signal representing the volume of air that is inhaled or exhaled over a period of time. For example, such a measurement can be determined as a low-pass filtered absolute value of respiratory flow. Such a low-pass filter can be implemented with a time constant of about several minutes. For example, the time constant can range from 60 to 200 seconds, but is preferably about 180 seconds. The measurements can be divided or sampled and the discrete measurements can be determined from the ventilation signal. Optionally, each of these ventilation measurements can be expressed as the number of liters inhaled or discharged per minute (eg, minute ventilation measurements). Alternatively, the ventilation measurement can be a tidal volume measured for each respiratory cycle during the treatment session, such as liters per cycle.
224で、換気ヒストグラムを、プロセッサにより換気の測定値に基づいて決定することができる。例えば、治療セッション中に取得された換気の測定値の度数分布を計算することができる。例えば、決定された換気値を離散間隔(例えば、1分間当たりのリットルまたはほぼそのリットル)と比較して、測定されたすべての換気値がどのような頻度で異なる間隔にあるかを決定することができる。任意選択として、換気ヒストグラムを、高い度数または最大度数(例えば、1つまたは複数のピーク)の間隔または複数の間隔が観察され得るようにプロットすることができる。同様に、これに関連するデータを、高い度数または最大度数(例えば、1つまたは複数のピーク)の間隔または複数の間隔が検出され得るようにプロセッサにより評価することができる。任意選択として、データを評価して、歪度および/または尖り(例えば、尖度)を決定することもできる。 At 224, a ventilation histogram can be determined by the processor based on the ventilation measurements. For example, a frequency distribution of ventilation measurements taken during a treatment session can be calculated. For example, comparing the determined ventilation values to discrete intervals (eg, liters per minute or approximately liters per minute) to determine how often all measured ventilation values are at different intervals Can do. Optionally, the ventilation histogram can be plotted such that a high frequency or maximum frequency (eg, one or more peaks) interval or intervals can be observed. Similarly, data associated therewith can be evaluated by the processor such that a high frequency or maximum frequency (eg, one or more peaks) interval or intervals can be detected. Optionally, the data can be evaluated to determine skewness and / or kurtosis (eg, kurtosis).
任意選択として、換気ヒストグラムに関連するデータを評価して、以下の特徴、すなわち、換気ヒストグラムの形状特徴、換気ヒストグラムの2つの最大ピークをつなぐ直線の勾配、換気ヒストグラムの最高ピークと中心点とをつなぐ直線の勾配、換気ヒストグラムの2番目に高いピークと中心点とをつなぐ直線の勾配、換気ヒストグラムの中心点および最高ピークよりも下方の面積、換気ヒストグラムの中心点および2番目に高いピークよりも下方の面積、2つの最高ピーク間の距離のうちの1つまたは複数を決定することもできる。 Optionally, evaluate the data related to the ventilation histogram to determine the following characteristics: the shape characteristics of the ventilation histogram, the slope of the straight line connecting the two maximum peaks of the ventilation histogram, the highest peak and the center point of the ventilation histogram. The slope of the connecting straight line, the slope of the straight line connecting the second highest peak and center point of the ventilation histogram, the area below the center point and highest peak of the ventilation histogram, the center point of the ventilation histogram and the second highest peak One or more of the lower area and the distance between the two highest peaks can also be determined.
このような観察または評価を、その後、任意選択として、個々で、または組み合わせて使用して、低換気または過換気の事象が起きたか否かを決定することができる。したがって、換気評価デバイスは、換気ヒストグラムの決定に加えて、低換気または過換気の事象をスコアリングまたは記録することもできる。このような事象のスコアリングは、任意選択として、過換気または低換気の事象を示す、引き出された換気値の特定を含むことができる。任意選択として、スコアリングは、事象が起こった時の治療セッション中および/または事象の持続時間中の時間、または1つもしくは複数の期間の特定を含むこともできる。 Such observations or assessments can then optionally be used individually or in combination to determine whether a hypoventilation or hyperventilation event has occurred. Thus, the ventilation assessment device can also score or record hypoventilation or hyperventilation events in addition to determining the ventilation histogram. Scoring of such events can optionally include the identification of elicited ventilation values that indicate hyperventilation or hypoventilation events. Optionally, scoring can also include identifying the time during the treatment session when the event occurs and / or the duration of the event, or one or more time periods.
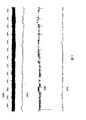
本技術の例示的な換気評価を、図3および図4を参照して考慮することができる。図3は、1回の夜間治療セッション中の、CPAPを受けている十分に治療された患者からの呼吸データのプロットである。含まれるトレースは、(上から下へ)呼吸流量330F、換気330V、血中酸素飽和度(SpO2)330S、および漏れ330Lである。本例では、180秒の時定数を有する呼吸流量信号のローパスフィルタリングされた絶対値である換気信号が、一晩中安定している。SpO2信号330Sは平らであり、夜間に約94%を下回ることはない。漏れ信号330Lも、実質的な漏れの事象がないという点で、十分に制御されている。
An exemplary ventilation assessment of the present technology can be considered with reference to FIGS. 3 and 4. FIG. 3 is a plot of respiratory data from a well-treated patient receiving CPAP during a single night treatment session. The traces included are (from top to bottom)
図4は、夜間の換気信号330Vのデータから決定された、プロットされた換気ヒストグラム110−Nを示している。本例では、換気値が、毎分約0.5リットルのビンまたは間隔で評価された。各ビンまたは間隔に関連する度数を、全治療セッションの百分率として(例えば、1治療セッション中に観察され、またはサンプリングされた換気値の総数により分割された各間隔において、観察され、またはサンプリングされた換気値の数により)決定することができる。一部のこのような実施形態では、ヒストグラムに1回のピークがあり、1回のピークが十分な換気値(例えば、毎分7.5リットル)に関連しているとの決定を、セッションについての正常な患者の換気のインジケータとして取得することができる。度数のおよび換気の他の測定値を換気ヒストグラムのために使用してもよいことを理解されたい。例えば、上記の換気ヒストグラムは、1回の治療セッション中の分時換気量値の度数分布を示すものとして例示されているが、一部の実施形態は、任意選択として、複数の治療セッション(例えば、1週間または1か月の治療セッションなど)からの換気値を使用して、換気ヒストグラムの生成を可能にすることもできる。
FIG. 4 shows a plotted ventilation histogram 110-N determined from data of the
図4に示す前述した実施形態では、0.5リットル/分の例示的なビン幅が選択された。しかし、考えられるどのような方法でビンを設定してもよい。有用となり得るヒストグラム決定およびビン選択のためのいくつかの標準的戦略があり得る。 In the previously described embodiment shown in FIG. 4, an exemplary bin width of 0.5 liters / minute was selected. However, the bins may be set by any conceivable method. There can be several standard strategies for histogram determination and bin selection that can be useful.
このようなヒストグラムを、以下により算出することができる。
1. 原点x0(図4の点(0、0)と一致)を選択し、数直線(例えば、換気信号)を幅hのビンBに分割する。これを数学的に、Bj=[x0+(j−1)h、x0+jh]、j=1、2、…と表すことができる。
2. 各ビンBjに分類される観察を数え、観察の数をnjによりビンjに示す。
3. 各ビンについて、頻度数をサンプル数n(例えば、1治療セッション)で割り、ビン幅h→fj=nj/nhにより、頻度数を相対度数に変換する。
Such a histogram can be calculated by:
1. The origin x0 (matches the point (0, 0) in FIG. 4) is selected, and the number line (eg, ventilation signal) is divided into bins B of width h. This can be expressed mathematically as Bj = [x0 + (j−1) h, x0 + jh], j = 1, 2,.
2. The observations classified into each bin Bj are counted and the number of observations is indicated in bin j by nj.
3. For each bin, the frequency number is divided by the sample number n (for example, one treatment session), and the frequency number is converted to a relative frequency by bin width h → fj = nj / nh.
ビン幅および原点は、データの分布を効果的に特徴化する際に重要な役割を有することができる。ヒストグラムの原点を、数直線に沿ったいずれかの位置から選択することができる→例示的な選択は最小(データ)−範囲/10であり、ここで範囲=最大(データ)−最小(データ)である。さらに、ビン幅パラメータを考察する別の方法は、ビン幅を平滑パラメータとして見ることである。ビン幅が大きすぎると、ヒストグラムが平らに見えるが、ビン幅が小さすぎる場合には、ヒストグラムはデータを再現するだけである。したがって、適切なビン幅を選択することが重要である。 Bin width and origin can have an important role in effectively characterizing the distribution of data. The origin of the histogram can be selected from any position along the number line-> exemplary selection is minimum (data)-range / 10, where range = maximum (data)-minimum (data) It is. Furthermore, another way to consider the bin width parameter is to look at the bin width as a smoothing parameter. If the bin width is too large, the histogram will appear flat, but if the bin width is too small, the histogram will only reproduce the data. Therefore, it is important to select an appropriate bin width.
ビン幅を選択する考えられる方法がいくつかある。
1. もっとも簡単な手法は、データを目視検査して、ビン幅を選択することである。この方法の延長は、データの最大値および最小値を見出し、これを選択されたビン幅で割ることである。
2. スタージェスの公式h=log2(n)+1→ここでn=サンプル数
3. スコットの公式h=3.5σ/n1/3σ=サンプルの標準偏差、n=サンプル数
4. MISEおよびAMISEなどの最適化技術を使用して、ビン幅を選択することができる。
There are several possible ways to select the bin width.
1. The simplest approach is to visually inspect the data and select the bin width. An extension of this method is to find the maximum and minimum values of the data and divide this by the selected bin width.
2. Sturges formula h = log2 (n) + 1 → where n = number of samples Scott's formula h = 3.5σ / n 1/3 σ = standard deviation of samples, n = number of samples Bin widths can be selected using optimization techniques such as MISE and AMISE.
別の例示的な実施では、ヒストグラムアルゴリズムが、ビン幅が可変となり得るように、ビン幅を動的に決定するための方法を含んでいてもよい。特に、可変ビン幅は、まばらに分布したデータセットを特徴化する際に有用となり得る。例えば、低換気が発現する限られた期間のみを患者が有する場合、一定のビン幅の使用は、これを明確に提示または検出しないおそれがある。このような状況で、可変ビン幅の使用は非常に有用となり得る。 In another exemplary implementation, the histogram algorithm may include a method for dynamically determining the bin width so that the bin width can be variable. In particular, variable bin widths can be useful in characterizing sparsely distributed data sets. For example, if a patient has only a limited period of time when hypoventilation develops, the use of a constant bin width may not clearly present or detect this. In such situations, the use of variable bin width can be very useful.
[カーネル密度推定]
換気評価方法の別の実施は、換気信号の分布を捉えるカーネル密度推定器の使用に基づかせることができる。この手法の利点は、分布中のはっきりした特徴を効果的に捉えることができることであり、これは換気信号を特徴化する場合に非常に有利となり得る。さらに、原点の選択は分布の特徴化に影響を与えることはない。
[Kernel density estimation]
Another implementation of the ventilation assessment method can be based on the use of a kernel density estimator that captures the distribution of ventilation signals. The advantage of this approach is that it can effectively capture distinct features in the distribution, which can be very advantageous when characterizing ventilation signals. Furthermore, the selection of the origin does not affect the distribution characterization.
図5および図6を参照して、本技術のさらなる例示的な換気評価を考慮することができる。図5は、1回の夜間治療セッション中に低換気になっている、CPAPを受けている患者からの呼吸データのプロットである。含まれるトレースは、(上から下へ)、脳波記録530EEG、呼吸流量530F、換気530V、および血中酸素飽和度(SpO2)530Sである。本例では、180秒の時定数を有する呼吸流量信号のローパスフィルタリングされた絶対値でもある換気信号が、グラフ後半の延長期間に低下している。SpO2信号も、延長期間に低下している。図6は、夜間の換気信号530Vのデータから決定された、プロットされた換気ヒストグラム110−Hを示している。換気ヒストグラムのデータの観察または分析により、患者の状態についての結論を出すことができる。例えば、ヒストグラムの分析は、患者の換気が二峰性分布であることを検出することができる。一部の実施形態では、これを2つのピークの存在を検出することにより決定することができる。いずれかのピークに起因する換気値または間隔の評価が低換気を示す場合、分析を、低換気の事象の表示とみなすことができる。図6の例では、1つのピークが毎分約5リットルであり、他のピークが毎分約9リットルである。毎分5リットルのピークを、低換気のインジケータとみなすことができる。
With reference to FIGS. 5 and 6, further exemplary ventilation assessments of the present technology can be considered. FIG. 5 is a plot of respiratory data from a patient undergoing CPAP who is hypoventilated during a single night treatment session. The included traces (from top to bottom) are EEG recording 530EEG,
しかし、このような分析は、口漏れの存在により困惑させるものである。したがって、換気評価の一部の実施形態は、漏れの検出に基づいて換気データを分割することができる。例えば、本技術の換気評価デバイスを、口漏れ検出器などの漏れ検出器と組み合わせることができ、または漏れ検出器から漏れデータを受信することができる。一部の実施形態では、その全体が参照により本明細書に組み込まれている、2010年7月30日に出願された米国仮特許出願第61/369,247号に開示された方法のうちの1つまたは複数により、口漏れ検出器を実施することができる。したがって、漏れがない(例えば、漏れの測定値がゼロ以下)との決定に基づいて、換気ヒストグラムを評価することができる。例えば、ヒストグラムは、漏れのない治療期間からのみ取得された換気値に基づかせることができる。したがって、ヒストグラム評価は、漏れの期間と同時に生じる換気値を無視することができる。 However, such analysis is confused by the presence of mouth leaks. Thus, some embodiments of ventilation assessment can partition ventilation data based on leak detection. For example, a ventilation assessment device of the present technology can be combined with a leak detector, such as a mouth leak detector, or leak data can be received from the leak detector. In some embodiments, of the methods disclosed in US Provisional Patent Application No. 61 / 369,247, filed July 30, 2010, which is incorporated herein by reference in its entirety. A mouth leak detector can be implemented by one or more. Thus, the ventilation histogram can be evaluated based on a determination that there is no leak (eg, the leak measurement is less than or equal to zero). For example, the histogram can be based on ventilation values obtained only from a treatment period with no leaks. Thus, the histogram evaluation can ignore ventilation values that occur simultaneously with the duration of the leak.
任意選択として、別の漏れに関連するヒストグラムを、口漏れが検出される治療期間からのみ取得された換気値に基づいて計算することができる。このような場合には、その後、漏れに関連するヒストグラムを評価して、漏れのある期間および漏れのない期間からの換気値を含むより完全な換気ヒストグラムのデータに基づく低換気の考えられる指標を除外することができる。 Optionally, a histogram associated with another leak may be calculated based on ventilation values obtained only from the treatment period in which mouth leak is detected. In such a case, the leak-related histogram is then evaluated to provide a possible indication of hypoventilation based on more complete ventilation histogram data, including ventilation values from leaky and non-leak periods. Can be excluded.
さらに、治療中の換気に比較的長時間の不安定を生じさせる覚醒期間、無呼吸、周期性呼吸、および覚醒も、交絡因子となり得る。したがって、換気評価の一部の実施形態は、換気の不安定の検出に基づいて換気データを分割することができる。例えば、本技術の換気評価デバイスを、換気安定性検出器からの換気安定性データと組み合わせ、または換気安定性データを受信することができる。一部の実施形態では、参照により本明細書に記載されている、2009年7月16日に出願された米国仮特許出願第61/226,069号、2010年7月14日に出願された国際出願第PCT/AU2010/000894号、または2012年1月10日に出願された米国特許出願第13/383,341号に開示されたように、患者の換気についての安定性もしくは安定性の欠如を示すよう機能することのできる睡眠安定性測定値、覚醒状態、周期性呼吸、覚醒または他の事象もしくは測定値を引き出す方法などの方法のうちの1つまたは複数により、換気安定性検出器を実施することができる。したがって、換気安定性の決定(例えば、換気不安定がない)に基づき、換気ヒストグラムを評価することができる。例えば、換気レベルが安定しているためヒストグラムの形成を破壊しないことを換気安定性検出器が提示する治療期間から取得された換気値に、ヒストグラムを基づかせることができる。 In addition, wakefulness, apnea, periodic breathing, and wakefulness that cause relatively long periods of instability in ventilation during treatment can also be a confounding factor. Thus, some embodiments of ventilation assessment can partition ventilation data based on detection of ventilation instability. For example, the ventilation assessment device of the present technology can be combined with or receive ventilation stability data from a ventilation stability detector. In some embodiments, US provisional patent application 61 / 226,069 filed July 16, 2009, filed July 14, 2010, which is described herein by reference. Stability or lack of stability with respect to patient ventilation, as disclosed in International Application No. PCT / AU2010 / 000894 or US Patent Application No. 13 / 383,341, filed January 10, 2012 The ventilation stability detector by one or more of methods such as sleep stability measurement, wakefulness, periodic breathing, wakefulness or other event or measurement extraction method that can function to indicate Can be implemented. Thus, a ventilation histogram can be evaluated based on a determination of ventilation stability (eg, no ventilation instability). For example, the histogram can be based on a ventilation value obtained from a treatment period that the ventilation stability detector suggests that the ventilation level is stable and does not destroy the formation of the histogram.
別の実施形態では、換気安定性指数を、換気に関連する別の呼吸特徴のロール分散として算出することができる。このような特徴の一例は、吸気の1回換気量であり得る。他の例は、呼気の1回換気量、呼吸全体の1回換気量(例えば、呼吸長さで割った流量信号の絶対値の積分)を含む。その後、換気ヒストグラムを、これらの特徴のいずれかのロール分散が所定の閾値よりも小さい治療中に取得された換気値から形成することができる。 In another embodiment, the ventilation stability index can be calculated as a roll variance of another respiratory feature associated with ventilation. An example of such a feature may be inspiratory tidal volume. Other examples include exhaled tidal volume, tidal volume for the entire breath (eg, the integral of the absolute value of the flow signal divided by the respiratory length). A ventilation histogram can then be formed from the ventilation values obtained during the treatment where the roll variance of any of these features is less than a predetermined threshold.
さらに、本技術の別の実施形態では、換気ヒストグラムの算出を、漏れ検出器と換気安定性検出器の両方に従って行うことができる。このような場合、結果として生じるヒストグラムは、換気安定性および漏れのないことを特徴とする治療期間中の換気値を含んでいる。 Furthermore, in another embodiment of the present technology, the calculation of the ventilation histogram can be performed according to both a leak detector and a ventilation stability detector. In such a case, the resulting histogram contains ventilation values during the treatment period characterized by ventilation stability and no leakage.
(B)例示的な呼吸治療装置の実施形態
図8を参照して、本換気評価技術を、CPAPデバイスなどの呼吸治療装置802、または加圧された呼吸可能ガスを患者に供給する他の呼吸治療装置(例えば、恒常性CPAPまたは二相性CPAP)により実施することができる。このような装置は、サーボ制御送風機809などの流れ発生装置を含むことができる。送風機809は、典型的には、空気入口と、モータ(図示せず)により駆動されるインペラとを備えることができる。
(B) Exemplary Respiratory Therapy Apparatus Embodiment Referring to FIG. 8, the present ventilation assessment technique is applied to a respiratory
また、呼吸治療装置802は、典型的には、空気送出導管807およびマスク808を備え、空気流もしくは呼吸可能ガスを患者におよび/または患者から送る患者インタフェースを備え、あるいはこれに接続可能である。任意選択として、図8に示すように、マスクは、意図的に漏れを生じさせる換気孔を備えることができる。
The
また、装置802は、圧力センサ、流量センサおよび/もしくは酸素測定法センサなどの1つまたは複数のセンサ806を備え、あるいはこれに接続可能とすることができる。このような実施形態では、圧力変換器などの圧力センサが、送風機809により発生する圧力を測定し、圧力の測定値を示す圧力信号p(t)を生成することができる。同様に、流量センサは、患者の呼吸流量を表す信号を生成する。例えば、呼吸気流計および差圧変換器、または流量信号f(t)を引き出すためにチューブまたはダクトの束を使用するものなど、同様のデバイスを使用して、患者インタフェース808または検知チューブ(図示せず)にもっとも近い流量、または送風機809にもっとも近い流量を測定することができる。任意選択として、一体型酸素測定法センサを使用する場合、酸素測定法センサは、酸素飽和度などの血中ガス飽和度レベルを示す酸素測定法信号O2(t)を生成するパルスオキシメータであり得る。他のセンサを使用して、装置802の方法の目的で、流量、圧力または酸素測定法を示すデータを生成することができる。
The
流量f(t)および/または圧力p(t)信号などのセンサ信号に基づいて、コントローラ804は送風機制御信号を生成することができる。例えば、コントローラは、所望の圧力設定点を発生させ、送風機の速度をサーボ制御して、設定点を、圧力センサの測定された条件と比較することにより、設定点を満たすことができる。したがって、コントローラ804は、送風機809により患者インタフェースに送られる圧力に対して制御された変更を加えることができる。典型的には、このような設定は、所望の治療圧力を設定して、治療を患者の呼吸に同期させ、または患者の呼吸を支持するために行うことができ、例えばトリガおよび循環閾値などの制御パラメータと併せた流量信号の分析によって、患者の呼吸の状態の検出とともに行うことができる。任意選択として、機械放出弁(図示せず)により排気を制御して、比較的一定の送風速度を維持しながら排気を増減することにより、圧力を変更することができる。同様に、流量f(t)および/または圧力p(t)信号に基づいて、コントローラ804は、本明細書でより詳細に説明する本換気評価方法を実施することができる。
Based on sensor signals, such as flow rate f (t) and / or pressure p (t) signals, the
したがって、コントローラ804は、本明細書でより詳細に説明する特定の方法またはアルゴリズムを実施するようにプログラムされた1つまたは複数のプロセッサを備えることができる。この目的を達成するために、コントローラは、集積チップ、メモリおよび/または他の制御指示、データまたは情報記憶媒体を備えることができる。例えば、このような制御方法を含むプログラムされた指示を、デバイスのメモリ内の集積チップにコード化することができる。また、または代替として、このような指示を、適切なデータ記憶媒体を使用して、ソフトウェアまたはファームウェアとしてロードすることができる。
Accordingly, the
一部のこのような実施形態では、コントローラが、本明細書で説明したように、換気ヒストグラムの評価に基づいて低換気または過換気事象を検出またはスコアリングし、このような事象の検出に基づいて呼吸治療のための圧力制御パラメータを修正することができる。例えば、低換気事象の1つまたは複数が検出されると、コントローラは圧力を上昇させ、または治療プロトコルを自動的に変更して、より一定のCPAPモードから二相性PAPモードに切り換えることなどにより換気を増加させることができる。同様に、過換気事象の1つまたは複数が検出されると、コントローラは圧力を低下させ、または治療プロトコルを自動的に変更して、二相性CPAPモードからより一定のCPAPモードに切り換えることなどにより換気を減少させることができる。 In some such embodiments, the controller detects or scores hypoventilation or hyperventilation events based on evaluation of the ventilation histogram, as described herein, and based on detection of such events. The pressure control parameters for respiratory therapy can be modified. For example, if one or more of the hypoventilation events are detected, the controller increases the pressure or automatically changes the treatment protocol to change the ventilation by switching from a more constant CPAP mode to a biphasic PAP mode, etc. Can be increased. Similarly, if one or more of the hyperventilation events are detected, the controller may reduce the pressure or automatically change the treatment protocol to switch from biphasic CPAP mode to a more constant CPAP mode, etc. Ventilation can be reduced.
一部の実施形態では、コントローラは、換気ヒストグラムの換気評価に基づいて警告または情報メッセージを生成することができる。例えば、コントローラは、低換気または過換気の検出に関するメッセージを(例えば、LCD、もしくは装置の他の表示デバイス)に表示し、かつ/または(例えば、有線もしくは無線通信、または他のデータ転送により)送信することができる。コントローラは、換気ヒストグラムのデータによりメッセージを生成することもできる。コントローラは、メッセージを発生させてさらなる試験を提示することもできる。例えば、低換気の検出などの換気ヒストグラムの評価に基づいて、コントローラは、呼吸治療装置による次の治療セッションにおいて、患者がパルスオキシメータセンサの使用を開始することを提示または要求するメッセージを生成することができる。したがって、コントローラは、前のセッションからの換気ヒストグラムの分析に基づいて次の治療セッションでパルス酸素測定法データの分析を開始することができる。次のセッションにおけるパルス酸素測定法のデータをコントローラにより分析して、換気ヒストグラムの分析によって予め検出された換気不足(例えば、低換気)が生じているかを確認することができる。酸素測定法データの分析後に、さらなるメッセージをデバイスにより発生させて、過換気または低換気のために他の治療が必要となり得ること、または換気が許容できることを特定可能であることを患者および/または医師に対して特定することができる。 In some embodiments, the controller can generate a warning or information message based on the ventilation assessment of the ventilation histogram. For example, the controller may display a message regarding detection of hypoventilation or hyperventilation (eg, LCD or other display device of the apparatus) and / or (eg, via wired or wireless communication, or other data transfer) Can be sent. The controller can also generate a message from the ventilation histogram data. The controller can also generate a message to present further tests. For example, based on an evaluation of a ventilation histogram, such as detection of hypoventilation, the controller generates a message that suggests or requests that the patient begin using the pulse oximeter sensor in the next treatment session with the respiratory treatment device. be able to. Thus, the controller can begin analyzing pulse oximetry data in the next treatment session based on the analysis of the ventilation histogram from the previous session. The pulse oximetry data in the next session can be analyzed by the controller to see if a pre-detected lack of ventilation (eg, hypoventilation) has occurred by analysis of the ventilation histogram. After analysis of the oximetry data, additional messages may be generated by the device to identify that other treatments may be required for hyperventilation or hypoventilation, or that ventilation can be tolerated, and / or Can be identified to the doctor.
呼吸治療装置からの制御パラメータまたはメッセージへの他の変更を、換気ヒストグラム評価に基づく低換気または過換気の検出に従って行い、または提示することもできる。 Other changes to control parameters or messages from the respiratory therapy device can also be made or presented according to hypoventilation or hyperventilation detection based on ventilation histogram evaluation.
(C)さらなる例示的換気評価方法
圧力治療を行うように構成された呼吸治療装置のコントローラによって評価が行われるときなど、本技術の換気評価の一部の実施形態では、以下のステップまたは手順のいずれかまたはすべてを、コントローラにより実施することができる。
(C) Further exemplary ventilation assessment methods In some embodiments of the ventilation assessment of the present technology, such as when the assessment is performed by a controller of a respiratory therapy device configured to perform pressure therapy, the following steps or procedures: Any or all can be implemented by the controller.
1. 圧力治療装置の流れ発生装置(FG)の流量(QFG)を測定する。 1. The flow rate (Q FG ) of the flow generator (FG) of the pressure therapy device is measured.
2. 流れ発生装置の、またはその近くの圧力(PFG)を測定する。 2. Measure the pressure (P FG ) at or near the flow generator.
3. 公知の回路インピーダンス(Rcct)を使用して、患者のインタフェースまたはマスク圧力を
Pmask=PFG−QFG×Rcct
として算出する。
3. Using a known circuit impedance (R cct ), the patient interface or mask pressure is expressed as P mask = P FG −Q FG × R cct
Calculate as
4. 意図的な漏れ(例えば、換気孔のあるマスクの使用による換気流の場合)をマスクの圧力の公知の関数(f)として算出する。
Qvent=f(Pmask)
4). Intentional leaks (eg in the case of ventilation flow due to the use of a vented mask) are calculated as a known function (f) of the mask pressure.
Q vent = f (P mask )
5. 「マスク流」(Qmask)を
Qmask=QFG−Qvent
として算出する。
5. The “mask flow” (Q mask ) is changed to Q mask = Q FG −Q vent
Calculate as
6. 瞬間的な不注意によるまたは意図しない漏れ(Qleak)(例えば、前述した方法による口漏れ、および/または参照により本明細書に組み込まれている、米国特許第6,659,101号に記載された漏れ検出方法)を、マスク圧力およびマスク流量の関数(f)として
Qleak=f(Pmask、Qmask)
として算出する。
6). Instantaneous inadvertent or unintentional leaks (Q leak ) (eg, mouth leaks by the methods described above, and / or described in US Pat. No. 6,659,101, incorporated herein by reference) Leak detection method) as a function (f) of mask pressure and mask flow rate, Q leak = f (P mask , Q mask )
Calculate as
7. 患者の呼吸流量の推定値を
Qresp=Qmask−Qleak
として算出する。
7). Estimate the patient's respiratory flow as Q resp = Q mask −Q leak
Calculate as
8. 患者の換気の推定値を
V=LP(0.5×|Qresp|)
として算出する。ここでLPは、例えば、約180秒の時定数を有する単極ローパスフィルタである。
8). Estimate the patient's ventilation V = LP (0.5 × | Qresp |)
Calculate as Here, LP is a single pole low-pass filter having a time constant of about 180 seconds, for example.
9. 夜間またはセッションの持続時間にわたって患者の換気推定値のヒストグラムを算出する。 9. A histogram of patient ventilation estimates is calculated at night or over the duration of the session.
10. ピーク検出器を使用して、または使用せずに、ゼロ換気の、またはゼロ換気に非常に近いヒストグラムにピークがあるか否かを決定する。このピークがある場合には、このピークまたはこれに関連する生データを除去する(このようなデータは、流れ発生装置がオンであるが患者に接続されていない場合など、データ収集のない、またはデータ収集に異常のある延長期間を示すことができる)。 10. Determine whether there is a peak in the histogram of zero ventilation or very close to zero ventilation, with or without a peak detector. If this peak is present, remove this peak or the raw data associated with it (such data has no data collection, such as when the flow generator is on but not connected to the patient, or Can indicate an extended period of abnormal data collection).
11. ヒストグラムまたは関連するデータから統計を算出する。例えば、尖度(尖り)を表す指数および/または歪度を表す指数を決定する。 11. Calculate statistics from histograms or related data. For example, an index representing kurtosis (sharpness) and / or an index representing skewness is determined.
12. 低換気または低換気/過換気の指標としての、過度に正または負の歪度を有する分布を評価する。例えば、歪度指数が正の閾値を超える場合、低換気が発生していることの指標として、またはその根拠として比較を行うことができる。同様に、歪度指数が負の閾値を下回る場合、過換気が発生していることの指標として、またはその根拠として比較を行うことができる。これらの比較についての適切な閾値を、実験的に決定することができる。 12 Evaluate distributions with excessively positive or negative skewness as indicators of hypoventilation or hypoventilation / hyperventilation. For example, if the skewness index exceeds a positive threshold, a comparison can be made as an indicator of the occurrence of hypoventilation or as its basis. Similarly, if the skewness index is below a negative threshold, a comparison can be made as an indicator that hyperventilation has occurred or as a basis for it. Appropriate thresholds for these comparisons can be determined experimentally.
13. 緩尖分布(例えば、尖度<1)を評価する。これは、典型的には、より平らな中心部(例えば、より小さい「尖り」)を示す。ここでは閾値を1に設定することができる。例えば、ヒストグラムが1つまたは複数のより小さいピークおよびより大きいテールを有することを意味するように、より小さい尖度値を取得することができる。これは、典型的には、低換気の患者の換気ヒストグラムに見ることができる。概して、標準の正常な分布は尖度3であり、二峰性分布は多くの場合により大きいテールとより平らなピークとを有している。 13. Evaluate the gentle apex distribution (eg, kurtosis <1). This typically indicates a flatter center (eg, a smaller “spot”). Here, the threshold value can be set to 1. For example, a smaller kurtosis value can be obtained to mean that the histogram has one or more smaller peaks and a larger tail. This can typically be seen in the ventilation histogram of hypoventilated patients. In general, the normal normal distribution has a kurtosis of 3, and bimodal distributions often have larger tails and flatter peaks.
14. 分布を評価し、例えば、1つまたは複数のピーク(例えば、極大値)を検出することにより、分布が二峰性であるか否かを決定する。分布が二峰性である(例えば、2つのピークが検出された)場合、1つのピークに起因するより低い換気値が、換気値を適切な閾値と比較することにより、低換気状態を示すことをチェックする。同様に、他のピークが、換気値を適切な閾値と比較することにより正常な呼吸を示す換気値に起因することをチェックする。例えば、6.5から8.5の間、より詳細には、7.5l/分などの7から8の間の換気値が、正常な換気を示すこのような閾値として機能し得る。 14 The distribution is evaluated to determine whether the distribution is bimodal, for example, by detecting one or more peaks (eg, local maxima). If the distribution is bimodal (eg, two peaks detected), a lower ventilation value due to one peak indicates a hypoventilation condition by comparing the ventilation value to an appropriate threshold Check. Similarly, check that the other peaks are due to ventilation values indicating normal breathing by comparing the ventilation values to the appropriate threshold. For example, a ventilation value between 6.5 and 8.5, and more particularly between 7 and 8, such as 7.5 l / min, may serve as such a threshold indicative of normal ventilation.
15. 任意選択として、分布を評価して、M型検出アルゴリズムを使用して二峰性を決定することができる。これは、二峰性の存在を検出するための測定基準として機能し得る。1つのこのような方法が、その全体が参照により本明細書に組み込まれている、2008年5月9日に出願された国際特許出願第PCT/AU2008/000647号に記載されている。 15. Optionally, the distribution can be evaluated to determine bimodality using an M-type detection algorithm. This can serve as a metric for detecting the presence of bimodality. One such method is described in International Patent Application No. PCT / AU2008 / 000647 filed May 9, 2008, which is hereby incorporated by reference in its entirety.
16. 低換気の確認が、過度の口漏れにより生じたものでなく、または過度の口漏れに影響されたものではないことをチェックする(例えば、前述したように、1つまたは複数の漏れ分割換気ヒストグラムの分析により)。 16. Check that the confirmation of hypoventilation is not caused by or affected by excessive mouth leakage (eg, one or more leak-divided ventilation histograms as described above) By analysis).
17. 無呼吸低呼吸指数などの測定基準、または夜間流量データのセッションが低換気になっている人を示す、算出された確率を報告する。 17. Report calculated probabilities that indicate a person with hypoventilation, such as a metric such as apnea hypopnea index, or a session with nocturnal flow data.
18. 低換気の正の指標が与えられた場合、SpO2監視を行う1つまたは複数の夜間を提示する。 18. If a positive indicator of hypoventilation is given, one or more nights with SpO 2 monitoring are presented.
19. 睡眠関連低換気/低酸素血症の一般的な「規則」を使用して、SpO2記録から低換気があることを確認する。 19. Use the general “rules” of sleep-related hypoventilation / hypoxemia to confirm hypoventilation from the SpO 2 record.
[さらなる例示的な換気評価手順および方法]
以下のステップまたは手順の1つまたは複数を、前述したものに加えて、または代わりに実施することもできる。1つまたは複数のプロセッサまたはコントローラの制御された動作であり得るこれらのステップまたは手順を、図10から図17の例示したグラフにより考慮することができる。
a. ほとんどまたは全く漏れがなく、換気安定性があるときなどの、夜間またはセッションの持続時間にわたって患者の換気推定値のヒストグラムを算出する。
b. ピーク検出器を使用して、図10に示す例示的な高さYAおよびYBなど、ヒストグラムのピークの数およびそれらの高さを算出する。
c. 図11に示すように、ピーク位置PAとピーク位置PBとの間の距離PeakDなどの、ヒストグラムの2つの最大ピーク間の距離を算出する。
d. 変形関数を使用して、2つの最大ピーク間の距離を確率空間(0から1確率空間など)に変換する。概して、低換気の場合、2つのピークが離れるほど、何らかの低換気が起こる可能性が高くなる。言い換えると、患者の「自然な」換気レベルのピークと、患者の「より低い」換気レベル(低換気の期間中に見られると予想される)の別のピークとが予想される。変形関数の例が下記の表Tに示される。しかし、ピーク間の距離に関連する数字を、実数空間から0から1空間などの確率空間に変換可能な他の関数を使用してもよい。
[Additional Exemplary Ventilation Assessment Procedures and Methods]
One or more of the following steps or procedures may be performed in addition to or instead of those described above. These steps or procedures, which can be the controlled operation of one or more processors or controllers, can be considered by the illustrated graphs of FIGS.
a. A histogram of patient ventilation estimates is calculated over the duration of the night or session, such as when there is little or no leakage and ventilation stability.
b. A peak detector is used to calculate the number of histogram peaks and their height, such as the exemplary heights Y A and Y B shown in FIG.
c. As shown in FIG. 11, a distance between two maximum peaks of the histogram, such as a distance Peak D between the peak position P A and the peak position P B , is calculated.
d. A transformation function is used to convert the distance between the two largest peaks into a probability space (such as 0 to 1 probability space). In general, in the case of hypoventilation, the more the two peaks are separated, the more likely that some hypoventilation will occur. In other words, one would expect a peak for the patient's “natural” ventilation level and another peak for the patient's “lower” ventilation level (expected to be seen during periods of hypoventilation). Examples of deformation functions are shown in Table T below. However, other functions that can convert a number related to the distance between peaks from a real space to a probability space such as 0 to 1 space may be used.

患者の換気ヒストグラムを使用して、低換気の持続時間を推定することもできる。ピーク(例えば、PA)の下側のX座標は、低ピークが生じており、低換気のレベルとみなされ得る換気レベルを示している。ピークの振幅(例えば、YA)が、特定の換気が検出された3分期間の数を示すため、この振幅を使用して、所与の換気が測定された全持続時間を推定することができる。プロセッサは、図10に示す例示的な式により推定持続時間を算出するように構成することができる。 Patient ventilation histograms can also be used to estimate the duration of hypoventilation. The X coordinate below the peak (eg, P A ) indicates a ventilation level where a low peak has occurred and can be considered a level of hypoventilation. Since the amplitude of the peak (eg, Y A ) indicates the number of 3 minute periods in which a particular ventilation was detected, this amplitude can be used to estimate the total duration that a given ventilation was measured. it can. The processor can be configured to calculate the estimated duration according to the exemplary equation shown in FIG.
測定基準または確率を報告(例えば、記録、または出力として生成)して、夜間流量データのセッションが低換気になっている人を示す可能性の指標を提供することができる。図16は、表Tの関数G(x)に基づく確率分類システムが0.2の「低」確率に戻る、ほぼ単峰のピークのヒストグラムの例を示している。このような低確率は、低換気の存在の可能性がないことを示す指標とみなされ得る。一方、図17は、確率分類システムが0.85の「高」確率に戻る二峰性ヒストグラムの例を示している。これは、低換気の存在の可能性が高いことを示す指標とみなされ得る。一部の実施形態では、プロセッサが測定基準および/またはヒストグラムのグラフを生成して、低換気確率値、低換気値および/または低換気確率値と関連する低換気のレベルなどの低換気の指標を提供することができる。 Metrics or probabilities can be reported (eg, recorded or generated as output) to provide an indication of the likelihood that a session of night flow data will indicate a person with hypoventilation. FIG. 16 shows an example of a nearly unimodal peak histogram where the probability classification system based on the function G (x) in Table T returns to a “low” probability of 0.2. Such a low probability can be regarded as an indicator that there is no possibility of the presence of hypoventilation. On the other hand, FIG. 17 shows an example of a bimodal histogram in which the probability classification system returns to a “high” probability of 0.85. This can be taken as an indicator that the likelihood of the presence of hypoventilation is high. In some embodiments, the processor generates a graph of metrics and / or histograms to indicate hypoventilation, such as hypoventilation probability values, hypoventilation values, and / or hypoventilation levels associated with hypoventilation probability values Can be provided.
その後、報告された結果を、さらなる治療の指標を提供するために実施することができる。例えば、低換気の正の指標を、1つまたは複数の夜間のSpO2監視を提示するものとみなすことができる。このような一実施形態では、プロセッサが、確率を1つまたは複数の閾値と比較することにより、報告された確率を評価することができる。1つまたは複数の比較に基づいて、追加の試験(例えば、さらなるSpO2監視)またはいくつか他の治療を提示するメッセージを生成することができる。任意選択として、このような比較は、呼吸治療装置により発生する圧力治療の制御の変更(例えば、換気の測定値をサーボ制御して目的の換気を満たすように、圧力支持(PS)換気の増加または圧力支持換気の開始)またはさらなる評価などの、さらなる試験または治療を制御するトリガとして機能し得る。 The reported results can then be performed to provide further therapeutic indications. For example, a positive indicator of hypoventilation can be considered as presenting one or more nighttime SpO 2 monitors. In one such embodiment, the processor can evaluate the reported probability by comparing the probability to one or more thresholds. Based on one or more comparisons, a message can be generated that presents additional trials (eg, additional SpO 2 monitoring) or some other treatment. Optionally, such a comparison may include changes in the control of pressure therapy generated by the respiratory therapy device (eg, increased pressure support (PS) ventilation to servo control the ventilation measurements to meet the desired ventilation). Or it may serve as a trigger to control further testing or treatment, such as initiation of pressure support ventilation) or further evaluation.
例えば、一部のこのような場合には、装置のプロセッサにより制御可能なオキシメータなどにより血液ガスを評価するように、装置102を構成することもできる。プロセッサは、ヒストグラムの評価に基づき、SpO2データの分析を制御することにより低換気が存在することを確認することができる。このような場合には、プロセッサを、血液ガスからの睡眠関連低換気/低酸素血症検出の一般的な「規則」を実施するように構成することができる。その後、プロセッサは、換気ヒストグラム評価および血液ガス評価のそれぞれまたは両方に基づいて、出力として決定を生じさせることができる。
For example, in some such cases, the
さらなる実施では、以下の手順またはステップの1つまたは複数を、1つまたは複数のプロセッサにより実施することもできる。 In further implementations, one or more of the following procedures or steps may be performed by one or more processors.
a. 算出された患者の換気ヒストグラム(全ヒストグラムまたは不安定でないヒストグラム)のピークを、ピーク検出器などにより算出する。 a. The peak of the calculated ventilation histogram (total histogram or non-unstable histogram) of the patient is calculated by a peak detector or the like.
b. 図13に示すように、ヒストグラムのテールの2つの端点(TL1およびTL2)間の中点PCであり得る、ヒストグラムの中心などの中点を算出する。 b. As shown in FIG. 13, can be a midpoint P C between the two end points of the histogram tail (TL1 and TL2), it calculates a middle point such as the center of the histogram.
c. 図11を参照して前述したように、ヒストグラムの2つの最大ピーク間の距離PeakDを算出する。 c. As described above with reference to FIG. 11, the distance Peak D between the two maximum peaks of the histogram is calculated.
d. ヒストグラム中の2つの最大ピークをつなぐ直線の勾配などの、1つまたは複数の勾配を算出する。このような勾配を算出するための例示的な式が、図12に示される。 d. One or more slopes are calculated, such as the slope of a straight line connecting the two largest peaks in the histogram. An exemplary equation for calculating such a gradient is shown in FIG.
e. 図13の例に示す式などにより、最大ピークと中心点との間の勾配(例えば、勾配GradAC)を算出する。 e. A gradient (for example, gradient Grad AC ) between the maximum peak and the center point is calculated by the equation shown in the example of FIG.
f. 図13の例に示す式などにより、2番目に大きいピークと中心点との間の勾配(例えば、勾配GradBC)を算出する。 f. A gradient (for example, gradient Grad BC ) between the second largest peak and the center point is calculated by the equation shown in the example of FIG.
g. 図14の垂線により印をつけた面積、図15の水平線により示される最大ピークと中心点との間の面積、および/または図15の垂線により示されるような2番目に大きなピークと中心点との間の面積などの、勾配の1つまたは複数に応じたピーク間の面積を算出する。 g. The area marked by the vertical line in FIG. 14, the area between the largest peak and the center point indicated by the horizontal line in FIG. 15, and / or the second largest peak and center point as indicated by the vertical line in FIG. Calculate the area between peaks depending on one or more of the gradients, such as the area between.
h. M型検出器または検出アルゴリズムを使用する形状特徴などの1つまたは複数の形状特徴を算出する。この形状特徴は、二峰性の存在を検出するための測定基準として機能し得る。1つのこのような方法が、その全体が参照により本明細書に組み込まれている、2008年5月9日に出願された国際特許出願第PCT/AU2008/000647号に記載されている。任意選択として、他の形状検出機能に基づく他の、または追加の形状特徴を実施することができる。 h. One or more shape features are calculated, such as shape features using an M-type detector or detection algorithm. This shape feature can serve as a metric for detecting the presence of bimodality. One such method is described in International Patent Application No. PCT / AU2008 / 000647 filed May 9, 2008, which is hereby incorporated by reference in its entirety. Optionally, other or additional shape features based on other shape detection functions can be implemented.
i. 2つの最大ピーク間の勾配を、変形関数を使用して、0から1空間などの確率空間に変換する。勾配が非常に正または非常に負である場合、勾配は、ピーク位置が近すぎるか、または小さいほうのピークが小さすぎることを示す指標として機能し得る。これは低換気のない患者のヒストグラムに見られるため、非常に正または非常に負の勾配と関連する低換気の確率は、変形関数に従って0に近付くことができる。このような関数に従って勾配が0に近付くと、確率は1に近付くことができる。 i. The gradient between the two largest peaks is transformed into a probability space such as 0 to 1 space using a deformation function. If the slope is very positive or very negative, the slope can serve as an indicator that the peak position is too close or that the smaller peak is too small. Since this is seen in the histogram of patients without hypoventilation, the probability of hypoventilation associated with a very positive or very negative slope can approach zero according to a deformation function. When the gradient approaches 0 according to such a function, the probability can approach 1.
j. 最大ピークと中心点との間の勾配を、変形関数を使用して、0から1確率空間などの確率空間に変換する。勾配が非常に正または非常に負である場合、勾配は、ピーク位置が近すぎるか、または小さいほうのピークが小さすぎることを示す指標として機能し得る。これは低換気のない患者のヒストグラムに見られ、このような場合、低換気の確率は、変形関数に従って0に近付くことができる。このような関数に従って勾配が0に近付くと、確率は1に近付くことができる。 j. The gradient between the maximum peak and the center point is transformed into a probability space such as 0 to 1 probability space using a deformation function. If the slope is very positive or very negative, the slope can serve as an indicator that the peak position is too close or that the smaller peak is too small. This can be seen in the histogram of patients without hypoventilation, in which case the probability of hypoventilation can approach zero according to a deformation function. When the gradient approaches 0 according to such a function, the probability can approach 1.
k. 2番目に大きいピークと中心点との間の勾配を、変形関数を使用して、0から1確率空間などの確率空間に変換する。勾配が非常に正または非常に負である場合、勾配は、ピーク位置が近すぎるか、または小さいほうのピークが小さすぎることを示す指標として機能し得る。これは低換気のない患者のヒストグラムに見られるため、低換気の確率は、変形関数に従って0に近付くことができる。このような関数により勾配が0に近付くと、確率は1に近付くことができる。 k. The gradient between the second largest peak and the center point is transformed into a probability space, such as a 0 to 1 probability space, using a deformation function. If the slope is very positive or very negative, the slope can serve as an indicator that the peak position is too close or that the smaller peak is too small. Since this is seen in the histogram of patients without hypoventilation, the probability of hypoventilation can approach zero according to a deformation function. When the gradient approaches 0 by such a function, the probability can approach 1.
l. ピーク間の面積を、変形関数を使用して、0から1の確率空間などの確率空間に変換する。面積が十分に大きい場合、面積はピークが十分に離れていることを示す。このような場合の低換気確率は、確率関数に従って1に近付くことができる。より小さい面積については、面積が小さくなると、このような関数により確率が0に近付くことができる。 l. The area between the peaks is converted to a probability space, such as a 0 to 1 probability space, using a deformation function. If the area is sufficiently large, the area indicates that the peaks are sufficiently far apart. The low ventilation probability in such a case can approach 1 according to the probability function. For smaller areas, the probability can approach 0 with such a function as the area decreases.
m. 最大ピークと中心点との間の面積を、変形関数を使用して、0から1確率空間などの確率空間に変換する。面積が十分に大きい場合には、面積はピークが十分に離れていることを示す指標として機能することができる。このように面積が増加する場合、このような確率関数に従って、確率は1に近付くことができる。より小さい面積については、面積が小さくなると、このような関数により確率が0に近付くことができる。 m. The area between the maximum peak and the center point is converted to a probability space such as 0 to 1 probability space using a deformation function. If the area is sufficiently large, the area can serve as an indicator that the peaks are sufficiently far apart. If the area increases in this way, the probability can approach 1 according to such a probability function. For smaller areas, the probability can approach 0 with such a function as the area decreases.
n. 形状特徴を、変形関数を使用して、0から1の確率空間などの確率空間に変換する。このような実施された変形関数は、形状特徴の算出に使用される近似関数の性質によって決まる。 n. Transform shape features into a probability space, such as a 0 to 1 probability space, using a deformation function. Such implemented deformation function depends on the nature of the approximate function used to calculate the shape feature.
o. ヒストグラムにより特徴化される分布の尖度および歪度を算出する。 o. Calculate the kurtosis and skewness of the distribution characterized by the histogram.
p. 尖度および歪度を、変形関数を使用して、0から1確率空間などの確率空間に変換する。正の歪度を、低換気になる可能性が高いことを示す指標とみなすことができるため、変形確率は正の値について1に近付くことができる。負の歪度値は、低換気になる可能性が低いことを示すことができるため、低換気確率は、このような関数に従って0に近付くことができる。より高い尖度は、低換気になる可能性が高いことを示す指標とみなすことができるため、変形確率はこのような関数に従って1に近付くことができる。より低い尖度値を、低換気になる可能性が低いことを示す指標とみなすことができるため、低換気確率はこのような関数に従って0に近付くことができる。 p. Convert kurtosis and skewness into a probability space, such as 0 to 1 probability space, using a deformation function. Since the positive skewness can be regarded as an index indicating that there is a high possibility of low ventilation, the deformation probability can approach 1 for positive values. Since a negative skewness value can indicate that there is a low probability of hypoventilation, the hypoventilation probability can approach zero according to such a function. Since higher kurtosis can be considered as an indicator that there is a high probability of hypoventilation, the deformation probability can approach 1 according to such a function. Since a lower kurtosis value can be considered as an indicator that the probability of low ventilation is low, the low ventilation probability can approach 0 according to such a function.
このような手順により、1組の特徴のうち1つまたは複数の特徴を生じさせることができる。このような特徴は、以下を含んでもよい:
a. 2つの最大ピーク間の変換された勾配
b. 最大ピークと中心点との間の変換された勾配
c. 2番目に大きなピークと中心点との間の変換された勾配
d. 2つの最大ピーク間の変換された面積
e. 最大ピークと中心点との間の変換された面積
f. 2番目に大きなピークと中心点との間の変換された面積
g. 変換された形状特徴
h. 変換された尖度特徴
i. 変換された歪度特徴
前述したような、これらの特徴のそれぞれに関連する変形関数を、実験的に決定するか、または外部に公表されたデータに基づいて生成することができる。
Such a procedure can produce one or more features of a set of features. Such features may include the following:
a. The transformed slope between the two largest peaks b. Transformed slope between maximum peak and center point c. The transformed slope between the second largest peak and the center point d. The transformed area between the two largest peaks e. Transformed area between maximum peak and center point f. The transformed area between the second largest peak and the center point g. Transformed shape features h. Transformed kurtosis features i. Transformed skewness features As described above, deformation functions associated with each of these features can be determined empirically or can be generated based on externally published data.
一部の実施形態では、1組の特徴に基づいて、プロセッサを実施し、分類アルゴリズムなどにより、低換気確率を算出することができる。前記特徴の一部または全部を評価することができる。重み付け係数を実施することもできる。一部のこのような場合には、1組の変形確率または重み付け確率を1組の閾値と比較し、変形確率の値を前提として低換気の全体的な可能性を評価することができる。特定の一実施形態では、線形分類器をプロセッサにより実施して、全体の低換気確率を算出することができる。しかし、前述した特徴を使用可能な、ベイジアン分類などの他の分類方法を使用して、最終的な低換気確率を算出することができる。先の実施形態に関して、低換気確率を出力として報告することができる。1つまたは複数の閾値を比較することなどにより、値の評価を行って、さらなる治療もしくは評価、または前述したメッセージの生成を制御することができる。 In some embodiments, a processor may be implemented based on a set of features and a hypoventilation probability may be calculated, such as by a classification algorithm. Some or all of the features can be evaluated. A weighting factor can also be implemented. In some such cases, a set of deformation probabilities or weighting probabilities can be compared to a set of thresholds to assess the overall likelihood of hypoventilation given the value of the deformation probability. In one particular embodiment, the linear classifier can be implemented by a processor to calculate the overall hypoventilation probability. However, other classification methods, such as Bayesian classification, that can use the features described above can be used to calculate the final hypoventilation probability. For the previous embodiment, the hypoventilation probability can be reported as an output. Evaluation of the value can be performed, such as by comparing one or more thresholds, to control further treatment or evaluation, or the generation of the aforementioned message.
(D)例示的なシステム構造
図1または図8のデバイスのコントローラの例示的なシステム構造が、図8のブロック図に示される。図では、換気評価デバイス902または汎用コンピュータが、1つまたは複数のプロセッサ908を備えることができる。デバイスは、本明細書で説明したように、換気検出レポート(例えば、換気ヒストグラムデータ、低換気事象データ、過換気事象データ、歪度指数、尖度指数、および/または換気値など)、結果またはグラフ(例えば、図3、図4、図5、図6、図7の例に示すように、プロットされた換気ヒストグラムおよび/または信号トレース)をモニタまたはLCDパネルなどに出力するための表示インタフェース910を備えることもできる。例えば、キーボード、タッチパネル、制御ボタン、マウスなどのユーザ制御/入力インタフェース912を設けて、本明細書に記載の方法を作動させることもできる。デバイスは、プログラム指示、酸素測定法データ、流量データ、圧力データ、換気値データ、換気ヒストグラムデータなどのデータを送受信するための、センサ、またはバスなどのデータインタフェース914を含むこともできる。デバイスは、典型的には、前述した方法(例えば、図2)の制御指示を含むメモリ/データ記憶コンポーネントを含むこともできる。これらの指示は、本明細書でより詳細に説明するように、922で流量信号処理のためのプロセッサ制御指示(例えば、前処理方法、フィルタ)を含むことができる。また、これらの指示は、924で換気測定値決定のためのプロセッサ制御指示(例えば、分割、フィルタリング、およびサンプリングなど)を含むことができる。これらの指示は、926で、換気ヒストグラム決定または関連するデータ評価のためのプロセッサ制御指示(例えば、ピーク検出、ピーク計数、特徴分析、変形関数、尖度指数決定および閾値化、歪度指数決定および閾値化、二峰性検出、漏れ評価、低換気および/または過換気スコアリングなど)を含むこともできる。これらの指示は、換気データ、流量データ、ヒストグラム、尖度指数、歪度指数、ピーク、ピーク計数、勾配、変形確率、レポートおよびグラフなどの、これらの方法についての記憶されたデータ928を含むこともできる。最後に、これらの指示は、930で、警告または情報メッセージ発生、圧力治療制御変更、さらなる試験制御などの1つまたは複数のヒストグラム評価に対する応答を制御するためのプロセッサ制御指示を含むこともできる。
(D) Exemplary System Structure An exemplary system structure of the controller of the device of FIG. 1 or FIG. 8 is shown in the block diagram of FIG. In the figure, a
一部の実施形態では、プロセッサ制御指示および前述した方法を制御するためのデータが、汎用コンピュータにより使用するソフトウェアとして、コンピュータ読取可能な記録媒体に含まれ、汎用コンピュータにソフトウェアをロードするときに、汎用コンピュータが、本明細書で説明した方法のいずれかにより特定用途コンピュータとして機能することができるようにしてもよい。例えば、特定用途コンピュータは、圧力治療を制御し、または圧力もしくは流量データを測定するように構成されている必要はない。むしろ、コンピュータは、任意選択として呼吸治療装置から転送され得るこのようなデータにアクセスするだけであり得る。コンピュータは、その後、転送されたデータに基づいて、ヒストグラム決定および分析などの、本明細書に記載された換気評価方法を実施し、これに基づく警告または情報メッセージを生成することができる。 In some embodiments, the processor control instructions and data for controlling the above-described method are included in a computer-readable recording medium as software for use by a general purpose computer, and when loading the software to the general purpose computer, A general purpose computer may function as a special purpose computer by any of the methods described herein. For example, an application computer need not be configured to control pressure therapy or measure pressure or flow data. Rather, the computer may optionally only access such data that may be transferred from the respiratory treatment device. The computer can then perform the ventilation assessment methods described herein, such as histogram determination and analysis, based on the transferred data and generate warning or information messages based thereon.
前述した説明および添付図面において、特定の用語、等式、図面の符号は、本技術を完全に理解するために示される。一部の場合には、用語および符号が、技術の実施に必要ない特定の詳細を示す場合がある。例えば、評価方法の方法ステップが、ある順序で説明され、または図示されているが、このような順序は必要なものではない。当業者は、このような順序付けを修正することができ、かつ/またはその態様を並行して実施することができることを理解するだろう。 In the foregoing description and in the accompanying drawings, certain terms, equations, and reference numerals are set forth in order to provide a thorough understanding of the technology. In some cases, the terms and symbols may indicate specific details that are not necessary for the implementation of the technique. For example, although the method steps of the evaluation method are described or illustrated in an order, such an order is not required. One skilled in the art will appreciate that such ordering can be modified and / or aspects thereof can be implemented in parallel.
さらに、本明細書の技術を特定の実施形態に関連して説明したが、これらの実施形態は、本技術の原理および適用例を例示したものに過ぎないことを理解されたい。したがって、例示した実施形態に多くの修正を施すことができ、本技術の精神および範囲から逸脱することなく、他の構成を引き出すことができることを理解されたい。 Further, although the techniques herein have been described with reference to particular embodiments, it is to be understood that these embodiments are merely illustrative of the principles and applications of the techniques. Accordingly, it should be understood that many modifications can be made to the illustrated embodiments and that other configurations can be derived without departing from the spirit and scope of the present technology.
Claims (43)
患者の呼吸を表す呼吸可能ガスの流量の測定値にアクセスするステップであって、前記呼吸可能ガスの流量の測定値はセンサから得られる、ステップと、
前記流量の測定値から換気の測定値を引き出すステップと、
前記1つまたは複数のプロセッサにおいて、前記換気の測定値に基づいてヒストグラムを決定するステップと、
前記1つまたは複数のプロセッサにおいて、前記ヒストグラムを評価し、前記評価に基づいて、(a)低換気又は過換気の発生の指標を出力すること、あるいは(b)呼吸装置の作動パラメータを変化させることのうち、少なくとも1つを行なうステップとを含む方法。 A working method in a device for evaluating the sufficiency of ventilation from the measured flow rate of the breathing gaseous, in one or more processors,
Accessing a breathable gas flow measurement representative of patient breathing , wherein the breathable gas flow measurement is obtained from a sensor ;
Deriving a ventilation measurement from the flow measurement;
Determining a histogram based on the ventilation measurements in the one or more processors ;
In the one or more processors, the histogram is evaluated and, based on the evaluation, (a) outputting an indication of the occurrence of hypoventilation or hyperventilation, or (b) changing an operating parameter of the respiratory apparatus. Performing at least one of the above .
前記歪度指数を閾値と比較するステップと、
前記比較に基づいて低換気を示すステップと
をさらに含む、請求項1から4のいずれか一項に記載の方法。 Processing the data associated with the histogram to calculate a skewness index in the one or more processors;
Comparing the skewness index to a threshold;
5. The method of claim 1, further comprising indicating hypoventilation based on the comparison.
前記歪度指数を閾値と比較するステップと、
前記比較に基づいて過換気を示すステップと
をさらに含む、請求項1から5のいずれか一項に記載の方法。 Processing the data associated with the histogram to calculate a skewness index in the one or more processors;
Comparing the skewness index to a threshold;
6. The method of any one of claims 1-5, further comprising indicating hyperventilation based on the comparison.
前記検出されたピークの数に基づいて低換気の有無を示すステップと
をさらに含む、請求項1から6のいずれか一項に記載の方法。 Processing data associated with the histogram to detect the number of peaks in the histogram in the one or more processors;
The method according to any one of claims 1 to 6, further comprising the step of indicating the presence or absence of hypoventilation based on the number of detected peaks.
前記尖度指数を閾値と比較するステップと、
前記比較に基づいて低換気の有無を示すステップと
をさらに含む、請求項1から7のいずれか一項に記載の方法。 Processing data associated with the histogram to determine a kurtosis index in the one or more processors;
Comparing the kurtosis index to a threshold;
The method according to claim 1, further comprising the step of indicating the presence or absence of hypoventilation based on the comparison.
前記ヒストグラムに関連するデータを処理して歪度指数を算出し、
前記歪度指数を閾値と比較し、
前記比較に基づいて低換気の発生を示すようにさらに構成されている、請求項21または22に記載の装置。 The controller is
Processing the data associated with the histogram to calculate a skewness index;
Comparing the skewness index with a threshold;
23. The device of claim 21 or 22, further configured to indicate the occurrence of hypoventilation based on the comparison.
前記ヒストグラムに関連するデータを処理して歪度指数を算出し、
前記歪度指数を閾値と比較し、
前記比較に基づいて過換気の発生を示すようにさらに構成されている、請求項21または22に記載の装置。 The controller is
Processing the data associated with the histogram to calculate a skewness index;
Comparing the skewness index with a threshold;
23. The device of claim 21 or 22, further configured to indicate the occurrence of hyperventilation based on the comparison.
前記ヒストグラムに関連するデータを処理して前記ヒストグラムのピークの数を検出し、前記検出されたピークの数に基づいて低換気の有無を示すようにさらに構成されている、請求項21から23のいずれか一項に記載の装置。 The controller is
24. The apparatus of claim 21 to 23, further configured to process data associated with the histogram to detect the number of peaks in the histogram and to indicate the presence or absence of hypoventilation based on the number of detected peaks. The device according to any one of the above.
前記ヒストグラムに関連するデータを処理して尖度指数を決定し、
前記尖度指数を閾値と比較し、
前記比較に基づいて低換気の有無を示す
ようにさらに構成されている、請求項21から24のいずれか一項に記載の装置。 The controller is
Processing the data associated with the histogram to determine a kurtosis index;
Comparing the kurtosis index to a threshold;
25. Apparatus according to any one of claims 21 to 24, further configured to indicate the presence or absence of hypoventilation based on the comparison.
前記コントローラが、前記流れ発生装置を制御して、(a)前記ヒストグラム、(b)前記ヒストグラムのピークの数、(c)前記ヒストグラムに関連するデータから決定された尖度指数、および(d)前記ヒストグラムに関連するデータから決定された歪度指数のうちのいずれか1つまたは複数の評価に基づいて、圧力治療法により前記呼吸可能ガスを発生させるようにさらに構成されている、請求項29に記載の装置。 Further comprising a flow generator configured to generate a breathable gas for the patient at a pressure greater than atmospheric pressure;
The controller controls the flow generator to (a) the histogram, (b) the number of peaks of the histogram, (c) a kurtosis index determined from data associated with the histogram, and (d) 30. The apparatus of claim 29, further configured to generate the breathable gas by pressure therapy based on an evaluation of any one or more of skewness indices determined from data associated with the histogram. The device described in 1.
Applications Claiming Priority (3)
| Application Number | Priority Date | Filing Date | Title |
|---|---|---|---|
| US201161466560P | 2011-03-23 | 2011-03-23 | |
| US61/466,560 | 2011-03-23 | ||
| PCT/AU2012/000270 WO2012126041A1 (en) | 2011-03-23 | 2012-03-15 | Detection of ventilation sufficiency |
Publications (3)
| Publication Number | Publication Date |
|---|---|
| JP2014519856A JP2014519856A (en) | 2014-08-21 |
| JP2014519856A5 JP2014519856A5 (en) | 2015-04-09 |
| JP6002747B2 true JP6002747B2 (en) | 2016-10-05 |
Family
ID=46878525
Family Applications (1)
| Application Number | Title | Priority Date | Filing Date |
|---|---|---|---|
| JP2014500202A Active JP6002747B2 (en) | 2011-03-23 | 2012-03-15 | Ventilation sufficiency detection |
Country Status (6)
| Country | Link |
|---|---|
| US (1) | US10342939B2 (en) |
| EP (1) | EP2688466B1 (en) |
| JP (1) | JP6002747B2 (en) |
| CN (1) | CN103501690B (en) |
| AU (1) | AU2012231762B2 (en) |
| WO (1) | WO2012126041A1 (en) |
Families Citing this family (31)
| Publication number | Priority date | Publication date | Assignee | Title |
|---|---|---|---|---|
| US9862892B2 (en) | 2012-02-21 | 2018-01-09 | Battelle Memorial Institute | Heavy fossil hydrocarbon conversion and upgrading using radio-frequency or microwave energy |
| CA2869471C (en) | 2012-04-05 | 2021-07-20 | Fisher & Paykel Healthcare Limited | Respiratory assistance apparatus |
| WO2013160822A1 (en) * | 2012-04-24 | 2013-10-31 | Koninklijke Philips N.V. | Portable handheld pressure support system and method |
| US9839756B2 (en) | 2012-11-27 | 2017-12-12 | Resmed Limited | Methods and apparatus for ionization therapy |
| JP6226523B2 (en) * | 2012-12-28 | 2017-11-08 | キヤノン株式会社 | Subject information acquisition apparatus, display method, and data processing apparatus |
| WO2014203104A1 (en) * | 2013-06-19 | 2014-12-24 | Koninklijke Philips N.V. | Determining of subject zero flow using cluster analysis |
| EP4235120A3 (en) | 2014-05-27 | 2023-10-04 | Fisher & Paykel Healthcare Limited | Gases mixing and measuring for a medical device |
| US9931483B2 (en) * | 2014-05-28 | 2018-04-03 | Devilbiss Healtcare Llc | Detection of periodic breathing during CPAP therapy |
| NZ630640A (en) * | 2014-06-10 | 2016-03-31 | Resmed Ltd | Method and apparatus for treatment of respiratory disorders |
| US10112022B2 (en) | 2014-09-18 | 2018-10-30 | Devilbiss Healthcare Llc | Method for detecting an inspiratory flow limitation during sleep-disordered breathing |
| US10786645B2 (en) | 2014-12-30 | 2020-09-29 | Koninklijke Philips N.V. | Capnometry system with supplemental oxygen detection and method of operation thereof |
| JP6865686B2 (en) * | 2014-12-31 | 2021-04-28 | コーニンクレッカ フィリップス エヌ ヴェKoninklijke Philips N.V. | A system that performs histogram analysis of time-based capnography signals and how it works |
| US11497870B2 (en) * | 2015-02-24 | 2022-11-15 | Somnetics International, Inc. | Systems and methods for estimating flow in positive airway pressure therapy |
| US11247015B2 (en) | 2015-03-24 | 2022-02-15 | Ventec Life Systems, Inc. | Ventilator with integrated oxygen production |
| US10245406B2 (en) | 2015-03-24 | 2019-04-02 | Ventec Life Systems, Inc. | Ventilator with integrated oxygen production |
| KR101808691B1 (en) * | 2015-06-25 | 2017-12-14 | 충북대학교 산학협력단 | System and Method for Monitoring Respiration of Critical Patient |
| WO2017025840A1 (en) * | 2015-08-11 | 2017-02-16 | Koninklijke Philips N.V. | Capnography with decision support system architecture |
| WO2017062742A1 (en) * | 2015-10-09 | 2017-04-13 | University Of Utah Research Foundation | Ventilation devices and systems and methods of using same |
| CN108135493B (en) * | 2015-10-19 | 2021-05-28 | 皇家飞利浦有限公司 | Anomaly detection apparatus and method for ventilation mechanical parameter estimation |
| GB2599020B (en) | 2015-12-02 | 2022-06-22 | Fisher & Paykel Healthcare Ltd | Flow path sensing for flow therapy apparatus |
| CN105457135B (en) * | 2015-12-28 | 2018-12-28 | 湖南明康中锦医疗科技发展有限公司 | Ventilator pressure method of adjustment, device and ventilator |
| ITUB20160614A1 (en) * | 2016-02-10 | 2017-08-10 | Elbi Int Spa | ASSEMBLY OF PRESSURE TRANSDUCER AND ANTI-ENLARGING DEVICE FOR AN APPARATUS, FOR EXAMPLE A WASHING MACHINE. |
| JP7082064B2 (en) * | 2016-04-29 | 2022-06-07 | フィッシャー アンド ペイケル ヘルスケア リミテッド | System for determining airway patency |
| US10773049B2 (en) | 2016-06-21 | 2020-09-15 | Ventec Life Systems, Inc. | Cough-assist systems with humidifier bypass |
| EP3688770A1 (en) | 2017-09-28 | 2020-08-05 | Koninklijke Philips N.V. | System and method for detecting stroke in patients during pressure support therapy |
| US20220040428A1 (en) * | 2017-10-07 | 2022-02-10 | University Of Utah Research Foundation | Ventilation Devices and Systems and Methods of Using Same |
| DE102017011625A1 (en) * | 2017-12-15 | 2019-07-18 | Drägerwerk AG & Co. KGaA | A method, computer program, apparatus and respiratory system for detecting a leak in a patient gas module |
| WO2019221852A1 (en) | 2018-05-13 | 2019-11-21 | Ahmad Samir Saleh | Portable medical ventilator system using portable oxygen concentrators |
| US10866006B2 (en) * | 2018-06-25 | 2020-12-15 | Dell Products L.P. | Systems and methods for fan typing and anomaly detection |
| DE102018126553A1 (en) * | 2018-10-24 | 2020-04-30 | Dürr Dental SE | Sensor unit and air compressor system with such |
| DE102021000317A1 (en) | 2020-02-14 | 2021-08-19 | Löwenstein Medical Technology S.A. | Monitoring system for detecting leaks during ventilation and procedures |
Family Cites Families (20)
| Publication number | Priority date | Publication date | Assignee | Title |
|---|---|---|---|---|
| US5335654A (en) * | 1992-05-07 | 1994-08-09 | New York University | Method and apparatus for continuous adjustment of positive airway pressure for treating obstructive sleep apnea |
| DE69433729T2 (en) * | 1993-11-05 | 2005-04-28 | Resmed Ltd., North Ryde | Sensor for apnea |
| US6273088B1 (en) | 1997-06-13 | 2001-08-14 | Sierra Biotechnology Company Lc | Ventilator biofeedback for weaning and assistance |
| US6099481A (en) * | 1997-11-03 | 2000-08-08 | Ntc Technology, Inc. | Respiratory profile parameter determination method and apparatus |
| DE10014427A1 (en) * | 2000-03-24 | 2001-10-04 | Weinmann G Geraete Med | Method for controlling a ventilator and device for monitoring |
| US6814073B2 (en) * | 2000-08-29 | 2004-11-09 | Resmed Limited | Respiratory apparatus with improved flow-flattening detection |
| DE10103973A1 (en) * | 2001-01-30 | 2002-08-01 | Peter L Kowallik | Method and device for monitoring sleep |
| US7938114B2 (en) * | 2001-10-12 | 2011-05-10 | Ric Investments Llc | Auto-titration bi-level pressure support system and method of using same |
| US7168429B2 (en) | 2001-10-12 | 2007-01-30 | Ric Investments, Llc | Auto-titration pressure support system and method of using same |
| US6881192B1 (en) * | 2002-06-12 | 2005-04-19 | Pacesetter, Inc. | Measurement of sleep apnea duration and evaluation of response therapies using duration metrics |
| AU2003282488B2 (en) * | 2002-10-03 | 2008-09-18 | Scott Laboratories, Inc. | Systems and methods for providing sensor fusion |
| US8467876B2 (en) * | 2003-10-15 | 2013-06-18 | Rmx, Llc | Breathing disorder detection and therapy delivery device and method |
| AU2004292337B2 (en) * | 2003-11-26 | 2010-11-11 | ResMed Pty Ltd | Methods and apparatus for the systemic control of ventilatory support in the presence of respiratory insufficiency |
| US7717110B2 (en) * | 2004-10-01 | 2010-05-18 | Ric Investments, Llc | Method and apparatus for treating Cheyne-Stokes respiration |
| EP1848336A4 (en) * | 2005-02-07 | 2009-11-11 | Widemed Ltd | Detection and monitoring of stress events during sleep |
| US20060282002A1 (en) | 2005-06-10 | 2006-12-14 | Treatyou Medical Technology Co. | Respiratory testing system |
| US8992436B2 (en) * | 2005-09-16 | 2015-03-31 | Cardiac Pacemakers, Inc. | Respiration monitoring using respiration rate variability |
| US7479114B2 (en) * | 2005-12-01 | 2009-01-20 | Cardiac Pacemakers, Inc. | Determining blood gas saturation based on measured parameter of respiration |
| US7810497B2 (en) * | 2006-03-20 | 2010-10-12 | Ric Investments, Llc | Ventilatory control system |
| EP2155307B1 (en) * | 2007-05-11 | 2021-03-24 | ResMed Pty Ltd | Automated control for detection of flow limitation |
-
2012
- 2012-03-15 AU AU2012231762A patent/AU2012231762B2/en not_active Ceased
- 2012-03-15 WO PCT/AU2012/000270 patent/WO2012126041A1/en active Application Filing
- 2012-03-15 US US14/006,772 patent/US10342939B2/en active Active
- 2012-03-15 JP JP2014500202A patent/JP6002747B2/en active Active
- 2012-03-15 CN CN201280010487.0A patent/CN103501690B/en active Active
- 2012-03-15 EP EP12761355.2A patent/EP2688466B1/en active Active
Also Published As
| Publication number | Publication date |
|---|---|
| AU2012231762B2 (en) | 2015-06-18 |
| NZ612813A (en) | 2015-04-24 |
| EP2688466B1 (en) | 2021-11-17 |
| US20140007878A1 (en) | 2014-01-09 |
| JP2014519856A (en) | 2014-08-21 |
| US10342939B2 (en) | 2019-07-09 |
| AU2012231762A1 (en) | 2013-07-04 |
| EP2688466A4 (en) | 2014-11-12 |
| CN103501690B (en) | 2016-10-26 |
| CN103501690A (en) | 2014-01-08 |
| EP2688466A1 (en) | 2014-01-29 |
| WO2012126041A1 (en) | 2012-09-27 |
Similar Documents
| Publication | Publication Date | Title |
|---|---|---|
| JP6002747B2 (en) | Ventilation sufficiency detection | |
| JP6626851B2 (en) | Method and device using leak detection | |
| JP7162419B2 (en) | Automatic control for detection of flow limitation | |
| JP6220369B2 (en) | Method and apparatus for detecting hypopnea | |
| JP3580776B2 (en) | Performing CPAP treatment pressure in the presence of apnea attacks | |
| JP6960913B2 (en) | Anomaly detectors and methods for estimating respiratory dynamics parameters | |
| JP3566285B2 (en) | Automatic CPAP system | |
| EP2453794A1 (en) | Detection of sleep condition | |
| NZ612813B2 (en) | Detection of ventilation sufficiency | |
| JPWO2021176426A5 (en) | ||
| AU2015201732A1 (en) | Methods and Devices with Leak Detection |
Legal Events
| Date | Code | Title | Description |
|---|---|---|---|
| A521 | Request for written amendment filed |
Free format text: JAPANESE INTERMEDIATE CODE: A523 Effective date: 20150217 |
|
| A621 | Written request for application examination |
Free format text: JAPANESE INTERMEDIATE CODE: A621 Effective date: 20150217 |
|
| A131 | Notification of reasons for refusal |
Free format text: JAPANESE INTERMEDIATE CODE: A131 Effective date: 20160105 |
|
| A521 | Request for written amendment filed |
Free format text: JAPANESE INTERMEDIATE CODE: A523 Effective date: 20160331 |
|
| TRDD | Decision of grant or rejection written | ||
| A01 | Written decision to grant a patent or to grant a registration (utility model) |
Free format text: JAPANESE INTERMEDIATE CODE: A01 Effective date: 20160826 |
|
| A61 | First payment of annual fees (during grant procedure) |
Free format text: JAPANESE INTERMEDIATE CODE: A61 Effective date: 20160905 |
|
| R150 | Certificate of patent or registration of utility model |
Ref document number: 6002747 Country of ref document: JP Free format text: JAPANESE INTERMEDIATE CODE: R150 |
|
| S533 | Written request for registration of change of name |
Free format text: JAPANESE INTERMEDIATE CODE: R313533 |
|
| R350 | Written notification of registration of transfer |
Free format text: JAPANESE INTERMEDIATE CODE: R350 |
|
| R250 | Receipt of annual fees |
Free format text: JAPANESE INTERMEDIATE CODE: R250 |
|
| R250 | Receipt of annual fees |
Free format text: JAPANESE INTERMEDIATE CODE: R250 |
|
| R250 | Receipt of annual fees |
Free format text: JAPANESE INTERMEDIATE CODE: R250 |
|
| R250 | Receipt of annual fees |
Free format text: JAPANESE INTERMEDIATE CODE: R250 |
|
| R250 | Receipt of annual fees |
Free format text: JAPANESE INTERMEDIATE CODE: R250 |
|
| R250 | Receipt of annual fees |
Free format text: JAPANESE INTERMEDIATE CODE: R250 |