JP5567567B2 - Calibration surface method to determine analyte ratio - Google Patents
Calibration surface method to determine analyte ratio Download PDFInfo
- Publication number
- JP5567567B2 JP5567567B2 JP2011523882A JP2011523882A JP5567567B2 JP 5567567 B2 JP5567567 B2 JP 5567567B2 JP 2011523882 A JP2011523882 A JP 2011523882A JP 2011523882 A JP2011523882 A JP 2011523882A JP 5567567 B2 JP5567567 B2 JP 5567567B2
- Authority
- JP
- Japan
- Prior art keywords
- analyte
- ratio
- analytes
- sample
- response
- Prior art date
- Legal status (The legal status is an assumption and is not a legal conclusion. Google has not performed a legal analysis and makes no representation as to the accuracy of the status listed.)
- Active
Links
Images


Classifications
-
- G—PHYSICS
- G01—MEASURING; TESTING
- G01N—INVESTIGATING OR ANALYSING MATERIALS BY DETERMINING THEIR CHEMICAL OR PHYSICAL PROPERTIES
- G01N33/00—Investigating or analysing materials by specific methods not covered by groups G01N1/00 - G01N31/00
- G01N33/48—Biological material, e.g. blood, urine; Haemocytometers
- G01N33/50—Chemical analysis of biological material, e.g. blood, urine; Testing involving biospecific ligand binding methods; Immunological testing
- G01N33/72—Chemical analysis of biological material, e.g. blood, urine; Testing involving biospecific ligand binding methods; Immunological testing involving blood pigments, e.g. haemoglobin, bilirubin or other porphyrins; involving occult blood
- G01N33/721—Haemoglobin
- G01N33/723—Glycosylated haemoglobin
-
- G—PHYSICS
- G01—MEASURING; TESTING
- G01N—INVESTIGATING OR ANALYSING MATERIALS BY DETERMINING THEIR CHEMICAL OR PHYSICAL PROPERTIES
- G01N33/00—Investigating or analysing materials by specific methods not covered by groups G01N1/00 - G01N31/00
- G01N33/48—Biological material, e.g. blood, urine; Haemocytometers
- G01N33/50—Chemical analysis of biological material, e.g. blood, urine; Testing involving biospecific ligand binding methods; Immunological testing
- G01N33/72—Chemical analysis of biological material, e.g. blood, urine; Testing involving biospecific ligand binding methods; Immunological testing involving blood pigments, e.g. haemoglobin, bilirubin or other porphyrins; involving occult blood
- G01N33/721—Haemoglobin
Landscapes
- Health & Medical Sciences (AREA)
- Life Sciences & Earth Sciences (AREA)
- Hematology (AREA)
- Engineering & Computer Science (AREA)
- Molecular Biology (AREA)
- Biomedical Technology (AREA)
- Chemical & Material Sciences (AREA)
- Immunology (AREA)
- Urology & Nephrology (AREA)
- Biotechnology (AREA)
- Microbiology (AREA)
- Cell Biology (AREA)
- Food Science & Technology (AREA)
- Medicinal Chemistry (AREA)
- Physics & Mathematics (AREA)
- Analytical Chemistry (AREA)
- Biochemistry (AREA)
- General Health & Medical Sciences (AREA)
- General Physics & Mathematics (AREA)
- Pathology (AREA)
- Investigating Or Analysing Biological Materials (AREA)
- Analysing Materials By The Use Of Radiation (AREA)
Description
本願は、2008年8月21日に出願された米国非仮特許出願第12/196,132号(代理人整理番号02558B−082500US)の継続出願であり、その利益を主張し、その内容は、参照によりそのままここに組み込まれる。 This application is a continuation application of US non-provisional patent application No. 12 / 196,132 (Attorney Docket No. 02558B-082500US) filed on August 21, 2008, claiming its benefits, Incorporated herein by reference in its entirety.
1.発明の分野 1. Field of Invention
本発明は、一般的に、サンプル中の分析物の比を測定する方法に関する。その方法は、一般的に、結果を比で表現する分析物の任意の対に適用することができる。さらに、複数の比を、分析物の複数の対の比で表現することができる。 The present invention generally relates to a method for measuring the ratio of an analyte in a sample. The method can generally be applied to any pair of analytes that express results as a ratio. Furthermore, multiple ratios can be expressed as multiple pairs of analyte ratios.
2.従来技術の説明 2. Description of prior art
サンプル中の2以上の分析物の比を算出することは、様々な状況において有用な比較である。比は、サンプル中の分析物の組成又は濃度の変動を補償するために頻繁に用いられる。例えば、尿に存在する分析物を測定するとき、所定のサンプルの分析物の濃度が著しく変動する可能性がある。これらの濃度変動を、サンプル中に存在する異なる分析物間の比を作り出すことによって正規化することができる。例えば、比を、尿の分析物の濃度と尿のクレアチニンの濃度との間で作り出すことができる。サンプル中の二つの分析物の間でこのような関係を作り出すことによって、濃度の変動を考慮した更に有意義な測定を行うことができる。総タンパク質又はアルブミンのような特定のタンパク質の濃度に対する組織中の所望の分析物の濃度を正規化することもできる。比は、測定中の相関誤差、例えば、希釈誤差を補償することもできる。 Computing the ratio of two or more analytes in a sample is a useful comparison in various situations. The ratio is frequently used to compensate for variations in the composition or concentration of the analyte in the sample. For example, when measuring an analyte present in urine, the concentration of the analyte in a given sample can vary significantly. These concentration variations can be normalized by creating a ratio between different analytes present in the sample. For example, a ratio can be created between the concentration of urine analyte and the concentration of urine creatinine. By creating such a relationship between two analytes in a sample, a more meaningful measurement can be made that takes into account variations in concentration. It is also possible to normalize the concentration of the desired analyte in the tissue relative to the concentration of a particular protein, such as total protein or albumin. The ratio can also compensate for correlation errors during the measurement, such as dilution errors.
分析物の濃度比を計算する最も一般的な従来の方法の簡単な説明を、図1に示す。 A brief description of the most common conventional method for calculating analyte concentration ratios is shown in FIG.
ステップ101において、検体を患者から取り出す。検体の例は、血液、尿又は他の体液を含む。検体は、分析物の比を測定し及び算出するサンプルの基(basis)を形成する。検体は、患者から直接来る必要はない。検体は、他のソースから利用することができる。
In
ステップ102において、検体を予処理サンプルに変換する。予処理サンプルを、テストサンプルと称することもできる。このステップは、任意の分析物の測定が行われる前に検体に対して行われることから成る。例えば、所定の例において、検体を標本化し、特定量によって希釈することができる。他の例において、抗凝血剤を検体に加えることができる。このステップは、全体が変質しない検体(entire unaltered specimen)を予処理サンプルとして用いるときには任意である。
In
ステップ103及び104においてサンプルが測定される。これら二つのステップにおいて、サンプルの関心の量は、反応で表現される。ステップ103は、表示用の予処理サンプルの準備ができている機器によって行われる全ての処理から成る。サンプルの処理は、様々なステップを含むことができる。一例として複数の分析物のサンドイッチ免疫測定法(multi-analyte sandwich immunoassay)を用いることによって、サンプルは、固相に付着する抗体又は結合試薬(binding reagents)と反応し、固相は、非結合物質(unbound material)を除去するよう洗浄され、1以上の標識抗体又は結合試薬に反応し、次の反応の表示のために非結合標識抗体を除去するよう洗浄される。他の例は、高速液体クロマトグラフィー(HPLC)、免疫測定法、電気泳動法、キャピラリー電気泳動法、紫外/可視/赤外分光法、ラマン分光法、表面増感ラマン分光法、質量分析、ガスクロマトグラフィー等を含む。サンプルに対して処理ステップを行う必要がない場合があってもよい。
In
ステップ104において、比に用いられるサンプル中の各分析物の反応を決定するために、選択した表示(reading)法を用いる。ステップ104を、分析物(反応)表示と称する。適切な表示法は、蛍光、吸光度、反射率、イオン電流、電気化学ポテンシャル、光学密度、色、表面プラズモン共鳴等を含む。選択した処理法及び表示法は、測定されるサンプル及び分析物の性質に依存する。選択した測定法を用いて測定される分析物の反応を、選択した方法に適切な任意の単位とすることができる。これらの単位を、蛍光単位(fluorescence units)、光学密度、色、イオン電流、化学発光単位(chemiluminescence units)、電気信号等とすることができる。分析物を、多重化形式(multiplexed format)で測定することもでき、この場合、複数の分析物が1回(single pass)で測定され、又は複数の分析物を複数の個別の分析において測定することができる。
In
その後、分析物の反応は、対応する濃度に変換される。このステップをステップ105及び106に示す。典型的には、この変換は、較正曲線のような手段(device)を用いることによって行われる。
The analyte response is then converted to the corresponding concentration. This step is shown in
分析物の濃度の比を計算する前に各分析物の反応を個別に濃度値に変換する必要がある。分析物の濃度値は、所定の分析物の測定された反応だけでなくサンプル中の他の分析物の反応にも依存しうる。その理由は、分析物間の交差反応のような相互作用があるからである。選択した測定法を用いて測定されたサンプル中の分析物の反応と同一サンプル中の分析物の濃度との間の関係は、典型的には非線形的である。このような非線形的な関係のために、分析物の反応の比は、分析物の濃度の比とは全く異なる。したがって、分析物の濃度の比を計算すべき場合に比を計算する前に各分析物の濃度を個別に算出する必要がある。 Before calculating the ratio of analyte concentrations, it is necessary to convert each analyte reaction to a concentration value individually. Analyte concentration values can depend not only on the measured response of a given analyte, but also on the response of other analytes in the sample. The reason is that there is an interaction such as a cross reaction between analytes. The relationship between the analyte response in the sample measured using the selected measurement method and the concentration of the analyte in the same sample is typically non-linear. Because of this non-linear relationship, the analyte response ratio is quite different from the analyte concentration ratio. Therefore, when the ratio of analyte concentrations should be calculated, it is necessary to calculate the concentration of each analyte individually before calculating the ratio.
較正曲線は、典型的には、分析物の反応を濃度値に変換するために用いられる。分析物の較正曲線は、曲線のモデルを選択し、任意の測定を行う前に分析物の濃度が既知であるサンプルのセットから分析物の反応を測定してモデル係数の値を決定することによって作り出すことができる。これらの既知のサンプルから得られた分析物の反応を、濃度が未知であるサンプル中の分析物の濃度を推定するために用いられる較正曲線を作り出すためにグラフ化することができる。濃度値に変換すべき各分析物の反応に対して個別の較正曲線を作り出す必要がある。実際には、決定された係数値を有するモデルの式を、グラフ化することなく濃度を直接決定するために用いることができる。較正曲線に対する参照が一般的に用いられる。その理由は、較正曲線に対する参照が較正式に対する参照よりも説明に役立つからである。 A calibration curve is typically used to convert an analyte response to a concentration value. An analyte calibration curve is determined by selecting a model of the curve and measuring the analyte response from a set of samples with known analyte concentrations to determine the value of the model coefficient before making any measurements. Can be produced. Analyte responses obtained from these known samples can be graphed to create a calibration curve that is used to estimate the concentration of the analyte in a sample whose concentration is unknown. A separate calibration curve must be created for each analyte response to be converted to a concentration value. In practice, a model equation with the determined coefficient values can be used to directly determine the concentration without graphing. A reference to the calibration curve is commonly used. This is because the reference to the calibration curve is more illustrative than the reference to the calibration equation.
ステップ107において、所望の分析物の比を決定するために、較正曲線を用いて計算された個別の濃度を用いる。これを、除算のような簡単な数学演算によって行うことができる。分析物の比は、典型的には単位がない(unitless)。
In
測定した比を、異なる測定法を用いて測定した比に整合させるために、ステップ107で取得した比を調整することが時々必要となる。このステップをステップ108に示す。比が特定の測定法を用いて決定されるように比を表すことが多くの場合に一般的であり、このような特定の測定法はステップ103及び104で用いられる方法と同一でないことがあるので、このような追加の変換が行われる。これらの異なる測定法によって取得した分析物の比の間に顕著な違いが存在することがあり、値を、二つの形式間で変換することができる。ステップ108は、特定の分析物の比を最終的にどのように表すかに応じた任意のステップである。標準化された比の測定の追加の情報を、2007年5月に刊行された「IDV技術」の「HbA1cを説明するために提案された変更」("Proposed changes for reporting HbA1c", IVD Technology (May 2007))及び2008年に刊行された「臨床化学」の54:6号の1098〜1099頁の「ヘモグロビンA1c測定の標準化の実現」("Implementation of Standardization of Hemoglobin A1c Measurement", Clinical Chemistry, 54:6, 1098-1099 (2008))で見つけることができ、両方の参考文献は、参照によりそのままここに組み込まれる。
It is sometimes necessary to adjust the ratio obtained in
分析物の比を決定するこのような既知の方法は、多数の問題を有する。サンプル中の分析物間の相互作用により、既知の方法に誤りが生じうる。第1の分析物の反応は、第2の分析物の反応に影響を及ぼし、第2の分析物の反応を変化させることがある。例えば、免疫測定法のような一部の測定法において、第1の分析物の反応を測定するために用いられる第1の抗体は、サンプル中の第2の分析物と相互作用することもある。このような交差反応は、第2の分析物の異なる値の各々に対して第1の分析物の異なる較正曲線を必要とする。単一の平均的な較正曲線が第1の分析物に対して作り出されるが、これは、当該分析物に対して得られる反応に不正確さ(inaccuracy)が生じうる。さらに、第2の抗体がサンプル中の第1の分析物に反応することもある。このことは、問題を悪化させる。 Such known methods for determining the analyte ratio have a number of problems. Interactions between analytes in the sample can cause errors in known methods. The reaction of the first analyte can affect the reaction of the second analyte and change the reaction of the second analyte. For example, in some assays, such as immunoassays, the first antibody used to measure the response of the first analyte may interact with the second analyte in the sample. . Such a cross-reaction requires a different calibration curve of the first analyte for each different value of the second analyte. A single average calibration curve is created for the first analyte, but this can cause inaccuracy in the response obtained for that analyte. In addition, the second antibody may react to the first analyte in the sample. This exacerbates the problem.
既知の方法の他の問題は、各分析物に対して較正曲線を作り出し及び維持する必要があることである。これは、各曲線に対する適切な較正モデル及びキャリブレータの選択を伴う。 Another problem with the known method is that a calibration curve needs to be created and maintained for each analyte. This involves the selection of an appropriate calibration model and calibrator for each curve.
既知の方法の他の問題は、反応レベルで関連付けられる雑音を除去する機会が比較的少ないことである。このような除去は、濃度の比の決定中にのみ行われる。 Another problem with the known method is that there is relatively little opportunity to remove the noise associated with the reaction level. Such removal is performed only during the determination of the concentration ratio.
分析物の比を決定する提案方法は、方法の一部としてもはや個別の分析物の濃度を直接用いなくすることによって、分析物の比を決定する従来の方法を改善する。使用を更に簡便にするのに加えて、提案方法は、更に正確な分析物の比を生成する。その理由は、提案方法が本質的にはサンプル中の分析物間の相互作用からの表示に導入される相互作用を処理するからである。提案方法は、単一の校正モデルしか必要とせず、反応レベルで関連付けられる雑音を更に良好に除去することによって、追加の利点を提供することができる。 The proposed method of determining the analyte ratio improves upon the conventional method of determining the analyte ratio by no longer using the individual analyte concentrations directly as part of the method. In addition to making it easier to use, the proposed method produces a more accurate analyte ratio. The reason is that the proposed method essentially handles interactions introduced into the display from interactions between analytes in the sample. The proposed method requires only a single calibration model and can provide additional benefits by better removing the noise associated with the response level.
新しい提案方法は、分析物の比を取得するために測定方法からの反応を直接用いることによって従来技術を改善する。個別に測定された分析物の反応を濃度値に変換するための校正曲線の使用のような中間変換は、所望の比を取得するために必要とされない。 The new proposed method improves on the prior art by directly using the reaction from the measurement method to obtain the analyte ratio. Intermediate conversions such as the use of calibration curves to convert individually measured analyte responses to concentration values are not required to obtain the desired ratio.
分析物の比を、校正曲線の対を用いることによって反応から決定される濃度の比を取り出すのではなく単一の校正表面(calibration surface)を用いて反応から直接決定する。校正曲線と同様に、表面に内在する校正式を、表面をグラフ化することなく用いることができる。ここで使用するように、表現「校正表面」は、表現「反応表面」(response surface)と同義である。校正表面は、所望の分析物の比を、従属y軸として有し、反応の適切な組合せを、独立x1軸及びx2軸として有する。x1軸及びx2軸に対して用いられる反応の組合せが、データに適合する簡単なモデルを提供するために最初に選択される。しかしながら、それは、二つの分析物の反応の相関誤差によって生じた最終的な分析物の比の誤差を減少することもできる。良好な適合(good fit)により不適合誤差(lack-of-fit error)を減少し、校正表面を維持するのに必要なキャリブレータの数を減少させることができる。良好な適合により校正間の時間間隔を増大することもできる。異なるタイプの校正を異なる間隔で行うことができる。例えば、特定ロット(specific lot)の試薬に対してロット特定校正(lot specific calibration)を試薬製造者によって行うことができ、それに対し、実験校正(laboratory calibration)を、患者の標本化及び管理を行う実験室によって比較的短い間隔で行うことができる。 The analyte ratio is determined directly from the reaction using a single calibration surface rather than taking the concentration ratio determined from the reaction by using a pair of calibration curves. Similar to the calibration curve, the calibration equation inherent in the surface can be used without graphing the surface. As used herein, the expression “calibration surface” is synonymous with the expression “response surface”. The calibration surface has the desired analyte ratio as the dependent y-axis and the appropriate combination of reactions as the independent x 1 and x 2 axes. The combination of reactions used for the x 1 and x 2 axes is initially selected to provide a simple model that fits the data. However, it can also reduce the final analyte ratio error caused by the correlation error between the two analyte responses. A good fit can reduce the rack-of-fit error and reduce the number of calibrators needed to maintain the calibration surface. A good fit can also increase the time interval between calibrations. Different types of calibration can be performed at different intervals. For example, a lot specific calibration can be performed by a reagent manufacturer on a specific lot of reagents, whereas a laboratory calibration is performed to sample and manage a patient. This can be done at relatively short intervals in the laboratory.
新たな方法は、多くの点で従来技術を改善する。新たな方法は、分析物の反応を分析物の濃度に変換する中間変換をもはや必要としない。校正曲線のような手段は、必ずしも分析物の比を算出するのに特別に適合されておらず、その結果、中間ステップとしてのそのような手段の使用は、従来既知の方法における不正確さの多くにおいて重大な要因となる。 The new method improves the prior art in many ways. The new method no longer requires an intermediate conversion that converts the analyte response to the analyte concentration. Means such as calibration curves are not necessarily specifically adapted to calculate the ratio of analytes, so that the use of such means as an intermediate step is a measure of inaccuracies in previously known methods. It is a significant factor in many.
中間変換を除外することによって、分析物の測定に導入されるあらゆる雑音も良好に処理する。分析物の反応を、分析物の反応に共通の雑音を減少するように組み合わせることができる。反応の組合せを、変換法の回帰モデルの独立変数として役立てるために用いることができる。 By excluding intermediate transformations, any noise introduced into the analyte measurement is handled well. The analyte response can be combined to reduce noise common to the analyte response. The combination of responses can be used to serve as an independent variable for the regression model of the transformation method.
さらに、測定された分析物の反応を潜在的に妨げうるサンプル中の分析物間のあらゆる相互作用は、この方法において更に良好に説明される。このような不正確さの潜在的な原因は、回帰モデルを作り出すために用いられる既知のサンプルにも存在し、したがって、不正確さは、このモデルにおいて本質的に説明される。特定の分析物にそれぞれ適合した校正曲線の対は、これらの妨害を処理することができず、したがって、このような不正確さの原因を処理することができない。 Furthermore, any interaction between the analytes in the sample that could potentially interfere with the measured analyte response is better explained in this method. Such potential sources of inaccuracy also exist in the known samples used to create regression models, and thus inaccuracies are essentially explained in this model. Calibration curve pairs, each tailored to a particular analyte, cannot handle these disturbances and therefore cannot handle the cause of such inaccuracies.
提案方法の他の利点は、(係数において)線形的な回帰モデルを後に説明するように一部の実施の形態で用いる場合に回帰モデルが最小二乗平均誤差を最小にする更に一般的な方法ではなく連立方程式の最小二乗平均解(least-mean-square solutions)を許容することである。これは、更に一般的な方法に関連した大域的最小点ではなく極小を見つけることの問題を回避することによって更に迅速かつロバストな計算を許容する。 Another advantage of the proposed method is that a more general way in which the regression model minimizes the least mean square error when using a linear regression model (in terms of coefficients) in some embodiments as described below. Rather, allow least-mean-square solutions of simultaneous equations. This allows for faster and more robust calculations by avoiding the problem of finding local minimums rather than global minima associated with more general methods.
最後に、新たな方法は、従来の方法よりも簡便である。回帰モデルを作り出した後、反応に対する濃度の校正曲線のような手段を通じて中間値に変換することは必要とされていない。その理由は、新たな方法が測定プロセスを通じて取得した反応を直接用いるからである。一度回帰モデルが作り出されると処理に伴うステップ数が更に少なくなるので、所望の比を見つけるために新たな方法を実行する人にとって更に都合がよくなる。 Finally, the new method is simpler than the conventional method. After creating a regression model, it is not necessary to convert to an intermediate value through means such as a concentration calibration curve for the reaction. The reason is that the new method directly uses the reaction obtained through the measurement process. Once a regression model has been created, the number of steps involved in the process is further reduced, making it more convenient for those who implement the new method to find the desired ratio.
一実施の形態は、サンプル中の分析物の一つ以上の比を決定する方法を対象にする。方法は、先ず、二つ以上の個別の分析物の反応を取得するために、選択した測定プロセスを用いてサンプル中の二つ以上の分析物の反応を測定する。次に、一つ以上の変換法を選択する。これらの変換法は、分析物の比を、選択した測定プロセスを用いて取得した個別の分析物の反応の一次関数として規定する。最後に、サンプル中の分析物の一つ以上の比を、選択した一つ以上の変換法及び選択した測定プロセスを用いて取得した個別の分析物の反応を用いることによって算出する。 One embodiment is directed to a method of determining one or more ratios of analytes in a sample. The method first measures the response of two or more analytes in a sample using a selected measurement process to obtain the response of two or more individual analytes. Next, one or more conversion methods are selected. These transformation methods define the analyte ratio as a linear function of the individual analyte response obtained using the selected measurement process. Finally, the ratio of one or more analytes in the sample is calculated by using individual analyte responses obtained using one or more selected conversion methods and selected measurement processes.
他の実施の形態は、二つ以上の濃度比を測定する装置を対象とする。装置は、サンプル中の分析物の反応を測定することができる測定モジュールと、測定モジュールからの測定された分析物の反応を格納するメモリと、分析物の分析物比を測定モジュールから取得した分析物の個別の反応の一次関数として規定する変換法を実行する命令を有するコンピュータ読取可能コードを含むコンピュータ読取可能媒体と、変換法を用いて分析物の濃度比を計算するためにコンピュータ読取可能媒体のコンピュータ読取可能コードを実行するプロセッサと、を備える。 Another embodiment is directed to an apparatus that measures two or more concentration ratios. The instrument has a measurement module that can measure the reaction of the analyte in the sample, a memory that stores the measured analyte reaction from the measurement module, and an analysis that has obtained the analyte ratio of the analyte from the measurement module A computer readable medium comprising computer readable code having instructions for performing a conversion method defined as a linear function of an individual reaction of the object, and a computer readable medium for calculating an analyte concentration ratio using the conversion method And a processor for executing the computer readable code.
他の実施の形態は、分析物の分析物値の比を測定プロセスから取得した分析物の個別の反応の一次関数として規定する変換法を計算する方法を対象とする。方法は、変換法を演算するために用いられる統計的に十分な数の適切なキャリブレータを選択し、キャリブレータは、分析物の既知の比を有し、キャリブレータの分析物の反応を測定するために用いられる測定プロセスを選択し、測定プロセスを用いてキャリブレータの分析物の反応を測定し、変換法を演算するために用いられる回帰モデルを選択し、変換法を作り出すために回帰モデルを使用し、回帰モデルは、分析物の反応を独立変数として使用し、既知の分析物比を従属変数として使用する。 Another embodiment is directed to a method of calculating a transformation method that defines a ratio of analyte values of an analyte as a linear function of an individual response of an analyte obtained from a measurement process. The method selects a statistically sufficient number of appropriate calibrators used to compute the conversion method, the calibrator has a known ratio of analytes, and measures the analyte response of the calibrator Select the measurement process used, measure the calibrator analyte response using the measurement process, select the regression model used to compute the transformation, use the regression model to create the transformation, The regression model uses the analyte response as the independent variable and the known analyte ratio as the dependent variable.
他の実施の形態は、選択した測定プロセスを用いてテストサンプル中の分析物の反応を測定するコードと、選択した測定プロセスから取得した分析物の個別の反応の一次関数として分析物の比を規定する変換法を選択するコードと、選択した変換法及びテストサンプルからの測定した分析物の反応を用いてテストサンプルの分析物の比を計算するコードと、を備えるコンピュータ読取可能媒体を対象とする。 Another embodiment uses a code that measures the response of an analyte in a test sample using a selected measurement process and the ratio of the analyte as a linear function of the individual response of the analyte obtained from the selected measurement process. A computer readable medium comprising: a code for selecting a prescribed conversion method; and a code for calculating a ratio of the analyte in the test sample using the selected conversion method and the measured analyte response from the test sample. To do.
多様な分析物を対象とした多様な実施の形態で実現することができる分析物の比を計算する改善方法を、種々の実施の形態に従ってここに開示する。特に、異なる実施の形態に対するあり得る分析物は、タンパク質、ペプチド、炭水化物、小分子、核酸、又は計算し及び比として表現することができるその他の物質を含むことができる。 An improved method for calculating the ratio of analytes that can be realized in various embodiments directed to various analytes is disclosed herein according to various embodiments. In particular, possible analytes for different embodiments can include proteins, peptides, carbohydrates, small molecules, nucleic acids, or other substances that can be calculated and expressed as ratios.
2.提案方法の一般的な説明 2. General explanation of the proposed method
図2は、一実施の形態による二つの分析物の濃度比の計算を伴う一般的なステップを示す。この説明から明らかなように、プロセス中に異なる変換法を作り出し及び用いることによって、他のタイプの分析物比を生成するためにこの提案方法の他の実施の形態を容易に変更することができる。 FIG. 2 illustrates the general steps involved in calculating the concentration ratio of two analytes according to one embodiment. As is apparent from this description, other embodiments of the proposed method can be easily modified to produce other types of analyte ratios by creating and using different conversion methods during the process. .
ステップ201〜204は、図1に示したステップ101〜104とほぼ同一である。ステップ201において、患者標本を取得する。ステップ202において、この患者標本を予処理又はテストサンプルに変換する。ステップ203及び204は、共に測定プロセスを備える。サンプルは、ステップ203において表示のために処理され、サンプル中の各分析物に対する反応を生成するステップ204において表示される。既知の方法に関連して説明したように、上記ステップの一部を、標本の性質及び分析物の反応を測定するために用いられる測定法に応じて任意にすることができる。
図2のステップ203及び204において、サンプル中の分析物の反応を測定するために、選択した測定法を用いる。このステップで測定法を選択するための考察は、ステップ103及び104における考察と同様である。ステップ204における分析物の反応の表示を、サンプル中の結合又は非結合抗体に関連した蛍光タグから発する蛍光の定量化のような種々の技術によって行うことができる。選択した測定法から結果的に得られる反応は、図2の分析物反応1及び分析物反応2としてリストされる。
In
ステップ205において、分析物の比を計算する既知の方法と提案方法との差が明らかになる。図2に示す実施の形態において、このステップは、測定した分析物の反応を所望の分析物の比に直接変換する変換法を用いる。図2で概説したプロセスを開始する前に変換法が作り出される。変換法を、後に更に説明するように一連のステップから構成することができる。複数の分析物の比を取得するために、複数の変換法を、測定された分析物の反応において用いることができる。分析物の反応を所望の分析物の比に変換するための変換を用いた後、プロセスが完了する。
In
図2の実施の形態の変換法を、分析物の反応を分析物の比に変換する任意の数学的関係とすることができる。提案方法の一実施の形態において、変換法は2ステップからなる。第1のステップは、二つ以上の回帰変数(regression variables)を取得するために分析物の反応を組み合わせ又は変換する。第2のステップは、所望の分析物の比を取得するために回帰モデルの回帰変数を用いる。回帰モデルを、多重線形回帰モデルとすることができる。回帰モデルは、更に複雑な回帰モデルを用いることもできる。 The conversion method of the embodiment of FIG. 2 can be any mathematical relationship that converts an analyte response to an analyte ratio. In one embodiment of the proposed method, the conversion method consists of two steps. The first step combines or transforms the analyte responses to obtain two or more regression variables. The second step uses the regression variables of the regression model to obtain the desired analyte ratio. The regression model can be a multiple linear regression model. As the regression model, a more complicated regression model can be used.
第1のステップは、二つ以上の回帰変数を取得するために、表示された分析物の反応を機能的に組み合わせる。例えば、一実施の形態において、第1の回帰変数を、二つの分析物の反応の比に設定し、第2の回帰変数を、それ自体独立した(standing on its own)分析物の反応の一つに設定することができる。他の多くのあり得る変換が可能であり、他の変換の例を、この開示で後に更に詳細に与える。 The first step functionally combines the displayed analyte responses to obtain two or more regression variables. For example, in one embodiment, the first regression variable is set to the ratio of the responses of two analytes and the second regression variable is one of the responses of an analyte that is itself standing on its own. Can be set to one. Many other possible transformations are possible and examples of other transformations are given in more detail later in this disclosure.
変換法の本実施の形態の第2のステップは、所望の比を二つの回帰変数の関数として見つけるために回帰モデルを用いる。回帰の独立変数を、所望の分析物の比とする。この分析物の比を、濃度比又は濃度比に数学的に関連した比とすることができるが、そうである必要はない。変換及び回帰モデルを作り出す必要があり、これらの係数の値は、未知のサンプルの分析物の比を決定するのに用いられる前に決定される。 The second step of this embodiment of the transformation method uses a regression model to find the desired ratio as a function of two regression variables. The independent variable for regression is the ratio of the desired analyte. The analyte ratio can be, but need not be, a concentration ratio or a ratio mathematically related to the concentration ratio. A transformation and regression model needs to be created, and the values of these coefficients are determined before being used to determine the analyte ratio of the unknown sample.
この変換は、所望の分析物の比を決定するために回帰モデルとともに用いられる。この変換は、図1のステップ108を組み組むことができ、したがって、図1の示すような濃度の比を計算する必要を回避する。変換の目的の一つは、データに十分適合する必要のある回帰項の数を減少することである。一部の実施の形態において、定数項、線形項及び必要な場合の線形項の積しか必要としない。一実施の形態において、変換係数と回帰係数の組合せは、係数値の決定を分離する時間間隔によって規定される複数のレベルにグループ分けされる。例えば、3レベルのグループ化は、以下の3レベルからなることができる:1)間隔がユーザ校正スケジュールによって決定され、2)間隔が試薬製造者による新たな試薬ロットのリリースによって規定され、3)間隔が方法又はモデルの変更によって決定される。 This transformation is used with the regression model to determine the desired analyte ratio. This transformation can incorporate step 108 of FIG. 1, thus avoiding the need to calculate the concentration ratio as shown in FIG. One of the purposes of the transformation is to reduce the number of regression terms that need to fit well into the data. In some embodiments, only a product of a constant term, a linear term, and a linear term where necessary is required. In one embodiment, the combination of transform coefficients and regression coefficients are grouped into multiple levels defined by time intervals that separate the determination of coefficient values. For example, a three level grouping can consist of the following three levels: 1) the interval is determined by the user calibration schedule, 2) the interval is defined by the release of a new reagent lot by the reagent manufacturer, and 3) The interval is determined by a method or model change.
HbA1cの実施の形態に対する変換及び回帰モデルを一緒に作り出す一方法の一実施の形態の概要を、以下説明する。 An overview of one embodiment of a method for jointly creating a transformation and regression model for the HbA1c embodiment is described below.
1.HbA1c値の臨床範囲及び方法によって適合される全Hb濃度の範囲をカバーするサンプルセットを生成。サンプルセットを、範囲をカバーする等しく間隔を開けた値のグリッドとする。そのようなグリッドを、低い値及び高い値で開始するとともに希釈のセットを実行することによって取得することができる。変換及び回帰モデルが複雑でない場合には5×5グリッドが適切であり、それに対し、変数及び回帰モデルが複雑である場合には9×9グリッドが適切である。所望の濃度範囲をカバーするサンプルが利用できない場合、このステップで概説したような一連の希釈を用いる必要がない。 1. Generate a sample set that covers the clinical range of HbA1c values and the range of total Hb concentrations adapted by the method. Let the sample set be a grid of equally spaced values covering the range. Such a grid can be obtained by starting with low and high values and performing a set of dilutions. A 5 × 5 grid is appropriate when the transformation and regression model is not complex, whereas a 9 × 9 grid is appropriate when the variable and regression model are complex. If a sample covering the desired concentration range is not available, it is not necessary to use a series of dilutions as outlined in this step.
2.3組の(in triplicate)サンプルを処理(run)する。反応の全ては、ここでは自動校正と称されるプロセスにおけるキャリブレータ及び未知なもの(unknowns)の両方として用いられる。 2. Run three sets of (in triplicate) samples. All of the reactions are used as both calibrators and unknowns in a process referred to herein as autocalibration.
3.不適合許容基準(Lack-of-Fit acceptance criteria)を満足し、変換係数を最適化し、かつ、回帰モデル係数値を決定すると予測することができる最少の数の項を含む変換及び回帰モデルを用いた開始。 3. A transformation and regression model was used that satisfied the Lack-of-Fit acceptance criteria, optimized the transformation coefficient, and included the minimum number of terms that could be predicted to determine the regression model coefficient value start.
4.不適合許容基準を満足するまで変換又は回帰モデルに項を系統的に追加する。 4). Systematically add terms to the transformation or regression model until the nonconformance acceptance criteria are met.
このHbA1cの実施の形態の更なる詳細は、この開示において後に含まれる。 Further details of this HbA1c embodiment are included later in this disclosure.
図3は、本発明に一実施の形態を実施するために用いることができるコンピュータシステム300のブロック図である。コンピュータシステム300は、複数の入力モジュールを有する。分析物測定モジュール301は、テストサンプル中の分析物の反応を測定するために用いられる。このモジュールは、分析の反応を測定するために選択された測定法に応じて本発明の異なる実施の形態間で変更される。標準的なキーボード302及びマウス303も示す。コンピュータシステム300は、コンピュータ内に種々の典型的なコンピュータ部品を有する。これらの部品は、システムバス304、一つ以上のディスクドライバ305、RAM306及びプロセッサ307を有する。実施の形態の正確な性質に応じて他の部品が存在してもよい。図3は、システムのユーザに情報を表示することができるモニタ308も示す。
FIG. 3 is a block diagram of a
本発明の実施の形態において、ステップ202の場合ように作成された予処理サンプルが分析物測定モジュール301に配置され、この場合、サンプルが更に処理され、サンプル中の分析物の反応が測定される。その後、この情報は、システムバス304に沿ってコンピュータシステムに転送され、プロセッサ307を用いることによって、適切な変換法が分析物反応データに適用される。変換法を実現するためにプロセッサ307が実行する命令は、RAM306やディスクドライブ305のようなコンピュータ読取可能媒体に格納される。変換法をこの同一媒体に格納することもできる。結果的に得られる比をモニタ308に表示することができる。本発明の他の実施の形態は、他の通信手段を用いて分析物の比を出力することができる。例えば、コンピュータシステムは、測定された比を、プリンタを用いて印刷し、又は、測定された比をネットワーク上の他のコンピュータに送信することができる。
In an embodiment of the present invention, the preprocessed sample created as in
ヘモグロビンの実施の形態 Embodiment of hemoglobin
提案方法の一実施の形態として、HbA1cの測定に着目する。HbA1cは、糖尿病患者において最も一般的に測定される一つの特定タイプのグリコシル化ヘモグロビンである。人間の赤血球は、ブドウ糖が自由に通過するのを許容し、グリコシル化ヘモグロビンHbA1cは、ブドウ糖を添付することによってヘモグロビン分子のβ鎖N末端バリンを形成したヘモグロビン成分を参照する。非糖尿病患者において、90%を超えるトータルヘモグロビンはグリコシル化していない。HbA1cそれ自体は、典型的には約4〜7%のトータルヘモグロビンを構成する。糖尿病患者において、HbA1cの濃度の割合は、血糖値を良好に制御できない患者中のトータルヘモグロビンの20%を超える。 As an embodiment of the proposed method, attention is paid to the measurement of HbA1c. HbA1c is one particular type of glycosylated hemoglobin that is most commonly measured in diabetic patients. Human erythrocytes allow glucose to pass freely, and glycosylated hemoglobin HbA1c refers to the hemoglobin component that formed the β-chain N-terminal valine of the hemoglobin molecule by attaching glucose. In non-diabetic patients, over 90% of total hemoglobin is not glycosylated. HbA1c itself typically constitutes about 4-7% total hemoglobin. In diabetic patients, the percentage of HbA1c concentration exceeds 20% of total hemoglobin in patients whose blood glucose levels cannot be controlled well.
グリコシル化ヘモグロビンは、血液中の環境ブドウ糖濃度(ambient glucose concentration)に正比例する割合で形成される。ブドウ糖とヘモグロビンとの間の反応は、最終的には不可逆かつ低速である。その結果、人間の赤血球の120日の生存期間中にトータルヘモグロビンのごく一部しか糖化されない。この結果、血液中のグリコシル化ヘモグロビンの濃度は、長期間血糖値をモニタするために用いることができる血糖値の重み付けされた移動平均を提供する。2〜3ヶ月の期間をカバーするこの移動平均は、糖尿病患者の血糖管理を評価することができる。トータルヘモグロビンに対するHbA1cの比は、糖尿病を患った患者の健康状態を測定する共通方法となる。 Glycosylated hemoglobin is formed at a rate that is directly proportional to the ambient glucose concentration in the blood. The reaction between glucose and hemoglobin is ultimately irreversible and slow. As a result, only a small portion of total hemoglobin is glycated during the 120-day life of human red blood cells. As a result, the concentration of glycosylated hemoglobin in the blood provides a weighted moving average of blood glucose levels that can be used to monitor blood glucose levels over time. This moving average covering a period of 2-3 months can assess glycemic control in diabetics. The ratio of HbA1c to total hemoglobin is a common method for measuring the health status of patients with diabetes.
HbA1cレベルを、多数の方法で表現することができ、そのように行うために許容される方法の一つは、トータルヘモグロビンの割合(%HbA1c)として全米グリコヘモグロビン標準化プログラム(NGSP)単位でHbA1cを表現することである。他の許容される方法は、mmol HbA1c/mol トータルHbの国際臨床化学連合(IFCC)単位でHbA1cを表現することである。これらの単位における10倍の差の因子に加えて、二つの規格で用いられる異なる基準方法による違いもある。HbS,HbC,HbE,HbA2及びHbFのような他のヘモグロビン変異タンパク質(hemoglobin variant protein)を、トータルヘモグロビンの割合として表現することもできる。 HbA1c levels can be expressed in a number of ways, and one acceptable way to do so is to express HbA1c in the National Glycohemoglobin Standardization Program (NGSP) unit as a percentage of total hemoglobin (% HbA1c). It is to express. Another acceptable method is to express HbA1c in international clinical chemistry (IFCC) units of mmol HbA1c / mol total Hb. In addition to the 10-fold difference factor in these units, there are also differences due to the different reference methods used in the two standards. Other hemoglobin variant proteins such as HbS, HbC, HbE, HbA2 and HbF can also be expressed as a percentage of total hemoglobin.
HbA1cを測定するHPLC法 HPLC method for measuring HbA1c
提案方法の一実施の形態は、HbA1cを測定するHPLC法を用いる。 One embodiment of the proposed method uses an HPLC method for measuring HbA1c.
図4は、一実施の形態によりHbA1cを測定するHPLC法によるトータルヘモグロビンに対するHbA1cの比の計算を伴うステップを示す。 FIG. 4 shows the steps involved in calculating the ratio of HbA1c to total hemoglobin by the HPLC method for measuring HbA1c according to one embodiment.
ステップ401〜404は、図1に示すステップ101〜104及び図2のステップ201〜204とほぼ同一である。ステップ401において、患者検体を取得する。ステップ402において、この患者検体は予処理サンプルに変換され、この予処理サンプルを、時系列のピークとしてクロマトグラフィーカラムから溶出した成分に分けるために、HPLCが用いられる。ステップ404において、成分は吸光度検出器のフローセルを順次通過し、吸光度検出器は、溶出の濃度を、クロマトグラムとして視覚化することができる吸光度値に変換する。クロマトグラムのピークは、予処理サンプルの個別の成分に対応する。その後、ピークのエリアを決定する。ヘモグロビンのグリコシル化成分(glycosylated component)HbGrに対する反応は、単一ピークのエリアとして決定され、それに対し、全成分HbTrに対する反応は、選択したピークのエリアの和である。
表1は、準備した5×5×3サンプルセットからの反応データの表である。最初の二つの列は、mAU−秒におけるHbGrの反応及びHbTrの反応を含み、三番目の列は、5×5×3サンプルグリッドの配置に従ってサンプルを識別するために三つの数字の組合せを用いる。IDの一番目の数字は、%A1cレベルに対応し、IDの二番目の数字は、HbTc(トータルヘモグロビン濃度)レベルに対応し、IDの三番目の数字は、反復数である。レベル11は、%A1c=5.365%お呼びHbTc=0.42gm/Lに対応する。レベル55は、%Alc=17.420%及びHbTc=2.1gm/Lに対応する。残りのレベルは、レベル11とレベル55との間の値で等間隔に配置されている。このサンプルセットに対して、希釈は、処理ステップではなく予処理ステップ中に行われる。

図5は、この分離を示すクロマトグラムである。それは、ID=24.3として表1の三番目の列にラベルを付したサンプルに対応する。列1のHbGr値は、mAU−秒の単位で表現される、504を付したピークのエリアに対応する。そのピークは、第2のピークであり、単一のピークの頂点によって識別される二つの重なり合ったピークのうちの大きいほうである。対となる小さい方のピークは、非常に小さいので識別することができない。列2のHbTr値は、mAU−秒の単位で表現される、501,502,504及び505を付したピークのエリアの和に対応する。これらは、ヘモグロビンの全てのA(大人)成分である。ピーク503は、F(胎児)成分として識別され、従って和に含まれない。
FIG. 5 is a chromatogram showing this separation. It corresponds to the sample labeled in the third column of Table 1 with ID = 24.3. The HbGr value in
四つの異なる実施の形態を表す四つの変形例を、以下説明する。各変形例は、モデル及び変換によって規定される。各変形例は、モデル及び変換において表1のHPLCデータを用いることによって構成される。モデルの式は、形態
(z1で表される)HbGr及び(z2で表される)HbTrは、変換
これらの式は、校正表面を規定する。これらの式に対する係数は、サンプルを用いて決定され、この場合、yの値は既知である。反応z1及びz2は、測定によって決定される。一度係数が決定されると、未知のサンプルに対するyの値を決定するために、測定された反応を用いることができる。ヘモグロビン法におけるHbA1cの測定に対して、yは、%A1cと通常称される%HbA1cに対応する。 These equations define the calibration surface. The coefficients for these equations are determined using samples, where the value of y is known. Reactions z 1 and z 2 are determined by measurement. Once the coefficient is determined, the measured response can be used to determine the value of y for an unknown sample. For the measurement of HbA1c in the hemoglobin method, y corresponds to% HbA1c, commonly referred to as% A1c.
これらの変形例を説明するために用いられる計算は、MATLAB
例えば、A=[5,5,1;1,−5,3]は、a11=5,a12=5,a13=1,a21=1,a22=−5及びa23=3に対応する。モデル項は、モデルの所定の項に対するx1又はx2の乗数に対応する。例えば、モデル=[0,0;1,0;0,1;1,1;1,2;1,3]は、モデル:y=β00+β10x1+β01x2+β11x1x2+β12x1x2 2+β13x1x2 3に対応する。Bの項は、同様に生じる。 For example, A = [5,5,1; 1, −5,3] means a 11 = 5, a 12 = 5, a 13 = 1, a 21 = 1, a 22 = −5 and a 23 = 3. Corresponding to The model term corresponds to a multiplier of x 1 or x 2 for a given term in the model. For example, model = [0,0; 1,0; 0,1; 1,1; 1,2; 1,3] is model: y = β 00 + β 10 x 1 + β 01 x 2 + β 11 x 1 x Corresponds to 2 + β 12 x 1 x 2 2 + β 13 x 1 x 2 3 . The term B occurs similarly.
モデル係数の値を決定するに際し、変換されたデータは、丸め誤差を防止するためにスケール化(scaled)される。スケール化された係数値は、これらがモデル中に出現するのと同一のオーダーで存在する。スケール化は、HbGrデータをスケールAで除算するとともにHbTrデータをスケールBで除算することによって行われる。スケール化された値は、係数値とともに存在する。 In determining model coefficient values, the transformed data is scaled to prevent rounding errors. Scaled coefficient values exist in the same order as they appear in the model. Scaling is performed by dividing HbGr data by scale A and dividing HbTr data by scale B. Scaled values exist along with coefficient values.
全ての変形例において、自動校正と称されるプロセスが用いられる。データ行列中の75サンプルの全ては、キャリブレータとして用いられ、未知のものとして用いられる。このように決定された誤差は、実行誤差(run error)内にある。「分散成分分析」(Analysis of the Components of Variance)と称される標準的な技術を用いることによって、実行誤差内の誤差は、分散として表現され、成分に分割される。関心のある二つの成分は、(純粋誤差(pure error)とも称される)反復誤差(replicate error)及び不適合(LOF)誤差(lack-of-fit error)である。反復誤差は、データの品質のインジケータであり、不適合誤差は、データ及びモデルを変換データにするのに用いられる変換及びモデルの品質のインジケータである。不適合誤差の二つの成分がある。高レベル成分は、モデルが%A1cの異なる値に良好に適合する方法に関連し、低レベル成分は、モデルが%A1cの個別の値に対してトータルヘモグロビン濃度HbTcの異なる値に良好に適合する方法に関連する。 In all variants, a process called automatic calibration is used. All 75 samples in the data matrix are used as calibrators and as unknowns. The error determined in this way is within a run error. By using a standard technique called “Analysis of the Components of Variance”, the error within the running error is expressed as variance and divided into components. Two components of interest are the replicate error (also referred to as pure error) and the lack-of-fit error (LOF). The iteration error is an indicator of the quality of the data, and the non-conformance error is an indicator of the quality of the transform and model used to convert the data and model into transformed data. There are two components of nonconformity error. The high level component relates to how the model fits well to different values of% A1c, and the low level component fits well to different values of the total hemoglobin concentration HbTc for individual values of% A1c. Related to the method.
変形例1:変数の変換を伴わないx1の線形性 Modification 1: linearity of x 1 without change of variable
スケールA=300及びスケールB=2500に対して、
A=[1,0,0;0,0,0] B=[1,0,0;0,0,0]
モデル=[0,0;1,0;0,1;1,1;1,2;1,3]
係数=[1.6899;84.6864;−0.4049;−154.6571;110.0661;−27.0000]
For scale A = 300 and scale B = 2500
A = [1, 0, 0; 0, 0, 0] B = [1, 0, 0; 0, 0, 0]
Model = [0,0; 1,0; 0,1; 1,1; 1,2; 1,3]
Coefficient = [1.6899; 84.6864; -0.4049; -154.6571; 110.0661; -27.0000]
図6aは、結果的に得られる校正表面のコンタープロットである。コンタープロットの曲線(contours)は、曲線ラベル(contour label)で示した%A1cの定数値を表す。“+”の記号は、x1及びx2のデータ値である。 FIG. 6a is a contour plot of the resulting calibration surface. The contour plot curve (contours) represents a constant value of% A1c indicated by a curve label (contour label). The “+” symbol is the data value of x 1 and x 2 .
図6bは、結果的に得られる校正表面のパラメトリックプロットである。パラメトリックプロットの異なるラインは、コンタープロットにおいて等間隔に配置した水平線に対応するx2の定数値に対応する。プロットを有する説明文(legend)は、これらx2の値を示す。上から下まで、説明文の値は、ラインと同一のオーダーである。 FIG. 6b is a parametric plot of the resulting calibration surface. Different lines parametric plot corresponds to a constant value of the corresponding x 2 horizontal lines arranged at equal intervals in the contour plot. Description with plot (legend) shows the values of these x 2. From top to bottom, the value of the descriptive text is in the same order as the line.
図6cは、決定された値と既知の値との間の差を既知の値に対してプロットした差のプロットである。既知の値は、データセットを準備するために用いられる希釈の順序から決定される。絶対値が正確でない間、相対値の不正確さは、希釈の不正確さによってのみ決定される。2本の水平方向の破線は、平均からの1.96の標準偏差である。表2でバイアスと称するこの平均は、0と僅かに異なる。 FIG. 6c is a difference plot in which the difference between the determined value and the known value is plotted against the known value. The known value is determined from the order of dilution used to prepare the data set. While the absolute value is not accurate, the relative value inaccuracy is only determined by dilution inaccuracies. The two horizontal dashed lines are 1.96 standard deviations from the mean. This average, referred to as bias in Table 2, is slightly different from zero.
変形例2:変数の変換を伴うx1の線形性及びx2の非依存性 Variation 2: x 1 linearity with variable transformation and x 2 independence
スケールA=1及びスケールB=1に対して、
A=[1,0,5;1.2,−42,0] B=[1.2,−42,0;0,0,0]
モデル=[0,0;1,0]
係数=[1.574;553.816]
For scale A = 1 and scale B = 1,
A = [1, 0, 5; 1.2, −42, 0] B = [1.2, −42, 0; 0, 0, 0]
Model = [0,0; 1,0]
Coefficient = [1.574; 553.816]
図7aは、コンタープロットであり、図7bは、結果的に得られる校正表面のパラメトリックプロットである。反応がx1において線形であり、x2に依存しないので、このパラメトリックプロットは、単一の直線を減少させる。図7cは、図6cで説明したような差のプロットである。 FIG. 7a is a contour plot and FIG. 7b is a parametric plot of the resulting calibration surface. This parametric plot reduces a single straight line because the response is linear at x1 and independent of x2. FIG. 7c is a difference plot as described in FIG. 6c.
変形例3:変数の変換を伴うx1の線形性及びx2の線形性 Variation 3: x1 linearity and x2 linearity with variable transformation
スケールA=1及びスケールB=2500に対して、
A=[1,0,0;1,0,0] B=[1,0,2500;0,0,0]
モデル=[0,0;1,0;0,1:1,1]
係数=[1.2382;116.3012;0.1061;−19.7321]
For scale A = 1 and scale B = 2500
A = [1, 0, 0; 1, 0, 0] B = [1, 0, 2500; 0, 0, 0]
Model = [0,0; 1,0; 0,1: 1,1]
Coefficient = [1.2382; 116.3012; 0.1061; −19.7321]
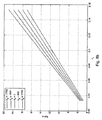
図8aは、コンタープロットであり、図8bは、結果的に得られる校正表面のパラメトリックプロットである。モデルはx1において線形的であるので、x2の異なる値に対応する図8bのラインは直線である。上から下まで、図8bの説明文の値は、ラインと同一のオーダーである。x2が線形的である結果、同一の値のx1に対してライン間のスペースが等しくなる。交差項x1,x2により、ラインは、x1が減少するに従って収束することができる。図8cは、図6cで説明したような差のプロットである。 FIG. 8a is a contour plot and FIG. 8b is a parametric plot of the resulting calibration surface. Since the model is linear in x 1, line of Figure 8b corresponding to different values of x 2 is linear. From top to bottom, the value of the legend in FIG. 8b is in the same order as the line. Result x 2 is linear, a space between lines is equal for x 1 of the same value. The cross terms x 1 and x 2 allow the line to converge as x 1 decreases. FIG. 8c is a difference plot as described in FIG. 6c.
変形例3において、A及びBの値の結果、x1=HbGr/HbTr及びx2=HbTr−2500となる。第1の変換は、反応の比としてx1を規定し、第2の変換は、HbTrの値の予測される範囲の中央にx2=0を置く。この後者の変換は、単なる便宜のためである。 In the third modified example, the values of A and B are x 1 = HbGr / HbTr and x 2 = HbTr-2500. The first transformation defines x 1 as the reaction ratio, and the second transformation places x 2 = 0 in the middle of the expected range of HbTr values. This latter conversion is for convenience only.
変形例3は、モデル係数を異なる時間間隔で決定される係数に分割できる方法を示す。行列A及びBで表される変換係数を、方法の進展中に設定することができ、その後に変化させる必要はない。四つのモデルパラメータを、試薬製造者により異なるロットの試薬に対して校正することができる。最初の二つの係数を、二つのキャリブレータのみを用いて短期間で製造所によって校正することができる。キャリブレータは、好適には、2500のミッドレンジ値付近でHbTr反応を有する。しかしながら、当該値からの任意の差を、x2=0に対応するHbTr=2500に対応した値にキャリブレータのラベル値を適合させるために現在の係数値を用いることによって適合させることができる。
以下の式はこの技術を示す。
モデルの第1の式を、
The first equation of the model is
変形例4:変数の変換を伴うx1の線形性及び2次のx2の依存性 Variant 4: Linearity of x 1 with variable transformation and dependency of second order x 2
スケールA=1及びスケールB=2500に対して、
A=[1,0,0;1,0,0] B=[1,0,2500;0,0,0]
モデル=[0,0;1,0;0,1;1,1;1,2]
係数=[1.2400;114.6677;0.2489;−21.4608;7.6198]
For scale A = 1 and scale B = 2500
A = [1, 0, 0; 1, 0, 0] B = [1, 0, 2500; 0, 0, 0]
Model = [0,0; 1,0; 0,1; 1,1; 1,2]
Coefficient = [1.2400; 114.6677; 0.2489; -21.4608; 7.6198]
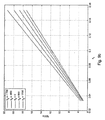
図9aは、コンタープロットであり、図9bは、結果的に得られる校正表面のパラメトリックプロットである。x1x2 2項の追加により、図9bの直線の間隔を、x2値の異なる対に対して異なるものとすることができる。上から下まで、図9bの説明文の値は、ラインと同一のオーダーである。図9cは、図6cで説明したような差のプロットである。図8と、モデルを更に複雑にした図9cとの比較から明らかなように、モデルの追加の項により不適合(LOF)誤差が減少する。x2を含まない項が二つしか存在しないので、短期間の校正を行うために二つのキャリブレータしか必要としない。しかしながら、更に複雑にしたことによって、モデルの長期間の安定性が落ちるおそれがある。変形例3に対して与えられる形態に従う実例を、この変形例として与えることもできる。
FIG. 9a is a contour plot and FIG. 9b is a parametric plot of the resulting calibration surface. With the addition of the x 1 x 2 2 term, the spacing of the straight lines in FIG. 9b can be different for different pairs of x 2 values. From top to bottom, the legend values in FIG. 9b are in the same order as the lines. FIG. 9c is a difference plot as described in FIG. 6c. As can be seen from a comparison between FIG. 8 and FIG. 9c, which further complicates the model, additional terms in the model reduce non-conformance (LOF) errors. Since term that does not contain x 2 are only two exist, requiring only two calibrators to calibrate the short term. However, further complexity can reduce the long-term stability of the model. An actual example according to the form given for
分散成分の分析 Analysis of dispersion components
表2は、前節で示した四つの変形例に対する分散成分の編集である。表中、LOFは不適合度の略記であり、反復は、反復反応の差から決定される分散成分である。それは、純粋誤差(Pure Error)とも称される。
変形例1は、他の三つの変形例より大きい反復誤差を有する。変形例3及び4は、両方の反応に共通の誤差の大部分を取り除く変形例1に対する反応の比を用いる。この共通の誤差は、反復に対して用いられるサンプルサイズの差に起因する。%A1cの異なる値に対する不適合分散は負であり、したがって、無視しうるものとして報告される。トータルヘモグロビン濃度HbTcの異なる値に対する不適合誤差は、最も重要な要因である。変形例1は、複雑であるだけでなく、この誤差に対して最も大きな値を有する。変形例3は、著しく小さい誤差を有し、変形例3が単純であるために、変形例3は、更に複雑な変形例4及び2よりも好ましい。
全ての変形例のバイアスは、10−12未満であり、したがって、重要でないものとして報告される。この小さい値は、キャリブレータ及び患者標本と同一のサンプルが用いられる自動校正に固有のものである。この小さい値のために、全体的に補正された分散に対する全体的に補正されていない分散の比は、全部で75サンプルが存在するので単純に関連の自由度の比の逆である74/75となる。 The bias for all variants is less than 10-12 and is therefore reported as insignificant. This small value is unique to automatic calibration where the same sample as the calibrator and patient specimen is used. Because of this small value, the ratio of globally uncorrected variance to globally corrected variance is simply the inverse of the ratio of related degrees of freedom as there are a total of 75 samples. It becomes.
これら四つの変形例を説明のために示した。このHPLCデータセット及び/又は異なるHPLCデータセットに対しては、他の変形例が更に適切になりうる。 These four variations are shown for explanation. Other variations may be more appropriate for this HPLC data set and / or different HPLC data sets.
HbA1cの測定のための複数の分析物の免疫測定法 Multiple analyte immunoassay for measurement of HbA1c
提案方法の他の実施の形態は、HbA1cの測定のための複数の分析物の免疫測定法を用いる。 Another embodiment of the proposed method uses a multi-analyte immunoassay for the measurement of HbA1c.
図4aは、HbA1cを測定する複数の分析物の免疫測定法によるトータルヘモグロビンに対するHbA1cの比の計算を伴うステップを示す。 FIG. 4a shows the steps involved in calculating the ratio of HbA1c to total hemoglobin by immunoassay for multiple analytes measuring HbA1c.
ステップ404〜409は、図1に示すステップ101〜104及び図2のステップ201〜204とほぼ同一である。ステップ406において、患者検体を取得する。ステップ407において、この患者検体を、予処理又はテストサンプルに変換し、ステップ408において、標識ビーズの集団を生成するために複数の分析物の免疫測定法が用いられ、この場合、トータルヘモグロビン(HbT)ビーズとして標識付けされたビーズに対するグリコシル化ヘモグロビン(HbG)ビーズとして標識付けされたビーズの割合は、グリコシル化ヘモグロビン(HbGc)及びトータルヘモグロビン(HbTc)の濃度に関連する。これらのビーズは、HbG及びHbTに対する抗体と、HbGビーズ又はHbTビーズとして識別することができる対応する蛍光タグとを有する。これらのビーズは、定量化することができる他の個別の蛍光タグも有する。識別及び定量化のためのこれらのビーズの表示はステップ409である。この表示は、識別及び表示のために異なる色の蛍光を発するようビーズを励起する二つのレーザにビーズを通すことによって行われる。HbGビーズ及びHbTビーズとして識別されるビーズからの量子化された蛍光の量は、“HbGr=HbG抗体を有するビーズからの蛍光”及び“HbTr=HbT抗体を有するビーズからの蛍光”として示される。
データセットを生成するために9×9×3サンプルが用いられた。最高レベルの%A1cが顕著な飽和量(amount of saturation)を示したので、それを使用しなかった。サンプルセットを8×9×3サンプルセットまで減少した。残りの最高レベルの%A1cにおける残りの飽和に加えて、このサンプルセットは、HPLCデータセットと比べて反復誤差が約2倍になった。免疫測定法に固有の非線形性に加えて、データは、対の一方に対する抗体と対の他方の濃度との間に交差反応を示す。校正表面法の用途の二つの変形例を、このデータセットに対して提供する。これらの変形例を、変形例5及び変形例6と称する。HPLCデータを提供するために用いられる同一の定義及びフォーマットを用いる。多量の未加工データのために、それを表として提供しない。しかしながら、変動成分の分析のテーブルを提供する。
9 × 9 × 3 samples were used to generate the data set. The highest level of% A1c showed a significant amount of saturation and was not used. The sample set was reduced to an 8x9x3 sample set. In addition to the remaining saturation at the highest remaining level of% A1c, this sample set had approximately twice the repeat error compared to the HPLC data set. In addition to the non-linearity inherent in immunoassays, the data show a cross-reactivity between the antibody against one of the pair and the other concentration of the pair. Two variations of calibration surface method applications are provided for this data set. These modifications are referred to as Modification 5 and
変形例5:6個の項及びx1=HbGr/HbTrを有するモデル Variation 5: Model with 6 terms and x1 = HbGr / HbTr
スケールA=1及びスケールB=10000に対して、
A=[1,0,0;1,0,0] B=[1,0,0;0,0,0]
モデル=[0,0;1,0;2,0;0,2;2,1;1,2]
係数=[4.1202;9.5793;−1.8632;−0.5667;1.1353;−0.6738]
For scale A = 1 and scale B = 10000,
A = [1, 0, 0; 1, 0, 0] B = [1, 0, 0; 0, 0, 0]
Model = [0,0; 1,0; 2,0; 0,2; 2,1; 1,2]
Factor = [4.1022; 9.5793; -1.8632; -0.5667; 1.1353; -0.6738]
図10aは、コンタープロットであり、図10bは、結果的に得られる校正表面のパラメトリックプロットである。上から下まで、図10bの説明文の値は、0.5未満のx1の値に対する曲線と同一のオーダーである。図10cは、決定された値と既知の値の間の差を希釈によって決定した既知の値に対してプロットした差のプロットである。水平方向の二つの破線は、平均からの1.96の標準偏差である。 FIG. 10a is a contour plot and FIG. 10b is a parametric plot of the resulting calibration surface. From top to bottom, the legend values in FIG. 10b are in the same order as the curve for x 1 values less than 0.5. FIG. 10c is a difference plot in which the difference between the determined value and the known value is plotted against the known value determined by dilution. The two horizontal dashed lines are 1.96 standard deviations from the mean.
変形例6:変換によってモデルはx1及びx2において線形になる Variant 6: Transformation makes the model linear in x 1 and x 2
スケールA=0.003及びスケールB=10000に対して、
A=[0.75,0.36;1.5,0,−500] B=[0.93,0,0;0,0,0]
モデル=[0,0;1,0;0,1;1,1]
係数=[5.4077;0.8364;−5.4188;52.9571]
For scale A = 0.003 and scale B = 10000,
A = [0.75, 0.36; 1.5, 0, −500] B = [0.93, 0, 0; 0, 0, 0]
Model = [0,0; 1,0; 0,1; 1,1]
Coefficient = [5.4077; 0.8364; -5.4188; 52.9571]
図11aは、コンタープロットであり、図11bは、結果的に得られる校正表面のパラメトリックプロットである。上から下まで、図11bの説明文の値は、0.0003未満のx1の値のラインと同一オーダーであり、0.003を超えるx1の値のラインと逆のオーダーである。図11bにおいてラインの全てが交差するx1の値は、図11aの垂直コンター(vertical contour)に対応する。図11cは、決定された値と既知の値との間の差を既知の値に対してプロットした差のプロットである。 FIG. 11a is a contour plot and FIG. 11b is a parametric plot of the resulting calibration surface. From top to bottom, the values of figure legends 11b is a line the same order of x 1 value less than 0.0003, a line opposite of the order of the values of x 1 in excess of 0.003. The value of x1 where all of the lines intersect in FIG. 11b corresponds to the vertical contour of FIG. 11a. FIG. 11c is a difference plot in which the difference between the determined value and the known value is plotted against the known value.
分散成分の分析 Analysis of dispersion components
表3は、前節で示した二つの変形例に対する分散成分の編集である。用語の使い方は表2と同一である。
バイアスが無視できるので、全体的に補正された分散に対する全体的に補正されていない分散の比は、全部で72サンプルを3回反復するので単純に関連の自由度の比の逆である215/216となる。 Since the bias is negligible, the ratio of the globally uncorrected variance to the globally corrected variance is simply the inverse of the ratio of the related degrees of freedom as it repeats all 72 samples three times. 216.
これら二つの変形例は、同程度の分散成分を与える。これらは、モデルの複雑さと変換の複雑さとの間で行うことができる多数のトレードオフの二つを表す。変形例6は、四つのモデル係数に加えて五つの変換係数を有しながら両方の変数の線形性を実現する。
These two variants give comparable dispersion components. These represent two of the many trade-offs that can be made between model complexity and transformation complexity.
モデル係数と変換係数との間の最適なバランスは、校正表面が用いられる特定の用途に依存する。これらの変形例を示すために用いられる一般的な変換モデルの他の形態が有益となり得る。これらの変形例で用いられる場合よりも複雑な組合せで変数が用いられるモデルも有利となることができ、他の任意の変換を行う必要を減らすことができる。 The optimal balance between model and conversion factors depends on the particular application for which the calibration surface is used. Other forms of the general transformation model used to illustrate these variations can be beneficial. Models that use variables in more complex combinations than those used in these variations can also be advantageous, reducing the need to perform any other transformations.
「一つ」又は「その」("a", "an" or "the")の記述は、特に反対であることを意図しない場合には「一つ以上」を意味する。 Reference to “one” or “its” (“a”, “an” or “the”) means “one or more” unless specifically intended to the contrary.
この教示をこれらの典型的な実施の形態に関連して説明したが、当業者は、過度の実験を行うことなくこれらの実施の形態の幾多の変更及び変形が可能であることを容易に理解する。そのような変更及び変形の全ては、この教示の範囲内にある。上記の例は、開示した教示を更によく説明するために提供したものであり、ここに提供した教示の範囲を制限することを意図したものではない。 Although this teaching has been described in connection with these exemplary embodiments, those skilled in the art will readily appreciate that many variations and modifications of these embodiments are possible without undue experimentation. To do. All such modifications and variations are within the scope of this teaching. The above examples are provided to better illustrate the disclosed teachings and are not intended to limit the scope of the teachings provided herein.
特許、特許出願、論文、教科書等を含むここで引用した全ての文献及びまだそうでない程度でここに参照した文献は、参照によりそのままここに組み込まれる。規定された用語、用語の使用、記載された技術等を含むがこれに限定されない組み込まれた文献又は同様な資料の一つ以上が本願と異なり又は矛盾する場合、本願を優先する。 All documents cited herein, including patents, patent applications, papers, textbooks, etc., and documents referred to here to the extent not yet, are hereby incorporated by reference in their entirety. In the event that one or more of the incorporated literature or similar material is different or inconsistent with this application, including but not limited to the defined terms, use of terms, described techniques, etc., this application will control.
Claims (22)
二つ以上の分析物の二つ以上の個別の分析物反応を取得するために、選択した測定プロセスを用いてサンプル中の二つ以上の分析物の反応を測定し、
前記選択した測定プロセスを用いて取得した前記二つ以上の個別の分析物反応の一次関数として前記二つ以上の分析物の濃度の比を規定する一つ以上の変換法を選択し、前記一次関数は、前記濃度の比を出力する多変数回帰モデルを有し、前記回帰モデルの複数の変数は、前記二つ以上の個別の分析物反応を有し、
選択した前記一つ以上の変換法と、前記二つ以上の個別の分析物反応とを用いることによって、前記サンプル中の前記二つ以上の分析物の濃度の比をプロセッサにより算出することを特徴とする方法。 A method for determining the ratio of the concentrations of different analytes in a sample, comprising:
To obtain the two or more individual analyte reaction of two or more analytes, and measuring the response of two or more analytes in a sample by using a measurement process selected,
Select one or more conversion methods that defines the ratio of the concentration of the two or more analytes as a direct function of the two or more individual analyte responses obtained using the measurement process described above selection, the primary A function has a multivariate regression model that outputs the ratio of the concentrations, and the variables of the regression model have the two or more individual analyte responses;
Using the selected one or more transformation methods and the two or more individual analyte reactions to calculate a ratio of the concentrations of the two or more analytes in the sample by a processor. And how to.
サンプル中の二つ以上の分析物の反応を測定することができる測定モジュールと、
前記測定モジュールからの測定された分析物反応を格納するメモリと、
前記測定モジュールから取得した分析物の測定された反応の一次関数として二つ以上の分析物の濃度の比を規定する一つ以上の変換方法を実行する命令を有するコンピュータ読取可能コードを含み、前記一次関数は、前記濃度の比を出力する多変数回帰モデルを有し、前記回帰モデルの複数の変数は、前記二つ以上の個別の分析物反応を有する、コンピュータ読取可能媒体と、
前記一つ以上の変換法を用いて前記二つ以上の分析物の濃度の比を計算するために前記コンピュータ読取可能媒体の前記コンピュータ読取可能コードを実行するプロセッサと、
を備える装置。 A device for measuring the ratio of two or more analyte concentrations,
A measurement module capable of measuring the reaction of two or more analytes in a sample;
A memory for storing the measured analyte response from the measurement module;
The saw including a computer readable code having instructions to perform one or more of the conversion method of defining the ratio of the concentration of two or more analytes as a direct function of the measured response of the analytes obtained from the measuring module, The linear function comprises a multivariable regression model that outputs the ratio of the concentrations, wherein the plurality of variables of the regression model comprises the two or more individual analyte responses ;
A processor executing the computer readable code of the computer readable medium to calculate a ratio of the concentrations of the two or more analytes using the one or more transformation methods;
A device comprising:
二つ以上の分析物の二つ以上の個別の分析物反応を取得するために、選択した測定プロセスを用いてサンプル中の二つ以上の分析物の反応を測定するコードと、
前記選択した測定プロセスから取得した分析物の二つ以上の個別の反応の一次関数として二つ以上の分析物の比を規定する変換法を選択し、前記一次関数は、前記濃度の比を出力する多変数回帰モデルを有し、前記回帰モデルの複数の変数は、前記二つ以上の個別の分析物反応を有する、コードと、
前記選択した変換法及び前記サンプルからの測定された分析物反応を用いて前記サンプルの二つ以上の分析物の濃度の比を算出するコードと、
を備えることを特徴とするコンピュータ読取可能媒体。 A non-transitory computer readable medium having computer readable code having instructions for determining a ratio of concentrations of different analytes in a sample, the computer readable code comprising:
A code that measures the response of two or more analytes in a sample using a selected measurement process to obtain two or more individual analyte responses of two or more analytes;
Select the conversion method that defines the ratio of two or more analytes as two or more linear functions of the individual reaction of the analyte obtained from measurement process described above selection, the primary function, the output ratio of the concentration A code having a multivariate regression model, wherein a plurality of variables of the regression model has the two or more individual analyte responses ;
Code for calculating the ratio of the concentration of two or more analytes of the sample using the measured analyte responses from the conversion method and the samples were the selection,
A computer-readable medium comprising:
Applications Claiming Priority (3)
| Application Number | Priority Date | Filing Date | Title |
|---|---|---|---|
| US12/196,132 US8260556B2 (en) | 2008-08-21 | 2008-08-21 | Calibration surface method for determination on of analyte ratios |
| US12/196,132 | 2008-08-21 | ||
| PCT/US2009/053746 WO2010021914A2 (en) | 2008-08-21 | 2009-08-13 | Calibration surface method for determination of analyte ratios |
Publications (3)
| Publication Number | Publication Date |
|---|---|
| JP2012500401A JP2012500401A (en) | 2012-01-05 |
| JP2012500401A5 JP2012500401A5 (en) | 2012-10-04 |
| JP5567567B2 true JP5567567B2 (en) | 2014-08-06 |
Family
ID=41697148
Family Applications (1)
| Application Number | Title | Priority Date | Filing Date |
|---|---|---|---|
| JP2011523882A Active JP5567567B2 (en) | 2008-08-21 | 2009-08-13 | Calibration surface method to determine analyte ratio |
Country Status (7)
| Country | Link |
|---|---|
| US (1) | US8260556B2 (en) |
| EP (1) | EP2316027A4 (en) |
| JP (1) | JP5567567B2 (en) |
| CN (1) | CN102159947B (en) |
| AU (1) | AU2009282958A1 (en) |
| CA (1) | CA2734741A1 (en) |
| WO (1) | WO2010021914A2 (en) |
Families Citing this family (10)
| Publication number | Priority date | Publication date | Assignee | Title |
|---|---|---|---|---|
| US8260556B2 (en) | 2008-08-21 | 2012-09-04 | Bio-Rad Laboratories, Inc. | Calibration surface method for determination on of analyte ratios |
| US8603828B2 (en) * | 2009-11-18 | 2013-12-10 | Bio-Rad Laboratories, Inc. | Multiplex immunoassays for hemoglobin, hemoglobin variants, and glycated forms |
| US8620590B2 (en) * | 2010-09-30 | 2013-12-31 | Bio-Rad Laboratories, Inc. | Dose surface method for determination of analyte ratios |
| RU2629310C2 (en) * | 2011-09-14 | 2017-08-28 | Пхадиа Аб | Calibrational reagent and method |
| WO2014025715A2 (en) * | 2012-08-08 | 2014-02-13 | Paul Saunders | Compact multiple media chromatography |
| CA2900201A1 (en) * | 2014-08-25 | 2016-02-25 | Alireza Ebrahim | Value assignment for customizable quality controls |
| GB201517985D0 (en) * | 2015-10-12 | 2015-11-25 | Ge Healthcare Bio Sciences Ab | A method in a surface plasmon resonance biosensor system |
| CN106596209B (en) * | 2015-10-14 | 2020-05-12 | 杭州量康科技有限公司 | Dry blood sample pretreatment and detection method |
| CN110996794B (en) | 2017-08-18 | 2023-09-08 | 雅培糖尿病护理公司 | Method and computer system for calibrating a medical device |
| JP2022532212A (en) * | 2019-05-17 | 2022-07-13 | ソマロジック オペレーティング カンパニー インコーポレイテッド | Controlling sample-to-sample variability in complex biological matrices |
Family Cites Families (19)
| Publication number | Priority date | Publication date | Assignee | Title |
|---|---|---|---|---|
| US5606164A (en) | 1996-01-16 | 1997-02-25 | Boehringer Mannheim Corporation | Method and apparatus for biological fluid analyte concentration measurement using generalized distance outlier detection |
| WO1997006418A1 (en) * | 1995-08-07 | 1997-02-20 | Boehringer Mannheim Corporation | Biological fluid analysis using distance outlier detection |
| US6436721B1 (en) * | 1997-07-25 | 2002-08-20 | Bayer Corporation | Device and method for obtaining clinically significant analyte ratios |
| US6210971B1 (en) | 1999-01-25 | 2001-04-03 | Bayer Corporation | Assay for the detection of creatinine |
| JP4144117B2 (en) * | 1999-06-04 | 2008-09-03 | 東ソー株式会社 | Method and apparatus for measuring glucose |
| US6898451B2 (en) * | 2001-03-21 | 2005-05-24 | Minformed, L.L.C. | Non-invasive blood analyte measuring system and method utilizing optical absorption |
| US7392199B2 (en) | 2001-05-01 | 2008-06-24 | Quest Diagnostics Investments Incorporated | Diagnosing inapparent diseases from common clinical tests using Bayesian analysis |
| US6862534B2 (en) | 2001-12-14 | 2005-03-01 | Optiscan Biomedical Corporation | Method of determining an analyte concentration in a sample from an absorption spectrum |
| JP2005253478A (en) * | 2002-03-18 | 2005-09-22 | Citizen Watch Co Ltd | Hemoglobin analyzer |
| US6977517B2 (en) * | 2002-05-20 | 2005-12-20 | Finisar Corporation | Laser production and product qualification via accelerated life testing based on statistical modeling |
| US7174198B2 (en) * | 2002-12-27 | 2007-02-06 | Igor Trofimov | Non-invasive detection of analytes in a complex matrix |
| US6968221B2 (en) * | 2003-03-14 | 2005-11-22 | Futrex, Inc. | Low-cost method and apparatus for non-invasively measuring blood glucose levels |
| WO2005031356A1 (en) * | 2003-09-23 | 2005-04-07 | Epinex Diagnostic, Inc. | Rapid test for glycated albumin |
| US20050176089A1 (en) | 2003-12-04 | 2005-08-11 | Ehrlich Michael S. | Methods and devices for retrieving a subject's physiological history from a biological sample analysis |
| CN1938589B (en) * | 2004-03-31 | 2011-12-28 | 拜尔健康护理有限责任公司 | Method and apparatus for implementing threshold based correction functions for biosensors |
| US20060281982A1 (en) * | 2005-06-14 | 2006-12-14 | Diasense, Inc. | Method and apparatus for the non-invasive sensing of glucose in a human subject |
| WO2007111282A1 (en) * | 2006-03-24 | 2007-10-04 | Arkray, Inc. | Method of measuring glycohemoglobin concentration and apparatus for concentration measurement |
| GB2436681B (en) * | 2006-03-31 | 2010-10-13 | Quotient Diagnostics Ltd | Fluorescent assay |
| US8260556B2 (en) | 2008-08-21 | 2012-09-04 | Bio-Rad Laboratories, Inc. | Calibration surface method for determination on of analyte ratios |
-
2008
- 2008-08-21 US US12/196,132 patent/US8260556B2/en active Active
-
2009
- 2009-08-13 EP EP09808625A patent/EP2316027A4/en not_active Withdrawn
- 2009-08-13 CN CN200980138015.1A patent/CN102159947B/en not_active Expired - Fee Related
- 2009-08-13 WO PCT/US2009/053746 patent/WO2010021914A2/en active Application Filing
- 2009-08-13 JP JP2011523882A patent/JP5567567B2/en active Active
- 2009-08-13 CA CA2734741A patent/CA2734741A1/en not_active Abandoned
- 2009-08-13 AU AU2009282958A patent/AU2009282958A1/en not_active Abandoned
Also Published As
| Publication number | Publication date |
|---|---|
| CN102159947A (en) | 2011-08-17 |
| US8260556B2 (en) | 2012-09-04 |
| US20100049444A1 (en) | 2010-02-25 |
| EP2316027A2 (en) | 2011-05-04 |
| EP2316027A4 (en) | 2011-11-09 |
| JP2012500401A (en) | 2012-01-05 |
| CA2734741A1 (en) | 2010-02-25 |
| WO2010021914A2 (en) | 2010-02-25 |
| WO2010021914A3 (en) | 2010-05-14 |
| CN102159947B (en) | 2014-11-19 |
| AU2009282958A1 (en) | 2010-02-25 |
Similar Documents
| Publication | Publication Date | Title |
|---|---|---|
| JP5567567B2 (en) | Calibration surface method to determine analyte ratio | |
| English et al. | HbA1c method performance: the great success story of global standardization | |
| Bry et al. | Effects of hemoglobin variants and chemically modified derivatives on assays for glycohemoglobin | |
| CA2643163C (en) | Temperature-adjusted analyte determination for biosensor systems | |
| JP3504750B2 (en) | Recalibration method of calibration relational expression and quantitative test kit | |
| Poskar et al. | iMS2Flux–a high–throughput processing tool for stable isotope labeled mass spectrometric data used for metabolic flux analysis | |
| JP2012500401A5 (en) | ||
| Lledó-García et al. | A semi-mechanistic model of the relationship between average glucose and HbA1c in healthy and diabetic subjects | |
| Kristiansen | Description of a generally applicable model for the evaluation of uncertainty of measurement in clinical chemistry | |
| Miller et al. | The evolving role of commutability in metrological traceability | |
| JPH0250416B2 (en) | ||
| JP2012163556A (en) | Analyzer, analysis program, and analysis method | |
| CN105378484A (en) | Normalized calibration of analyte concentration determinations | |
| JP5770597B2 (en) | Chromatogram display method, data processing apparatus, analysis apparatus, and display program | |
| Sriwimol et al. | Strong correlation and high comparability of capillary electrophoresis and three different methods for HbA1c measurement in a population without hemoglobinopathy | |
| Delatour et al. | Trueness assessment of HbA1c routine assays: are processed EQA materials up to the job? | |
| Oris et al. | Method validation of a set of 12 GEM® Premier™ 4000 blood gas analyzers for point-of-care testing in a university teaching hospital | |
| US20230280290A1 (en) | Device and method for analyzing diffraction pattern of mixture, and information storage medium | |
| EP2625519B1 (en) | Dose surface method for determination of analyte ratios | |
| Büttner | Reference methods as a basis for accurate measuring systems | |
| JP3647105B2 (en) | Analysis method and analyzer | |
| JP3279756B2 (en) | Quantitative calculator | |
| JP7015521B2 (en) | Whole blood albumin analyzer and whole blood albumin analysis method | |
| Ramamohan et al. | Modeling, analysis and optimization of calibration uncertainty in clinical laboratories | |
| KR102599838B1 (en) | Lab target range setting method using pooled standard deviation |
Legal Events
| Date | Code | Title | Description |
|---|---|---|---|
| A521 | Request for written amendment filed |
Free format text: JAPANESE INTERMEDIATE CODE: A523 Effective date: 20120813 |
|
| A621 | Written request for application examination |
Free format text: JAPANESE INTERMEDIATE CODE: A621 Effective date: 20120813 |
|
| A131 | Notification of reasons for refusal |
Free format text: JAPANESE INTERMEDIATE CODE: A131 Effective date: 20130205 |
|
| A977 | Report on retrieval |
Free format text: JAPANESE INTERMEDIATE CODE: A971007 Effective date: 20130206 |
|
| A601 | Written request for extension of time |
Free format text: JAPANESE INTERMEDIATE CODE: A601 Effective date: 20130502 |
|
| A602 | Written permission of extension of time |
Free format text: JAPANESE INTERMEDIATE CODE: A602 Effective date: 20130513 |
|
| TRDD | Decision of grant or rejection written | ||
| A01 | Written decision to grant a patent or to grant a registration (utility model) |
Free format text: JAPANESE INTERMEDIATE CODE: A01 Effective date: 20140520 |
|
| A61 | First payment of annual fees (during grant procedure) |
Free format text: JAPANESE INTERMEDIATE CODE: A61 Effective date: 20140619 |
|
| R150 | Certificate of patent or registration of utility model |
Ref document number: 5567567 Country of ref document: JP Free format text: JAPANESE INTERMEDIATE CODE: R150 |
|
| R250 | Receipt of annual fees |
Free format text: JAPANESE INTERMEDIATE CODE: R250 |
|
| R250 | Receipt of annual fees |
Free format text: JAPANESE INTERMEDIATE CODE: R250 |
|
| R250 | Receipt of annual fees |
Free format text: JAPANESE INTERMEDIATE CODE: R250 |
|
| R250 | Receipt of annual fees |
Free format text: JAPANESE INTERMEDIATE CODE: R250 |
|
| R250 | Receipt of annual fees |
Free format text: JAPANESE INTERMEDIATE CODE: R250 |
|
| R250 | Receipt of annual fees |
Free format text: JAPANESE INTERMEDIATE CODE: R250 |
|
| R250 | Receipt of annual fees |
Free format text: JAPANESE INTERMEDIATE CODE: R250 |