JP5284469B2 - Automatic discovery of physical connectivity between power outlets and IT equipment - Google Patents
Automatic discovery of physical connectivity between power outlets and IT equipment Download PDFInfo
- Publication number
- JP5284469B2 JP5284469B2 JP2011517390A JP2011517390A JP5284469B2 JP 5284469 B2 JP5284469 B2 JP 5284469B2 JP 2011517390 A JP2011517390 A JP 2011517390A JP 2011517390 A JP2011517390 A JP 2011517390A JP 5284469 B2 JP5284469 B2 JP 5284469B2
- Authority
- JP
- Japan
- Prior art keywords
- data
- power supply
- server
- candidate
- power
- Prior art date
- Legal status (The legal status is an assumption and is not a legal conclusion. Google has not performed a legal analysis and makes no representation as to the accuracy of the status listed.)
- Active
Links
Images

Classifications
-
- G—PHYSICS
- G06—COMPUTING OR CALCULATING; COUNTING
- G06F—ELECTRIC DIGITAL DATA PROCESSING
- G06F1/00—Details not covered by groups G06F3/00 - G06F13/00 and G06F21/00
- G06F1/26—Power supply means, e.g. regulation thereof
- G06F1/28—Supervision thereof, e.g. detecting power-supply failure by out of limits supervision
-
- G—PHYSICS
- G06—COMPUTING OR CALCULATING; COUNTING
- G06F—ELECTRIC DIGITAL DATA PROCESSING
- G06F1/00—Details not covered by groups G06F3/00 - G06F13/00 and G06F21/00
- G06F1/26—Power supply means, e.g. regulation thereof
-
- G—PHYSICS
- G06—COMPUTING OR CALCULATING; COUNTING
- G06F—ELECTRIC DIGITAL DATA PROCESSING
- G06F1/00—Details not covered by groups G06F3/00 - G06F13/00 and G06F21/00
- G06F1/26—Power supply means, e.g. regulation thereof
- G06F1/32—Means for saving power
- G06F1/3203—Power management, i.e. event-based initiation of a power-saving mode
-
- G—PHYSICS
- G06—COMPUTING OR CALCULATING; COUNTING
- G06F—ELECTRIC DIGITAL DATA PROCESSING
- G06F11/00—Error detection; Error correction; Monitoring
- G06F11/30—Monitoring
- G06F11/3051—Monitoring arrangements for monitoring the configuration of the computing system or of the computing system component, e.g. monitoring the presence of processing resources, peripherals, I/O links, software programs
-
- G—PHYSICS
- G06—COMPUTING OR CALCULATING; COUNTING
- G06F—ELECTRIC DIGITAL DATA PROCESSING
- G06F11/00—Error detection; Error correction; Monitoring
- G06F11/30—Monitoring
- G06F11/3058—Monitoring arrangements for monitoring environmental properties or parameters of the computing system or of the computing system component, e.g. monitoring of power, currents, temperature, humidity, position, vibrations
- G06F11/3062—Monitoring arrangements for monitoring environmental properties or parameters of the computing system or of the computing system component, e.g. monitoring of power, currents, temperature, humidity, position, vibrations where the monitored property is the power consumption
-
- G—PHYSICS
- G06—COMPUTING OR CALCULATING; COUNTING
- G06F—ELECTRIC DIGITAL DATA PROCESSING
- G06F11/00—Error detection; Error correction; Monitoring
- G06F11/30—Monitoring
- G06F11/3089—Monitoring arrangements determined by the means or processing involved in sensing the monitored data, e.g. interfaces, connectors, sensors, probes, agents
- G06F11/3093—Configuration details thereof, e.g. installation, enabling, spatial arrangement of the probes
Landscapes
- Engineering & Computer Science (AREA)
- Theoretical Computer Science (AREA)
- Physics & Mathematics (AREA)
- General Engineering & Computer Science (AREA)
- General Physics & Mathematics (AREA)
- Computing Systems (AREA)
- Quality & Reliability (AREA)
- Power Sources (AREA)
- Management, Administration, Business Operations System, And Electronic Commerce (AREA)
Description
本発明は、概括的にはデータ・センターにおける電力管理の分野に関し、より詳細にはパワー・アウトレットとIT装置との間の接続性の自動発見および自動接続性発見機能を有するデータ・センターの動作方法に関する。 The present invention relates generally to the field of power management in data centers, and more particularly to automatic discovery of connectivity between power outlets and IT equipment and operation of a data center with automatic connectivity discovery. Regarding the method.
知的な電力分配装置は、ある種の敏感な電気的および電子的応用について向上した電力分配および監視機能を提供する。知的な電力分配装置の配備が有用であると立証される例示的な応用は、電力管理ポリシーに基づくあらかじめ定義されたスケジュールでの、ネットワーク・サービスの提供に関わる複数のコンピュータ・サーバーへの電力供給にある。ここで、電力分配を制御および監視できることは、コンピュータ・ネットワーク運営者およびIT人員にとって、また包括的な電力最適化における使用のために、測り知れない価値のあるツールである。 Intelligent power distribution devices provide improved power distribution and monitoring capabilities for certain sensitive electrical and electronic applications. An exemplary application where the deployment of intelligent power distribution devices has proven useful is the power to multiple computer servers involved in providing network services on a predefined schedule based on power management policies. In supply. Here, the ability to control and monitor power distribution is an invaluable tool for computer network operators and IT personnel, and for use in comprehensive power optimization.
上記の型の一つの知的な電力装置は、米国ニュージャージー州サマセットのラリタン社(Raritan Corp.)によって開発および販売されているドミニオンPX(Dominion PX)知的電力分配ユニット(IPDU: Intelligent Power Distribution Unit)である。ドミニオンPX IPDUは、装置に含まれるACパワー・アウトレットのそれぞれにおける、増大した動作上および監視の機能を提供する。一般に、これらの機能は、数ある特徴の中でも、アウトレットをオンおよびオフにする機能を含み、またそのアウトレットのための電力消費測定をも提供する。知的電力装置または該知的電力装置を監視する設備が、電力ケーブルの反対側で知的電力装置の各アウトレットにどの具体的な設備が差し込まれているかを知ることが望ましい。 One intelligent power device of the above type is the Dominion PX Intelligent Power Distribution Unit (IPDU), which is developed and sold by Raritan Corp., Somerset, New Jersey. Unit). The Dominion PX IPDU provides increased operational and monitoring capabilities at each of the AC power outlets included in the device. In general, these functions include the ability to turn an outlet on and off, among other features, and also provide power consumption measurements for that outlet. It is desirable for the intelligent power device or the facility that monitors the intelligent power device to know which specific facility is plugged into each outlet of the intelligent power device on the opposite side of the power cable.
さらに、ネットワーク管理者はしばしば、データ・センターの電力接続性のトポロジーを維持することを要求される。電力接続性のトポロジーを維持するための一つの方法は、スプレッドシートを用いて、あるいは中央集中された構成データベースにおいてである。これはネットワーク管理者が随時更新する。物理的な電力接続性関係を追跡するために、他のデータ・センター・アセット管理システムも利用可能である。それは、バーコード・リーダーおよびネーム・プレート中のシリアル・ナンバーを使った物理的な接続の手動入力に依拠する。いったん入力されたデータは、トポロジー・レンダリング・エンジンに提出されることができる。トポロジー・レンダリング・エンジンはトポロジーをリポートとして、あるいは直観的な視覚化のためにトポロジー・マップとして提出できる。何千ものサーバーを含むことのある大規模なデータ・センターでは、データ・センター電力トポロジーを手動で維持することは骨が折れ、誤りを生じやすいタスクである。 In addition, network managers are often required to maintain a data center power connectivity topology. One way to maintain the power connectivity topology is with a spreadsheet or in a centralized configuration database. This is updated from time to time by the network administrator. Other data center asset management systems are also available to track physical power connectivity relationships. It relies on manual entry of the physical connection using the barcode reader and the serial number in the name plate. Once entered, the data can be submitted to the topology rendering engine. The topology rendering engine can submit the topology as a report or as a topology map for intuitive visualization. In large data centers that can contain thousands of servers, manually maintaining the data center power topology is a laborious and error-prone task.
それにもかかわらず、精確で最新の電力トポロジーを維持することの重要性はネットワークの管理および運営の分野において高まりつつある。コンピューティングのコストが低下するにつれ、データ・センターによる電力使用のコストがコスト要因となる。したがって、電力消費を削減することは、ネットワーク管理者にとって関心課題である。同様に、最近のグリーン・イニシアチブは、データ・センターにおける電力使用を削減することにインセンティブを提供している。グリーン・グリッド(Green Grid)のような組織は、データ・センターのエネルギー効率の指標を公表している。データ・センターは、効率を評価する際、これらの指標に対して自分自身を測定する。これらのデータ・センター管理要件のすべては、高度に精確なデータ・センター電力トポロジーから裨益する。 Nevertheless, the importance of maintaining accurate and up-to-date power topology is growing in the field of network management and operation. As computing costs decrease, the cost of using power by the data center becomes a cost factor. Therefore, reducing power consumption is a concern for network administrators. Similarly, recent green initiatives are providing incentives to reduce power usage in data centers. Organizations such as the Green Grid have published data center energy efficiency metrics. Data centers measure themselves against these indicators when assessing efficiency. All of these data center management requirements benefit from a highly accurate data center power topology.
ネットワークのためのある種の自動発見トポロジー・ツールが知られている。ping、tracertおよびmpingのようなこれらのツールは、ネットワークのための論理的な接続性マップを開示する。しかしながら、これらはIT設備とパワー・アウトレットとの間の物理的な接続性の自動的な発見を提供するものではない。現在のところ、電力分配装置の特定のアウトレットにどの設備が付随しているかを判別する唯一の方法は、その情報を手動で入力することである。 Certain automatic discovery topology tools for networks are known. These tools like ping, tracert and mping disclose logical connectivity maps for the network. However, these do not provide automatic discovery of physical connectivity between IT equipment and power outlets. Currently, the only way to determine which equipment is associated with a particular outlet of a power distribution device is to enter that information manually.
本発明の原理に基づくシステムおよび方法は、データ・センターにおける情報技術(IT: information technology)設備のための物理的な接続性のトポロジーを自動的に発見する。トポロジーはIT設備(IT equipment)とパワー・アウトレット〔電源コンセント〕(power outlet)との間の接続を表示する。本願の原理に基づくシステムは、一組のヒューリスティックス(heuristics)を適用して、個々のサーバーまたは他のIT設備についての、候補となるパワー・アウトレットを同定する。一つの側面では、特定の設備について、候補アウトレットは、そのIT設備への物理的な近接性に基づいて選択される。これらの候補は、理論的な電力消費データ、実際の電力消費データ、CPU利用度(CPU utilization)および状態変化イベントの相関(correlation)に基づいて逐次反復的に絞り込まれる。 Systems and methods based on the principles of the present invention automatically discover the topology of physical connectivity for information technology (IT) equipment in data centers. The topology displays the connection between the IT equipment and the power outlet. A system based on the present principles applies a set of heuristics to identify candidate power outlets for individual servers or other IT equipment. In one aspect, for a particular facility, candidate outlets are selected based on physical proximity to that IT facility. These candidates are iteratively refined sequentially based on theoretical power consumption data, actual power consumption data, CPU utilization and correlation of state change events.
物理的な位置は、超音波検知またはRFIDのようなさまざまな技術を使って決定できる。この情報は次いで、サーバーとパワー・アウトレットとの間の物理的な接続性を増強するために使用できる。典型的な状況では、IT設備ベンダーによって提供される電力消費データが、そのベンダーによって提供される動作範囲内にはいるアウトレットを系統的に比較することによって候補アウトレットを絞り込むために使用できる。このネーム・プレート・データは典型的には実際の電力消費を超過し、候補アウトレットを決定的なマッピングまで絞り込まないことがありうる。これらの場合、実際のデータが、さらに候補アウトレットを絞り込むことができる。サーバーについてのCPU利用度データがある時間区間にわたって収集され、ノイズおよび他のアーチファクトを軽減するために量子化されることができる。同じ時間期間にわたる実際の電力消費は、適切なIPDUを使って候補パワー・アウトレットから収集される。量子化されたCPU利用度および電力消費のグラフの間のパターン・マッチングが一致〔マッチ〕を同定する。さらに、電力およびCPU利用度データに反映される状態変化は、所与のIT設備について候補パワー・アウトレットをさらに絞り込む。量子化されたCPU利用度および電力消費データはまた、これらの比較のためにも使用されることができる。ヒューリスティックスが候補を絞り込むが収束しない場合、管理者は利用度グラフおよび他のデータ出力を見て、あるIT設備についての最良のアウトレット候補についての主観的な結論を下すことができる。 The physical location can be determined using various techniques such as ultrasonic detection or RFID. This information can then be used to enhance physical connectivity between the server and the power outlet. In a typical situation, power consumption data provided by an IT equipment vendor can be used to narrow down candidate outlets by systematically comparing outlets that are within the operating range provided by that vendor. This name plate data typically exceeds actual power consumption and may not narrow the candidate outlets to a definitive mapping. In these cases, the actual data can further narrow down the candidate outlets. CPU utilization data for the server can be collected over a period of time and quantized to reduce noise and other artifacts. Actual power consumption over the same time period is collected from the candidate power outlet using the appropriate IPDU. A pattern match between the quantized CPU utilization and power consumption graphs is identified. In addition, state changes reflected in power and CPU utilization data further narrow the candidate power outlets for a given IT facility. Quantized CPU utilization and power consumption data can also be used for these comparisons. If heuristics narrows candidates but does not converge, administrators can look at usage graphs and other data outputs to make subjective conclusions about the best outlet candidates for an IT facility.
知的な電力分配ユニットのアウトレットと、そのアウトレットによって電力を受けるコンピュータ・サーバーのようなターゲット・デバイスとの間の自動的な素性(identity)関連付けを提供するためのシステムおよび方法は、パワー・アウトレットにおけるデータ収集を実装する電力管理ユニットまたは電力分配ユニットを含むことができる。IT設備の、設備ベンダーによって規定される電力要求プロファイルならびに時間にわたって測定される実際の使用パターンは、候補パワー・アウトレットで検出される電力消費パターンと相関付けされる。サーバーをオン/オフすること、サーバーのコンピューティング作業負荷の変化および仮想機械マイグレーションのようなIT設備上でのある種の状態変化の時間シーケンスの間でさらなる相関付けがなされる。これらの状態変化は、モニタリング・システムによって検出されることができ、パワー・アウトレットでの実際の電力利用度の変化に反映される。候補パワー・アウトレット数がIT設備に対する電力供給ユニットの数に一致するまで、ヒューリスティック規則および指標が逐次反復的に適用される。 A system and method for providing an automatic identity association between an outlet of an intelligent power distribution unit and a target device such as a computer server that is powered by the outlet A power management unit or a power distribution unit that implements data collection in can be included. The power usage profile defined by the equipment vendor as well as the actual usage pattern measured over time of the IT equipment is correlated with the power consumption pattern detected at the candidate power outlet. Further correlations are made between time sequences of certain state changes on IT equipment such as turning servers on / off, server computing workload changes, and virtual machine migration. These state changes can be detected by the monitoring system and are reflected in actual power utilization changes at the power outlet. Heuristic rules and indicators are applied sequentially and iteratively until the number of candidate power outlets matches the number of power supply units for the IT equipment.
本発明の原理に基づく物理的な接続性のトポロジーの発見は、高度な完全性(integrity)を維持する。実際のCPU利用度および電力消費のようなキーとなる指標に加えて、所与のIT設備の特定の機能性の他の指標特性が候補パワー・アウトレットをさらに特定できる。さらに、管理者がIT設備および発見されたパワー・アウトレットについてのCPU利用度および電力消費使用のグラフの実際の目視検査によってパワーのマッチングを検証することを許容するために、インターフェースを使うことができる。 The discovery of physical connectivity topologies based on the principles of the present invention maintains a high degree of integrity. In addition to key indicators such as actual CPU utilization and power consumption, other indicator characteristics of specific functionality of a given IT facility can further identify candidate power outlets. In addition, interfaces can be used to allow administrators to verify power matching by actual visual inspection of CPU utilization and power consumption usage graphs for IT equipment and discovered power outlets. .
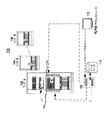
図1は、本発明の原理に基づくシステム100を開示している。システム100は、IT設備のN個のラックを含んでおり、そのうち三つのラック102、104、106が示されている。これらは、データ・センターにおいて典型的に用いられることがある型のものである。これらのラックは、サーバー、ルーターおよびゲートウェイを含むさまざまな型のIT設備を任意の数、保持できる。例として、ラック102は二つの垂直にマウントされたパワー・ストリップ114、116を示しており、パワー・ストリップのそれぞれは8個の電力レセプタクル〔パワー・レセプタクル〕を含み、それらのパワー・ストリップに、IT設備の電源が物理的に接続される。データ・センターにおける他のラックも同様のパワー・アウトレット・ユニットをもち、それらのパター・アウトレット・ユニットは多様な配位でマウントされることができる。
FIG. 1 discloses a
この例示的なシステム100では、これらのパワー・ストリップは、米国ニュージャージー州サマセットのラリタン社によって提供されるドミニオンPXのような、電力消費データおよび他の機能性を提供できる型のものである。あるいはまた、これらのユニットは、電力分配ユニット(power distribution unit)あるいはPDUと称されることができる。これらの電力分配ユニットは、電力消費データおよびアウトレット・レベル・スイッチングへのTCP/IPアクセスを提供し、閾値超過または一回のオン/オフ電力サイクリングのようなイベントについて、SNMPおよび電子メールを介してアラートを提供できる。PDUは、ラリタン社によって提供されるドミニオンKX2およびパラゴン(Paragon)II KVMスイッチのような幅広い多様なKVMスイッチ・ソリューションと統合される。ラック104、106は同様に装備されていてもよい。PDUはしばしば高度に構成設定可能であり、これらの例示的な電力分配ユニット114、116はパワー・マネージャ(Power Manager)108と直接インターフェースをもつ。パワー・マネージャ108は、電力分配ネットワークにおける複数のIPDUを構成設定することができる要素管理システムであってもよい。パワー・マネージャはまた、IPDUによって提供されるIT利用度情報を収集することもできる。例示的なパワー・マネージャ108はアドミニストレータ112にリモート・アクセスを提供するよう装備されていてもよく、インターネット・プロトコル(Internet Protocols)を通じて電力分配ユニット114、116をアドレス指定できる。パワー・マネージャ108は、本発明の原理に基づいて適用されるヒューリスティックスのためのデータを提供するデータベース(Database)110中のデータを発見および総合するよう構成されることができる。のちに説明するように、このデータは実際の電力消費データ、IT設備仕様、CPU利用度データ、理論的な電力消費データおよびIT設備上での状態変化イベントを含む。
In the
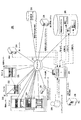
図2は、IT設備のN個のラックを含むデータ・センターをもつもう一つの例示的なシステム200を示している。IPネットワーク212を通じてアドミニストレータ208にとってアクセス可能な3個のラック220、222、224が例示目的で開示されている。ラック224はIT設備のほか知的な電力機能を有する電力分配ユニットを含む。これらの機能のうちには、出力アウトレット・レベルにおける実際の電力消費データのようなデータの収集がある。ラック220、222は同様に装備されており、データ・センターにおいて環境条件を検知するよう動作可能な環境センサー228を含む。任意的な電力データ・アグリゲーター226は、電力分配ユニットとインターフェースをもち、アウトレットからのデータを総合する(aggregate)。これらいくつかのラック220、222、224はさらに、パワー・アウトレットへの物理的な近接性を判別するために、センサーおよび回路を装備されている。ラックにマウントされたセンサーは、温度上昇によって電力散逸の量を推定するために、IPDUによってモニタリングされることができる。温度上昇の量は、サーバーによって行使される電力消費の量に直接的に相関し、よって前記相関付けにおいて使用されることができる。システム200は認証サーバー214と、アドミニストレータ〔管理者〕208とインターフェースをもつドミニオンKX KVMオーバーIP・スイッチのようなリモート・アクセス・スイッチ204とを含む。
FIG. 2 shows another
スイッチ204はさらに、IP設備のパワー・アウトレットへの物理的な接続性を判別することにおいて有用なデータを記憶し、取り出すためのデータ・ストア202と相互接続されている。このデータは、これに限られないが、停電〔電源障害〕参照シグネチャ、理論的な電力シグネチャ、実際の電力シグネチャ、実際の電力データおよび他の関連を含む。さらに電力分配マネージャ206がKVMスイッチ204とインターフェースをもつ。KVMスイッチ204は、アドミニストレータ208がリモート位置から、ラック220、222、224上に位置されたさまざまな電力分配ユニットからの電力分配ユニット・データにアクセスできるようにする。IT設備およびパワー・アウトレットに関わる物理的な位置データを記憶するために、もう一つのデータベース216がIPネットワーク212を通じてアクセス可能である。変化アラート・サーバー218も任意的に接続され、KVMスイッチ204を通じてアクセス可能である。動作では、データ・センターにおけるラックおよび電力分配ユニットからのデータはIPネットワークを通じて収集され、記憶され、管理者208に対して選択的にアクセス可能である。電力分配センターおよび報告設備は、そのデータにアクセスし、本発明に基づく方法を実行して、IT設備とパワー・アウトレットとの間の物理的な接続性を識別する。KVMスイッチ204は、関連付けられるべきサーバーに能動的に接続するために使うことができる。これがサーバーにおける利用度を上げることになるからである。管理者は、通常動作において同様の電力シグネチャを提供しうる選択されたサーバーにおける接続性発見を改善するために、このKVMアプローチを使うことができる。
The
上記のシステム100、200のそれぞれにおいて、電力分配ユニットおよびKVMスイッチおよび/または他の管理者機器またはサーバーは、のちの使用のためにデータベース内に記憶するためおよび相関ヒューリスティックスを適用するためにデータを収集するようプログラムされる。モニタリングを通じて取得されるデータは、二つの主要なカテゴリーに分類されることができる。一つは、任意の時点におけるデータの値を与える時系列情報である。第二に、ITおよび電力システムの両方に影響するタイムスタンプを与えられたイベントである。後者の例は、サーバー機械のリブートおよびサーバーのスタートアップを含む。本発明の原理に基づく相関付け方法に有用な種々のデータ属性のうちには、特定のIT設備の理論的な電力使用要求に関係するデータ、時間を通じて測定される、特定のパワー・アウトレットにおける実際の電力消費データ、時間を通じて収集される、データ・センター内のサーバーについての実際のCPU利用度データ、同定されたサーバーと同定されたパワー・アウトレットの間の物理的な距離関係がある。このデータに加えて、他の有用な特徴付けデータが取得され、データ・ストアに記憶されることができる。このデータは、データ・センターにおいて見出される特定の型のIT設備についてのデータ特性を含むことができる。たとえば、電子メール・サーバー、ウェブ・サーバー、ルーターなどはしばしば、データ・センターにおけるそれらの特定の使用に依存して、識別可能な特性をもち、それは温度、CPU利用度、オンからオフへの状態の変化、単独でまたは他のサーバー特性との組み合わせで同定されうる他の任意の特性を含む。
In each of the
相関付けエンジンは、任意のヒューリスティックスを走らせるため、およびデータ・センター全体について接続性マップを展開するために、データ・ストアにアクセスできる電力管理ユニット、汎用コンピュータまたは専用サーバーのいずれで実装することもできる。ヒューリスティックスが適用される際、特定の可能なサーバーに接続できるアウトレットの数は絞り込まれ、一般的な場合にはそのサーバーについての同定されたアウトレットに収束する。ヒューリスティックスが適用されるが可能な候補を一つの対応まで減らすことができない場合、管理者はCPU利用度グラフ、電力消費グラフなどのような特定の特性のグラフィックな表現〔レンダリング〕にアクセスして特定のサーバーが特定のアウトレットに物理的に接続されている可能性を主観的に評価してもよい。データベースおよびレンダリング・エンジンは、既知のデータ構造およびレンダリング・ソフトウェアを使って、データ・センターの物理的な接続性のトポグラフィー〔構造〕がレンダリングされることができるよう、実装されることができる。 The correlation engine can be implemented on any power management unit, general purpose computer or dedicated server that can access the data store to run arbitrary heuristics and to deploy connectivity maps across the data center. it can. When heuristics are applied, the number of outlets that can be connected to a particular possible server is narrowed down, and in the general case converges to the identified outlet for that server. If heuristics are applied but the number of possible candidates cannot be reduced to a single response, administrators can access and identify graphical representations (renderings) of specific characteristics such as CPU usage graphs, power consumption graphs, etc. The server may be subjectively assessed for the possibility of being physically connected to a particular outlet. Databases and rendering engines can be implemented so that the data center's physical connectivity topography can be rendered using known data structures and rendering software.
どの特定のヒューリスティックも任意的であり、追加的なヒューリスティック規則および指標が、サーバーとアウトレットとの間の物理的な接続性を識別するためのプロセスに追加されることができる。一つの例示的な方法では、一組のパワー・アウトレットが、特定のITアドバイスについての確からしい候補として同定される。これらの確からしい候補は以前に与えられた接続性データ、関連付けクラスタリング、物理的な位置またはデータ管理者によって入力される最良推定候補に基づくことができる。追加情報は、完全に未知のパワーおよびITエンドポイントの組(対)に決定を適用するのではなく、未知物の、可能性の高い組をマッチすることによって、収束を助ける。これらの候補に関して、IT設備を特定の一つまたは複数のアウトレットにマッピングしようとして、一組のヒューリスティック規則が適用される。ヒューリスティック・プロセスは、候補パワー・アウトレットの数がIT設備上の電源ユニットの数に一致したときに、あるいはすべてのヒューリスティックスが尽くされたときに完結する。すべてのヒューリスティックスが尽くされた場合には、管理者が、残っている候補アウトレットのデータを見ることに基づいて、主観的な選択を行ってもよい。 Any particular heuristic is optional and additional heuristic rules and indicators can be added to the process for identifying physical connectivity between the server and the outlet. In one exemplary method, a set of power outlets are identified as likely candidates for specific IT advice. These probable candidates can be based on previously given connectivity data, association clustering, physical location or best estimate candidates entered by the data manager. The additional information helps convergence by matching the likely set of unknowns rather than applying the decision to a pair of completely unknown power and IT endpoints. For these candidates, a set of heuristic rules is applied in an attempt to map the IT equipment to a particular outlet or outlets. The heuristic process is complete when the number of candidate power outlets matches the number of power supply units on the IT equipment, or when all heuristics are exhausted. If all heuristics are exhausted, the administrator may make a subjective selection based on viewing the remaining candidate outlet data.
ヒューリスティック・プロセスにおいて使用されることのできるいくつかの指標は、電力使用ネーム・プレート値(name plate values)、実際の電力消費パターン、IT設備の状態変化イベントの時間シーケンスおよびパワー・アウトレットに対するIT設備の物理的な位置を含む。よって、たとえば、所与のIT設備について20個の候補パワー・アウトレットの組を想定すると、当該IT設備からある物理的な距離以内にないために、あるサブセットが消去される。この指標は、サーバーを、そのアウトレットから指定された最大距離以内に位置特定する典型的な慣行を強化する。ネーム・プレート情報は、サーバーを、その平均電力消費レベルによってグループ化するために使用され、パターン・マッチング・アルゴリズムは、サーバーの選択されたサブセットをマッチングして、電力値が重なり合う場合にのみ電気パワー・アウトレットを決定することができる。たとえば、パワー・アウトレットがMワットの電力を送達しており、サーバーが最大ネーム・プレート電力をNワットとしてもつ場合、M≫Nであれば、問題のパワー・アウトレットとサーバーとの間の相関はない。残りの候補アウトレットのうちで、実際のCPU利用度を同定し、該パワー・アウトレットにおける実際の電力消費と相関付けるためにヒューリスティックが適用される。これは、候補アウトレットの数を同定された組にまで減らす。減らさない場合、追加的なヒューリスティックが適用されて、CPU利用度のグラフおよび電力消費のグラフに反映される実際の状態変化を決定する。ヒストグラムを用いて一日を通じたIT利用度を解析することによって、追加的なヒューリスティックスが適用されることができる。時系列データは、電力特性のコンテキスト内で相関を改善するために、周波数または空間領域における他の領域に変換されることができる。 Some indicators that can be used in the heuristic process are: power usage name plate values, actual power consumption patterns, time sequence of IT equipment state change events, and IT equipment for power outlets Including physical location. Thus, for example, assuming a set of 20 candidate power outlets for a given IT facility, a subset is eliminated because it is not within a certain physical distance from the IT facility. This indicator enhances the typical practice of locating a server within a specified maximum distance from its outlet. Name plate information is used to group servers by their average power consumption level, and the pattern matching algorithm matches a selected subset of servers, and only if the power values overlap, -The outlet can be determined. For example, if the power outlet is delivering M watts of power and the server has a maximum name plate power of N watts, then if M >> N, the correlation between the power outlet in question and the server is Absent. Among the remaining candidate outlets, heuristics are applied to identify actual CPU utilization and correlate with actual power consumption at the power outlet. This reduces the number of candidate outlets to the identified set. If not, additional heuristics are applied to determine the actual state changes reflected in the CPU utilization graph and the power consumption graph. Additional heuristics can be applied by analyzing the IT usage throughout the day using a histogram. Time series data can be transformed to other regions in the frequency or spatial domain to improve correlation within the context of power characteristics.
本発明のある側面では、特定のサーバーについての潜在的なアウトレットの第一の候補がIPアドレス指定を通じて同定される。電気分配におけるIPUの数は、その機能に基づいて種々の方法を使って発見できる。ラリタンDPXの場合、IPMI発見は、これらのユニットの存在および構成についての十分な情報を提供する。同様に、ネットワーク管理技術が、ネットワークを通じてIT利用度をモニタリングおよび測定するために使われることのできるネットワークIPアドレスを含むサーバー・システム詳細を発見するための機能を提供する。IPアドレスを使って、データがサーバーから、およびパワー・アウトレット・ユニットから収集される。データはデータ・ストアにおいて総合される。提案される発明について利用可能なデータ収集方法論はSNMP、IPMI、WMIおよびWS-MANを含む。これらすべての標準的な管理インターフェースは、本発明のために有用なリモート・モニタリング機能を提供する。データはタイムスタンプを付けられる。それにより、電力使用、CPU使用およびイベントは、異なる候補パワー・アウトレットおよび異なるIT設備の間で相関付けされることができる。 In one aspect of the invention, potential outlet first candidates for a particular server are identified through IP addressing. The number of IPUs in electricity distribution can be found using various methods based on their function. In the case of Raritan DPX, IPMI discovery provides sufficient information about the presence and configuration of these units. Similarly, network management technology provides the ability to discover server system details including network IP addresses that can be used to monitor and measure IT usage over the network. Using the IP address, data is collected from the server and from the power outlet unit. Data is aggregated in the data store. Data collection methodologies available for the proposed invention include SNMP, IPMI, WMI and WS-MAN. All these standard management interfaces provide remote monitoring functions useful for the present invention. The data is time stamped. Thereby, power usage, CPU usage and events can be correlated between different candidate power outlets and different IT equipment.
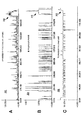
図3のA、B、Cは、本発明の原理に基づいて適用されることのできるヒューリスティックスの一つの側面を例証する三つの例示的なグラフ302、304、306を示している。図3のAのグラフ302は時間(X軸)を通じたCPU利用度(Y軸)を示す。CPU利用度データは生の量子化されていないデータであり、考えている候補IT設備におけるすべてのコアを表す。この量子化されていないデータはいくぶんノイズがあり、他のデータと相関付けするには最適ではないことがありうる。図3のBのグラフ304は、アーチファクトおよびノイズを除去するよう量子化された同じデータを示している。この例において、使用値は整数値1および2に近似的に量子化される。ただし、本発明の原理から外れることなく、他の量子化方法を用いることもできる。ここでもまた、使用データは候補IT設備についてのすべてのコアに対応する。図3のCのグラフ306は、同じ時間期間を通じた候補アウトレットの実際の電力消費を示している。時間はデータ収集の間に加えられたタイムスタンプを使って追跡される。矢印308および310によって示されるように、CPU利用度における変化を例証するイベント変化がある。同様に、消費電力グラフ306において、データは、312のところに電力スパイクを明らかにしている。このスパイク312は、量子化されていないグラフと量子化されたグラフについてのコア利用度におけるイベント308、310と相関する可能性がある。イベントのタイムスタンプ比較は、この候補IT設備を候補パワー・アウトレットと相関付けるために使用できるもう一つのデータ指標である。
3A, B, and C show three
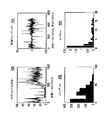
図4は、本発明の原理に基づいてヒューリスティックスにおいて候補パワー・アウトレットをIT設備に相関付けるために使用できる例示的な利用度データ・グラフ402、404および対応するヒストグラム406、408を示している。グラフ402は、一日全体にわたるあるIT設備のすべてのコアについて生の利用度データを表す。ここで、利用度の値は約0から約100までの間にはいる。この生の利用度データは、候補パワー・アウトレットと相関付けるために使用できる指標を得るためにマイニングするのは簡単ではない。利用度ヒストグラム406は利用度を、特定の選択された値の利用度の頻度に基づいて分類する。したがって、ヒストグラムは、所与の期間中、IT設備がどのくらいしばしば特定のレベルで使用されたかを描いている。
FIG. 4 shows exemplary
グラフ406は、所与のIT設備のプロセッサ・コアがどのくらいしばしば異なる利用レベルにスイッチするかの詳細を示す。この例では、グラフ404は、所与の期間にわたって生の利用度データを2分の1に間引くことによって得られる。グラフ404は現在の利用度状態からより低いまたはより高い利用度への変化を示しているので、グラフは縦軸上の0のまわりに規格化されている。ヒストグラム408は、X軸上での利用度の変化の頻度対Y軸上での使用の頻度を示す解析である。このデータは、候補パワー・アウトレットについての同様のグラフィックなヒストグラムおよびスペクトルを用意し、次いでそれらをコンピュータ実装されたパワーのマッチングを使ってまたは必要なら手作業で調べることによって、本発明の相関付け技法において使用されることができる。 Graph 406 shows details of how often the processor core of a given IT facility switches to different utilization levels. In this example, the graph 404 is obtained by decimating the raw utilization data over a given period by a factor of two. Since graph 404 shows a change from the current usage state to a lower or higher usage, the graph is normalized around 0 on the vertical axis. The histogram 408 is an analysis showing the frequency of change in usage on the X-axis versus the frequency of use on the Y-axis. This data provides the correlation technique of the present invention by providing similar graphical histograms and spectra for candidate power outlets and then examining them using computer-implemented power matching or manually if necessary. Can be used.
図5は、24時間の期間にわたって単一のドミニオンPXの電力利用度グラフを示している。データ502は、CPU利用度0(または入手不能)に対応する特定の時刻501において0に還元される、ソケットの一つの電力利用度を示している。電力リサイクルおよびシャットダウンのようなイベントが同時に存在していない場合(図5では同時に存在していない)、イベントに基づいて相関付けを達成する可能性は低い。利用可能なPDUは、該PDUにおける個々のソケットについての現在イベント・ログ記録機能を装備されていない。本発明の原理に基づくPDUはそのようなログ記録を、サーバーとPDUソケットとの間のイベントを相関付ける目的のために拡張する。電力リサイクルの順序が支配するので、サーバーとPDUの間の関連付けをするために要求される遅延が達成可能である。
FIG. 5 shows a power utilization graph of a single Dominion PX over a 24 hour period.
図6は、3時間の期間についてCPUおよび電力利用度の例を示している。データ601は3時間の期間にわたるCPU利用度を表す。この例示的な実施形態では、特定のサーバー内のすべてのプロセッサ・コアの和は、このプロセッサ内の四つすべてのコアを含む。よって、電力の割合として利用度を表すために、合計値需要を4で割る。データ602は、あるPDUによってログ記録される同じ期間にわたるサーバーについての電力利用度を表す。データ601および602によって見て取れるように、CPU利用度および電力は時間とともに着実に増加する。データ602によって見て取れるように、サーバーはデータ601によって示される27.90の平均CPU利用度について平均178ワットを消費する。
FIG. 6 shows an example of CPU and power utilization for a period of 3 hours.
図7は、CPU利用度の例および処理されたデータの対応するヒストグラムを示しており、サーバーの低い利用度を強調している。データ701はサーバー活動および所与の時間期間にわたってそのサーバーがどのくらいアクティブであるかを示す。本発明の原理によれば、データ701から見て取れるように、サーバー利用度またはPDUからの時系列情報の変換は、データ値に基づいて相関付けするときに有用であることができる。データ702は、時系列データ701を利用度コンテキストに変換するための、ヒストグラムに基づくアプローチの例である。ヒストグラム・データ702は、本発明の原理に基づくPDU利用度のヒストグラムと相関付けされてもよい。
FIG. 7 shows an example of CPU utilization and a corresponding histogram of processed data, highlighting the low utilization of the server.
図8は、単一のアウトレットの例示的なPDU利用度および対応するヒストグラム・ビューを示す。データ801は、所与の時間期間にわたって所与のパワー・アウトレットのワット単位での電力を表す。示されるように、アウトレットにおける平均電力は137.27ワットである。ソケット・レベルにおけるPDU利用のヒストグラム変換によって表されるデータ802は、ソケット・レベルにおける電力活動の大半が同じ所与の期間にわたる平均消費電力に対応することを示している。
FIG. 8 shows an exemplary PDU utilization and corresponding histogram view for a single outlet.
図9は、本発明のある実施形態に基づく、ヒューリスティックな自動関連付けフレームワークの例示的な流れ図900を示している。いったん開始されると、ステップ901はシステムの環境コンポーネントを取得する。具体的には、ステップ901において、自動関連付けフレームワークはシステム内のサーバーおよびPDUに関する構成設定情報を収集し、ステップ902において記憶のためにその構成設定情報をダウンロードする。ステップ903はすべての構成設定情報が収集されたかどうかを判定する。集めるべき追加的な構成設定情報があれば、プロセスが完了するまでステップ901および902が繰り返される。ステップ904の間に、同定されたサーバーおよびPDUからの利用度測定値が収集され、ステップ906においてデータベースに記憶される。ステップ904および906は、ステップ905においてユーザーによって打ち切られるまで繰り返される。
FIG. 9 shows an
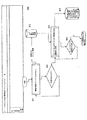
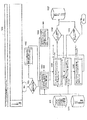
図10は、本発明の原理に基づく、ヒューリスティックな自動関連付けアルゴリズムの例示的な流れ図1000を示している。ステップ1001において、システムはサーバー・アセット情報が解析のために利用可能かどうかを判定する。該情報が利用可能であれば、ステップ1002においてデータは、サーバー最大および平均電力情報に基づいて、フィルタリングされる。ステップ1002からのフィルタリングされた情報および図9のステップ906において記憶された利用度データはステップ1003での解析のために渡される。ステップ1003の間に、サーバーおよびPDUからの利用度データからの導出されたメトリック(すなわち、和、ヒストグラム、最大および最小)が計算される。同様に、ステップ1004において、さまざまなPDUおよびサーバー上での特定のイベントのタイミングを検出し、それらを相対的な発生に基づいてグループ分けするために、イベント解析が実行される。これは、データベース1011によって供給されステップ1004に入力される、さまざまなサーバー製造業者からのサーバー・アセット情報に基づいていてもよい。ステップ1003および1004からの解析されたデータは、ステップ1005で第一レベルのヒューリスティックスを通じて渡される。ステップ1005の間、サーバーおよびPDUは、該データおよび/またはイベント・マッチングに基づいてペアにグループ分けされる。ステップ1006の間、ステップ1005からのペアリングがサーバーとPDUとの間の正しい関連付けであるかどうかが判定される。正しいと判定される場合、ステップ1007で、その情報はサーバーおよびPDU関連付けデータベースに渡され、記憶される。ステップ1005のサーバーPDU関連付けがステップ1006によって決定されたと判定されない場合には、プロセスはステップ1008に進んで、第二レベルのメトリック(すなわち、詳細ウェーブレット、プロセッサ特性、量子化など)を用いてサーバーPDUペアをさらに分類する。ステップ1009はより高いレベルのヒューリスティックスを実行し、第二のメトリックおよび分類に基づいてサーバーおよびPDUデバイスをグループ分けしようとする。ステップ1006において関連付けが正しいと判定された場合には、サーバーPDU関連付け情報がステップ1007でデータベースに記憶される。ひとたびステップ1012を介してすべてのサーバーがすべてのPDUと関連付けされたと判定されると、アルゴリズムは終了する。
FIG. 10 illustrates an
本発明のこれらおよびその他の側面は、既存の電力管理トポロジーにおいて実装されることができる。CPU利用度、実際の電力利用度、ネーム・プレート仕様および他のデータを総合するためのデータ取得機能が現在知られており、使用されている。アセットに関係するデータはベンダー・リストから取得されることができ、あるいは企業アセット管理ツールからインポートされることができる。テーブルまたは階層的データ構造を含むデータを総合するために基本データ・スキームが使用されてもよい。ヒューリスティック・プロセスは汎用コンピュータ上で実装されることも、あるいは既存の電力管理ユニット内に実装された別個の機能であることもできる。グラフおよび/またはインターフェースをレンダリングするためのフロントエンド・インターフェース機能をもつレンダリング・エンジンも当技術分野内で知られている。 These and other aspects of the invention can be implemented in existing power management topologies. Data acquisition functions are currently known and used to synthesize CPU utilization, actual power utilization, name plate specifications and other data. Data related to assets can be obtained from a vendor list or imported from a corporate asset management tool. A basic data scheme may be used to aggregate data that includes tables or hierarchical data structures. The heuristic process can be implemented on a general purpose computer or can be a separate function implemented within an existing power management unit. Rendering engines with front-end interface capabilities for rendering graphs and / or interfaces are also known in the art.
Claims (10)
前記パワー・サプライ・アウトレットのうち少なくとも一つに接続された前記サーバーのうちの少なくとも一つについて候補パワー・サプライ・アウトレットの第一の集合を決定手段によって決定する段階と;
ある時間期間にわたる前記候補パワー・サプライ・アウトレットについての実際の電力消費データおよび前記時間期間に重なる時間期間の間の前記少なくとも一つのサーバーについての中央処理ユニット(CPU: central processing unit)利用度データを収集手段によって収集する段階と;
候補パワー・サプライ・アウトレットの前記第一の集合から、前記少なくとも一つのサーバーに接続されている可能性のある候補パワー・サプライ・アウトレットの第二の部分集合を決定する段階であって、前記段階は、前記少なくとも一つのサーバーについてのCPU利用度データと、前記第二の部分集合の候補パワー・サプライ・アウトレットについての実際の電力消費データとの間の相関に基づいて相関付け手段によって行われる、段階とを含む、
方法。 A method for determining candidate power supply outlets connected to servers in a data center having multiple servers that receive power through multiple power supply outlets :
Determining by determining means a first set of candidate power supply outlet to at least one marked with one of the at least one connected to said server of said power supply outlet;
The candidate power-supply outlets actual of said at least one central processing unit for the server during the power consumption data and the time period overlapping the period of time for over a period of time: the (CPU central processing unit) utilization data Collecting by means of collecting;
Determining, from the first set of candidate power supply outlets, a second subset of candidate power supply outlets that may be connected to the at least one server comprising: Is performed by a correlating means based on a correlation between CPU utilization data for the at least one server and actual power consumption data for candidate power supply outlets of the second subset , Including stages,
Method.
前記少なくとも一つのサーバーから指定された距離以内に位置される候補パワー・サプライ・アウトレットを決定するサブステップを含む、
請求項1記載の方法。 Determining a first set of candidate power supply outlets ;
Determining a candidate power supply outlet located within a specified distance from the at least one server;
The method of claim 1.
前記候補パワー・サプライ・アウトレットの第二の部分集合を決定する段階が、前記第二の部分集合の候補パワー・サプライ・アウトレットについての実際の電力消費データと前記少なくとも一つのサーバーについての理論的な電力消費データとの間の相関にも基づき、
前記候補パワー・サプライ・アウトレットの第一の集合を決定する段階が、前記少なくとも一つのサーバーからある距離以内に位置される候補パワー・サプライ・アウトレットを決定するサブステップを含み、
前記収集する段階が:
前記少なくとも一つのサーバーについてIPアドレスを指定するサブステップと、
前記電力消費データおよび前記CPU利用度データにタイムスタンプを付けるサブステップとを含み、
前記候補パワー・サプライ・アウトレットの第二の部分集合を決定する段階が、
前記CPU利用度データを量子化するサブステップと、
前記の量子化されたCPU利用度データと前記電力消費データの間の状態変化の相関に基づいて候補パワー・サプライ・アウトレットの第二の部分集合を決定するサブステップとを含む、
方法。 The method of claim 1, comprising:
Determining a second subset of the candidate power supply outlets includes actual power consumption data for the candidate power supply outlets of the second subset and a theoretical for the at least one server. Based on the correlation with power consumption data,
Determining the first set of candidate power supply outlets includes substeps of determining candidate power supply outlets located within a distance from the at least one server;
The collecting step includes :
Substep of specifying an IP address for the at least one server ;
Sub-stamping the power consumption data and the CPU utilization data ,
Determining a second subset of said candidate power supply outlets ;
A sub-step of quantizing the CPU utilization data ;
Determining a second subset of candidate power supply outlets based on a correlation of state changes between the quantized CPU utilization data and the power consumption data;
Method.
パワー・サプライ・アウトレットおよびIT設備とインターフェースをもち、パワー・サプライ・アウトレットについての実際の電力消費データおよびIT設備からのCPU利用度データを収集するよう動作可能なデータ収集モジュールと;
前記データ収集モジュールによって収集された情報を記憶するデータ・ストアと;
一対一でパワー・サプライ・アウトレットに接続されたIT設備を同定するよう前記CPU利用度データと前記実際の電力消費データとの相関を調べるよう機能できる相関付けエンジンとを有する、
システム。 A system that automatically discovers connectivity to server power supply outlets in a data center:
It has the power-supply outlets and IT equipment and interface, and operable data collection module to collect CPU utilization data from actual power consumption data and IT equipment for power supply outlet;
A data store for storing information collected by the data collection module;
A correlation engine operable to examine the correlation between the CPU utilization data and the actual power consumption data to identify IT equipment connected to the power supply outlet on a one-to-one basis;
system.
データベース中の前記データ設備についてのCPU使用データを総合する段階と;
候補パワー・サプライ・アウトレットおよびIT設備の接続性ペアを決定する段階であって、各候補サーバーから各候補パワー・サプライ・アウトレットへの最大距離を決定するサブステップを含む段階と;
候補ITサーバーについてのCPU使用と、候補パワー・サプライ・アウトレットの実際の電力使用との相関を調べる段階であって、前記IT設備についての状態変化を同定するサブステップを含む、段階と;
前記状態変化を前記実際の前記実際の電力使用プロファイルにマッチングする段階とを含む、
方法。 How to monitor IT equipment racks:
Synthesizing CPU usage data for the data facility in the database;
Comprising the steps of determining connectivity pair candidate power-supply outlets and IT equipment, the method comprising the sub-steps of determining the maximum distance from each candidate server to each candidate power supply outlet;
Examining a correlation between CPU usage for a candidate IT server and actual power usage of a candidate power supply outlet , comprising substeps of identifying state changes for the IT equipment;
And a step of matching the status change to the actual the actual power usage profile,
Method.
Applications Claiming Priority (3)
| Application Number | Priority Date | Filing Date | Title |
|---|---|---|---|
| US12/168,504 | 2008-07-07 | ||
| US12/168,504 US8886985B2 (en) | 2008-07-07 | 2008-07-07 | Automatic discovery of physical connectivity between power outlets and IT equipment |
| PCT/US2008/069422 WO2010005429A1 (en) | 2008-07-07 | 2008-07-08 | Automatic discovery of physical connectivity between power outlets and it equipment |
Publications (2)
| Publication Number | Publication Date |
|---|---|
| JP2011527480A JP2011527480A (en) | 2011-10-27 |
| JP5284469B2 true JP5284469B2 (en) | 2013-09-11 |
Family
ID=41465273
Family Applications (1)
| Application Number | Title | Priority Date | Filing Date |
|---|---|---|---|
| JP2011517390A Active JP5284469B2 (en) | 2008-07-07 | 2008-07-08 | Automatic discovery of physical connectivity between power outlets and IT equipment |
Country Status (7)
| Country | Link |
|---|---|
| US (1) | US8886985B2 (en) |
| EP (1) | EP2311145B1 (en) |
| JP (1) | JP5284469B2 (en) |
| CN (1) | CN102165644B (en) |
| AU (1) | AU2008359227B2 (en) |
| CA (1) | CA2730165C (en) |
| WO (1) | WO2010005429A1 (en) |
Families Citing this family (79)
| Publication number | Priority date | Publication date | Assignee | Title |
|---|---|---|---|---|
| US8782654B2 (en) | 2004-03-13 | 2014-07-15 | Adaptive Computing Enterprises, Inc. | Co-allocating a reservation spanning different compute resources types |
| EP1754147A4 (en) | 2004-03-13 | 2008-08-13 | Cluster Resources Inc | System and method of providing a self-optimizing reservation in space of compute resources |
| US20070266388A1 (en) | 2004-06-18 | 2007-11-15 | Cluster Resources, Inc. | System and method for providing advanced reservations in a compute environment |
| US8176490B1 (en) | 2004-08-20 | 2012-05-08 | Adaptive Computing Enterprises, Inc. | System and method of interfacing a workload manager and scheduler with an identity manager |
| CA2586763C (en) | 2004-11-08 | 2013-12-17 | Cluster Resources, Inc. | System and method of providing system jobs within a compute environment |
| US8863143B2 (en) | 2006-03-16 | 2014-10-14 | Adaptive Computing Enterprises, Inc. | System and method for managing a hybrid compute environment |
| US8930536B2 (en) | 2005-03-16 | 2015-01-06 | Adaptive Computing Enterprises, Inc. | Virtual private cluster |
| US9231886B2 (en) | 2005-03-16 | 2016-01-05 | Adaptive Computing Enterprises, Inc. | Simple integration of an on-demand compute environment |
| US8065206B2 (en) * | 2005-03-23 | 2011-11-22 | Hewlett-Packard Development Company, L.P. | Byte-based method, process and algorithm for service-oriented and utility infrastructure usage measurement, metering, and pricing |
| EP1872249B1 (en) | 2005-04-07 | 2016-12-07 | Adaptive Computing Enterprises, Inc. | On-demand access to compute resources |
| US8041773B2 (en) | 2007-09-24 | 2011-10-18 | The Research Foundation Of State University Of New York | Automatic clustering for self-organizing grids |
| JP2009205633A (en) * | 2008-02-29 | 2009-09-10 | Nec Infrontia Corp | Information processing system, and information processing method |
| US8090480B2 (en) * | 2009-01-07 | 2012-01-03 | International Business Machines Corporation | Consumer electronic usage monitoring and management |
| WO2010114531A1 (en) * | 2009-03-31 | 2010-10-07 | Hewlett-Packard Development Company, L.P. | Determining power topology of a plurality of computer systems |
| US20110103391A1 (en) | 2009-10-30 | 2011-05-05 | Smooth-Stone, Inc. C/O Barry Evans | System and method for high-performance, low-power data center interconnect fabric |
| US20140359323A1 (en) * | 2009-09-24 | 2014-12-04 | Smooth-Stone, Inc. C/O Barry Evans | System and method for closed loop physical resource control in large, multiple-processor installations |
| US9077654B2 (en) | 2009-10-30 | 2015-07-07 | Iii Holdings 2, Llc | System and method for data center security enhancements leveraging managed server SOCs |
| US9876735B2 (en) | 2009-10-30 | 2018-01-23 | Iii Holdings 2, Llc | Performance and power optimized computer system architectures and methods leveraging power optimized tree fabric interconnect |
| US9465771B2 (en) | 2009-09-24 | 2016-10-11 | Iii Holdings 2, Llc | Server on a chip and node cards comprising one or more of same |
| US9054990B2 (en) | 2009-10-30 | 2015-06-09 | Iii Holdings 2, Llc | System and method for data center security enhancements leveraging server SOCs or server fabrics |
| US8599863B2 (en) | 2009-10-30 | 2013-12-03 | Calxeda, Inc. | System and method for using a multi-protocol fabric module across a distributed server interconnect fabric |
| US20130107444A1 (en) | 2011-10-28 | 2013-05-02 | Calxeda, Inc. | System and method for flexible storage and networking provisioning in large scalable processor installations |
| US8138626B2 (en) * | 2009-10-25 | 2012-03-20 | Greenwave Reality, Pte Ltd. | Power node for energy management |
| US8013545B2 (en) * | 2009-10-25 | 2011-09-06 | Greenwave Reality, Pte, Ltd. | Modular networked light bulb |
| US9648102B1 (en) | 2012-12-27 | 2017-05-09 | Iii Holdings 2, Llc | Memcached server functionality in a cluster of data processing nodes |
| US9680770B2 (en) | 2009-10-30 | 2017-06-13 | Iii Holdings 2, Llc | System and method for using a multi-protocol fabric module across a distributed server interconnect fabric |
| US10877695B2 (en) | 2009-10-30 | 2020-12-29 | Iii Holdings 2, Llc | Memcached server functionality in a cluster of data processing nodes |
| US11720290B2 (en) | 2009-10-30 | 2023-08-08 | Iii Holdings 2, Llc | Memcached server functionality in a cluster of data processing nodes |
| US9311269B2 (en) | 2009-10-30 | 2016-04-12 | Iii Holdings 2, Llc | Network proxy for high-performance, low-power data center interconnect fabric |
| CN101834755A (en) * | 2010-03-26 | 2010-09-15 | 深圳市共济科技有限公司 | Intelligent power distribution system |
| FR2958475B1 (en) * | 2010-03-30 | 2012-09-28 | Sophia Conseil | CONTROL SYSTEM. |
| US9002668B2 (en) * | 2010-04-28 | 2015-04-07 | International Business Machines Corporation | Discovering an equipment power connection relationship |
| US8335936B2 (en) | 2010-05-10 | 2012-12-18 | Greenwave Reality, Pte Ltd. | Power node with network switch |
| US8805998B2 (en) * | 2010-06-11 | 2014-08-12 | Eaton Corporation | Automatic matching of sources to loads |
| US10205319B2 (en) | 2010-06-11 | 2019-02-12 | Eaton Intelligent Power Limited | Automatic matching of sources to loads |
| EP2625615A2 (en) * | 2010-07-09 | 2013-08-14 | Stratergia Ltd. | Systems and methods for power consumption profiling and auditing |
| EP2609508B1 (en) | 2010-08-26 | 2016-03-02 | Tata Consultancy Services Limited | Generation of energy consumption profiles |
| US8811377B1 (en) | 2010-08-30 | 2014-08-19 | Synapsense Corporation | Apparatus and method for instrumenting devices to measure power usage using a multi-tier wireless network |
| US8600575B2 (en) * | 2010-09-24 | 2013-12-03 | Synapsense Corporation | Apparatus and method for collecting and distributing power usage data from rack power distribution units (RPDUs) using a wireless sensor network |
| US8738195B2 (en) * | 2010-09-21 | 2014-05-27 | Intel Corporation | Inferencing energy usage from voltage droop |
| WO2012047746A2 (en) | 2010-10-04 | 2012-04-12 | Avocent | System and method for monitoring and managing data center resources in real time |
| EP2625614B1 (en) * | 2010-10-04 | 2019-04-17 | Avocent Huntsville, LLC | System and method for monitoring and managing data center resources in real time incorporating manageability subsystem |
| KR101729019B1 (en) * | 2010-10-12 | 2017-04-21 | 삼성전자주식회사 | Power management apparatus, power management system having power management apparatus and method for controlling the same |
| WO2012064182A1 (en) * | 2010-11-08 | 2012-05-18 | Uptime Products B.V. | A data center, a method for collecting power consumption information in a data center, and a computer program product |
| WO2012075059A2 (en) * | 2010-12-02 | 2012-06-07 | Tenrehte Technologies, Inc. | Appliance network connectivity apparatus |
| US8606372B1 (en) * | 2011-01-26 | 2013-12-10 | Williams Pyro, Inc. | System and method of discovering and prioritizing loads in an isolated power grid with dynamic distributed control |
| US8447434B1 (en) * | 2011-01-26 | 2013-05-21 | Williams-Pyro, Inc. | System and method of dynamic and distributed control with topology discovery in an isolated power grid |
| WO2012130509A1 (en) * | 2011-03-31 | 2012-10-04 | Nec Europe Ltd. | A method for detecting an association between an electrical device and a power meter, a power supply system and a monitoring system |
| US20130073232A1 (en) * | 2011-09-15 | 2013-03-21 | Electronic Systems Protection, Inc. | Source Power Anomaly and Load Power Consumption Monitoring and Analysis |
| US9092594B2 (en) | 2011-10-31 | 2015-07-28 | Iii Holdings 2, Llc | Node card management in a modular and large scalable server system |
| US9703342B2 (en) * | 2012-02-10 | 2017-07-11 | Server Technology, Inc. | System and method for configuring plurality of linked power distribution units in which configuration data of the linked power distribution units are accessible by the remote system |
| KR101913861B1 (en) * | 2012-02-24 | 2018-12-28 | 한양대학교 에리카산학협력단 | Method and apparatus for managing data center based on ontology |
| US10095659B2 (en) | 2012-08-03 | 2018-10-09 | Fluke Corporation | Handheld devices, systems, and methods for measuring parameters |
| DE102012017966A1 (en) | 2012-09-12 | 2014-03-13 | Big Dutchman International Gmbh | Method and system for monitoring and / or controlling the resource consumption of an agricultural facility |
| US10088389B2 (en) | 2013-03-15 | 2018-10-02 | Fluke Corporation | Automatic recording and graphing of measurement data |
| US9164805B2 (en) * | 2013-11-14 | 2015-10-20 | Lenovo Enterprise Solutions (Singapore) Pte. Ltd. | Managing workload distribution to reduce acoustic levels |
| WO2015094324A1 (en) * | 2013-12-20 | 2015-06-25 | Schneider Electric USA, Inc. | Ultrasonic based load center current measurement system |
| US9766270B2 (en) | 2013-12-30 | 2017-09-19 | Fluke Corporation | Wireless test measurement |
| US9430318B2 (en) | 2014-01-27 | 2016-08-30 | Microsoft Technology Licensing, Llc | Health monitoring and recovery for infrastructure devices |
| WO2016022187A2 (en) * | 2014-05-12 | 2016-02-11 | Chirp Microsystems | Time of flight range finding with an adaptive transmit pulse and adaptive receiver processing |
| CN104503331B (en) * | 2014-12-19 | 2017-11-03 | 上海斐讯数据通信技术有限公司 | The control method and system of smart jack |
| TWI521826B (en) * | 2015-02-04 | 2016-02-11 | 碩天科技股份有限公司 | Power apparatus with outlet identification capability and outlet identification method of power apparatus |
| US9887882B2 (en) | 2015-06-12 | 2018-02-06 | At&T Intellectual Property I, L.P. | Referent system for devices of an NFV network |
| US9489027B1 (en) * | 2015-08-31 | 2016-11-08 | Wave Resource Strategies, Inc. | System and method for the accurate recordation of power consumption in a computing device utilizing power profiles |
| US10393793B1 (en) * | 2015-11-12 | 2019-08-27 | Amazon Technologies, Inc. | Detecting power disturbances based on networked power meters |
| AU2017207319B2 (en) * | 2016-01-11 | 2018-05-24 | Equinix, Inc. | Architecture for data center infrastructure monitoring |
| CA2964343C (en) * | 2016-04-14 | 2022-10-11 | High Sec Labs Ltd. | Kvm having blue screen of death detection and warning functions |
| US20180052574A1 (en) * | 2016-08-22 | 2018-02-22 | United States Of America As Represented By Secretary Of The Navy | Energy Efficiency and Energy Security Optimization Dashboard for Computing Systems |
| US10545219B2 (en) | 2016-11-23 | 2020-01-28 | Chirp Microsystems | Three dimensional object-localization and tracking using ultrasonic pulses |
| AU2018280266B2 (en) | 2017-06-09 | 2020-09-10 | Equinix, Inc. | Near real-time messaging service for data center infrastructure monitoring data |
| US10819556B1 (en) | 2017-10-16 | 2020-10-27 | Equinix, Inc. | Data center agent for data center infrastructure monitoring data access and translation |
| US11216047B2 (en) | 2018-10-11 | 2022-01-04 | Vertiv It Systems, Inc. | System and method for detecting relationship between intelligent power strip and device connected thereto |
| US11474582B2 (en) * | 2020-02-14 | 2022-10-18 | International Business Machines Corporation | Automated validation of power topology via power state transitioning |
| CN111931147A (en) * | 2020-07-28 | 2020-11-13 | 深圳Tcl数字技术有限公司 | Socket control method, socket and computer readable storage medium |
| EP4479804A1 (en) * | 2022-02-18 | 2024-12-25 | Eaton Intelligent Power Limited | Determining an electrical wiring connection configuration of an electrical power system |
| LU501560B1 (en) | 2022-02-28 | 2023-08-28 | Phoenix Contact Gmbh & Co | Technology for determining power connection |
| DE102022104691A1 (en) | 2022-02-28 | 2023-08-31 | Phoenix Contact Gmbh & Co. Kg | Technique for detecting a power circuit |
| CN119948715A (en) * | 2022-09-28 | 2025-05-06 | 伊顿智能动力有限公司 | Monitor the electrical wiring connection configuration of the power system |
| US12560988B2 (en) * | 2023-11-27 | 2026-02-24 | Extreme Networks, Inc. | Apparatus and method for discovering power connections using power patterns |
Family Cites Families (86)
| Publication number | Priority date | Publication date | Assignee | Title |
|---|---|---|---|---|
| US4321582A (en) * | 1980-03-11 | 1982-03-23 | Banghart Thomas S | Data retrieval system and method |
| US4543649A (en) * | 1983-10-17 | 1985-09-24 | Teknar, Inc. | System for ultrasonically detecting the relative position of a moveable device |
| US4955821A (en) * | 1989-07-10 | 1990-09-11 | Litton Systems, Inc. | Method for controlling connector insertion or extraction sequence on power distribution panel |
| US5396635A (en) * | 1990-06-01 | 1995-03-07 | Vadem Corporation | Power conservation apparatus having multiple power reduction levels dependent upon the activity of the computer system |
| JPH05250188A (en) | 1992-03-05 | 1993-09-28 | Hitachi Ltd | Process priority control method |
| JPH06221649A (en) | 1993-01-28 | 1994-08-12 | Mitsubishi Electric Corp | Air conditioner |
| AU4519596A (en) * | 1994-12-22 | 1996-07-10 | Intel Corporation | Power budgeting with device specific characterization of power consumption |
| US5515853A (en) * | 1995-03-28 | 1996-05-14 | Sonometrics Corporation | Three-dimensional digital ultrasound tracking system |
| US5719800A (en) * | 1995-06-30 | 1998-02-17 | Intel Corporation | Performance throttling to reduce IC power consumption |
| JPH0996672A (en) | 1995-09-29 | 1997-04-08 | Sukuuea:Kk | Method and system for generating three-dimensional positional data |
| US6229899B1 (en) * | 1996-07-17 | 2001-05-08 | American Technology Corporation | Method and device for developing a virtual speaker distant from the sound source |
| US7171461B2 (en) * | 1996-07-23 | 2007-01-30 | Server Technology, Inc. | Network remote power management outlet strip |
| US7216043B2 (en) * | 1997-02-12 | 2007-05-08 | Power Measurement Ltd. | Push communications architecture for intelligent electronic devices |
| US6167330A (en) * | 1998-05-08 | 2000-12-26 | The United States Of America As Represented By The Secretary Of The Air Force | Dynamic power management of systems |
| JP3780130B2 (en) * | 1998-11-16 | 2006-05-31 | キヤノン株式会社 | Power consumption management device |
| WO2001001366A2 (en) * | 1999-06-25 | 2001-01-04 | Telemonitor, Inc. | Smart remote monitoring system and method |
| US6499102B1 (en) * | 1999-12-29 | 2002-12-24 | Intel Corporation | Method of dynamically changing the lowest sleeping state in ACPI |
| US6413104B1 (en) * | 2000-01-28 | 2002-07-02 | Northrop Grumman Corporation | Power distribution panel with sequence control and enhanced lockout capability |
| JP2001337157A (en) | 2000-05-26 | 2001-12-07 | Toyo System Kk | Local positioning system using ultrasonic wave |
| US7032119B2 (en) * | 2000-09-27 | 2006-04-18 | Amphus, Inc. | Dynamic power and workload management for multi-server system |
| US20070245165A1 (en) * | 2000-09-27 | 2007-10-18 | Amphus, Inc. | System and method for activity or event based dynamic energy conserving server reconfiguration |
| FI111489B (en) * | 2000-12-22 | 2003-07-31 | Iws Int Oy | With intelligent output voltage, intelligent power distribution system works |
| DE60209051T2 (en) * | 2001-04-20 | 2006-10-26 | Lg Electronics Inc. | Location determination of a mobile communication terminal based on a combination of measurements of signals exchanged between the mobile communication terminal and base stations |
| US6567769B2 (en) * | 2001-04-24 | 2003-05-20 | Digipower Manufacturing Inc. | Unattendant data center environment protection, control, and management system |
| US7299021B2 (en) * | 2001-12-28 | 2007-11-20 | Nokia Corporation | Method and apparatus for scaling the dynamic range of a receiver for continuously optimizing performance versus power consumption |
| US6721672B2 (en) * | 2002-01-02 | 2004-04-13 | American Power Conversion | Method and apparatus for preventing overloads of power distribution networks |
| EP1488333B1 (en) * | 2002-03-01 | 2010-10-06 | Enterasys Networks, Inc. | Location aware data network |
| JP2003288236A (en) | 2002-03-27 | 2003-10-10 | Nec Software Kyushu Ltd | Management system for large scale integration server |
| US20030193777A1 (en) * | 2002-04-16 | 2003-10-16 | Friedrich Richard J. | Data center energy management system |
| US6996728B2 (en) * | 2002-04-26 | 2006-02-07 | Hewlett-Packard Development Company, L.P. | Managing power consumption based on utilization statistics |
| US6986069B2 (en) * | 2002-07-01 | 2006-01-10 | Newisys, Inc. | Methods and apparatus for static and dynamic power management of computer systems |
| US6697300B1 (en) * | 2002-09-13 | 2004-02-24 | General Dynamics Advanced Information Systems, Inc. | Method and apparatus for determining the positioning of volumetric sensor array lines |
| US20040064745A1 (en) * | 2002-09-26 | 2004-04-01 | Sudarshan Kadambi | Method and apparatus for controlling the rate at which instructions are executed by a microprocessor system |
| NO329096B1 (en) * | 2002-12-04 | 2010-08-23 | Sonitor Technologies As | Ultrasonic tracking and location system |
| US7210048B2 (en) * | 2003-02-14 | 2007-04-24 | Intel Corporation | Enterprise power and thermal management |
| EP1489719A3 (en) * | 2003-06-20 | 2007-05-02 | Matsushita Electric Industrial Co., Ltd. | Energy management system, energy management method, and unit for providing information on energy-saving recommended equipment |
| US20040267897A1 (en) * | 2003-06-24 | 2004-12-30 | Sychron Inc. | Distributed System Providing Scalable Methodology for Real-Time Control of Server Pools and Data Centers |
| JP2005069892A (en) | 2003-08-25 | 2005-03-17 | Toyota Motor Corp | Self-position calculation system for moving objects |
| US6985697B2 (en) * | 2003-09-22 | 2006-01-10 | Nokia, Inc. | Method and system for wirelessly managing the operation of a network appliance over a limited distance |
| EP1678587A4 (en) * | 2003-10-24 | 2009-10-28 | Square D Co | INTELLIGENT ENERGY MANAGEMENT CONTROL SYSTEM |
| US7134029B2 (en) * | 2003-11-06 | 2006-11-07 | International Business Machines Corporation | Computer-component power-consumption monitoring and control |
| WO2005048415A1 (en) * | 2003-11-07 | 2005-05-26 | Powersmart Llc | Automatic sensing power systems and methods |
| JP2005198364A (en) | 2003-12-26 | 2005-07-21 | Canon Sales Co Inc | Power supply controller, power supply control method, program for control of power supply, and power supply control system |
| US7177728B2 (en) * | 2003-12-30 | 2007-02-13 | Jay Warren Gardner | System and methods for maintaining power usage within a set allocation |
| JP2005323438A (en) | 2004-05-07 | 2005-11-17 | Inter Db:Kk | Power control system |
| US7418608B2 (en) * | 2004-06-17 | 2008-08-26 | Intel Corporation | Method and an apparatus for managing power consumption of a server |
| US7281146B2 (en) * | 2004-06-30 | 2007-10-09 | Intel Corporation | Dynamic power requirement budget manager |
| JP2006025474A (en) | 2004-07-06 | 2006-01-26 | Chugoku Electric Power Co Inc:The | Method for managing power supply to electric apparatus and power management network system |
| US8000074B2 (en) * | 2004-10-05 | 2011-08-16 | 2D2C, Inc. | Electrical power distribution system |
| JP4446854B2 (en) * | 2004-10-12 | 2010-04-07 | 九州電力株式会社 | Power strip |
| US8108929B2 (en) * | 2004-10-19 | 2012-01-31 | Reflex Systems, LLC | Method and system for detecting intrusive anomalous use of a software system using multiple detection algorithms |
| US7333000B2 (en) * | 2004-11-12 | 2008-02-19 | Afco Systems Development, Inc. | Tracking system and method for electrically powered equipment |
| US20060112286A1 (en) * | 2004-11-23 | 2006-05-25 | Whalley Ian N | Method for dynamically reprovisioning applications and other server resources in a computer center in response to power and heat dissipation requirements |
| US20060168975A1 (en) * | 2005-01-28 | 2006-08-03 | Hewlett-Packard Development Company, L.P. | Thermal and power management apparatus |
| US9182480B2 (en) * | 2005-01-28 | 2015-11-10 | Hewlett-Packard Development Company, L.P. | Information technology (IT) equipment positioning system |
| US20060184937A1 (en) | 2005-02-11 | 2006-08-17 | Timothy Abels | System and method for centralized software management in virtual machines |
| US20060184936A1 (en) * | 2005-02-11 | 2006-08-17 | Timothy Abels | System and method using virtual machines for decoupling software from management and control systems |
| US20060184935A1 (en) * | 2005-02-11 | 2006-08-17 | Timothy Abels | System and method using virtual machines for decoupling software from users and services |
| FR2882596B1 (en) * | 2005-02-25 | 2009-07-10 | Eads Ccr Groupement D Interet | LOCATION OF A NON-DESTRUCTIVE CONTROL PROBE |
| DK1877950T3 (en) | 2005-05-02 | 2019-02-25 | Schneider Electric It Corp | Methods and systems for control of plant power and cooling |
| US7881910B2 (en) * | 2005-05-02 | 2011-02-01 | American Power Conversion Corporation | Methods and systems for managing facility power and cooling |
| US7885795B2 (en) * | 2005-05-02 | 2011-02-08 | American Power Conversion Corporation | Methods and systems for managing facility power and cooling |
| US7895012B2 (en) * | 2005-05-03 | 2011-02-22 | Hewlett-Packard Development Company, L.P. | Systems and methods for organizing and storing data |
| US7644148B2 (en) * | 2005-05-16 | 2010-01-05 | Hewlett-Packard Development Company, L.P. | Historical data based workload allocation |
| US7444526B2 (en) * | 2005-06-16 | 2008-10-28 | International Business Machines Corporation | Performance conserving method for reducing power consumption in a server system |
| US7613807B2 (en) * | 2005-07-04 | 2009-11-03 | Hewlett-Packard Development Company, L.P. | System, method, and apparatus for discovering a new server connected within an automated data center |
| US7869965B2 (en) | 2005-08-17 | 2011-01-11 | Oracle America, Inc. | Inferential power monitor without voltage/current transducers |
| US7562234B2 (en) * | 2005-08-25 | 2009-07-14 | Apple Inc. | Methods and apparatuses for dynamic power control |
| US8374730B2 (en) | 2005-08-25 | 2013-02-12 | Apple Inc. | Methods and apparatuses for dynamic thermal control |
| EP1783672A1 (en) * | 2005-11-08 | 2007-05-09 | Hewlett-Packard Development Company, L.P. | Method for managing a group of servers taking into account electric power consumption |
| JP2007139523A (en) | 2005-11-16 | 2007-06-07 | Ntt Facilities Inc | Power consumption presentation system, server device, and power consumption presentation method |
| TW200805047A (en) | 2005-12-23 | 2008-01-16 | Koninkl Philips Electronics Nv | Performance analysis based system level power management |
| JP4895266B2 (en) * | 2005-12-28 | 2012-03-14 | 富士通株式会社 | Management system, management program, and management method |
| JP2007299624A (en) | 2006-04-28 | 2007-11-15 | Dainippon Printing Co Ltd | Outlet system with display |
| US7669071B2 (en) | 2006-05-05 | 2010-02-23 | Dell Products L.P. | Power allocation management in an information handling system |
| JP2007330016A (en) * | 2006-06-07 | 2007-12-20 | Nec Corp | Power unit, information processing system, and method and program for controlling power unit |
| US20080052145A1 (en) * | 2006-08-10 | 2008-02-28 | V2 Green, Inc. | Power Aggregation System for Distributed Electric Resources |
| WO2008026463A1 (en) * | 2006-08-30 | 2008-03-06 | Nec Corporation | Localization system, robot, localization method, and sound source localization program |
| US20080148075A1 (en) * | 2006-12-15 | 2008-06-19 | Texas Instruments Incorporated | Method and system of controlling power states of devices |
| US7783910B2 (en) * | 2007-03-30 | 2010-08-24 | International Business Machines Corporation | Method and system for associating power consumption of a server with a network address assigned to the server |
| US7969156B2 (en) * | 2007-03-30 | 2011-06-28 | Liebert Corporation | Method and apparatus for monitoring a load |
| US7577550B2 (en) * | 2007-04-30 | 2009-08-18 | Hewlett-Packard Development Company, L.P. | System and method for detecting performance anomalies in a computing system |
| US8880907B2 (en) * | 2007-06-21 | 2014-11-04 | Schneider Electric It Corporation | Method and system for determining physical location of equipment |
| JP2011508352A (en) * | 2007-12-28 | 2011-03-10 | サーバー テクノロジー インコーポレイテッド | Power distribution, management and monitoring system and method |
| US7796471B2 (en) * | 2008-02-20 | 2010-09-14 | Intelligent Sciences, Ltd. | Ultrasonic in-building positioning system based on phase difference array with ranging |
| AU2009307654A1 (en) | 2008-10-20 | 2010-04-29 | Raritan Americas, Inc. | System and method for automatic determination of the physical location of data center equipment |
-
2008
- 2008-07-07 US US12/168,504 patent/US8886985B2/en active Active
- 2008-07-08 EP EP08781503.1A patent/EP2311145B1/en active Active
- 2008-07-08 WO PCT/US2008/069422 patent/WO2010005429A1/en not_active Ceased
- 2008-07-08 CA CA2730165A patent/CA2730165C/en active Active
- 2008-07-08 CN CN200880131103.4A patent/CN102165644B/en active Active
- 2008-07-08 AU AU2008359227A patent/AU2008359227B2/en active Active
- 2008-07-08 JP JP2011517390A patent/JP5284469B2/en active Active
Also Published As
| Publication number | Publication date |
|---|---|
| WO2010005429A1 (en) | 2010-01-14 |
| US20100005331A1 (en) | 2010-01-07 |
| JP2011527480A (en) | 2011-10-27 |
| CN102165644A (en) | 2011-08-24 |
| US8886985B2 (en) | 2014-11-11 |
| CA2730165C (en) | 2016-10-18 |
| AU2008359227B2 (en) | 2014-06-12 |
| CN102165644B (en) | 2014-01-08 |
| EP2311145B1 (en) | 2018-09-26 |
| CA2730165A1 (en) | 2010-01-14 |
| AU2008359227A1 (en) | 2010-01-14 |
| EP2311145A1 (en) | 2011-04-20 |
| EP2311145A4 (en) | 2016-04-27 |
Similar Documents
| Publication | Publication Date | Title |
|---|---|---|
| JP5284469B2 (en) | Automatic discovery of physical connectivity between power outlets and IT equipment | |
| JP5710686B2 (en) | System, method and computer program for power management | |
| US12055602B2 (en) | System and method of monitoring electrical devices to detect anomaly in the electrical devices | |
| US20160217378A1 (en) | Identifying anomalous behavior of a monitored entity | |
| US20110179301A1 (en) | Automatic discovery of server to power-circuit connections | |
| CN105143892B (en) | Electric energy measuring and marking device installed at the power input point | |
| CA2766807A1 (en) | Power distribution apparatus with input and output power sensing and method of use | |
| US9588864B2 (en) | Methods for assessing data center efficiency and devices thereof | |
| KR101265408B1 (en) | Method and system for energy consumption monitoring in an ict environment | |
| US9863984B2 (en) | Power monitoring system | |
| CA2878655A1 (en) | Power distribution, management, and monitoring systems and methods | |
| CN114726649B (en) | Evaluation method, device, terminal device and storage medium for situational awareness | |
| CN106126386A (en) | The monitoring method of mobile terminal and monitoring system | |
| JP5261510B2 (en) | Network monitoring apparatus, method and program | |
| Agusti et al. | PPEM-BM: Portable Power Estimation Methodology for Bare Metal Servers | |
| Barenco Abbas et al. | Monitoring of data centers using wireless sensor networks | |
| CN119209866A (en) | A digital control method and device based on automatic switching of energy supply by emergency batteries | |
| CN103684919A (en) | Ubiquitous network performance monitoring system | |
| CN116647465A (en) | Automated operation and maintenance method based on artificial intelligence technology | |
| Han | Energy Measurements and Analysis to Understand Computing Systems and Networks |
Legal Events
| Date | Code | Title | Description |
|---|---|---|---|
| A977 | Report on retrieval |
Free format text: JAPANESE INTERMEDIATE CODE: A971007 Effective date: 20120822 |
|
| A131 | Notification of reasons for refusal |
Free format text: JAPANESE INTERMEDIATE CODE: A131 Effective date: 20120828 |
|
| A521 | Request for written amendment filed |
Free format text: JAPANESE INTERMEDIATE CODE: A523 Effective date: 20121122 |
|
| TRDD | Decision of grant or rejection written | ||
| A01 | Written decision to grant a patent or to grant a registration (utility model) |
Free format text: JAPANESE INTERMEDIATE CODE: A01 Effective date: 20130402 |
|
| A601 | Written request for extension of time |
Free format text: JAPANESE INTERMEDIATE CODE: A601 Effective date: 20130502 |
|
| A602 | Written permission of extension of time |
Free format text: JAPANESE INTERMEDIATE CODE: A602 Effective date: 20130514 |
|
| A61 | First payment of annual fees (during grant procedure) |
Free format text: JAPANESE INTERMEDIATE CODE: A61 Effective date: 20130529 |
|
| R150 | Certificate of patent or registration of utility model |
Ref document number: 5284469 Country of ref document: JP Free format text: JAPANESE INTERMEDIATE CODE: R150 |
|
| R250 | Receipt of annual fees |
Free format text: JAPANESE INTERMEDIATE CODE: R250 |
|
| R250 | Receipt of annual fees |
Free format text: JAPANESE INTERMEDIATE CODE: R250 |
|
| R250 | Receipt of annual fees |
Free format text: JAPANESE INTERMEDIATE CODE: R250 |
|
| S111 | Request for change of ownership or part of ownership |
Free format text: JAPANESE INTERMEDIATE CODE: R313113 |
|
| R350 | Written notification of registration of transfer |
Free format text: JAPANESE INTERMEDIATE CODE: R350 |
|
| R250 | Receipt of annual fees |
Free format text: JAPANESE INTERMEDIATE CODE: R250 |
|
| R250 | Receipt of annual fees |
Free format text: JAPANESE INTERMEDIATE CODE: R250 |
|
| R250 | Receipt of annual fees |
Free format text: JAPANESE INTERMEDIATE CODE: R250 |
|
| R250 | Receipt of annual fees |
Free format text: JAPANESE INTERMEDIATE CODE: R250 |
|
| R250 | Receipt of annual fees |
Free format text: JAPANESE INTERMEDIATE CODE: R250 |
|
| R250 | Receipt of annual fees |
Free format text: JAPANESE INTERMEDIATE CODE: R250 |
|
| R250 | Receipt of annual fees |
Free format text: JAPANESE INTERMEDIATE CODE: R250 |