JP5259199B2 - X-ray diffraction quantitative analysis method, X-ray diffraction quantitative analysis device, asbestos X-ray diffraction quantitative analysis method and asbestos X-ray diffraction quantitative analysis device - Google Patents
X-ray diffraction quantitative analysis method, X-ray diffraction quantitative analysis device, asbestos X-ray diffraction quantitative analysis method and asbestos X-ray diffraction quantitative analysis device Download PDFInfo
- Publication number
- JP5259199B2 JP5259199B2 JP2008006331A JP2008006331A JP5259199B2 JP 5259199 B2 JP5259199 B2 JP 5259199B2 JP 2008006331 A JP2008006331 A JP 2008006331A JP 2008006331 A JP2008006331 A JP 2008006331A JP 5259199 B2 JP5259199 B2 JP 5259199B2
- Authority
- JP
- Japan
- Prior art keywords
- asbestos
- sample
- diffraction
- standard
- measurement
- Prior art date
- Legal status (The legal status is an assumption and is not a legal conclusion. Google has not performed a legal analysis and makes no representation as to the accuracy of the status listed.)
- Active
Links
Images


Landscapes
- Analysing Materials By The Use Of Radiation (AREA)
Description
本発明は、検量線を用いたX線回折定量分析方法及びその装置に関する。さらに本発明は、検量線を用いたアスベストのX線回折定量分析方法及びその装置に関する。 The present invention relates to an X-ray diffraction quantitative analysis method using a calibration curve and an apparatus therefor. Furthermore, the present invention relates to an X-ray diffraction quantitative analysis method for asbestos using a calibration curve and an apparatus therefor.
従来から、種々の分析手法が知られている。例えば、X線回折分析、蛍光X線分析、赤外発光分析等といった種々の分析手法が知られている。また、分析手法の1つとして定量分析が知られている。この分析は、対象としている物質の含有量を判定する分析である。また、定量分析の一手法として検量線を用いた方法が知られている。 Conventionally, various analysis methods are known. For example, various analysis methods such as X-ray diffraction analysis, fluorescent X-ray analysis, and infrared emission analysis are known. Further, quantitative analysis is known as one of analysis methods. This analysis is an analysis for determining the content of the target substance. Further, a method using a calibration curve is known as one method of quantitative analysis.
ここでいう含有量は、未知試料(被検試料)の全体量に対する、対象としている物質の比率すなわち含有率で評価される。含有率は、全体の重量に対する、対象としている物質の重量百分率、すなわち含有率%で表すことが多い。定量分析の一手法として用いる検量線は、一般的には、測定値に対する含有率%をその値として作成される。 The content here is evaluated by the ratio of the target substance to the total amount of the unknown sample (test sample), that is, the content rate. The content is often expressed as a weight percentage of the target substance with respect to the total weight, that is, content%. A calibration curve used as one method of quantitative analysis is generally created with the content% relative to the measured value as its value.
しかし、アスベストの定量分析に代表される公害物質の定量分析においては、検量線は、測定値に対する重量をその値として作成される。例えば、JIS−A1481「建材製品中のアスベスト含有率測定方法」に詳しく述べられているように、検量線では、対象としている物質の重量を求め、その後の計算により、含有率%に換算する手順である。 However, in the quantitative analysis of pollutants represented by the quantitative analysis of asbestos, the calibration curve is created with the weight relative to the measured value as its value. For example, as described in detail in JIS-A1481, “Measurement method of asbestos content in building materials”, the calibration curve calculates the weight of the target substance and converts it to the content% by the subsequent calculation. It is.
本発明は、アスベスト定量分析に対して有効であるばかりでなく、一般的な定量分析にも有効であるので、本明細書では、定量分析値である含有率あるいは重量を含めて、含有量ということにする。 Since the present invention is effective not only for quantitative analysis of asbestos but also for general quantitative analysis, in the present specification, the content including the content rate or weight which is a quantitative analysis value is referred to as content. I will decide.
一般に、検量線法においては、組成が既知である標準試料に関して分析手法の種類に応じて求められる強度(例えば、回折線強度)と当該物質の含有量との関係を予め検量線として求めておく。そして、定量したい物質(すなわち被検物質又は被検試料)に対して所定の分析(X線回折分析等)を行って分析強度(回折線強度等)を求め、その分析強度を上記の検量線へ代入することにより、当該物質の含有量を判定している。 In general, in the calibration curve method, the relationship between the intensity (for example, diffraction line intensity) obtained in accordance with the type of analysis method for a standard sample having a known composition and the content of the substance is obtained in advance as a calibration curve. . Then, a predetermined analysis (X-ray diffraction analysis, etc.) is performed on the substance to be quantified (that is, a test substance or a test sample) to obtain an analysis intensity (diffraction line intensity, etc.). By substituting into, the content of the substance is determined.
例えば、特許文献1には、基底標準吸収補正法に基づくX線回折定量法に従って、粉塵等に含まれている特定物質を検量線を用いて定量する技術が開示されている。また、特許文献2には、基底標準吸収補正法に基づくX線回折定量法に従って、粉塵に含まれるアスベストを検量線を用いて定量する技術が開示されている。また、特許文献3には測定状況に応じて検量線を再作成する技術、具体的には、標準試料の1つが検量線上に乗らないときに、その標準試料を排除して、他の標準試料を用いて測定をし直して、検量線を再作成する、という技術が開示されている。さらに、特許文献4には、物質の含有量が既知であるチェック試料によって検量線の適否をチェックし、不適であれば再度、標準試料を測定して検量線を再作成する、という技術が開示されている。
For example, Patent Document 1 discloses a technique for quantifying a specific substance contained in dust or the like using a calibration curve according to an X-ray diffraction quantification method based on a basal standard absorption correction method.
上記の通り、検量線を用いた定量分析法は広く知られている。一般に、検量線は、標準試料に対する測定の結果として得られたピーク波形(X線回折測定であればX線回折ピーク波形)の積分強度に基づいて作成される。そして、その標準試料についての積分のスキャン(走査)軸上の範囲(X線回折測定であれば回折角度2θ軸上の範囲)は、定量しようとしている試料(すなわち被検試料)に対するスキャン軸上のスキャン範囲(すなわち定量測定スキャン範囲)と同じ範囲に設定されている。例えば、被検試料に対する定量測定スキャン範囲がα≦2θ≦βであれば、検量線の作成にあたっての標準試料に対する積分範囲も同じ範囲であるα≦2θ≦βに設定されている。 As described above, quantitative analysis methods using a calibration curve are widely known. In general, a calibration curve is created based on the integrated intensity of a peak waveform (X-ray diffraction peak waveform in the case of X-ray diffraction measurement) obtained as a result of measurement on a standard sample. Then, the range on the scan (scanning) axis of integration for the standard sample (the range on the diffraction angle 2θ axis in the case of X-ray diffraction measurement) is on the scan axis for the sample to be quantified (ie, the test sample). The scanning range (that is, the quantitative measurement scanning range) is set to the same range. For example, if the quantitative measurement scan range for the test sample is α ≦ 2θ ≦ β, the integration range for the standard sample in creating the calibration curve is also set to α ≦ 2θ ≦ β, which is the same range.
このような事情において、実際の分析においては、被検試料のピーク波形の前後に妨害ピークが発生することがある。この場合、その妨害ピークを含んだままで分析を進めれば正確な定量結果を得ることができないので、定量のためのスキャン範囲を狭めることによってその妨害ピークを排除した上で、被検試料に関して積分強度を測定する必要がある。そしてこの場合には、検量線を作成する際の標準試料に対する積分範囲もその定量測定スキャン範囲と同じ範囲にする必要がある。 Under such circumstances, in actual analysis, interference peaks may occur before and after the peak waveform of the test sample. In this case, if the analysis is carried out while including the interference peak, accurate quantification results cannot be obtained. Therefore, the interference peak is eliminated by narrowing the scan range for quantification, and the sample is integrated. It is necessary to measure the strength. In this case, the integration range for the standard sample when creating the calibration curve needs to be the same range as the quantitative measurement scan range.
被検試料に関する定量測定スキャン範囲と、検量線作成のための標準試料の積分範囲とを同じに設定しようとする場合、従来は、被検試料に関する定量測定スキャン範囲が変更されるたびに、標準試料に関してピーク波形を取得するための測定をその都度行い、そして定量測定スキャン範囲の変更に応じて積分スキャン範囲を変更した上で積分演算を再度、行っていた。通常、検量線を作成するために行われる標準試料に対する測定は、多数の標準試料に対して繰り返して行われるものであり、積分スキャン範囲を変更した上で再度、多数の標準試料に対して測定を行うということは、多大な時間を必要としていた。近年、アスベストの定量分析の需要が大きくなっているが、上記のように検量線の再作成を頻繁に行わなければならないということは、アスベストの定量分析の処理能力を大きく低下させる原因の1つとなっている。 When trying to set the quantitative measurement scan range for the test sample to be the same as the integration range of the standard sample for creating the calibration curve, the standard has been the standard every time the quantitative measurement scan range for the test sample is changed. The measurement for obtaining the peak waveform for the sample was performed each time, and the integration calculation was performed again after changing the integration scan range according to the change of the quantitative measurement scan range. Usually, the measurement for a standard sample that is performed to create a calibration curve is repeatedly performed for a large number of standard samples. After changing the integration scan range, the measurement is again performed for a large number of standard samples. It took a lot of time to do. In recent years, the demand for quantitative analysis of asbestos has increased. However, as described above, the need to re-create the calibration curve frequently is one of the causes of greatly reducing the processing capacity of quantitative analysis of asbestos. It has become.
本発明は、上記の問題点に鑑みて成されたものであって、検量線を短時間に容易に作成できるようにすること、及びそのことにより定量分析を短時間に容易に行うことができるようにすることを目的とする。 The present invention has been made in view of the above-described problems, and allows a calibration curve to be easily created in a short time, and thereby enables quantitative analysis to be easily performed in a short time. The purpose is to do so.
本発明に係るX線回折定量分析方法は、被検試料に含まれる物質の含有量をX線回折に基づいて求めるX線回折定量分析方法であって、(a)含有量が既知でありそれらの含有量が互いに異なっている複数の標準試料の個々に対して回折線強度プロファイルを求める標準試料測定工程と、(b)標準試料の回折線強度プロファイルに基づいて検量線を作成する検量線作成工程と、(c)被検試料をX線回折角度(2θ)に関してスキャン読取りすることによって回折線強度プロファイルを得る被検試料測定工程と、(d)被検試料の回折線強度プロファイルの積分量を前記検量線にあてはめて被検試料に含まれる物質の含有量を求める含有量判定工程とを有するX線回折定量分析方法において、(e)前記被検試料の回折線強度プロファイルに基づいて定量測定スキャン範囲を決める定量測定スキャン範囲決定工程と、(f)前記定量測定スキャン範囲決定工程で決められた定量測定スキャン範囲と同じ範囲を積分範囲と決定する積分範囲決定工程と、を有しており、(g)前記標準試料測定工程では、前記標準試料の回折線強度プロファイルのピーク波形の一方の裾領域から他方の裾領域にわたる広いスキャン範囲にわたって所定の読取りステップ幅で測定を行い、その読取りステップ幅ごとの回折線強度を標準試料ごとに記憶し、(h)本X線回折定量分析方法は、前記標準試料測定工程で記憶した複数の標準試料の個々に関する読取りステップ幅ごとの回折線強度のデータについて、前記積分範囲決定工程で決められた積分範囲における積分値を演算によって求める積分演算工程をさらに有しており、(i)前記検量線作成工程では、前記積分演算工程において求められた複数の標準試料についての積分値と、それらの積分値に対応する標準試料の既知の含有量とによって検量線を求め、(j)前記含有量判定工程では、前記被検試料測定工程において得られた回折線強度プロファイルに含まれているピーク波形における前記定量測定スキャン範囲内での積分量を求め、前記検量線に基づいて前記ピーク波形の積分量から被検試料内の物質の含有量を判定することを特徴とする。The X-ray diffraction quantitative analysis method according to the present invention is an X-ray diffraction quantitative analysis method for obtaining the content of a substance contained in a test sample based on X-ray diffraction, and (a) the content is known and those A standard sample measuring step for obtaining a diffraction line intensity profile for each of a plurality of standard samples having different contents of (b), and (b) a calibration curve for creating a calibration curve based on the diffraction line intensity profile of the standard sample A step, (c) a test sample measurement step for obtaining a diffraction line intensity profile by scanning the test sample with respect to the X-ray diffraction angle (2θ), and (d) an integral amount of the diffraction line intensity profile of the test sample. And (e) a diffraction line intensity profile of the test sample, comprising: a content determination step for determining the content of a substance contained in the test sample by applying A quantitative measurement scan range determining step for determining a quantitative measurement scan range on the basis thereof; and (f) an integral range determining step for determining the same range as the quantitative measurement scan range determined in the quantitative measurement scan range determining step as an integral range. (G) In the standard sample measurement step, measurement is performed with a predetermined reading step width over a wide scan range from one skirt region to the other skirt region of the peak waveform of the diffraction line intensity profile of the standard sample. The diffraction line intensity for each reading step width is stored for each standard sample. (H) This X-ray diffraction quantitative analysis method is used for each reading step width for each of the plurality of standard samples stored in the standard sample measuring step. For the diffraction line intensity data, the integral calculation process is used to calculate the integral value in the integral range determined in the integral range determination step. (I) In the calibration curve creation step, the integration values for the plurality of standard samples obtained in the integration calculation step and the known contents of the standard samples corresponding to these integration values (J) In the content determination step, the integrated amount within the quantitative measurement scan range in the peak waveform included in the diffraction line intensity profile obtained in the test sample measurement step is calculated. The content of the substance in the test sample is determined from the integrated amount of the peak waveform based on the calibration curve.
上記構成において、「スキャン読取り」は、例えば、X線回折測定で行われる回折角度2θの読取りスキャンである。X線回折測定で行われる回折角度2θの読取りスキャンは、とりもなおさず、X線分析の測定角度のスキャンのことである。 In the above configuration, “scan reading” is, for example, a reading scan of the diffraction angle 2θ performed in the X-ray diffraction measurement. The reading scan of the diffraction angle 2θ performed in the X-ray diffraction measurement is a scan of the measurement angle of the X-ray analysis.
本発明に係るX線回折定量分析方法によれば、検量線作成のために標準試料の回折線強度プロファイルについて積分強度を求める際、標準試料の調整、X線回折測定、及び積分強度演算を毎回初めから繰り返して行うのではなく、広いスキャン範囲でのステップ測定データを予め記憶手段に記憶しておき、被検試料についての定量測定スキャン範囲が必要に応じて変更される場合には、その変更された定量測定スキャン範囲と同じ範囲を積分範囲と設定して、上記記憶手段内のステップ測定データに基づいて積分強度を演算し、その積分強度から検量線を作成することにした。従って、必要が生じたときに標準試料の調整、X線回折測定、及び積分強度演算の一連の処理を毎回行っていた従来の方法に比べて、検量線を非常に短時間に容易に正確に作成できるようになった。そしてその結果、正確な定量分析処理を非常に短時間に容易に正確に行うことができるようになった。 According to the X-ray diffraction quantitative analysis method according to the present invention, when obtaining an integrated intensity for a diffraction line intensity profile of a standard sample for preparing a calibration curve, adjustment of the standard sample, X-ray diffraction measurement, and integral intensity calculation are performed each time. Rather than repeat from the beginning, step measurement data in a wide scan range is stored in advance in the storage means, and if the quantitative measurement scan range for the test sample is changed as necessary, change it The same range as the determined quantitative measurement scan range is set as the integration range, the integrated intensity is calculated based on the step measurement data in the storage means, and a calibration curve is created from the integrated intensity. Therefore, the calibration curve can be obtained easily and accurately in a very short time compared to the conventional method in which a series of processing of standard sample adjustment, X-ray diffraction measurement, and integral intensity calculation is performed each time a need arises. It can be created. As a result, accurate quantitative analysis processing can be performed easily and accurately in a very short time.
なお、「被検試料についての定量測定スキャン範囲が必要に応じて変更される場合」としては、回折線プロファイル等といった測定結果に妨害ピークが存在していて、定量測定スキャン範囲決定工程において、その妨害ピークを排除する範囲として定量測定スキャン範囲が決められる場合等が考えられる。妨害ピークを排除した定量分析を行えば、信頼性の高い正確な定量結果を得ることができる。 In addition, when “quantitative measurement scan range for the test sample is changed as necessary”, there is an interference peak in the measurement result such as diffraction line profile, etc. A case where a quantitative measurement scan range is determined as a range for eliminating the interference peak is considered. If quantitative analysis is performed without interfering peaks, a reliable and accurate quantitative result can be obtained.
なお、上記構成においては、検量線を求めるために、標準試料測定工程においては所定の読取りステップ幅での回折線強度の測定と記憶を行い、そして積分演算工程においてはステップ幅ごとに記憶された回折線強度のデータに基づいて回折線強度プロファイルの積分量を演算によって求めた。これに対し、上記含有量判定工程において被検試料の回折線強度プロファイルの積分量を求める際にはそのような限定(すなわち、所定の読取りステップ幅で回折線強度を測定しその測定結果を記憶し、そしてその記憶された読取りステップ幅ごとの回折線強度データに基づいて演算によって回折線強度プロファイルの積分量を求めるという限定)はしていない。In the above configuration, in order to obtain a calibration curve, the diffraction line intensity is measured and stored at a predetermined reading step width in the standard sample measurement process, and stored for each step width in the integration calculation process. Based on the diffraction line intensity data, the integral amount of the diffraction line intensity profile was obtained by calculation. On the other hand, when obtaining the integral amount of the diffraction line intensity profile of the test sample in the content determination step, the diffraction line intensity is measured with such a limitation (that is, with a predetermined reading step width, and the measurement result is stored). However, there is no limitation that the integral amount of the diffraction line intensity profile is obtained by calculation based on the stored diffraction line intensity data for each reading step width.
次に、本発明に係るX線回折定量分析装置は、被検試料に含まれる物質の含有量をX線回折に基づいて測定するX線回折定量分析装置であって、(a)試料をX線検出器によってX線回折角度(2θ)に関してスキャン読取りするX線回折測定系と、(b)データを入力する入力手段と、(c)画像を表示する表示手段と、(d)前記X線回折測定系を用いて被検試料についての回折線強度プロファイルを求める被検試料測定手段と、(e)前記被検試料測定手段によって求めた被検試料の回折線強度プロファイルを前記表示手段に表示し、前記入力手段を通して入力された定量測定スキャン範囲を第1の記憶手段に記憶させる定量測定スキャン範囲決定手段と、(f)前記被検試料の回折線強度プロファイルに含まれるピーク波形の積分量を物質の含有量に換算するための検量線を作成する検量線作成手段と、(g)前記被検試料測定手段を用いて得られた被検試料の回折線強度プロファイルに含まれているピーク波形の積分量を求め、前記検量線に基づいて前記ピーク波形の積分量から被検試料内の物質の含有量を判定する含有量判定手段とを有しており、(h)前記検量線作成手段は、(i)含有量が異なった複数の標準試料の個々に対して回折線強度プロファイルのピーク波形の一方の裾領域から他方の裾領域にわたる広いスキャン範囲にわたって所定の読取りステップ幅で前記X線回折測定系を用いて測定を行わせ、その読取りステップ幅ごとの回折線強度を標準試料ごとに第2の記憶手段に記憶させる標準試料ステップ測定手段と、(ii)前記第2の記憶手段に記憶された複数の標準試料の個々に関する読取りステップ幅ごとの回折線強度データについて、前記定量測定スキャン範囲決定手段の第1の記憶手段に記憶された定量測定スキャン範囲と同じ範囲である積分範囲内での積分値を演算によって求める積分演算手段と、(iii)前記積分演算手段によって求められた複数の標準試料についての積分値と、それらの積分値に対応する標準試料の既知の含有量とによって検量線を求める検量線演算手段とを有することを特徴とする。Next, an X-ray diffraction quantitative analysis apparatus according to the present invention is an X-ray diffraction quantitative analysis apparatus that measures the content of a substance contained in a test sample based on X-ray diffraction, and (a) the sample is X An X-ray diffraction measurement system that scans and scans an X-ray diffraction angle (2θ) by a line detector; (b) input means for inputting data; (c) display means for displaying an image; and (d) the X-rays. A test sample measuring means for obtaining a diffraction line intensity profile for the test sample using a diffraction measurement system; and (e) a diffraction line intensity profile of the test sample obtained by the test sample measuring means is displayed on the display means. And a quantitative measurement scan range determining means for storing the quantitative measurement scan range input through the input means in a first storage means, and (f) an integrated amount of a peak waveform included in the diffraction line intensity profile of the test sample. A calibration curve creating means for creating a calibration curve for conversion to the content of the substance, and (g) a peak waveform included in the diffraction line intensity profile of the test sample obtained by using the test sample measuring means. Content determination means for determining the content of a substance in the test sample from the integration amount of the peak waveform based on the calibration curve, and (h) the calibration curve creation means (I) The X-ray with a predetermined reading step width over a wide scan range from one skirt region to the other skirt region of the peak waveform of the diffraction line intensity profile for each of a plurality of standard samples having different contents A standard sample step measuring means for performing measurement using a diffraction measurement system and storing the diffraction line intensity for each reading step width in the second storage means for each standard sample; and (ii) in the second storage means. Remembered The diffraction line intensity data for each reading step width for each of the plurality of standard samples is within an integration range that is the same range as the quantitative measurement scan range stored in the first storage means of the quantitative measurement scan range determining means. Calibration by means of an integral computing means for obtaining an integral value of (iii), (iii) integral values for a plurality of standard samples obtained by the integral computing means, and known contents of the standard samples corresponding to those integral values And a calibration curve calculating means for obtaining a line.
上記構成及びこれ以降の説明において、「X線回折測定系」は、標準試料について測定結果を得ることができる機械的な構造要素であり、例えば、X線発生装置、ゴニオメータ、試料、検出器等を含んだX線回折測定構造等である。「表示手段」は、例えばフラットパネルディスプレイ等によって構成される。「入力手段」は、例えばキーボード、マウス等によって構成できる。「標準試料ステップ測定手段」、「積分演算手段」、及び「検量線演算手段」は、例えば、CPU及びソフトウエアによって機能的に実現される。 In the above configuration and the following description, the “ X-ray diffraction measurement system ” is a mechanical structural element that can obtain a measurement result for a standard sample. For example, an X-ray generator, goniometer , sample, detector, etc. X-ray diffraction measurement structure including The “display unit” is configured by, for example, a flat panel display. The “input unit” can be configured by a keyboard, a mouse, or the like, for example. The “standard sample step measurement means”, “integral calculation means”, and “calibration curve calculation means” are functionally realized by, for example, a CPU and software.
本発明のX線回折定量分析装置によれば、検量線作成のために標準試料の回折線強度プロファイルについて積分強度を求める際、検量線作成のための条件に変更があった場合でも、標準試料の調整、X線回折測定、及び積分強度演算を毎回初めから繰り返して行うのではなく、広いスキャン範囲でのステップ測定データを予め記憶手段に記憶しておき、被検試料についての定量測定スキャン範囲が必要に応じて変更される場合には、その変更された定量測定スキャン範囲と同じ範囲を積分範囲と設定して、上記記憶手段内のステップ測定データに基づいて積分強度を演算し、その積分強度からその都度検量線を作成することにした。従って、必要が生じたときに標準試料の調整、X線回折測定、及び積分強度演算の一連の処理を毎回行っていた従来の装置に比べて、検量線を非常に短時間に容易に正確に作成できるようになった。 According to the X-ray diffraction quantitative analysis apparatus of the present invention, when obtaining an integrated intensity for a diffraction line intensity profile of a standard sample for preparing a calibration curve, even if the conditions for creating the calibration curve have changed, the standard sample Adjustment, X-ray diffraction measurement, and integral intensity calculation are not repeatedly performed from the beginning each time, but step measurement data in a wide scan range is stored in a storage means in advance, and a quantitative measurement scan range for a test sample Is changed as necessary, the same range as the changed quantitative measurement scan range is set as the integration range, the integrated intensity is calculated based on the step measurement data in the storage means, and the integration is calculated. It was decided to create a calibration curve each time from the intensity. Therefore, the calibration curve can be made easily and accurately in a very short time compared to the conventional device that performed a series of processing of standard sample adjustment, X-ray diffraction measurement, and integral intensity calculation each time when necessary. It can be created.
次に、本発明に係るアスベストのX線回折定量分析方法は、被検アスベスト試料に含まれるアスベストの重量をX線回折に基づいて求めるアスベストのX線回折定量分析方法であって、(a)重量が既知でありそれらの重量が互いに異なっている複数の標準アスベスト試料の個々に対して回折線強度プロファイルを求める標準試料測定工程と、(b)標準アスベスト試料の回折線強度プロファイルに基づいて検量線を作成する検量線作成工程と、(c)被検アスベスト試料をX線回折角度(2θ)に関してスキャン読取りすることによって回折線強度プロファイルを得る被検試料測定工程と、(d)被検アスベスト試料の回折線強度プロファイルの積分量を前記検量線にあてはめて被検アスベスト試料に含まれるアスベストの重量を求める重量判定工程とを有するアスベストのX線回折定量分析方法において、(e)前記被検アスベスト試料の回折線強度プロファイルに基づいて定量測定スキャン範囲を決める定量測定スキャン範囲決定工程と、(f)前記定量測定スキャン範囲決定工程で決められた定量測定スキャン範囲と同じ範囲を積分範囲と決定する積分範囲決定工程と、を有しており、(g)前記標準試料測定工程では、前記標準試料の回折線強度プロファイルのピーク波形の一方の裾領域から他方の裾領域にわたる広いスキャン範囲にわたって所定の読取りステップ幅で測定を行い、その読取りステップ幅ごとの回折線強度を標準アスベスト試料ごとに記憶し、(h)本アスベストのX線回折定量分析方法は、前記標準試料測定工程で記憶した複数の標準アスベスト試料の個々に関する読取りステップ幅ごとの回折線強度のデータについて、前記積分範囲決定工程で決められた積分範囲における積分値を演算によって求める積分演算工程をさらに有しており、(i)前記検量線作成工程では、前記積分演算工程において求められた複数の標準アスベスト試料についての積分値と、それらの積分値に対応する標準アスベスト試料の既知の重量とによって検量線を求め、(j)前記重量判定工程では、前記被検試料測定工程において得られた回折線強度プロファイルに含まれているピーク波形の前記定量測定スキャン範囲内での積分量を求め、前記検量線に基づいて前記ピーク波形の積分量から被検アスベスト試料内のアスベストの重量を判定することを特徴とする。 Next, the X-ray diffraction quantitative analysis method for asbestos according to the present invention is an X-ray diffraction quantitative analysis method for asbestos that obtains the weight of asbestos contained in a test asbestos sample based on X-ray diffraction, (a) weight and the standard specimen measurement process determine the diffraction intensity profile for each of a plurality of standard asbestos samples their weight is known they are different from each other, based on the diffraction intensity profile of the (b) standard asbestos samples a calibration curve creating step of creating a calibration curve Te, and the test sample measurement step of obtaining a diffraction line intensity profile by scanning the reading with respect to (c) test asbestos samples X-ray diffraction angle (2 [Theta]), the (d) heavy obtaining the weight of the asbestos contained by applying the integrated amount of diffraction intensity profile of the test asbestos sample to the calibration curve to test asbestos samples In X-ray diffraction method for quantitative analysis of asbestos and a determination step, (e) the Quantitative measurement scanning range determination step of determining a quantitative measurement scanning range based on the diffraction intensity profile of the test asbestos sample, (f) the quantitative and integral range determining step of the same range as the quantitative measurement scan range determined by measuring the scan range determining step determines that the integration range, has, (g) wherein in the standard specimen measurement process, the standard sample Measurement is performed with a predetermined reading step width over a wide scanning range from one skirt region to the other skirt region of the peak waveform of the diffraction line intensity profile, and the diffraction line intensity for each reading step width is stored for each standard asbestos sample, (h) X-ray diffraction method for quantitative analysis of the asbestos, a plurality of standard asbestos samples stored at said standard specimen measurement process The method further includes an integration calculation step for calculating an integral value in the integration range determined in the integration range determination step for diffraction line intensity data for each reading step width, and (i) the calibration curve creation step Then, a calibration curve is obtained from the integration values for the plurality of standard asbestos samples obtained in the integration calculation step and the known weights of the standard asbestos samples corresponding to these integration values, and (j) in the weight determination step Then, an integration amount within the quantitative measurement scan range of the peak waveform included in the diffraction line intensity profile obtained in the test sample measurement step is obtained, and based on the calibration curve, an integration amount of the peak waveform is obtained. The weight of asbestos in the test asbestos sample is determined.
次に、本発明に係るアスベストのX線回折定量分析装置は、被検アスベスト試料に含まれるアスベストの重量をX線回折に基づいて測定するアスベストのX線回折定量分析装置であって、(a)被検アスベスト試料をX線検出器によってX線回折角度(2θ)に関してスキャン読取りするX線回折測定系と、(b)データを入力する入力手段と、(c)画像を表示する表示手段と、(d)前記X線回折測定系を用いて被検アスベスト試料についての回折線強度プロファイルを求める被検試料測定手段と、(e)前記被検試料測定手段によって求めた被検アスベスト試料の回折線強度プロファイルを前記表示手段に表示し、前記入力手段を通して入力された定量測定スキャン範囲を第1の記憶手段に記憶させる定量測定スキャン範囲決定手段と、(f)前記被検アスベスト試料の回折線強度プロファイルに含まれるピーク波形の積分量をアスベストの重量に換算するための検量線を作成する検量線作成手段と、(g)前記被検試料測定手段を用いて得られた被検試料の回折線強度プロファイルに含まれているピーク波形の積分量を求め、前記検量線に基づいて前記ピーク波形の積分量から被検アスベスト試料内のアスベストの重量を判定する重量判定手段と、を有しており、(h)前記検量線作成手段は、(i)アスベストの重量が異なっている複数の標準アスベスト試料の個々に対して回折線強度プロファイルのピーク波形の一方の裾領域から他方の裾領域にわたる広いスキャン範囲にわたって所定の読取りステップ幅で前記X線回折測定系を用いて測定を行わせ、その読取りステップ幅ごとの回折線強度を標準アスベスト試料ごとに第2の記憶手段に記憶させる標準試料ステップ測定手段と、(ii)前記第2の記憶手段に記憶された複数の標準アスベスト試料の個々に関する読取りステップ幅ごとの回折線強度データについて、前記定量測定スキャン範囲決定手段の第1の記憶手段に記憶された定量測定スキャン範囲と同じ範囲である積分範囲内での積分値を演算によって求める積分演算手段と、(iii)前記積分演算手段によって求められた複数の標準アスベスト試料についての積分値と、それらの積分値に対応する標準アスベスト試料の既知の重量とによって検量線を求める検量線演算手段とを有することを特徴とする。 Next, an X-ray diffraction quantitative analysis apparatus for asbestos according to the present invention is an X-ray diffraction quantitative analysis apparatus for asbestos that measures the weight of asbestos contained in a test asbestos sample based on X-ray diffraction. ) An X-ray diffraction measurement system that scans and scans a test asbestos sample with respect to an X-ray diffraction angle (2θ) by an X-ray detector; (b) input means for inputting data ; (c) display means for displaying an image ; , (d) and the test sample measurement means for obtaining a diffraction line intensity profile for the test asbestos sample using the X-ray diffraction measurement system, the diffraction of the test asbestos samples obtained by (e) the test sample measuring means A quantitative measurement scan range determining means for displaying a line intensity profile on the display means and storing the quantitative measurement scan range input through the input means in a first storage means; , (F) said a calibration curve creating means for the integration of the peak waveforms included in diffraction intensity profile of the test asbestos samples a calibration curve for converting the weight of asbestos, (g) the test sample measurement The integrated amount of the peak waveform contained in the diffraction line intensity profile of the test sample obtained using the means is obtained, and the weight of asbestos in the test asbestos sample from the integrated amount of the peak waveform based on the calibration curve (H) the calibration curve creating means includes: (i) a peak of a diffraction line intensity profile for each of a plurality of standard asbestos samples having different asbestos weights. Measurement is performed using the X-ray diffraction measurement system at a predetermined reading step width over a wide scanning range from one skirt region to the other skirt region of the waveform, and the reading step is performed. A standard sample step measuring means for storing the diffraction line intensity for each standard width in the second storage means for each standard asbestos sample, and (ii) each of a plurality of standard asbestos samples stored in the second storage means Integral calculation for calculating the integral value within the integral range that is the same range as the quantitative measurement scan range stored in the first storage means of the quantitative measurement scan range determining means for the diffraction line intensity data for each reading step width And (iii) calibration curve calculation means for obtaining a calibration curve from the integral values of the plurality of standard asbestos samples obtained by the integral calculation means and the known weight of the standard asbestos sample corresponding to these integral values. It is characterized by having.
上記のアスベストのX線回折定量分析方法及びアスベストのX線回折定量分析装置によれば、検量線作成のために標準アスベスト試料の測定結果である回折線強度プロファイルについて積分強度を求める際、標準アスベスト試料の調整、X線回折測定、及び積分強度演算を毎回初めから繰り返して行うのではなく、広いスキャン範囲でのステップ強度データを予め記憶手段に記憶しておき、被検試料についての定量測定スキャン範囲が必要に応じて変更される場合には、その変更された定量測定スキャン範囲と同じ範囲を積分範囲と設定して、上記記憶手段内のステップ強度データに基づいて積分強度を演算し、その積分強度から検量線を作成することにした。従って、必要が生じたときに標準アスベスト試料の調整、X線回折測定、及び積分強度演算の一連の処理を毎回行っていた従来の方法に比べて、検量線を非常に短時間に容易に正確に作成できるようになった。そしてその結果、アスベストの定量分析処理を非常に短時間に容易に正確に行うことができるようになった。 According to the above asbestos X-ray diffraction quantitative analysis method and asbestos X-ray diffraction quantitative analysis apparatus, when obtaining an integrated intensity for a diffraction line intensity profile which is a measurement result of a standard asbestos sample for preparing a calibration curve, Rather than repetitively performing sample adjustment, X-ray diffraction measurement, and integral intensity calculation from the beginning each time, step intensity data in a wide scan range is stored in the storage means in advance, and a quantitative measurement scan for the test sample is performed. When the range is changed as necessary, the same range as the changed quantitative measurement scan range is set as the integration range, and the integrated intensity is calculated based on the step intensity data in the storage means. It was decided to create a calibration curve from the integrated intensity. Therefore, the calibration curve can be easily and accurately adjusted in a very short time compared to the conventional method in which standard asbestos sample preparation, X-ray diffraction measurement, and integral intensity calculation are performed each time a need arises. Can now be created. As a result, quantitative analysis of asbestos can be performed easily and accurately in a very short time.
本発明に係るX線回折定量分析方法、X線回折定量分析装置、アスベストのX線回折定量分析方法、及びアスベストのX線回折定量分析装置によれば、検量線作成のために標準試料の回折線強度プロファイルについて積分強度を求める際、標準試料の調整、X線回折測定、及び積分強度演算を毎回初めから繰り返して行うのではなく、広いスキャン範囲でのステップ測定データを予め記憶手段に記憶しておき、被検試料についての定量測定スキャン範囲が必要に応じて変更される場合には、その変更された定量測定スキャン範囲と同じ範囲を積分範囲と設定して、上記記憶手段内のステップ測定データに基づいて積分強度を演算し、その積分強度から検量線を作成することにした。従って、必要が生じたときに標準試料の調整、X線回折測定、及び積分強度演算の一連の処理を毎回行っていた従来の方法に比べて、検量線を非常に短時間に容易に正確に作成できるようになった。そしてその結果、定量分析処理を非常に短時間に容易に正確に行うことができるようになった。 According to the X-ray diffraction quantitative analysis method, the X-ray diffraction quantitative analysis device, the asbestos X-ray diffraction quantitative analysis method, and the asbestos X-ray diffraction quantitative analysis device according to the present invention, a standard sample is diffracted to prepare a calibration curve. When calculating the integral intensity for the line intensity profile , step measurement data in a wide scan range is stored in advance in the storage means instead of repeating the standard sample adjustment, X-ray diffraction measurement, and integral intensity calculation from the beginning each time. If the quantitative measurement scan range for the test sample is changed as necessary, the same range as the changed quantitative measurement scan range is set as the integration range, and step measurement in the storage means is performed. The integrated intensity was calculated based on the data, and a calibration curve was created from the integrated intensity. Therefore, the calibration curve can be obtained easily and accurately in a very short time compared to the conventional method in which a series of processing of standard sample adjustment, X-ray diffraction measurement, and integral intensity calculation is performed each time a need arises. It can be created. As a result, quantitative analysis processing can be performed easily and accurately in a very short time.
(X線回折定量分析方法及びX線回折定量分析装置の実施形態)
以下、本発明に係るX線回折定量分析方法及びX線回折定量分析装置を実施形態に基づいて説明する。なお、本発明がこの実施形態に限定されないことはもちろんである。また、これ以降の説明では図面を参照するが、その図面では特徴的な部分を分かり易く示すために実際のものとは異なった比率で構成要素を示す場合がある。
(Embodiment of X-ray diffraction quantitative analysis method and X-ray diffraction quantitative analysis apparatus)
Hereinafter, an X-ray diffraction quantitative analysis method and an X-ray diffraction quantitative analysis apparatus according to the present invention will be described based on embodiments. Of course, the present invention is not limited to this embodiment. In the following description, the drawings are referred to. In the drawings, the components may be shown in different ratios from the actual ones in order to show the characteristic parts in an easy-to-understand manner.
本実施形態では、被検試料内に含まれる特定物質としてのカオリナイトの含有量を測定するために本発明に係るX線回折定量分析方法を用いるものとする。より具体的には、基底標準吸収補正法に基づいてカオリナイトの含有量を求めるものとする。 In this embodiment, the X-ray diffraction quantitative analysis method according to the present invention is used to measure the content of kaolinite as a specific substance contained in a test sample. More specifically, the kaolinite content is determined based on the base standard absorption correction method.
図1(a)は、本発明に係るX線回折定量分析方法を実施するためのX線回折定量分析装置の全体的な構成を示している。ここに示すX線回折定量分析装置1は、CPU(Central Processing Unit)2と、記憶手段としてのメモリ3と、X線回折測定系としてのX線回折装置4と、表示手段としての画像表示装置6と、同じく表示手段としてのプリンタ7と、入力手段としての入力装置8とを有している。これらの要素はバス9によって互いに電気的に接続されている。
Fig.1 (a) has shown the whole structure of the X-ray- diffraction quantitative analysis apparatus for enforcing the X-ray-diffraction quantitative analysis method based on this invention. An X-ray diffraction quantitative analysis apparatus 1 shown here includes a CPU (Central Processing Unit) 2, a memory 3 as a storage means , an
メモリ3は、例えば、ROM(Read Only Memory)、RAM(Random Access Memory)等といった半導体メモリや、ハードディスク、MO(Magneto-optic)ディスク等といった機械式メモリ等によって形成されている。メモリ3の内部には、検量線を作成するためのプログラムを含んだ定量分析プログラムが記憶されている。また、各種のファイルが作成される領域及び各種のメモリとして機能する領域が設けられている。画像表示装置6は、液晶ディスプレイ等といったフラットパネルディスプレイ等によって構成されている。プリンタ7は、例えば、静電転写方式のプリンタによって構成されている。入力装置8は、キーボード、マウス等によって構成されている。
The memory 3 is formed by, for example, a semiconductor memory such as a ROM (Read Only Memory) or a RAM (Random Access Memory), a mechanical memory such as a hard disk or an MO (Magneto-optic) disk, or the like. Inside the memory 3, a quantitative analysis program including a program for creating a calibration curve is stored. In addition, an area where various files are created and an area which functions as various memories are provided. The image display device 6 includes a flat panel display such as a liquid crystal display. The
X線回折装置4は、図1(b)に示すように、X線源11と、発散スリット12と、ゴニオメータ(測角器)13と、受光スリット14と、X線検出器16とを有している。X線源11は、例えば、通電によって熱電子を放出するフィラメント(図示せず)と、そのフィラメントに対向して配置されたターゲット(図示せず)とによって形成されている。フィラメントから発生した熱電子はターゲットの表面上に集束してX線焦点を形成し、そのX線焦点からX線が発生する。本実施形態では、このX線焦点がX線源11である。なお、ターゲットの表面はCu(銅)によって形成されるものとし、これにより、X線源11はCuの波長のX線を含むX線を発生する。
As shown in FIG. 1B, the
ゴニオメータ13は試料台17を有している。試料台17上には、Zn(亜鉛)製の基底基準板19及び試料ホルダ21が装着される。試料ホルダ21の内部の所定領域に、測定対象である試料(被検試料)Sやカオリナイトの標準試料S0が装着される。被検試料S及び標準試料S0は、通常、フィルタに捕獲された状態で試料ホルダ21に装着されている。被検試料Sは、重量(すなわち含有量)が未知の特定物質であるカオリナイトを含む試料である。標準試料S0は重量が既知であるカオリナイトである。本実施形態では、試料全体中に含まれるカオリナイトの含有量を求めることが測定目標である。また、標準試料S0は検量線を作成する際に用いられるものである。
The
ゴニオメータ13は、試料台17をθ回転駆動するθ回転装置18と、受光スリット14及びX線検出器16を2θ回転駆動する2θ回転装置22とを有している。θ回転とは、X線源11から出射して被検試料S又は標準試料S0に入射するX線の入射角度θを変化させるために行われる、ω軸線を中心とした回転である。ω軸線は、X線の中心軸(すなわちX線光軸)に対して直角であると共に試料Sの表面に平行な(すなわち図1(b)の紙面を貫通する方向に延びる)軸線である。2θ回転とは、被検試料S又は標準試料S0から回折角度2θで発生した回折線をX線検出器16によって取り込むために行われる、受光スリット14及びX線検出器16のω軸線を中心とした回転である。
The
θ回転装置18及び2θ回転装置22は、いずれも、任意の構造の駆動装置によって構成できるが、例えば、モータ等といった駆動源に連結したウオームと、試料台17に連結したウオームホイールとを互いに噛み合わせた構造を有する駆動系によって構成できる。発散スリット12は、試料S,S0に対するX線照射領域を規定するスリットである。受光スリット14は、回折線以外の不要なX線がX線検出器16に入るのを阻止するスリットである。
Both the
以下、上記構成の装置によって実施されるX線回折定量分析方法について説明する。本実施形態のX線回折定量分析方法は、検量線作成工程及びその検量線を用いて行われる定量分析工程を有している。以下、それらの工程を個別に説明する。 Hereinafter, an X-ray diffraction quantitative analysis method performed by the apparatus having the above configuration will be described. The X-ray diffraction quantitative analysis method of the present embodiment includes a calibration curve creation process and a quantitative analysis process performed using the calibration curve. Hereinafter, these steps will be described individually.
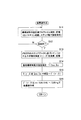
(定量分析工程)
定量分析を行うにあたって作業者は、含有量が未知である測定対象であるカオリナイトを含む試料(すなわち被検試料)をフィルタに捕獲し、さらにそのフィルタを図1(b)に示す試料ホルダ21に装着する。そして、図2のステップS1において測定を開始する。まず、図1(b)において、被検試料を支持した試料ホルダ21を試料台17上の基底基準板19の上に乗せる。そして、X線入射角度θをカオリナイトの回折角度θKに合わせる。そして、所定のステップ幅、例えば0.02°のステップ幅で被検試料SをX線検出器16によって2θ0≦2θ≦2θ1のスキャン範囲にわたってスキャン(走査)する。そして、各ステップ角度位置において2秒間、X線検出器16によって回折線強度(cps)を測定する。
(Quantitative analysis process)
In performing the quantitative analysis, an operator captures a sample containing kaolinite as a measurement target whose content is unknown (that is, a test sample) on a filter, and the sample holder 21 shown in FIG. Attach to. Then, measurement starts in step S1 of FIG. First, in FIG. 1B, the sample holder 21 that supports the test sample is placed on the
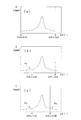
このスキャン範囲2θ0≦2θ≦2θ1は、図3(a)に示すように、カオリナイトの回折線プロファイルにおけるピーク波形を完全に含み、低角度側の一方の裾部から高角度側の他方の裾部にわたる広い範囲である。本実施形態では、2θ0=11.0°及び2θ1=13.2°に設定する。この範囲は、もちろん、測定対象となる物質に応じて変化する。スキャンが終わると、図3(a)に示す回折線プロファイルが求められ、これが図1(a)の画像表示装置6に表示されたり、プリンタ7によって用紙上に印字されたりする。
As shown in FIG. 3A, this scan range 2θ 0 ≦ 2θ ≦ 2θ 1 completely includes the peak waveform in the diffraction line profile of kaolinite, and from one hem on the low angle side to the other on the high angle side. Is a wide range across the hem. In this embodiment, 2θ 0 = 11.0 ° and 2θ 1 = 13.2 ° are set. This range will of course vary depending on the substance to be measured. When the scanning is completed, the diffraction line profile shown in FIG. 3A is obtained and displayed on the image display device 6 shown in FIG. 1A or printed on the paper by the
作業者はその表示を観察して積分によって定量すべき範囲α≦2θ≦βを決める。例えば、図3(a)に示すように、広い範囲2θ0≦2θ≦2θ1にわたって妨害ピークが存在せず、プロファイルが綺麗である場合は、広い範囲2θ0≦2θ≦2θ1を定量測定スキャン範囲α≦2θ≦βと決める。一方、図3(b)に示すように、プロファイル中のピーク波形の低角側に妨害ピークPX1が発生している場合には、低角側を狭めた2θ2≦2θ≦2θ1の範囲、例えば11.5°≦2θ≦13.2°を定量測定スキャン範囲α≦2θ≦βと決める。他方、図3(c)に示すようにピーク波形の低角側及高角側の両方に妨害ピークPX1,PX2が発生している場合には、低角側及び高角側の両方を狭めた2θ2≦2θ≦2θ3の範囲、例えば11.5°≦2θ≦12.76°を定量測定スキャン範囲α≦2θ≦βと決める。なお、妨害ピークが発生するのは、被検試料中にカリオナイト以外の何等かの不純物質が存在することがあるからである。 The operator observes the display and determines a range α ≦ 2θ ≦ β to be quantified by integration. For example, as shown in FIG. 3A, when there is no disturbing peak over a wide range 2θ 0 ≦ 2θ ≦ 2θ 1 and the profile is clean, a quantitative measurement scan of the wide range 2θ 0 ≦ 2θ ≦ 2θ 1 is performed. The range α ≦ 2θ ≦ β is determined. On the other hand, as shown in FIG. 3B, when the interference peak PX1 occurs on the low angle side of the peak waveform in the profile, the range of 2θ 2 ≦ 2θ ≦ 2θ 1 with the low angle side narrowed. For example, 11.5 ° ≦ 2θ ≦ 13.2 ° is determined as the quantitative measurement scan range α ≦ 2θ ≦ β. On the other hand, as shown in FIG. 3C, when the interference peaks P X1 and P X2 occur on both the low angle side and the high angle side of the peak waveform, both the low angle side and the high angle side are narrowed. A range of 2θ 2 ≦ 2θ ≦ 2θ 3 , for example, 11.5 ° ≦ 2θ ≦ 12.76 ° is determined as a quantitative measurement scan range α ≦ 2θ ≦ β. The interference peak is generated because there may be some impurity other than karionite in the test sample.
以上のようにして、被検試料に対して定量測定スキャン範囲が決められると、作業者は図1(a)の入力装置8を通して、その定量測定スキャン範囲α≦2θ≦βを入力する。そして、その定量測定スキャン範囲は図2のステップS2においてCPU2(図1(a)参照)によって読み込まれる。次に、ステップS3において、回折線プロファイルに関して定量測定スキャン範囲α≦2θ≦βの積分強度I(α−β)が演算される。例えば、図3(a)の妨害ピークの無いプロファイルについては、広い範囲2θ0≦2θ≦2θ1の積分強度が演算され、図3(b)及び図3(c)のように定量測定スキャン範囲が狭められると、その狭められた範囲内の積分強度が演算される。
When the quantitative measurement scan range is determined for the test sample as described above, the operator inputs the quantitative measurement scan range α ≦ 2θ ≦ β through the
次に、ステップS4において、図1(b)の基底基準板19に関して、被検試料Sを透過することなく基底基準板19で回折した回折線の強度IZN0、及び被検試料Sを透過した後に基底基準板19で回折した回折線の強度IZNを測定する。そして、ステップS3において求められた積分強度I(α−β)を、これらのIZN0及びIZNに基づいてステップS5において補正する。補正後の積分強度をI’(α−β)と呼ぶことにする。この強度補正は、被検試料Sの量が多くなった場合のその被検試料SによるX線吸収の影響を補正して、正しい強度を提供するために行われるものである。この補正処理の詳細は特開平10−221275号公報に詳しく述べられているので、ここでの説明は省略する。
Next, in step S4, with respect to the
次に、ステップS6において検量線を新たに作成するか(YES)、あるいは予め求めてある検量線を使うか(NO)、を決める。予め求めてある検量線は、例えば図1(a)のメモリ3のファイル領域に記憶されている。検量線を新たに作成する場合には、後述するようにステップS7で検量線が作成される。検量線は、カオリナイト標準試料の重量が変化するのに伴ってカオリナイト標準試料の回折線プロファイルの積分強度がどのように変化するかを表した線であり、通常は直線によって表示される。 Next, in step S6, it is determined whether a new calibration curve is created (YES) or whether a calibration curve obtained in advance is used (NO). The calibration curve obtained in advance is stored, for example, in the file area of the memory 3 in FIG. When a new calibration curve is created, a calibration curve is created in step S7 as will be described later. The calibration curve is a line representing how the integrated intensity of the diffraction line profile of the kaolinite standard sample changes as the weight of the kaolinite standard sample changes, and is usually displayed as a straight line.
次に、ステップS8において、積分強度I’(α−β)を上記の検量線に代入することにより、被検試料S中に含まれるカオリナイトの重量(すなわち含有量)を求め、さらに、必要に応じてその重量を試料全量で除算して含有率(%)を算出する。以上により、所望の定量分析が終了する。 Next, in step S8, the weight (that is, the content) of kaolinite contained in the test sample S is obtained by substituting the integral intensity I ′ (α−β) into the calibration curve, and further necessary. According to the above, the content (%) is calculated by dividing the weight by the total amount of the sample. Thus, the desired quantitative analysis is completed.
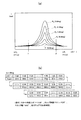
ところで、ステップS7で作成される検量線は基本的には次のようにして求められている。すなわち、測定物質であるカオリナイト単体を異なる重量で複数個、標準試料として用意し、個々の標準試料に対してX線回折測定を行って回折線プロファイル(例えば図4(a)のP1〜P5参照)を求め、さらに所定の積分範囲(例えば図4(a)のγ≦2θ≦δ参照)で積分強度を算出し、算出された積分強度とそれに対応するカオリナイト標準試料の既知の重量との関係を、グラフ(通常は、横軸=重量、縦軸=積分強度、図5(a),(b)参照)上にプロットし、最小二乗法等といた演算処理によりそれらのプロット点から直線を近似し、その直線を検量線としている。 By the way, the calibration curve created in step S7 is basically obtained as follows. That is, a plurality of simple substances kaolinite as measurement substances are prepared as standard samples with different weights, and X-ray diffraction measurement is performed on each standard sample to obtain diffraction line profiles (for example, P1 to P5 in FIG. 4A). And the integrated intensity is calculated in a predetermined integration range (for example, γ ≦ 2θ ≦ δ in FIG. 4A), and the calculated integrated intensity and the known weight of the kaolinite standard sample corresponding thereto are calculated. Are plotted on a graph (usually, the horizontal axis = weight, the vertical axis = integral intensity, see FIGS. 5A and 5B), and from the plotted points by an arithmetic process such as the least square method. A straight line is approximated and the straight line is used as a calibration curve.
従来の定量分析においては、測定対象である被検試料に関する定量測定スキャン範囲と同じ範囲を積分範囲(γ≦2θ≦δ)として回折線プロファイルの積分強度を算出し、その積分強度に基づいて検量線を作成していた。例えば、図3(a)、(b)、(c)のように定量測定スキャン範囲の設定が変化する場合には、図4(a)における回折線プロファイルP1〜P5の積分強度の算出範囲(すなわち積分範囲)γ≦2θ≦δもそれらに一致させて変化させていた。被検試料に対する定量測定スキャン範囲と、検量線作成時の標準試料に対する積分範囲とが異なっていると、正しい重量(すなわち含有量)が得られないからである。 In the conventional quantitative analysis, the integrated intensity of the diffraction line profile is calculated with the same range as the quantitative measurement scan range for the test sample to be measured as the integration range (γ ≦ 2θ ≦ δ), and the calibration is performed based on the integrated strength. I was creating a line. For example, when the setting of the quantitative measurement scan range changes as shown in FIGS. 3A, 3 </ b> B, and 3 </ b> C, the calculation range of the integrated intensity of the diffraction line profiles P <b> 1 to P <b> 5 in FIG. That is, the integration range) γ ≦ 2θ ≦ δ was also changed in accordance with them. This is because a correct weight (that is, content) cannot be obtained if the quantitative measurement scan range for the test sample is different from the integration range for the standard sample at the time of creating the calibration curve.
検量線作成用の標準試料の回折線プロファイルに対する積分範囲を、被検試料に対する定量測定スキャン範囲と同じに設定する場合、従来はその都度、カオリナイトから適宜の重量である複数の標準試料を使用し、X線回折測定を再び行って、検量線を作り直していた。しかしながら、この作業は非常に手間がかかるものであり、定量分析の作業効率を著しく低下させていた。本実施形態の定量分析方法では、以下に述べるような検量線の作成方法を用いることにより、定量分析の作業効率を大幅に向上している。以下、その検量線作成工程について図6のフローチャートを用いて説明する。このフローチャートは図2のステップS7をサブルーチンとして詳しく描いたものである。 When setting the integration range for the diffraction line profile of a standard sample for creating a calibration curve to be the same as the quantitative measurement scan range for the test sample, conventionally, multiple standard samples with appropriate weights from kaolinite are used each time. Then, X-ray diffraction measurement was performed again to recreate the calibration curve. However, this work is very time-consuming, and the work efficiency of quantitative analysis has been significantly reduced. In the quantitative analysis method of this embodiment, the work efficiency of quantitative analysis is greatly improved by using a calibration curve creation method as described below. Hereinafter, the calibration curve creation process will be described with reference to the flowchart of FIG. This flowchart shows step S7 in FIG. 2 in detail as a subroutine.
(検量線作成工程)
検量線作成工程にあたって作業者は、重量が異なっているカオリナイトの標準試料を複数、作成する。本実施形態では、重量m=0.06mg,0.49mg,1.08mg,3.10mg,5.30mgの5種類のカオリナイト標準試料を作成するものとする。具体的には、これらのカオリナイトをフィルタで捕獲して図1(b)に示す標準試料S0を作成し、それらを個々に試料ホルダ21に装着する。
(Calibration curve creation process)
In the calibration curve creation process, the operator creates a plurality of standard samples of kaolinite having different weights. In this embodiment, five types of kaolinite standard samples having weights m = 0.06 mg, 0.49 mg, 1.08 mg, 3.10 mg, and 5.30 mg are prepared. More specifically, the capturing these kaolinite filter to create a standard sample S 0 shown in FIG. 1 (b), attached to the sample holder 21 them individually.
次に、作業者は、図6のステップS11において、5種類の標準試料S0から選択した1つを試料ホルダ12ごと図1(b)の試料台17上の基底基準板19の上に設置する。そして、X線入射角度θをカオリナイトの回折角度θKに合わせる。そして、所定のステップ幅、例えば0.02°のステップ幅で標準試料S0をX線検出器16によって広いスキャン範囲(2θ0≦2θ≦2θ1)にわたってスキャン(走査)する。さらに、このスキャンの際に、各ステップ角度位置において2秒間、X線検出器16によって回折線強度(cps)を測定する。この測定により、図4(a)に示す回折線図形における5つの回折線強度プロファイルP1〜P5のうちの1つが測定結果として得られる。この回折線強度プロファイルには1つのピーク波形の全体が完全に含まれている。以上の処理を他の異なった重量の標準試料S0に対して行うことにより(ステップS12でNO)、図4(a)の5つのプロファイルP1〜P5の全てが測定される。
Next, the operator, in step S11 in FIG. 6, placed on the 5 kinds of
上記のスキャン範囲(2θ0≦2θ≦2θ1)は、1つのピーク波形の低角度側の一方の裾部から高角度側の他方の裾部までにわたる広い範囲であり、1つの指数ピーク波形を完全に包含する広い範囲である。本実施形態では、図3(a)に示す被検試料に対する通常の定量測定スキャン範囲である2θ0=11.0°から2θ1=13.2°の範囲と一致する広い範囲を検量線のためのスキャン範囲(2θ0≦2θ≦2θ1)とする。もちろん、測定対象の回折線プロファイル(又はピーク波形)が異なれば、それに応じてスキャン範囲も適宜の範囲に設定される。こうして、X線検出器16は11.0°≦2θ≦13.2°の広い回折角度範囲にわたってスキャンを行う。
The scan range (2θ 0 ≦ 2θ ≦ 2θ 1 ) is a wide range extending from one skirt on the low angle side to the other skirt on the high angle side of one peak waveform. It is a wide range that completely covers. In the present embodiment, a wide range corresponding to the range of 2θ 0 = 11.0 ° to 2θ 1 = 13.2 °, which is a normal quantitative measurement scan range for the test sample shown in FIG. Scanning range (2θ 0 ≦ 2θ ≦ 2θ 1 ). Of course, if the diffraction line profile (or peak waveform) to be measured is different, the scan range is set to an appropriate range accordingly. Thus, the
図1(a)のCPU2は、これらの回折線プロファイルを形成している各ステップ角度位置(2θ)における回折線強度(cps)の値をメモリ3内の所定領域に記憶する。CPU2はこの処理を重量の異なる全ての標準試料に対して繰り返して行う(ステップS12でNO)。これにより、図4(a)の5つのプロファイルP1〜P5の全てが求められ、メモリ内にはこれらのプロファイルを形成しているところのステップ幅0.02°ごとの回折線強度(cps)が記憶される。図4(b)は、その一例として、ピーク波形P3(m=1.08mg)を形成しているステップデータの具体例を示している。
The
全ての標準試料に対して回折線プロファイルが求められた後(ステップS12でYES)、作業者はステップS13において標準試料に関して積分強度の演算を行う。すなわち、まず、図2のステップS2において指示された被検試料についての定量測定スキャン範囲(α≦2θ≦β)と同じ範囲を積分強度の演算範囲(γ≦2θ≦δ)として設定する。この定量測定スキャン範囲は図3(a)、(b)、(c)を用いて説明したように、被検試料の回折線プロファイルの状態に応じて作業者によって決められた範囲である。 After diffraction line profiles have been obtained for all the standard samples (YES in step S12), the operator calculates the integrated intensity for the standard sample in step S13. That is, first, the same range as the quantitative measurement scan range (α ≦ 2θ ≦ β) for the test sample instructed in step S2 of FIG. 2 is set as the integral intensity calculation range (γ ≦ 2θ ≦ δ). As described with reference to FIGS. 3A, 3B, and 3C, the quantitative measurement scan range is a range determined by the operator according to the state of the diffraction line profile of the test sample.
次に、CPU2は、ステップS11でメモリに記憶した個々の回折線プロファイルP1〜P5の広い2θ範囲内のステップデータ値(図4(b)参照)に基づいて、被検試料の定量測定スキャン範囲(α≦2θ≦β)に適合した検量線を求めるための処理を行う。具体的には、まず、ステップデータ値(図4(b)参照)についての定量測定スキャン範囲(α≦2θ≦β)と同じ積分範囲(γ≦2θ≦δ)内での積分値を演算によって求める。例えば、被検試料の定量測定スキャン範囲が図3(a)のように広い範囲(11.0°〜13.2°)であれば、それと同じ範囲で図4(a)の標準試料の積分強度が演算される。また、被検試料の定量測定スキャン範囲が図3(b)のように低角度側で狭い範囲(11.5°〜13.2°)であれば、それと同じ範囲で標準試料の積分強度が演算される。さらに、被検試料の定量測定スキャン範囲が図3(c)のように低角側及び高角側の両方で狭い範囲(11.5°〜12.76°)であれば、それと同じ範囲で標準試料の積分強度が演算される。こうして求められた回折線プロファイルP1〜P5の個々についての積分強度をI1(γ−δ)〜I5(γ−δ)ということにする。これらの積分強度はメモリ内に記憶される。
Next, the
次に、ステップS14において、図1(b)の基底基準板19に関して、標準試料S0を透過することなく基底基準板19で回折した回折線の強度IZN0、及び標準試料S0を透過した後に基底基準板19で回折した回折線の強度IZNを測定する。そして、ステップS13において求められた積分強度I1(γ−δ)〜I5(γ−δ)を、これらのIZN0及びIZNに基づいてステップS15において補正する。補正後の積分強度をI’1(γ−δ)〜I’5(γ−δ)と呼ぶことにする。この強度補正は、標準試料S0のX線吸収率がそれらの重量が大きくなる側で大きくなることによる検量線の不正確性を補償するために行われるものである。既述の通り、この補正処理の詳細は特開平10−221275号公報に詳しく述べられている。
Next, in step S14, with respect to the
次に、ステップS16において、補正後の積分強度I’1(γ−δ)〜I’5(γ−δ)と、それらに対応した標準試料の重量m=0.06mg,0.49mg,1.08mg,3.10mg,5.30mgとを検量線グラフ(横軸=含有量、縦軸=積分強度)にプロットし、さらに最小二乗法等といった近似処理法を用いて直線である検量線を求める。例えば、被検試料の定量範囲が図3(a)に示すα=11.0°≦2θ≦β=13.2°のように広い場合、その定量測定スキャン範囲に適合する検量線として、
定量値=0.001521Y+0.055973 …… (1)
が得られた。
Next, in step S16, the corrected integral intensities I ′ 1 (γ−δ) to I ′ 5 (γ−δ) and the weights m of standard samples corresponding to them are 0.06 mg, 0.49 mg, 1 .08 mg, 3.10 mg, and 5.30 mg are plotted on a calibration curve graph (horizontal axis = content, vertical axis = integral intensity), and a calibration curve that is a straight line using an approximate processing method such as a least square method is used. Ask. For example, when the quantitative range of the test sample is as wide as α = 11.0 ° ≦ 2θ ≦ β = 13.2 ° shown in FIG. 3 (a), as a calibration curve suitable for the quantitative measurement scan range,
Quantitative value = 0.001521Y + 0.055973 (1)
was gotten.
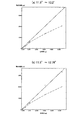
また、被検試料の定量測定スキャン範囲が図3(b)に示すα=11.5°≦2θ≦β=13.2°である場合、その定量測定スキャン範囲に適合する検量線として図5(a)に示す検量線が得られた。この検量線の式は、
定量値=0.001587Y+0.056982 …… (2)
であった。
When the quantitative measurement scan range of the test sample is α = 11.5 ° ≦ 2θ ≦ β = 13.2 ° shown in FIG. 3B, a calibration curve suitable for the quantitative measurement scan range is shown in FIG. The calibration curve shown in (a) was obtained. The equation for this calibration curve is
Quantitative value = 0.001587Y + 0.056982 (2)
Met.
また、被検試料の定量測定スキャン範囲が図3(c)に示すα=11.5°≦2θ≦β=12.76°である場合、その定量測定スキャン範囲に適合する検量線として図5(b)に示す検量線が得られた。この検量線の式は、
定量値=0.001692Y+0.049092 …… (3)
であった。
When the quantitative measurement scan range of the test sample is α = 11.5 ° ≦ 2θ ≦ β = 12.76 ° shown in FIG. 3C, a calibration curve suitable for the quantitative measurement scan range is shown in FIG. The calibration curve shown in (b) was obtained. The equation for this calibration curve is
Quantitative value = 0.001692Y + 0.049092 (3)
Met.
例えば、被検試料が図3(a)の特性(妨害ピークが存在しない)を有するものであり、この被検試料に対して上記(1)式の検量線を用いて定量を行ったところ、カオリナイトの含有率0.89%が得られた。この定量結果は、被検試料についての定量測定スキャン範囲(α≦2θ≦β)と標準試料の回折線プロファイルについての積分範囲(γ≦2θ≦δ)とが同じであるので、正しい値であると考えられる。 For example, the test sample has the characteristics shown in FIG. 3A (no interference peak), and the test sample was quantified using the calibration curve of the above formula (1). A kaolinite content of 0.89% was obtained. This quantitative result is correct because the quantitative measurement scan range (α ≦ 2θ ≦ β) for the test sample and the integral range (γ ≦ 2θ ≦ δ) for the diffraction line profile of the standard sample are the same. it is conceivable that.
また、被検試料が図3(b)の特性(低角度側に妨害ピークが存在する)を有するものであり、この被検試料に対して上記(2)式の検量線を用いて定量を行ったところ、カオリナイトの含有率0.90%が得られた。この定量結果も、被検試料についての定量測定スキャン範囲(α≦2θ≦β)と標準試料の回折線プロファイルについての積分範囲(γ≦2θ≦δ)とが同じであるので、正しい値であると考えられる。 In addition, the test sample has the characteristics shown in FIG. 3B (a disturbing peak is present on the low angle side), and the test sample is quantified using the calibration curve of the above formula (2). As a result, a kaolinite content of 0.90% was obtained. This quantitative result is also a correct value because the quantitative measurement scan range (α ≦ 2θ ≦ β) for the test sample and the integral range (γ ≦ 2θ ≦ δ) for the diffraction line profile of the standard sample are the same. it is conceivable that.
以上のように本実施形態によれば、図4(a)の標準カオリナイト試料の回折線プロファイルP1〜P5について積分強度を求める際、標準試料の調整、X線回折測定、積分強度演算を初めから繰り返して行うのではなく、図4(b)に示すような広いスキャン範囲(11.0°≦2θ≦13.2°)内でのステップ強度データを予めメモリに記憶しておき、被検試料についての定量測定スキャン範囲が図3(a)、(b)、(c)のように変更される場合には、その変更された定量測定スキャン範囲と同じ範囲を積分範囲と設定して上記メモリ内のステップ強度データに基づいて積分強度を演算し、その積分強度から検量線を作成することにした。従って、必要が生じたときに標準試料の調整、X線回折測定、及び積分強度演算の一連の処理を毎回行っていた従来の方法に比べて、検量線を非常に短時間に容易に作成できるようになり、そのため、定量分析を非常に短時間に容易に行うことができるようになった。 As described above, according to this embodiment, when obtaining the integrated intensity for the diffraction line profiles P1 to P5 of the standard kaolinite sample in FIG. 4A, the standard sample adjustment, X-ray diffraction measurement, and integral intensity calculation are first performed. Step intensity data within a wide scan range (11.0 ° ≦ 2θ ≦ 13.2 °) as shown in FIG. 4B is stored in the memory in advance, and the test is not repeated. When the quantitative measurement scan range for the sample is changed as shown in FIGS. 3A, 3B, and 3C, the same range as the changed quantitative measurement scan range is set as the integration range and The integrated intensity was calculated based on the step intensity data in the memory, and a calibration curve was created from the integrated intensity. Therefore, a calibration curve can be easily created in a very short time compared to the conventional method in which a series of processes of standard sample adjustment, X-ray diffraction measurement, and integral intensity calculation are performed each time a need arises. Therefore, quantitative analysis can be easily performed in a very short time.
(アスベストのX線回折定量分析方法及びX線回折定量分析装置の実施形態)
上記実施形態は、定量分析の対象である特定物質としてカオリナイトを考えた。以下に述べる本実施形態では定量分析の対象としてアスベストを考える。現在、大気中又は構造物に存在するアスベストの重量を正確且つ短時間に分析することが強く望まれている。本実施形態は、そのような要望に応えて、基底標準吸収補正法に基づいてアスベストの重量を分析するものである。
(Embodiment of X-ray diffraction quantitative analysis method and X-ray diffraction quantitative analysis apparatus of asbestos)
In the above embodiment, kaolinite is considered as a specific substance that is a target of quantitative analysis. In this embodiment described below, asbestos is considered as an object of quantitative analysis. At present, it is strongly desired to accurately and quickly analyze the weight of asbestos present in the atmosphere or in a structure. In the present embodiment, in response to such a request, the weight of asbestos is analyzed based on the basal standard absorption correction method.
本実施形態に係るX線回折定量分析装置及びそれに含まれる検量線作成装置の全体的な構成は図1(a)及び(b)に示した構成と同じである。また、定量分析プログラムソフトによって実行される制御の流れも基本的に図2及び図6に示したカオリナイトの場合と同じである。カオリナイトの場合には、図6のステップS11において図4(a)に示す回折線プロファイルP1〜P5が測定され、そして図4(b)に示すような回折線強度のステップデータがメモリに記憶された。本実施形態に係るアスベストの定量においては、これらのデータに違いがある。 The overall configuration of the X-ray diffraction quantitative analysis device and the calibration curve creation device included in the X-ray diffraction analysis device according to this embodiment is the same as the configuration shown in FIGS. The flow of control executed by the quantitative analysis program software is basically the same as in the case of kaolinite shown in FIGS. In the case of kaolinite, diffraction line profiles P1 to P5 shown in FIG. 4A are measured in step S11 of FIG. 6, and step data of diffraction line intensity as shown in FIG. 4B is stored in the memory. It was done. There is a difference between these data in the quantitative determination of asbestos according to the present embodiment.
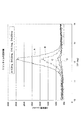
アスベストとしてはクリソタイル、アモサイト、クロシドライトの3種が良く知られている。クリソタイルの標準試料は図7に示すような特性を有している。また、アモサイトの標準試料は図8に示すような特性を有している。本実施形態では、これらの回折線プロファイルを規定しているステップ強度データ、例えばステップ幅0.02°ごとのステップ強度データであって1つのピーク波形を完全に含む広いスキャン範囲内のステップ強度データ(図4(b)参照、各データ値は異なる)、がメモリ内に記憶される。 Three types of asbestos are well known: chrysotile, amosite, and crocidolite. The standard sample of chrysotile has the characteristics shown in FIG. A standard sample of amosite has the characteristics shown in FIG. In the present embodiment, step intensity data defining these diffraction line profiles, for example, step intensity data for each step width of 0.02 °, and step intensity data within a wide scan range that completely includes one peak waveform. (See FIG. 4B, each data value is different) is stored in the memory.
そして、カオリナイトの実施形態の場合と同様にして、図7及び図8の標準アスベスト試料の回折線プロファイルA〜Eについて積分強度を求める際、標準試料の調整、X線回折測定、積分強度演算を初めから繰り返して行うのではなく、図4(b)に示すような広いスキャン範囲内でのステップ強度データを予めメモリに記憶しておき、被検試料についての定量測定スキャン範囲が図3(a)、(b)、(c)のように変更される場合には、その変更された定量測定スキャン範囲と同じ範囲を積分範囲と設定して上記メモリ内のステップ強度データに基づいて積分強度を演算し、その積分強度から検量線を作成することにした。 Then, as in the case of the kaolinite embodiment, when obtaining the integrated intensity for the diffraction line profiles A to E of the standard asbestos sample of FIGS. 7 and 8, adjustment of the standard sample, X-ray diffraction measurement, integral intensity calculation Is not performed repeatedly from the beginning, but step intensity data within a wide scan range as shown in FIG. 4B is stored in advance in the memory, and the quantitative measurement scan range for the test sample is shown in FIG. When changed as in a), (b), and (c), the integrated range is set based on the step intensity data in the memory by setting the same range as the changed quantitative measurement scan range as the integrated range. We decided to create a calibration curve from the integrated intensity.
従って、必要が生じたときに標準試料の調整、X線回折測定、及び積分強度演算の一連の処理を毎回行っていた従来の方法に比べて、検量線を非常に短時間に容易に正確に作成できるようになり、そのため、定量分析を非常に短時間に容易に行うことができるようになった。現在、アスベストの定量分析の需要は非常に大きくなっている。従来の定量分析方法では検量線作成のために多大な時間を費やさなければならなかったので、その大きな需要に十分に応えられていなかった。これに対し、本実施形態の定量分析方法によれば、検量線を極めて短時間に正確に作成でき、定量分析の時間を大幅に短縮できるので、大きな需要に十分に応えることができる。 Therefore, the calibration curve can be obtained easily and accurately in a very short time compared to the conventional method in which a series of processing of standard sample adjustment, X-ray diffraction measurement, and integral intensity calculation is performed each time a need arises. Therefore, quantitative analysis can be easily performed in a very short time. Currently, the demand for quantitative analysis of asbestos is very large. In the conventional quantitative analysis method, it has been necessary to spend a great deal of time for preparing a calibration curve, so that the large demand has not been sufficiently met. On the other hand, according to the quantitative analysis method of the present embodiment, a calibration curve can be created accurately in a very short time, and the time for quantitative analysis can be greatly shortened.
(その他の実施形態)
以上、好ましい実施形態を挙げて本発明を説明したが、本発明はその実施形態に限定されるものでなく、請求の範囲に記載した発明の範囲内で種々に改変できる。
(Other embodiments)
The present invention has been described with reference to the preferred embodiments. However, the present invention is not limited to the embodiments, and various modifications can be made within the scope of the invention described in the claims.
1.X線回折定量分析装置、 3.メモリ、 4.X線回折装置、 9.バス、
11.X線源、 12.発散スリット、 13.ゴニオメータ、 14.受光スリット、
16.X線検出器、 17.試料台、 19.基底基準板、 21.試料ホルダ、
S.被検試料、 S0.標準試料
1. 2. X-ray diffraction quantitative analyzer, Memory, 4. X-ray diffractometer, 9. bus,
11. X-ray source, 12. Divergent slit, 13. Goniometer, 14. Receiving slit,
16. X-ray detector, 17. Sample stage, 19. Base reference plate, 21. Sample holder,
S. Test sample, S 0 . Standard sample
Claims (6)
(a) 含有量が既知でありそれらの含有量が互いに異なっている複数の標準試料の個々に対して回折線強度プロファイルを求める標準試料測定工程と、
(b) 標準試料の回折線強度プロファイルに基づいて検量線を作成する検量線作成工程と、
(c) 被検試料をX線回折角度(2θ)に関してスキャン読取りすることによって回折線強度プロファイルを得る被検試料測定工程と、
(d) 被検試料の回折線強度プロファイルの積分量を前記検量線にあてはめて被検試料に含まれる物質の含有量を求める含有量判定工程と、
を有するX線回折定量分析方法において、
(e) 前記被検試料の回折線強度プロファイルに基づいて定量測定スキャン範囲を決める定量測定スキャン範囲決定工程と、
(f) 前記定量測定スキャン範囲決定工程で決められた定量測定スキャン範囲と同じ範囲を積分範囲と決定する積分範囲決定工程と、を有しており、
(g) 前記標準試料測定工程では、前記標準試料の回折線強度プロファイルのピーク波形の一方の裾領域から他方の裾領域にわたる広いスキャン範囲にわたって所定の読取りステップ幅で測定を行い、その読取りステップ幅ごとの回折線強度を標準試料ごとに記憶し、
(h) 本X線回折定量分析方法は、前記標準試料測定工程で記憶した複数の標準試料の個々に関する読取りステップ幅ごとの回折線強度のデータについて、前記積分範囲決定工程で決められた積分範囲における積分値を演算によって求める積分演算工程をさらに有しており、
(i) 前記検量線作成工程では、前記積分演算工程において求められた複数の標準試料についての積分値と、それらの積分値に対応する標準試料の既知の含有量とによって検量線を求め、
(j) 前記含有量判定工程では、前記被検試料測定工程において得られた回折線強度プロファイルに含まれているピーク波形における前記定量測定スキャン範囲内での積分量を求め、前記検量線に基づいて前記ピーク波形の積分量から被検試料内の物質の含有量を判定する
ことを特徴とするX線回折定量分析方法。 An X-ray diffraction quantitative analysis method for obtaining a content of a substance contained in a test sample based on X-ray diffraction,
(A) and the standard specimen measurement process determine the diffraction intensity profile for each of a plurality of standard samples in which the content of the content are known they are different from each other,
(B) a calibration curve creating step for creating a calibration curve based on the diffraction line intensity profile of the standard sample ;
(C) a test sample measurement step of obtaining a diffraction line intensity profile by scanning a test sample with respect to an X-ray diffraction angle (2θ) ;
(D) a content determination step for obtaining the content of a substance contained in the test sample by applying an integral amount of the diffraction line intensity profile of the test sample to the calibration curve ;
In the X-ray diffraction quantitative analysis method having
(E) a quantitative measurement scan range determining step for determining a quantitative measurement scan range based on a diffraction line intensity profile of the test sample ;
(F) an integration range determination step for determining the same range as the quantitative measurement scan range determined in the quantitative measurement scan range determination step as an integration range;
(G) wherein in the standard specimen measurement process performs a measurement at one of the skirt area over a wide scan range over the other skirt area predetermined reading step width of the peak waveform of the diffraction intensity profile of the standard sample, the reading Stores the diffraction line intensity for each step width for each standard sample,
(H) the X-ray diffraction quantitative analysis method, the data of the diffraction intensity of each individual regarding reading step widths of the plurality of standard samples stored in said standard specimen measurement process, as determined by the integral range determining step An integration calculation step of calculating an integral value in the integration range by calculation;
(I) In the calibration curve creating step, a calibration curve is obtained from the integration values for the plurality of standard samples obtained in the integration calculation step and the known contents of the standard samples corresponding to the integral values,
(J) In the content determination step , an integration amount within the quantitative measurement scan range in the peak waveform included in the diffraction line intensity profile obtained in the test sample measurement step is obtained, and based on the calibration curve And determining the content of the substance in the test sample from the integrated amount of the peak waveform.
前記被検試料測定工程では、前記標準試料測定工程と同じ読取りステップ幅で被検試料に対してX線回折角度(2θ)に関してのスキャン読取りを行って、その読取りステップ幅ごとの回折線強度を求め、In the test sample measuring step, the test sample is scanned with respect to the X-ray diffraction angle (2θ) with the same reading step width as in the standard sample measuring step, and the diffraction line intensity for each reading step width is obtained. Seeking
前記含有量判定工程では、求められた前記読取りステップ幅ごとの回折線強度に基づいて被検試料の回折線強度プロファイルの積分量を演算によって求めるIn the content determination step, the integral amount of the diffraction line intensity profile of the test sample is obtained by calculation based on the obtained diffraction line intensity for each reading step width.
ことを特徴とするX線回折定量分析方法。X-ray diffraction quantitative analysis method characterized by the above.
前記定量測定スキャン範囲決定工程においては、前記測定結果に妨害ピークが存在し、その妨害ピークを排除する範囲として前記定量測定スキャン範囲が決められる
ことを特徴とするX線回折定量分析方法。 The X-ray diffraction quantitative analysis method according to claim 1 or 2 ,
In the above quantitative measurement scanning range determining step, said measurement result is present interfering peaks, X-rays diffraction quantitative analysis method characterized in that the quantitative measurement scan range as a range to eliminate the interfering peaks are determined.
(a) 試料をX線検出器によってX線回折角度(2θ)に関してスキャン読取りするX線回折測定系と、
(b) データを入力する入力手段と、
(c) 画像を表示する表示手段と、
(d) 前記X線回折測定系を用いて被検試料についての回折線強度プロファイルを求める被検試料測定手段と、
(e) 前記被検試料測定手段によって求めた被検試料の回折線強度プロファイルを前記表示手段に表示し、前記入力手段を通して入力された定量測定スキャン範囲を第1の記憶手段に記憶させる定量測定スキャン範囲決定手段と、
(f) 前記被検試料の回折線強度プロファイルに含まれるピーク波形の積分量を物質の含有量に換算するための検量線を作成する検量線作成手段と、
(g) 前記被検試料測定手段を用いて得られた被検試料の回折線強度プロファイルに含まれているピーク波形の積分量を求め、前記検量線に基づいて前記ピーク波形の積分量から被検試料内の物質の含有量を判定する含有量判定手段と、を有しており、
(h) 前記検量線作成手段は、
(i)含有量が異なった複数の標準試料の個々に対して回折線強度プロファイルのピーク波形の一方の裾領域から他方の裾領域にわたる広いスキャン範囲にわたって所定の読取りステップ幅で前記X線回折測定系を用いて測定を行わせ、その読取りステップ幅ごとの回折線強度を標準試料ごとに第2の記憶手段に記憶させる標準試料ステップ測定手段と、
(ii)前記第2の記憶手段に記憶された複数の標準試料の個々に関する読取りステップ幅ごとの回折線強度データについて、前記定量測定スキャン範囲決定手段の第1の記憶手段に記憶された定量測定スキャン範囲と同じ範囲である積分範囲内での積分値を演算によって求める積分演算手段と、
(iii)前記積分演算手段によって求められた複数の標準試料についての積分値と、それらの積分値に対応する標準試料の既知の含有量とによって検量線を求める検量線演算手段と、
を有することを特徴とするX線回折定量分析装置。 An X-ray diffraction quantitative analyzer for measuring the content of a substance contained in a test sample based on X-ray diffraction,
(A) an X-ray diffraction measurement system that scans a sample with respect to an X-ray diffraction angle (2θ) by an X-ray detector;
(B) input means for inputting data ;
(C) display means for displaying an image ;
(D) a test sample measuring means for obtaining a diffraction line intensity profile for the test sample using the X-ray diffraction measurement system ;
(E) Quantitative measurement in which a diffraction line intensity profile of a test sample obtained by the test sample measuring unit is displayed on the display unit, and a quantitative measurement scan range input through the input unit is stored in a first storage unit Scanning range determination means;
(F) a calibration curve creating means for creating a calibration curve for converting the integral amount of the peak waveform included in the diffraction line intensity profile of the test sample into the content of the substance ;
(G) An integration amount of a peak waveform included in a diffraction line intensity profile of a test sample obtained by using the test sample measuring means is obtained, and a test sample is obtained from the integration amount of the peak waveform based on the calibration curve. Content determination means for determining the content of the substance in the test sample,
(H) The calibration curve creating means includes:
(I) The X-ray diffraction measurement with a predetermined reading step width over a wide scan range from one skirt region to the other skirt region of the peak waveform of the diffraction line intensity profile for each of a plurality of standard samples having different contents. A standard sample step measuring means for performing measurement using a system and storing the diffraction line intensity for each reading step width in the second storage means for each standard sample;
(Ii) Quantitative measurement stored in the first storage means of the quantitative measurement scan range determining means with respect to diffraction line intensity data for each reading step width relating to each of the plurality of standard samples stored in the second storage means Integration calculation means for calculating an integral value within an integration range that is the same range as the scan range ;
(Iii) a calibration curve calculation means for obtaining a calibration curve based on an integral value for a plurality of standard samples obtained by the integral calculation means and a known content of the standard sample corresponding to these integral values;
An X-ray diffraction quantitative analysis apparatus characterized by comprising:
(a) 重量が既知でありそれらの重量が互いに異なっている複数の標準アスベスト試料の個々に対して回折線強度プロファイルを求める標準試料測定工程と、
(b) 標準アスベスト試料の回折線強度プロファイルに基づいて検量線を作成する検量線作成工程と、
(c) 被検アスベスト試料をX線回折角度(2θ)に関してスキャン読取りすることによって回折線強度プロファイルを得る被検試料測定工程と、
(d) 被検アスベスト試料の回折線強度プロファイルの積分量を前記検量線にあてはめて被検アスベスト試料に含まれるアスベストの重量を求める重量判定工程と、
を有するアスベストのX線回折定量分析方法において、
(e) 前記被検アスベスト試料の回折線強度プロファイルに基づいて定量測定スキャン範囲を決める定量測定スキャン範囲決定工程と、
(f) 前記定量測定スキャン範囲決定工程で決められた定量測定スキャン範囲と同じ範囲を積分範囲と決定する積分範囲決定工程と、を有しており、
(g) 前記標準試料測定工程では、前記標準試料の回折線強度プロファイルのピーク波形の一方の裾領域から他方の裾領域にわたる広いスキャン範囲にわたって所定の読取りステップ幅で測定を行い、その読取りステップ幅ごとの回折線強度を標準アスベスト試料ごとに記憶し、
(h) 本アスベストのX線回折定量分析方法は、前記標準試料測定工程で記憶した複数の標準アスベスト試料の個々に関する読取りステップ幅ごとの回折線強度のデータについて、前記積分範囲決定工程で決められた積分範囲における積分値を演算によって求める積分演算工程をさらに有しており、
(i) 前記検量線作成工程では、前記積分演算工程において求められた複数の標準アスベスト試料についての積分値と、それらの積分値に対応する標準アスベスト試料の既知の重量とによって検量線を求め、
(j) 前記重量判定工程では、前記被検試料測定工程において得られた回折線強度プロファイルに含まれているピーク波形の前記定量測定スキャン範囲内での積分量を求め、前記検量線に基づいて前記ピーク波形の積分量から被検アスベスト試料内のアスベストの重量を判定する
ことを特徴とするアスベストのX線回折定量分析方法。 An asbestos X-ray diffraction quantitative analysis method for determining the weight of asbestos contained in a test asbestos sample based on X-ray diffraction,
(A) and weight are known constant process measurement standard specimen seek diffraction intensity profile for each of a plurality of standard asbestos samples their weight are different from each other,
(B) a calibration curve creating step for creating a calibration curve based on the diffraction line intensity profile of the standard asbestos sample ;
(C) a test sample measurement step of obtaining a diffraction line intensity profile by scanning a test asbestos sample with respect to an X-ray diffraction angle (2θ);
(D) a weight determination step for determining the weight of asbestos contained in the test asbestos sample by applying an integral amount of the diffraction line intensity profile of the test asbestos sample to the calibration curve ;
In the method of quantitative X-ray diffraction analysis of asbestos having
(E) a quantitative measurement scan range determining step for determining a quantitative measurement scan range based on a diffraction line intensity profile of the test asbestos sample ;
(F) an integration range determination step for determining the same range as the quantitative measurement scan range determined in the quantitative measurement scan range determination step as an integration range;
(G) wherein in the standard specimen measurement process performs a measurement at one of the skirt area over a wide scan range over the other skirt area predetermined reading step width of the peak waveform of the diffraction intensity profile of the standard sample, the reading Stores the diffraction line intensity for each step width for each standard asbestos sample,
(H) X-ray diffraction method for quantitative analysis of the asbestos, the data of the diffraction intensity of each individual regarding reading step widths of the plurality of standard asbestos samples stored at said standard specimen measurement process, in the integral range determining step An integration operation step of calculating an integration value in a predetermined integration range by calculation;
(I) In the calibration curve creation step, a calibration curve is obtained from the integral values for the plurality of standard asbestos samples obtained in the integration calculation step and the known weight of the standard asbestos sample corresponding to those integral values,
(J) In the weight determination step, an integration amount within the quantitative measurement scan range of the peak waveform included in the diffraction line intensity profile obtained in the test sample measurement step is obtained, and based on the calibration curve An asbestos X-ray diffraction quantitative analysis method, wherein the weight of asbestos in a test asbestos sample is determined from the integrated amount of the peak waveform.
(a) 被検アスベスト試料をX線検出器によってX線回折角度(2θ)に関してスキャン読取りするX線回折測定系と、
(b) データを入力する入力手段と、
(c) 画像を表示する表示手段と、
(d) 前記X線回折測定系を用いて被検アスベスト試料についての回折線強度プロファイルを求める被検試料測定手段と、
(e) 前記被検試料測定手段によって求めた被検アスベスト試料の回折線強度プロファイルを前記表示手段に表示し、前記入力手段を通して入力された定量測定スキャン範囲を第1の記憶手段に記憶させる定量測定スキャン範囲決定手段と、
(f) 前記被検アスベスト試料の回折線強度プロファイルに含まれるピーク波形の積分量をアスベストの重量に換算するための検量線を作成する検量線作成手段と、
(g) 前記被検試料測定手段を用いて得られた被検試料の回折線強度プロファイルに含まれているピーク波形の積分量を求め、前記検量線に基づいて前記ピーク波形の積分量から被検アスベスト試料内のアスベストの重量を判定する重量判定手段と、を有しており、
(h) 前記検量線作成手段は、
(i)アスベストの重量が異なっている複数の標準アスベスト試料の個々に対して回折線強度プロファイルのピーク波形の一方の裾領域から他方の裾領域にわたる広いスキャン範囲にわたって所定の読取りステップ幅で前記X線回折測定系を用いて測定を行わせ、その読取りステップ幅ごとの回折線強度を標準アスベスト試料ごとに第2の記憶手段に記憶させる標準試料ステップ測定手段と、
(ii)前記第2の記憶手段に記憶された複数の標準アスベスト試料の個々に関する読取りステップ幅ごとの回折線強度データについて、前記定量測定スキャン範囲決定手段の第1の記憶手段に記憶された定量測定スキャン範囲と同じ範囲である積分範囲内での積分値を演算によって求める積分演算手段と、
(iii)前記積分演算手段によって求められた複数の標準アスベスト試料についての積分値と、それらの積分値に対応する標準アスベスト試料の既知の重量とによって検量線を求める検量線演算手段と、
を有することを特徴とするアスベストのX線回折定量分析装置。 An asbestos X-ray diffraction quantitative analyzer for measuring the weight of asbestos contained in a test asbestos sample based on X-ray diffraction,
(A) an X-ray diffraction measurement system that scans a test asbestos sample with respect to an X-ray diffraction angle (2θ) by an X-ray detector;
(B) input means for inputting data ;
(C) display means for displaying an image ;
(D) a test sample measuring means for obtaining a diffraction line intensity profile for the test asbestos sample using the X-ray diffraction measurement system ;
(E) A quantification in which a diffraction line intensity profile of a test asbestos sample obtained by the test sample measurement means is displayed on the display means, and a quantitative measurement scan range input through the input means is stored in a first storage means. Measuring scan range determining means;
(F) a calibration curve creating means for creating a calibration curve for converting the integral amount of the peak waveform included in the diffraction line intensity profile of the test asbestos sample into the weight of asbestos ;
(G) An integration amount of a peak waveform included in a diffraction line intensity profile of a test sample obtained by using the test sample measuring means is obtained, and a test sample is obtained from the integration amount of the peak waveform based on the calibration curve. A weight determination means for determining the weight of asbestos in the test asbestos sample,
(H) The calibration curve creating means includes:
(I) With respect to each of a plurality of standard asbestos samples having different asbestos weights , the X with the predetermined reading step width over a wide scan range from one skirt region to the other skirt region of the peak waveform of the diffraction line intensity profile A standard sample step measurement means for performing measurement using a line diffraction measurement system and storing the diffraction line intensity for each reading step width in the second storage means for each standard asbestos sample;
(Ii) Quantitative data stored in the first storage means of the quantitative measurement scan range determining means with respect to diffraction line intensity data for each reading step width for each of the plurality of standard asbestos samples stored in the second storage means. An integral calculation means for calculating an integral value within an integral range that is the same range as the measurement scan range ;
(Iii) a calibration curve computing means for obtaining a calibration curve from the integral values for a plurality of standard asbestos samples obtained by the integral computing means and the known weight of the standard asbestos sample corresponding to those integral values;
An apparatus for quantitative analysis of X-ray diffraction of asbestos, comprising:
Priority Applications (1)
| Application Number | Priority Date | Filing Date | Title |
|---|---|---|---|
| JP2008006331A JP5259199B2 (en) | 2008-01-15 | 2008-01-15 | X-ray diffraction quantitative analysis method, X-ray diffraction quantitative analysis device, asbestos X-ray diffraction quantitative analysis method and asbestos X-ray diffraction quantitative analysis device |
Applications Claiming Priority (1)
| Application Number | Priority Date | Filing Date | Title |
|---|---|---|---|
| JP2008006331A JP5259199B2 (en) | 2008-01-15 | 2008-01-15 | X-ray diffraction quantitative analysis method, X-ray diffraction quantitative analysis device, asbestos X-ray diffraction quantitative analysis method and asbestos X-ray diffraction quantitative analysis device |
Publications (2)
| Publication Number | Publication Date |
|---|---|
| JP2009168584A JP2009168584A (en) | 2009-07-30 |
| JP5259199B2 true JP5259199B2 (en) | 2013-08-07 |
Family
ID=40969924
Family Applications (1)
| Application Number | Title | Priority Date | Filing Date |
|---|---|---|---|
| JP2008006331A Active JP5259199B2 (en) | 2008-01-15 | 2008-01-15 | X-ray diffraction quantitative analysis method, X-ray diffraction quantitative analysis device, asbestos X-ray diffraction quantitative analysis method and asbestos X-ray diffraction quantitative analysis device |
Country Status (1)
| Country | Link |
|---|---|
| JP (1) | JP5259199B2 (en) |
Families Citing this family (9)
| Publication number | Priority date | Publication date | Assignee | Title |
|---|---|---|---|---|
| JP5429058B2 (en) * | 2010-06-03 | 2014-02-26 | 新日鐵住金株式会社 | Quantitative analysis of ettringite in inorganic oxide materials |
| JP5598926B2 (en) | 2011-09-26 | 2014-10-01 | 株式会社リガク | X-ray diffraction measurement data analysis method |
| CN103076348A (en) * | 2012-12-29 | 2013-05-01 | 上海华碧检测技术有限公司 | Method for detecting content of asbestos in sample |
| KR102033718B1 (en) * | 2016-04-05 | 2019-11-08 | 주식회사 엘지화학 | Analytical method and system for weight ratio of mixture of graphite and soft carbon |
| CN111487266B (en) * | 2020-04-30 | 2023-10-13 | 江苏德源药业股份有限公司 | Method for quantitative determination of monohydrate crystalline form in pharmaceutical crystalline form of canagliflozin hemihydrate |
| CN113080850B (en) * | 2021-03-25 | 2022-08-02 | 苏州阿格斯医疗技术有限公司 | Method for measuring scanning range of optical interference tomography system |
| JP7515885B2 (en) | 2021-06-04 | 2024-07-16 | 株式会社リガク | Quantitative analysis device, method, program, and manufacturing management system |
| JP7553213B2 (en) * | 2021-07-27 | 2024-09-18 | 鹿島建設株式会社 | Asbestos content measurement method and device |
| CN119147813B (en) * | 2024-10-11 | 2025-03-11 | 成都玖锦科技有限公司 | Template test data generation method, device, equipment and storage medium |
Family Cites Families (4)
| Publication number | Priority date | Publication date | Assignee | Title |
|---|---|---|---|---|
| JPS63165742A (en) * | 1986-12-26 | 1988-07-09 | Shimadzu Corp | How to create a calibration curve |
| JP2930866B2 (en) * | 1994-05-25 | 1999-08-09 | 理学電機工業株式会社 | X-ray analysis method and apparatus used therefor |
| JP3312001B2 (en) * | 1998-09-18 | 2002-08-05 | 理学電機工業株式会社 | X-ray fluorescence analyzer |
| JP4315350B2 (en) * | 2005-08-30 | 2009-08-19 | 株式会社リガク | X-ray diffraction quantitative device |
-
2008
- 2008-01-15 JP JP2008006331A patent/JP5259199B2/en active Active
Also Published As
| Publication number | Publication date |
|---|---|
| JP2009168584A (en) | 2009-07-30 |
Similar Documents
| Publication | Publication Date | Title |
|---|---|---|
| JP5259199B2 (en) | X-ray diffraction quantitative analysis method, X-ray diffraction quantitative analysis device, asbestos X-ray diffraction quantitative analysis method and asbestos X-ray diffraction quantitative analysis device | |
| EP3064931B1 (en) | Quantitative x-ray analysis | |
| CN109216142B (en) | Electron probe microanalyzer and storage medium | |
| JP6232568B2 (en) | X-ray fluorescence analyzer | |
| JP4517323B2 (en) | Electron microanalyzer measurement data correction method | |
| JP6930737B2 (en) | Amorphous phase quantitative analyzer, amorphous phase quantitative analysis method, and amorphous phase quantitative analysis program | |
| WO2021161631A1 (en) | Quantitative analysis method, quantitative analysis program, and fluorescence x-ray analysis device | |
| Kulow et al. | A new experimental setup for time-and laterally-resolved X-ray absorption fine structure spectroscopy in a ‘single shot’ | |
| JP5959057B2 (en) | X-ray analyzer | |
| JP4499125B2 (en) | Quantitative analysis method in sample analyzer | |
| JP2013137298A (en) | X-ray analyzer | |
| JP6838754B1 (en) | X-ray fluorescence analyzer | |
| JP2007285786A (en) | X-ray analyzer using electron beam | |
| CN110132188A (en) | A Calculation Method of Coating Layer Thickness Based on Comprehensive Analysis of Multi-element X-ray Characteristic Spectrum | |
| Wegrzynek et al. | Micro-beam X-ray fluorescence and absorption imaging techniques at the IAEA Laboratories | |
| EP1521947B1 (en) | Scatter spectra method for x-ray fluorescent analysis with optical components | |
| JP2014041065A (en) | X-ray analyzer and computer program | |
| JP4930874B2 (en) | Energy dispersive radiation detection system and target element content measurement method | |
| JP7613328B2 (en) | How to select ore, how to create a calibration curve, how to update the calibration curve, and how to analyze ore | |
| JP3950619B2 (en) | Surface analysis data display method in surface analyzer using electron beam | |
| CN116507943A (en) | Fluorescent X-ray Analysis Device | |
| JP3236838B2 (en) | X-ray fluorescence analysis method and apparatus | |
| JP2008089325A (en) | Geological dating method using electron probe microanalyzer | |
| JP6713110B2 (en) | Background removal method and X-ray fluorescence analyzer | |
| CN117460950B (en) | Fluorescence X-ray analysis device |
Legal Events
| Date | Code | Title | Description |
|---|---|---|---|
| A621 | Written request for application examination |
Free format text: JAPANESE INTERMEDIATE CODE: A621 Effective date: 20100630 |
|
| A977 | Report on retrieval |
Free format text: JAPANESE INTERMEDIATE CODE: A971007 Effective date: 20120330 |
|
| A131 | Notification of reasons for refusal |
Free format text: JAPANESE INTERMEDIATE CODE: A131 Effective date: 20120815 |
|
| A521 | Request for written amendment filed |
Free format text: JAPANESE INTERMEDIATE CODE: A523 Effective date: 20121015 |
|
| TRDD | Decision of grant or rejection written | ||
| A01 | Written decision to grant a patent or to grant a registration (utility model) |
Free format text: JAPANESE INTERMEDIATE CODE: A01 Effective date: 20130422 |
|
| A61 | First payment of annual fees (during grant procedure) |
Free format text: JAPANESE INTERMEDIATE CODE: A61 Effective date: 20130424 |
|
| FPAY | Renewal fee payment (event date is renewal date of database) |
Free format text: PAYMENT UNTIL: 20160502 Year of fee payment: 3 |
|
| R150 | Certificate of patent or registration of utility model |
Free format text: JAPANESE INTERMEDIATE CODE: R150 Ref document number: 5259199 Country of ref document: JP Free format text: JAPANESE INTERMEDIATE CODE: R150 |
|
| R250 | Receipt of annual fees |
Free format text: JAPANESE INTERMEDIATE CODE: R250 |
|
| R250 | Receipt of annual fees |
Free format text: JAPANESE INTERMEDIATE CODE: R250 |
|
| R250 | Receipt of annual fees |
Free format text: JAPANESE INTERMEDIATE CODE: R250 |
|
| R250 | Receipt of annual fees |
Free format text: JAPANESE INTERMEDIATE CODE: R250 |
|
| R250 | Receipt of annual fees |
Free format text: JAPANESE INTERMEDIATE CODE: R250 |
|
| R250 | Receipt of annual fees |
Free format text: JAPANESE INTERMEDIATE CODE: R250 |
|
| SG99 | Written request for registration of restore |
Free format text: JAPANESE INTERMEDIATE CODE: R316G99 |
|
| R350 | Written notification of registration of transfer |
Free format text: JAPANESE INTERMEDIATE CODE: R350 |
|
| SG99 | Written request for registration of restore |
Free format text: JAPANESE INTERMEDIATE CODE: R316G99 |
|
| R350 | Written notification of registration of transfer |
Free format text: JAPANESE INTERMEDIATE CODE: R350 |
|
| S803 | Written request for registration of cancellation of provisional registration |
Free format text: JAPANESE INTERMEDIATE CODE: R316805 |
|
| R250 | Receipt of annual fees |
Free format text: JAPANESE INTERMEDIATE CODE: R250 |
|
| R350 | Written notification of registration of transfer |
Free format text: JAPANESE INTERMEDIATE CODE: R350 |
|
| S803 | Written request for registration of cancellation of provisional registration |
Free format text: JAPANESE INTERMEDIATE CODE: R316805 |
|
| R350 | Written notification of registration of transfer |
Free format text: JAPANESE INTERMEDIATE CODE: R350 |
|
| R250 | Receipt of annual fees |
Free format text: JAPANESE INTERMEDIATE CODE: R250 |
|
| R250 | Receipt of annual fees |
Free format text: JAPANESE INTERMEDIATE CODE: R250 |
|
| R250 | Receipt of annual fees |
Free format text: JAPANESE INTERMEDIATE CODE: R250 |