JP5242335B2 - Image processing apparatus, endoscope apparatus, endoscope system, and program - Google Patents
Image processing apparatus, endoscope apparatus, endoscope system, and program Download PDFInfo
- Publication number
- JP5242335B2 JP5242335B2 JP2008273430A JP2008273430A JP5242335B2 JP 5242335 B2 JP5242335 B2 JP 5242335B2 JP 2008273430 A JP2008273430 A JP 2008273430A JP 2008273430 A JP2008273430 A JP 2008273430A JP 5242335 B2 JP5242335 B2 JP 5242335B2
- Authority
- JP
- Japan
- Prior art keywords
- gauge
- points
- plane
- measurement
- point
- Prior art date
- Legal status (The legal status is an assumption and is not a legal conclusion. Google has not performed a legal analysis and makes no representation as to the accuracy of the status listed.)
- Expired - Fee Related
Links
- 238000012545 processing Methods 0.000 title claims description 94
- 238000004364 calculation method Methods 0.000 claims description 52
- 238000003384 imaging method Methods 0.000 claims description 38
- 230000002093 peripheral effect Effects 0.000 claims description 33
- 230000007274 generation of a signal involved in cell-cell signaling Effects 0.000 claims description 16
- 230000005540 biological transmission Effects 0.000 claims description 8
- 238000005259 measurement Methods 0.000 description 188
- 238000000034 method Methods 0.000 description 136
- 230000008569 process Effects 0.000 description 104
- 239000013598 vector Substances 0.000 description 35
- 230000007613 environmental effect Effects 0.000 description 25
- 230000008859 change Effects 0.000 description 20
- 238000012986 modification Methods 0.000 description 20
- 230000004048 modification Effects 0.000 description 20
- 230000003287 optical effect Effects 0.000 description 19
- 238000004891 communication Methods 0.000 description 17
- 238000003780 insertion Methods 0.000 description 15
- 230000037431 insertion Effects 0.000 description 15
- 230000014509 gene expression Effects 0.000 description 12
- 230000006870 function Effects 0.000 description 10
- 230000004044 response Effects 0.000 description 7
- 230000005236 sound signal Effects 0.000 description 5
- 238000012935 Averaging Methods 0.000 description 3
- 238000005452 bending Methods 0.000 description 3
- 238000010586 diagram Methods 0.000 description 3
- 239000004973 liquid crystal related substance Substances 0.000 description 3
- 238000012937 correction Methods 0.000 description 2
- 230000007423 decrease Effects 0.000 description 2
- 230000010365 information processing Effects 0.000 description 2
- 230000007704 transition Effects 0.000 description 2
- 230000004913 activation Effects 0.000 description 1
- 239000002131 composite material Substances 0.000 description 1
- 238000012790 confirmation Methods 0.000 description 1
- 238000005260 corrosion Methods 0.000 description 1
- 230000007797 corrosion Effects 0.000 description 1
- 238000013461 design Methods 0.000 description 1
- 230000000694 effects Effects 0.000 description 1
- 238000005286 illumination Methods 0.000 description 1
- 238000007689 inspection Methods 0.000 description 1
- 238000012544 monitoring process Methods 0.000 description 1
- 238000003672 processing method Methods 0.000 description 1
- 239000000126 substance Substances 0.000 description 1
- 230000002194 synthesizing effect Effects 0.000 description 1
- 230000009466 transformation Effects 0.000 description 1
- 238000010200 validation analysis Methods 0.000 description 1
- 230000000007 visual effect Effects 0.000 description 1
- XLYOFNOQVPJJNP-UHFFFAOYSA-N water Substances O XLYOFNOQVPJJNP-UHFFFAOYSA-N 0.000 description 1
Images


Description
本発明は、被写体を撮像して得られた映像信号を処理する画像処理装置、内視鏡装置、内視鏡システム、およびプログラムに関する。 The present invention relates to an image processing apparatus, an endoscope apparatus, an endoscope system, and a program that process a video signal obtained by imaging a subject.
工業用内視鏡は、ボイラー、タービン、エンジン、化学プラント、水道配管等の内部の傷や腐食等の観察や検査に使用されている。工業用内視鏡では、多様な観察物を観察および検査することができるようにするため、複数種類の光学アダプタが用意されており、内視鏡の先端部分は交換可能となっている。 Industrial endoscopes are used for observation and inspection of internal scratches and corrosion of boilers, turbines, engines, chemical plants, water pipes, and the like. In an industrial endoscope, a plurality of types of optical adapters are prepared so that various observation objects can be observed and inspected, and the distal end portion of the endoscope is replaceable.
上記の光学アダプタとして、観察光学系が左右2つの視野を形成するステレオ光学アダプタがある。特許文献1には、ステレオ光学アダプタを使用し、被写体像を左右の光学系で捉えたときの左右の光学系測距点の座標に基づいて、三角測量の原理を使用して被写体の三次元空間座標を求め、ライブ状態の撮影画像から被写体距離をリアルタイムでユーザに提供する内視鏡装置が記載されている。
しかし、特許文献1に記載された内視鏡装置では、ユーザが被写体距離を知ることはできるが、実際に被写体の詳細な計測を行うまで、画像の奥行き方向の被写体の傾き(画像内で手前の方にある被写体の部分と奥の方にある被写体の部分とがなす空間的な傾き)は分からなかった。また、被写体の大きさも分からなかった。
However, in the endoscope apparatus described in
本発明は、上述した課題に鑑みてなされたものであって、画像の奥行き方向の被写体の傾きをユーザに知らせることができる画像処理装置、内視鏡装置、内視鏡システム、およびプログラムを提供することを第1の目的とする。また、本発明は、画像の奥行き方向の被写体の傾きと共に被写体の大きさをユーザに知らせることができる画像処理装置、内視鏡装置、内視鏡システム、およびプログラムを提供することを第2の目的とする。 The present invention has been made in view of the above-described problems, and provides an image processing device, an endoscope device, an endoscope system, and a program capable of notifying the user of the inclination of the subject in the depth direction of the image. This is the first purpose. The second aspect of the present invention also provides an image processing apparatus, an endoscope apparatus, an endoscope system, and a program capable of notifying the user of the size of the subject together with the inclination of the subject in the depth direction of the image. Objective.
本発明は、上記の課題を解決するためになされたもので、被写体を撮像して得られた画像における画像座標に対応した前記被写体上の3次元座標を算出する座標算出部と、前記座標算出部によって算出された、基準点を含む3点以上のサンプル点の3次元座標から平面を算出する平面算出部と、前記平面上の、複数のゲージ目盛り点の3次元座標に基づいて、前記基準点から所定の3次元距離を有する位置を示すゲージを表示するための表示信号を生成する表示信号生成部と、を備え、前記平面算出部は、前記3点以上のサンプル点の3次元座標から前記基準点を通る2本の空間直線を算出し、前記2本の空間直線に基づいて前記平面を算出し、前記表示信号生成部は、前記2本の空間直線の一方上に設定された、前記基準点からの3次元距離が等しい2点の3次元座標に基づいて、前記ゲージを表示するための前記表示信号を生成することを特徴とする画像処理装置である。 The present invention has been made to solve the above-described problem, and includes a coordinate calculation unit that calculates three-dimensional coordinates on the subject corresponding to image coordinates in an image obtained by imaging the subject, and the coordinate calculation. A plane calculation unit that calculates a plane from the three-dimensional coordinates of three or more sample points including the reference point calculated by the unit, and the reference based on the three-dimensional coordinates of a plurality of gauge scale points on the plane A display signal generation unit that generates a display signal for displaying a gauge indicating a position having a predetermined three-dimensional distance from the point, and the plane calculation unit calculates the three-dimensional coordinates of the three or more sample points. Two spatial straight lines passing through the reference point are calculated, the plane is calculated based on the two spatial straight lines, and the display signal generation unit is set on one of the two spatial straight lines. 3D distance from the reference point Based on the three-dimensional coordinates are equal two points, an image processing apparatus and generates said display signal for displaying the gauge.
また、本発明は、被写体を撮像し撮像信号を生成する電子内視鏡と、前記撮像信号に基づいて映像信号を生成する映像信号生成部と、前記映像信号に基づく画像における画像座標に対応した前記被写体上の3次元座標を算出する座標算出部と、前記座標算出部によって算出された、基準点を含む3点以上のサンプル点の3次元座標から平面を算出する平面算出部と、前記平面上の、複数のゲージ目盛り点の3次元座標に基づいて、前記基準点から所定の3次元距離を有する位置を示すゲージを表示するための表示信号を生成する表示信号生成部と、を備え、前記平面算出部は、前記3点以上のサンプル点の3次元座標から前記基準点を通る2本の空間直線を算出し、前記2本の空間直線に基づいて前記平面を算出し、前記表示信号生成部は、前記2本の空間直線の一方上に設定された、前記基準点からの3次元距離が等しい2点の3次元座標に基づいて、前記ゲージを表示するための前記表示信号を生成することを特徴とする内視鏡装置である。 In addition, the present invention corresponds to an electronic endoscope that images a subject and generates an imaging signal, a video signal generation unit that generates a video signal based on the imaging signal, and image coordinates in an image based on the video signal A coordinate calculation unit for calculating three-dimensional coordinates on the subject, a plane calculation unit for calculating a plane from three-dimensional coordinates of three or more sample points including a reference point calculated by the coordinate calculation unit, and the plane A display signal generation unit that generates a display signal for displaying a gauge indicating a position having a predetermined three-dimensional distance from the reference point based on the three-dimensional coordinates of the plurality of gauge scale points ; The plane calculating unit calculates two spatial straight lines passing through the reference point from three-dimensional coordinates of the three or more sample points, calculates the plane based on the two spatial straight lines, and displays the display signal. The generator is Serial set on two one space straight, based on the three-dimensional coordinates of three-dimensional distance equal two points from the reference point, generates said display signal for displaying the gauge Is an endoscope apparatus.
また、本発明は、内視鏡装置および画像処理装置を備えた内視鏡システムであって、前記内視鏡装置は、被写体を撮像し撮像信号を生成する電子内視鏡と、前記撮像信号に基づいて映像信号を生成する映像信号生成部と、前記映像信号を外部へ送信する送信部と、を有し、前記画像処理装置は、前記映像信号を受信する受信部と、前記映像信号に基づく画像における画像座標に対応した前記被写体上の3次元座標を算出する座標算出部と、前記座標算出部によって算出された、基準点を含む3点以上のサンプル点の3次元座標から平面を算出する平面算出部と、前記平面上の、複数のゲージ目盛り点の3次元座標に基づいて、前記基準点から所定の3次元距離を有する位置を示すゲージを表示するための表示信号を生成する表示信号生成部と、を有し、前記平面算出部は、前記3点以上のサンプル点の3次元座標から前記基準点を通る2本の空間直線を算出し、前記2本の空間直線に基づいて前記平面を算出し、前記表示信号生成部は、前記2本の空間直線の一方上に設定された、前記基準点からの3次元距離が等しい2点の3次元座標に基づいて、前記ゲージを表示するための前記表示信号を生成することを特徴とする内視鏡システムである。 The present invention is also an endoscope system including an endoscope apparatus and an image processing apparatus, wherein the endoscope apparatus images an object and generates an imaging signal; and the imaging signal A video signal generation unit that generates a video signal based on the video signal, and a transmission unit that transmits the video signal to the outside. The image processing apparatus includes: a reception unit that receives the video signal; and the video signal A coordinate calculation unit that calculates three-dimensional coordinates on the subject corresponding to image coordinates in a base image, and a plane is calculated from the three-dimensional coordinates of three or more sample points including a reference point calculated by the coordinate calculation unit And a display for generating a display signal for displaying a gauge indicating a position having a predetermined three-dimensional distance from the reference point based on three-dimensional coordinates of a plurality of gauge scale points on the plane. With signal generator Have a, the plane calculating unit calculates the two spatial straight line passing through the reference point from the three-dimensional coordinates of the three points or more sample points, calculating the plane based on the spatial straight line of the two The display signal generator is configured to display the gauge based on the three-dimensional coordinates of two points set on one of the two space straight lines and having the same three-dimensional distance from the reference point. An endoscope system that generates a display signal .
また、本発明は、被写体を撮像して得られた画像における画像座標に対応した前記被写体上の3次元座標を算出する座標算出部と、前記座標算出部によって算出された、基準点を含む3点以上のサンプル点の3次元座標から平面を算出する平面算出部と、前記平面上の、複数のゲージ目盛り点の3次元座標に基づいて、前記基準点から所定の3次元距離を有する位置を示すゲージを表示するための表示信号を生成する表示信号生成部と、としてコンピュータを機能させるためのプログラムであって、前記平面算出部は、前記3点以上のサンプル点の3次元座標から前記基準点を通る2本の空間直線を算出し、前記2本の空間直線に基づいて前記平面を算出し、前記表示信号生成部は、前記2本の空間直線の一方上に設定された、前記基準点からの3次元距離が等しい2点の3次元座標に基づいて、前記ゲージを表示するための前記表示信号を生成することを特徴とするプログラムである。 The present invention also includes a coordinate calculation unit that calculates three-dimensional coordinates on the subject corresponding to image coordinates in an image obtained by imaging the subject, and a reference point calculated by the coordinate calculation unit. A plane calculation unit that calculates a plane from three-dimensional coordinates of sample points that are equal to or greater than a point, and a position having a predetermined three-dimensional distance from the reference point based on the three-dimensional coordinates of a plurality of gauge scale points on the plane A display signal generation unit for generating a display signal for displaying a gauge to be displayed, and a program for causing a computer to function as the plane calculation unit, wherein the plane calculation unit calculates the reference from three-dimensional coordinates of the three or more sample points. The two spatial straight lines passing through the points are calculated, the plane is calculated based on the two spatial straight lines, and the display signal generating unit is set on one of the two spatial straight lines. Dot Based on the three-dimensional coordinates of three-dimensional distance equal two points, which is a program and generates said display signal for displaying the gauge.
上記において、括弧で括った部分の記述は、後述する本発明の実施形態と本発明の構成要素とを便宜的に対応付けるためのものであり、この記述によって本発明の内容が限定されるわけではない。 In the above description, the description in parentheses is for the purpose of associating the embodiment of the present invention described later with the components of the present invention for convenience, and the contents of the present invention are not limited by this description. Absent.
本発明によれば、被写体の表面を近似する平面上の複数点の空間座標に対応した複数点の画像座標で決まる位置に図形を表示するための表示信号が生成される。この図形の形状は、画像の奥行き方向の被写体の傾きを反映したものとなるので、画像の奥行き方向の被写体の傾きをユーザに知らせることができる。 According to the present invention, a display signal for displaying a figure at a position determined by a plurality of image coordinates corresponding to a plurality of spatial coordinates on a plane approximating the surface of a subject is generated. Since the shape of the graphic reflects the inclination of the subject in the depth direction of the image, the user can be informed of the inclination of the subject in the depth direction of the image.
また、本発明によれば、所定距離だけ離れた2点の空間座標に対応した画像座標の位置に図形を表示するための表示信号が生成される。この図形から把握される2点間の距離が被写体の大きさの基準となるので、被写体の大きさをユーザに知らせることができる。 In addition, according to the present invention, a display signal for displaying a graphic at the position of image coordinates corresponding to two spatial coordinates separated by a predetermined distance is generated. Since the distance between two points grasped from this figure is a reference for the size of the subject, the size of the subject can be notified to the user.
以下、図面を参照し、本発明の実施形態を説明する。図1は、本実施形態による内視鏡システムの全体構成を示している。本内視鏡システムは、内視鏡装置1と、それに搭載された挿入部2と、タービンブレード等の計測対象物3と、通信回線であるネットワーク4(LANやインターネット等)と、情報通信端末であるPC(パーソナルコンピュータ)5とから構成されている。
Hereinafter, embodiments of the present invention will be described with reference to the drawings. FIG. 1 shows the overall configuration of the endoscope system according to the present embodiment. The endoscope system includes an
本内視鏡システムによれば、挿入部2において撮像された計測対象物(被写体)の画像(以下、内視鏡画像とする)を、ネットワーク4を介して、PC5に受信させることができる。さらに、PC5に記憶されたソフトウェアを使用することで、ユーザは、受信した内視鏡画像をリアルタイムで閲覧することができ、さらにその内視鏡画像に対してゲージ計測を行うことができる。ゲージ計測とは、ステレオ計測と呼ばれる3次元計測機能を応用して、計測対象物の3次元の傾きや大きさを示すゲージ(定規)を画像上に重畳表示した状態で、ユーザがそのゲージを参照して計測対象物のサイズを測る機能のことである。ゲージ計測の詳細については、後述する。
According to the present endoscope system, an image of a measurement target (subject) (hereinafter referred to as an endoscopic image) captured by the
以下、内視鏡装置1およびPC5の構成を説明する。まず、内視鏡装置1の構成を説明する。
Hereinafter, configurations of the
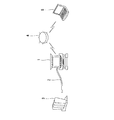
図2は、本実施形態による内視鏡装置1の構成を示している。図2に示すように、内視鏡装置1は、挿入部2と、光学アダプタ11a,11b,11cと、コントロールユニット101と、リモートコントローラ102(入力部)と、液晶モニタ103と、内視鏡ユニット104と、CCU(カメラコントロールユニット)105と、制御ユニット106とから構成されている。
FIG. 2 shows a configuration of the
細長の挿入部2は、計測対象物を撮像し撮像信号を生成する電子内視鏡を構成している。挿入部2は、先端側から順に、硬質な先端部21と、例えば上下左右に湾曲可能な湾曲部22と、柔軟性を有する可撓管部23とを連設して構成されている。挿入部2の基端部は内視鏡ユニット104に接続されている。先端部21は、観察視野を2つ有するステレオ用の光学アダプタ11a,11b(以下、ステレオ光学アダプタと記載)あるいは観察視野が1つだけの通常観察光学アダプタ11c等、各種の光学アダプタが例えば螺合によって着脱自在な構成になっている。
The
コントロールユニット101は、内視鏡ユニット104と、CCU105と、制御ユニット106とを内部に備えている。内視鏡ユニット104は、観察時に必要な照明光を供給する光源装置と、挿入部2を構成する湾曲部22を湾曲させる湾曲装置とを備えている。CCU105は、挿入部2の先端部21に内蔵されている固体撮像素子2aから出力された撮像信号を入力し、これをNTSC信号等の映像信号に変換して制御ユニット106に供給する。
The
制御ユニット106は、音声信号処理回路107と、映像信号処理回路108と、ROM109と、RAM110と、PCカードI/F(PCカードインターフェース)111と、USB I/F(USBインターフェース)112と、RS−232C I/F(RS−232Cインターフェース)113と、計測処理部114と、ネットワークI/F(ネットワークインターフェース)115と、EEPROM116とから構成されている。
The
マイク34によって集音された音声信号や、メモリカード等の記録媒体を再生して得られる音声信号、あるいは計測処理部114によって生成された音声信号が音声信号処理回路107に供給される。映像信号処理回路108は、CCU105から供給された内視鏡画像とグラフィックによる操作メニューとを合成した合成画像を表示するために、CCU105からの映像信号を、計測処理部114の制御により生成される操作メニュー等のためのグラフィック画像信号と合成する処理を行う。また、映像信号処理回路108は、液晶モニタ103の画面上に映像を表示するために合成後の映像信号に所定の処理を施して液晶モニタ103に供給する。
An audio signal collected by the
PCカードI/F111は、PCMCIAメモリカード32やフラッシュメモリカード33等のメモリカード(記録媒体)を自由に着脱できるようになっている。メモリカードを装着することにより、計測処理部114の制御に従って、このメモリカードに記憶されている制御処理情報や、画像情報、各種光学アダプタの光学情報である光学データ等を取り込んだり、制御処理情報や、画像情報、光学データ等をメモリカードに記録したりすることができる。
The PC card I / F 111 can freely attach and detach memory cards (recording media) such as the PCMCIA
USB I/F112は、コントロールユニット101とPC31とを電気的に接続するためのインターフェースである。このUSB I/F112を介してコントロールユニット101とPC31とを電気的に接続することにより、PC31側で内視鏡画像の表示の指示や計測時における画像処理等の各種の制御指示を行うことが可能となる。また、コントロールユニット101とPC31との間で各種の処理情報やデータを入出力することが可能となる。
The USB I / F 112 is an interface for electrically connecting the
RS−232C I/F113には、CCU105および内視鏡ユニット104が接続されると共に、これらCCU105や内視鏡ユニット104等の制御および動作指示を行うリモートコントローラ102が接続されている。ユーザがリモートコントローラ102を操作すると、その操作内容に基づいて、CCU105および内視鏡ユニット104を動作制御する際に必要な通信が行われる。
The RS-232C I /
計測処理部114は、ROM109に格納されているプログラムを実行することによって、映像信号処理回路108から映像信号を取り込み、映像信号に基づいて計測処理を実行する。RAM110は、計測処理部114によって、データの一時格納用の作業領域として使用される。
The measurement processing unit 114 executes a program stored in the
ネットワークI/F115は、ネットワーク4と有線または無線で接続し、ネットワーク通信を行うためのインターフェースである。ネットワークI/F115がネットワーク4と有線で接続する場合、ネットワークI/F115に設けられたコネクタにネットワークケーブル(LANケーブルやインターネットケーブル等)を接続することによって、ネットワーク通信を行うことが可能となる。また、ネットワークI/F115がネットワーク4と無線で接続する場合は、ネットワークI/F115に設けられたアンテナ(無線LAN等)によって、ネットワーク通信を行うことが可能となる。このネットワーク4を介して、ネットワークI/F115と、後述するPC5のネットワークI/Fとを接続することにより、内視鏡装置1とPC5との間でネットワーク通信が可能となり、各種データを送受信することができる。
The network I /
内視鏡装置1とPC5との間で送受信されるデータとして、ネットワークアドレス、環境データ、画像データの3種類がある。ネットワークアドレスは、内視鏡装置ごとに割り当てられた固有のアドレスであり、文字列データとしてEEPROM116に記憶されている。内視鏡装置1は、PC5からネットワーク接続要求を受信すると、そのネットワーク接続要求に含まれるネットワークアドレスが、EEPROM116に記憶されたネットワークアドレスと一致しているか否かを確認し、さらにその応答として、接続が正常に行われたかどうかをPC5に対して送信する。
As data transmitted / received between the
環境データは、ステレオ計測を行う際に使用するデータであり、ステレオ光学アダプタの光学的歪みを補正するためのデータ等が含まれる。環境データは、特開2001−275934号公報に記載されているものと同様である。環境データもネットワークアドレスと同様にEEPROM116に記憶されている。内視鏡装置1は、PC5からの環境データ送信要求を受信すると、その応答として、EEPROM116に記憶された環境データをPC5に送信する。
The environmental data is data used when performing stereo measurement, and includes data for correcting optical distortion of the stereo optical adapter. The environmental data is the same as that described in JP-A-2001-275934. The environmental data is stored in the
画像データは、映像情報処理回路108から供給される1フレーム分の映像信号のデータである。内視鏡装置1は、PC5からの画像データ送信要求を受信すると、その応答として、映像情報処理回路108から供給される画像データをPC5に送信する。
The image data is video signal data for one frame supplied from the video
次に、PC5の構成を説明する。図3はPC5の構成を示している。PC5は、PC本体501と、モニタ502と、キーボードやマウス等の操作部503とから構成されている。PC本体501には制御用コンピュータ504が内蔵されている。制御用コンピュータ504は、RAM505と、HDD506と、CPU507と、ネットワークI/F(ネットワークインターフェース)508と、USB I/F509とから構成されている。
Next, the configuration of the
RAM505は、ソフトウェア動作に必要な画像情報等のデータを一時記憶するために使用される。HDD506には、PC5を制御するための一連のソフトウェア(プログラム)が記憶されており、後述するネットワーク計測ソフトもHDD506内に記憶される。CPU507は、HDD506に記憶されているソフトウェアの命令コードに従って、RAM505に記憶されたデータを用いて各種制御のための演算等を実行する。
The
ネットワークI/F508は、通信回線であるネットワーク4と有線または無線で接続し、ネットワーク通信を行うためのインターフェースである。ネットワークI/F508がネットワーク4と有線で接続する場合、ネットワークI/F508に設けられたコネクタにネットワークケーブル(LANケーブルやインターネットケーブル等)を接続することによって、ネットワーク通信を行うことが可能となる。また、ネットワークI/F508がネットワーク4と無線で接続する場合は、ネットワークI/F508に設けられたアンテナ(無線LAN等)によって、ネットワーク通信を行うことが可能となる。このネットワーク4を介して、ネットワークI/F508と内視鏡装置1のネットワークI/F115とを接続することにより、内視鏡装置1から送信された、映像信号を構成する各フレームの画像データをPC5で受信し、PC5に入力することができる。
The network I /
USB I/F509は、PC本体501と操作部503とを電気的に接続するためのインターフェースである。ユーザが操作部503を操作すると、操作結果に応じた信号がUSB I/F509を介してCPU507に入力される。CPU507は、この信号に基づいてPC5の各種制御を実行する。
The USB I /
上述したように、PC5のHDD505には、ネットワーク計測ソフトが記憶されている。ネットワーク計測ソフトをPC5で動作させることにより、ネットワーク4を介して内視鏡装置1から順次画像データを受信して画像を表示し、さらにその画像データに対して後述するゲージ計測を行うことができる。
As described above, the network measurement software is stored in the
次に、ネットワーク計測ソフトの画面および動作について説明する。まず、ネットワーク計測ソフトのメインウィンドウおよびそのGUI(グラフィカルユーザインターフェース)について説明する。 Next, the screen and operation of the network measurement software will be described. First, the main window of the network measurement software and its GUI (graphical user interface) will be described.
図4は、ネットワーク計測ソフトのメインウィンドウを示している。ユーザがネットワーク計測ソフトを起動すると、図4に示すメインウィンドウ400が表示される。メインウィンドウ400の表示は、CPU507による制御に従って行われる。CPU507は、メインウィンドウ400を表示するためのグラフィック画像信号(表示信号)を生成し、モニタ502へ出力する。また、内視鏡装置1で撮像された計測対象物の画像をメインウィンドウ400上に重畳表示する場合には、CPU507は、内視鏡装置1から受信した画像データをグラフィック画像信号に重畳する処理を行い、処理後の信号をモニタ502へ出力する。
FIG. 4 shows a main window of the network measurement software. When the user starts the network measurement software, a
ユーザは、GUI機能を利用して、操作部503を介してメインウィンドウ400を操作することにより、内視鏡画像の閲覧やゲージ計測を行うことができる。以下、各GUI機能を説明する。
The user can browse the endoscopic image and perform gauge measurement by operating the
メインウィンドウ400の上部には、複数のツールボタン401が並んで配置されている。ツールボタン401は、ネットワーク計測ソフトの各種操作を行うためのボタンである。各ボタンの説明は以下の通りである。
In the upper part of the
ボタン401a(以下、[Live]ボタンもしくは[Freeze]ボタンと記載)は、内視鏡装置1とネットワーク接続を行い、さらに、内視鏡装置1に対して画像データの送信要求を行って画像データを受信し、受信した画像データを後述するピクチャボックス404に表示するためのボタンである。[Live]ボタンが押下されると、内視鏡装置1から受信した画像データが順次ピクチャボックス404に表示され、ユーザはその画像を閲覧することができる。その際、[Live]ボタンの表示は[Freeze]ボタンに切り替わる。[Live]ボタンおよび[Freeze]ボタンが押下された時のネットワーク計測ソフトによる動作の詳細については、後述する。
A
ボタン401b(以下、[Stereo-On]ボタンもしくは[Stereo-Off]ボタンと記載)は、内視鏡装置1に対して環境データの送信要求を行って環境データを受信し、さらに、受信した環境データおよび画像データに基づいてゲージ計測を行うためのボタンである。[Stereo-On]ボタンが押下されると、ピクチャボックス404に表示された画像に対して、ユーザはゲージ計測を行うことができる。その際、[Stereo-On]ボタンの表示は[Stereo-Off]ボタンに切り替わる。[Stereo-On]ボタンおよび[Stereo-Off]ボタンが押下された時のネットワーク計測ソフトによる動作の詳細については、後述する。
A button 401b (hereinafter referred to as a [Stereo-On] button or a [Stereo-Off] button) makes a transmission request for environmental data to the
ボタン401c(以下、[Snap]ボタンと記載)は、受信した環境データおよび画像データを用いて、ステレオ計測用画像ファイル(以下、計測ファイルと記載)を作成し、PC5のHDD506に記録するためのボタンである。[Snap]ボタンが押下されると、計測ファイルが所定のフォルダに所定のファイル名および拡張子で保存される。[Snap]ボタンが押下された時のネットワーク計測ソフトによる動作の詳細説明については、省略する。
A
ボタン401d(以下、[Image File]ボタンと記載)は、PC5のHDD506に記録された計測ファイルを開くためのボタンである。[Image File]ボタンが押下されると、図示しないファイルオープンダイアログが開く。そして、このファイルオープンダイアログにおいて、開きたい計測ファイルをユーザが選択すると、計測ファイルの画像がピクチャボックス404に表示され、ユーザはその画像に対してステレオ計測を行うことができる。[Image File]ボタンが押下された時のネットワーク計測ソフトによる動作の詳細説明については、省略する。
A
ボタン401e(以下、[Tool]ボタンと記載)は、ネットワーク計測ソフトの各種設定を行うためのボタンである。[Tool]ボタンが押下されると、図示しない設定ダイアログが開く。そして、この設定ダイアログにおいてユーザは、ネットワークの通信条件や、計測ファイルの保存フォルダ、ファイル名、拡張子等を設定することができる。[Tool]ボタンが押下された時のネットワーク計測ソフトによる動作の詳細説明については、省略する。
A
メインウィンドウ400の右上部には、ステータスボックス402が配置されている。ステータスボックス402は、ネットワーク計測ソフトのステータスを表示するためのボックスである。表示されるステータスの内容、および表示が切り替わるタイミングについては、後述する。
A
ツールボタン401の下には、アドレスボックス403が配置されている。アドレスボックス403は、内視鏡装置1のネットワークアドレスを入力するためのボックスである。アドレスボックス403に入力されたネットワークアドレスは、内視鏡装置1とネットワーク接続を行う際に使用される。
Below the
アドレスボックス403の下には、ピクチャボックス404が配置されている。ピクチャボックス404は、内視鏡装置1から受信した画像データを順次表示するためのボックスであり、ユーザはその画像を閲覧することができる。また、ユーザはピクチャボックス404上にカーソル405を移動させることにより、ステレオ計測およびゲージ計測を行うことができる。
A
ネットワーク計測ソフトのステータスが、後述するライブ-ステレオ状態もしくはフリーズ-ステレオ状態であるとき、ピクチャボックス404に表示された画像406上に、計測領域407、計測アイコン408、マッチングアイコン409、およびゲージ410が重畳表示される。画像406は、ステレオ光学アダプタを通して結像された2つの被写体像に対応した左右2つの画像で構成される。以下では、左側に表示される画像を左画像と記載し、右側に表示される画像を右画像と記載する。計測領域407は、画像406内においてステレオ計測を行うことが可能な領域であり、左右一対の矩形線で表示される。計測領域407の大きさ等の情報は環境データに記録されている。以下では、左画像上の計測領域を左側計測領域と記載し、右画像上の計測領域を右側計測領域と記載する。
When the status of the network measurement software is a live-stereo state or a freeze-stereo state, which will be described later, a
計測アイコン408は、カーソル405が示す左側計測領域内の位置と同じ位置に×印で表示されるアイコンである。マッチングアイコン409は、右側計測領域内のマッチング点(左画像上のカーソル405が示す位置に対応する右画像上の点)の位置に×印で表示されるアイコンである。
The
ゲージ410は、カーソル405が左側計測領域内にある場合に、カーソル405の周囲に表示される円状の3次元定規のことである。ユーザはこのゲージ410を用いて、計測対象物のサイズを測ることができる。ゲージ410は、カーソル405の上下左右に並んで表示されるゲージ目盛り線410aと、カーソル405の周囲に表示されるゲージ周囲線410bとから構成される。ゲージ410は、直線、線分、折れ線、曲線、円、楕円等を1または複数有する図形であればよく、その表示形態は本実施形態に限定されない。ゲージ410の算出方法および表示の詳細については、後述する。
The
ピクチャボックス404の左下には、カーソル座標ボックス411が配置されている。カーソル座標ボックス411は、カーソル405が示す座標を表示するためのボックスである。カーソル405がピクチャボックス404内にある場合に、カーソル405が示す位置のX座標とY座標(以下、カーソル座標と記載)がカーソル座標ボックス411にピクセル単位で表示される。さらに、ユーザがカーソル405を移動させると、カーソル座標ボックス411のカーソル座標がリアルタイムに更新される。カーソル座標の表示に関する、ネットワーク計測ソフトによる動作の詳細説明については、省略する。
A cursor coordinate
ピクチャボックス404の右下には、フレームレートボックス412が配置されている。フレームレートボックス412は、フレームレートを表示するためのボックスである。ネットワーク計測ソフトのステータスがライブ状態である場合に、ピクチャボックス404に表示された画像のフレームレートがfps(frame per sec)単位でフレームレートボックス412に表示される。さらに、フレームレートボックス412に表示されたフレームレートはリアルタイムに更新される。フレームレートの算出およびフレームレートの表示に関する、ネットワーク計測ソフトによる動作の詳細説明については、省略する。
A
メインウィンドウ400の右上部には、対象物距離ボックス413が配置されている。対象物距離ボックス413は、挿入部2の先端の固体撮像素子2aの結像面から計測対象物までの距離を表示するためのボックスである。カーソル405が左側計測領域内にある場合に、カーソル405の示す位置における計測対象物の奥行き方向の距離が対象物距離として対象物距離ボックス413に表示される。対象物距離は、ステレオ計測を行うことによって算出される。さらに、ユーザがカーソル405を移動させると、対象物距離ボックス413の対象物距離がリアルタイムに更新される。対象物距離ボックス413の表示内容の詳細については、後述する。
In the upper right part of the
メインウィンドウ400の右上部には、インジケータ414が配置されている。インジケータ414の表示は、対象物距離ボックス413に表示された対象物距離に応じて、9段階に切り替わる。インジケータ414の表示の詳細については、後述する。
An
メインウィンドウ400の右部には、ゲージ設定ボックス415が配置されている。ゲージ設定ボックス415は、ピクチャボックス404に表示されるゲージ410の各種設定を行うためのボックスである。ゲージ設定ボックス415内には、上からゲージイラスト416、ゲージ径設定ボックス417、およびゲージ目盛り設定ボックス418が配置されている。
On the right side of the
ゲージ径設定ボックス417は、ゲージ410のゲージ周囲線410bの半径を設定するためのボックスである。ゲージ径設定ボックス417は、コンボボックス形式となっており、ユーザはマウス操作により、リストから設定項目を選択できるようになっている。ゲージ目盛り設定ボックス418は、ゲージ410のゲージ目盛り線410aの目盛り間隔を設定するためのボックスである。ゲージ目盛り設定ボックス418も、コンボボックス形式となっており、ユーザはマウス操作により、リストから設定項目を選択できるようになっている。
The gauge
メインウィンドウ400の右下部には、単位設定ボックス419が配置されている。単位設定ボックス419は、対象物距離ボックス413、ゲージ径設定ボックス417、およびゲージ目盛り設定ボックス418の表示単位を切り替えるためのボックスである。単位設定ボックス419内には、[mm] ラジオボタン419aおよび[inch]ラジオボタン419bが配置されており、ユーザはこれらのボタンを選択することにより、対象物距離ボックス413、ゲージ径設定ボックス417、およびゲージ目盛り設定ボックス418の表示単位をmmもしくはinchのいずれかに切り替えることができる。
A
メインウィンドウ400の右下部には、[Exit]ボタン420が配置されている。[Exit]ボタン420は、ネットワーク計測ソフトを終了するためのボタンである。[Exit]ボタン420が押下されると、全てのソフト動作が終了し、メインウィンドウ400が閉じられる。
In the lower right part of the
次に、ネットワーク計測ソフトのステータスについて説明する。ネットワーク計測ソフトのステータスには、未接続状態、ライブ状態、フリーズ状態、ライブ-ステレオ状態、フリーズ-ステレオ状態の5つのステータスがある。各ステータスの説明は以下の通りである。 Next, the status of the network measurement software will be described. There are five network measurement software statuses: unconnected, live, frozen, live-stereo, and freeze-stereo. The explanation of each status is as follows.
未接続状態は、ネットワーク計測ソフトの初期ステータスであり、PC5と内視鏡装置1がネットワーク接続されていない状態である。ライブ状態は、内視鏡装置1から受信した画像データがピクチャボックスに順次表示されている状態である。フリーズ状態とは、内視鏡装置1からの画像データの受信が一時停止し、ピクチャボックスに静止画が表示されている状態である。
The unconnected state is an initial status of the network measurement software, and is a state where the
ライブ-ステレオ状態は、内視鏡装置1から受信した画像データがピクチャボックスに順次表示されている状態であり、かつ表示された画像に対してステレオ計測およびゲージ計測を行うことが可能な状態である。フリーズ−ステレオ状態とは、内視鏡装置1からの画像データの受信が一時停止し、ピクチャボックスに静止画が表示されている状態であり、かつ表示された画像に対してステレオ計測およびゲージ計測を行うことが可能な状態である。
The live-stereo state is a state in which the image data received from the
図5は、メインウィンドウ内の各種ツールボタンが押下されたときに、ネットワーク計測ソフトのステータスがどのように遷移するかを示したものである。以下に、ステータス遷移について説明する。 FIG. 5 shows how the status of the network measurement software changes when various tool buttons in the main window are pressed. The status transition will be described below.
ネットワーク計測ソフトが起動されると、ステータスは、初期ステータスである未接続状態Aとなる。未接続状態Aにおいて、アドレスボックス403に内視鏡装置1のネットワークアドレスが入力された状態で、[Live]ボタンが押下されると、ステータスはライブ状態Bに移行する。このとき、[Live]ボタンは[Freeze]ボタンに切り替わる。
When the network measurement software is activated, the status becomes an unconnected state A which is an initial status. When the [Live] button is pressed while the network address of the
ライブ状態Bにおいて、[Freeze]ボタンが押下されると、ステータスはフリーズ状態Cに移行する。このとき、[Freeze]ボタンは[Live]ボタンに切り替わる。また、ライブ状態Bにおいて、[Stereo-On]ボタンが押下されると、ステータスはライブ-ステレオ状態Dに移行する。このとき、[Stereo-On]ボタンは[Stereo-Off]ボタンに切り替わる。 When the [Freeze] button is pressed in the live state B, the status shifts to the freeze state C. At this time, the [Freeze] button switches to the [Live] button. When the [Stereo-On] button is pressed in the live state B, the status shifts to the live-stereo state D. At this time, the [Stereo-On] button switches to the [Stereo-Off] button.
フリーズ状態Cにおいて、[Live]ボタンが押下されると、ステータスはライブ状態Bに移行する。このとき、[Live]ボタンは[Freeze]ボタンに切り替わる。また、フリーズ状態Cにおいて、[Stereo-On]ボタンが押下されると、ステータスはフリーズ-ステレオ状態Eに移行する。このとき、[Stereo-On]ボタンは[Stereo-Off]ボタンに切り替わる。 When the [Live] button is pressed in the freeze state C, the status shifts to the live state B. At this time, the [Live] button switches to the [Freeze] button. When the [Stereo-On] button is pressed in the freeze state C, the status shifts to the freeze-stereo state E. At this time, the [Stereo-On] button switches to the [Stereo-Off] button.
ライブ-ステレオ状態Dにおいて、[Freeze]ボタンが押下されると、ステータスはフリーズ-ステレオ状態Eに移行する。このとき、[Freeze]ボタンは[Live]ボタンに切り替わる。また、ライブ-ステレオ状態Dにおいて、[Stereo-Off]ボタンが押下されると、ステータスはライブ状態Bに移行する。このとき、[Stereo-Off]ボタンは[Stereo-On]ボタンに切り替わる。 When the [Freeze] button is pressed in the live-stereo state D, the status shifts to the freeze-stereo state E. At this time, the [Freeze] button switches to the [Live] button. When the [Stereo-Off] button is pressed in the live-stereo state D, the status shifts to the live state B. At this time, the [Stereo-Off] button switches to the [Stereo-On] button.
フリーズ-ステレオ状態Eにおいて、[Live]ボタンが押下されると、ステータスはライブ-ステレオ状態Dに移行する。このとき、[Live]ボタンは[Freeze]ボタンに切り替わる。また、フリーズ-ステレオ状態Eにおいて、[Stereo-Off]ボタンが押下されると、ステータスはフリーズ状態Cに移行する。このとき、[Stereo-Off]ボタンは[Stereo-On]ボタンに切り替わる。 When the [Live] button is pressed in the freeze-stereo state E, the status shifts to the live-stereo state D. At this time, the [Live] button switches to the [Freeze] button. When the [Stereo-Off] button is pressed in the freeze-stereo state E, the status shifts to the freeze state C. At this time, the [Stereo-Off] button switches to the [Stereo-On] button.
図6は、各ステータスにおいてステータスボックスがどのように表示されるかを示したものである。ステータスボックスには、未接続状態では「Non-Connected」と表示され、ライブ状態では「Live」と表示され、フリーズ状態では「Freeze」と表示され、ライブ-ステレオ状態では「Live-Stereo」と表示され、フリーズ-ステレオ状態では「Freeze-Stereo」と表示される。 FIG. 6 shows how the status box is displayed in each status. In the status box, “Non-Connected” is displayed in the unconnected state, “Live” is displayed in the live state, “Freeze” is displayed in the frozen state, and “Live-Stereo” is displayed in the live-stereo state. In the freeze-stereo state, “Freeze-Stereo” is displayed.
次に、ネットワーク計測ソフトによる動作について説明する。図7〜図9は、ネットワーク計測ソフトが起動した後の処理の流れを示している。PC5のCPU507は、HDD506からネットワーク計測ソフトを読み出して起動した後、図7〜図9に示す手順で各種制御を実行する。
Next, the operation by the network measurement software will be described. 7 to 9 show the flow of processing after the network measurement software is activated. The
まず、ステップS0において、CPU507はステータスフラグを、ネットワーク計測ソフトの初期ステータスである「未接続状態」に設定する。ステータスフラグとは、ネットワーク計測ソフトの現在のステータスを記憶するためのフラグであり、PC5内のRAM505に記憶されている。後述するように、CPU507は、現在のステータスをチェックする場合もしくはステータスを切り替える場合に、ステータスフラグを使用する。
First, in step S0, the
ステップSA1〜SE6は、各ステータスにおいてユーザが各種GUI操作(主にツールボタン401の操作)を行った際の処理を示している。ステップSA1〜SA5は未接続状態における処理を示し、ステップSB1〜SB8はライブ状態における処理を示し、ステップSC1〜SC7はフリーズ状態における処理を示し、ステップSD1〜SD8はライブ-ステレオ状態における処理を示し、ステップSE1〜SE6はフリーズ-ステレオ状態における処理を示している。 Steps SA1 to SE6 show processing when the user performs various GUI operations (mainly operation of the tool button 401) in each status. Steps SA1 to SA5 show processing in the unconnected state, Steps SB1 to SB8 show processing in the live state, Steps SC1 to SC7 show processing in the freeze state, and Steps SD1 to SD8 show processing in the live-stereo state. Steps SE1 to SE6 show processing in the freeze-stereo state.
まず、未接続状態における処理の流れ(ステップSA1〜SA5)について説明する。まず、ステップSA1では、CPU507はステータスが未接続状態であるか否かを確認する。ステータスが未接続状態である場合、処理はステップSA2に移行し、ステータスが未接続状態でない場合、処理はステップSB1に移行する。
First, the flow of processing in the unconnected state (steps SA1 to SA5) will be described. First, in step SA1, the
ステップSA2では、CPU507は[Live]ボタンが押下されたか否かを確認する。ステップSA2およびこれ以降のステップで各ボタンの押下の有無を確認する場合、CPU507は、操作部503から出力される信号を監視することによって確認を行う。[Live]ボタンが押下された場合、処理はステップSA3に移行し、[Live]ボタンが押下されなかった場合、処理はステップSB1に移行する。
In step SA2, the
ステップSA3では、CPU507はPC5と内視鏡装置1とのネットワーク接続を開始する処理(接続開始処理)を行う。ステップSA3の詳細については、後述する。ステップSA3の後、処理はステップSA4に移行する。
In step SA3, the
ステップSA4では、CPU507は、上記ステップSA3における処理の結果、ネットワーク接続ができたか否かを確認する。ネットワーク接続ができた場合、処理はステップSA5に移行し、ネットワーク接続ができなかった場合、処理はステップSB1に移行する。
In step SA4, the
ステップSA5では、CPU507はステータスをライブ状態に切り替える。ステップSA5の詳細については、後述する。
In step SA5, the
次に、ライブ状態における処理の流れ(ステップSB1〜SB8)について説明する。まず、ステップSB1では、CPU507はステータスがライブ状態であるか否かを確認する。ステータスがライブ状態である場合、処理はステップSB2に移行し、ステータスがライブ状態でない場合、処理はステップSC1に移行する。
Next, the flow of processing in the live state (steps SB1 to SB8) will be described. First, in step SB1, the
ステップSB2では、CPU507は内視鏡装置1から画像データの受信を行う。ステップSB2の詳細については、後述する。ステップSB2の後、処理はステップSB3に移行する。
In step SB2, the
ステップSB3では、CPU507は[Freeze]ボタンが押下されたか否かを確認する。[Freeze]ボタンが押下された場合、処理はステップSB4に移行し、[Freeze]ボタンが押下されなかった場合、処理はステップSB5に移行する。
In step SB3, the
ステップSB4では、CPU507はステータスをフリーズ状態に切り替える。ステップSB4の詳細については、後述する。ステップSB4の終了後、処理はステップ SC1に移行する。
In step SB4, the
ステップSB5では、CPU507は[Stereo-On]ボタンが押下されたか否かを確認する。[Stereo-On]ボタンが押下された場合、処理はステップSB6に移行し、[Stereo-On]ボタンが押下されなかった場合、処理はステップSC1に移行する。
In step SB5, the
ステップSB6では、CPU507は内視鏡装置1から環境データの受信を行う。ステップSB6の詳細については、後述する。ステップSB6の後、処理はステップSB7に移行する。
In step SB6, the
ステップSB7では、CPU507は、上記ステップSB6における処理の結果、環境データを受信できたか否かを確認する。環境データを受信できた場合、処理はステップSB8に移行し、環境データを受信できなかった場合、処理はステップSC1に移行する。
In step SB7, the
ステップSB8では、CPU507はステータスをライブ-ステレオ状態に切り替える。ステップSB8の詳細については、後述する。
In step SB8, the
次に、フリーズ状態における処理の流れ(ステップSC1〜SC7)について説明する。まず、ステップSC1では、CPU507はステータスがフリーズ状態であるか否かを確認する。ステータスがフリーズ状態である場合、処理はステップSC2に移行し、ステータスがフリーズ状態でない場合、処理はステップSD1に移行する。
Next, the flow of processing in the freeze state (steps SC1 to SC7) will be described. First, in step SC1, the
ステップSC2では、CPU507は[Live]ボタンが押下されたか否かを確認する。[Live]ボタンが押下された場合、処理はステップSC3に移行し、[Live]ボタンが押下されなかった場合、処理はステップSC4に移行する。
In step SC2, the
ステップSC3では、CPU507はステータスをライブ状態に切り替える。ステップSC3の詳細については、後述する。ステップSC3の終了後、処理はステップSD1に移行する。
In step SC3, the
ステップSC4では、CPU507は[Stereo-On]ボタンが押下されたか否かを確認する。[Stereo-On]ボタンが押下された場合、処理はステップSC5に移行し、[Stereo-On]ボタンが押下されなかった場合、処理はステップSD1に移行する。
In step SC4, the
ステップSC5では、CPU507は内視鏡装置1から環境データの受信を行う。ステップSC5の詳細については、後述する。ステップSC5の後、処理はステップSC6に移行する。
In step SC <b> 5, the
ステップSC6では、CPU507は、上記ステップSC5における処理の結果、環境データを受信できたか否かを確認する。環境データを受信できた場合、処理はステップSC7に移行し、環境データを受信できなかった場合、処理はステップSD1に移行する。
In step SC6, the
ステップSC7では、CPU507はステータスをフリーズ-ステレオ状態に切り替える。ステップSC7の詳細については、後述する。
In step SC7, the
次に、ライブ-ステレオ状態における処理の流れ(ステップSD1〜SD8)について説明する。まず、ステップSD1では、CPU507はステータスがライブ-ステレオ状態であるか否かを確認する。ステータスがライブ-ステレオ状態である場合、処理はステップSD2に移行し、ステータスがライブ-ステレオ状態でない場合、処理はステップSE1に移行する。
Next, the process flow (steps SD1 to SD8) in the live-stereo state will be described. First, in step SD1, the
ステップSD2では、CPU507は内視鏡装置1から画像データの受信を行う。ステップSD2の詳細については、後述する。ステップSD2の後、処理はステップSD3に移行する。
In step SD2, the
ステップSD3では、CPU507は、上記ステップSD2における処理の結果、画像データを受信できたか否かを確認する。画像データを受信できた場合、処理はステップSD4に移行し、画像データを受信できなかった場合、処理はステップSD5に移行する。
In step SD3, the
ステップSD4では、CPU507は、内視鏡装置1から受信した環境データおよび画像データに基づいて、ゲージ計測を行う。ステップSD4の詳細については、後述する。ステップSD4の後、処理はステップSD5に移行する。
In step SD4, the
ステップSD5では、CPU507は[Freeze]ボタンが押下されたか否かを確認する。[Freeze]ボタンが押下された場合、処理はステップSD6に移行し、[Freeze]ボタンが押下されなかった場合、処理はステップSD7に移行する。
In step SD5, the
ステップSD6では、CPU507はステータスをフリーズ-ステレオ状態に切り替える。ステップSD6の詳細については、後述する。ステップSD6の終了後、処理はステップSE1に移行する。
In step SD6, the
ステップSD7では、CPU507は[Stereo-Off]ボタンが押下されたか否かを確認する。[Stereo-Off]ボタンが押下された場合、処理はステップSD8に移行し、[Stereo-Off]ボタンが押下されなかった場合、処理はステップSE1に移行する。
In step SD7, the
ステップSD8では、CPU507はステータスをライブ状態に切り替える。ステップSD8の詳細については、後述する。
In step SD8, the
次に、フリーズ-ステレオ状態における処理の流れ(ステップSE1〜SE6)について説明する。まず、ステップSE1では、CPU507はステータスがフリーズ-ステレオ状態であるか否かを確認する。ステータスがフリーズ-ステレオ状態である場合、処理はステップSE2に移行し、ステータスがフリーズ-ステレオ状態でない場合、処理はステップSF1に移行する。
Next, the flow of processing in the freeze-stereo state (steps SE1 to SE6) will be described. First, in step SE1, the
ステップSE2では、CPU507は、内視鏡装置1から受信した環境データおよび画像データに基づいて、ゲージ計測を行う。ステップSE2の詳細については、後述する。ステップSE2の終了後、処理はステップSE3に移行する。
In step SE2, the
ステップSE3では、CPU507は[Live]ボタンが押下されたか否かを確認する。[Live]ボタンが押下された場合、処理はステップSE4に移行し、[Live]ボタンが押下されなかった場合、処理はステップSE5に移行する。
In step SE3, the
ステップSE4では、CPU507はステータスをライブ-ステレオ状態に切り替える。ステップSE4の詳細については、後述する。ステップSE4の終了後、処理はステップSF1に移行する。
In step SE4, the
ステップSE5では、CPU507は[Stereo-Off]ボタンが押下されたか否かを確認する。[Stereo-Off]ボタンが押下された場合、処理はステップSE6に移行し、[Stereo-Off]ボタンが押下されなかった場合、処理はステップSF1に移行する。
In step SE5, the
ステップSE6では、CPU507はステータスをフリーズ状態に切り替える。ステップSE6の詳細については、後述する。
In step SE6, the
次に、上記のステップSA1〜SE6の後の処理の流れ(ステップSF1〜SF4)を説明する。まず、ステップSF1では、CPU507は[Exit]ボタンが押下されたか否かを確認する。[Exit]ボタンが押下された場合、処理はステップSF2に移行し、[Exit]ボタンが押下されなかった場合、処理は再度ステップSA1に移行する。
Next, the flow of processing after steps SA1 to SE6 (steps SF1 to SF4) will be described. First, in step SF1, the
ステップSF2では、CPU507はステータスが未接続状態であるか否かを確認する。ステータスが未接続状態である場合、処理はステップSF4に移行し、ステータスが未接続状態でない場合、処理はステップSF3に移行する。
In step SF2, the
ステップSF3では、CPU507は、PC5と内視鏡装置1とのネットワーク接続を終了する処理(接続終了処理)を行う。ステップSF3の詳細については、後述する。ステップSF3の終了後、処理はステップSF4に移行する。
In step SF3, the
ステップSF4では、CPU507はメインウィンドウを非表示とし、ネットワーク計測ソフトによる一連の処理を終了する。
In step SF4, the
次に、上述した処理において呼び出される各種処理について説明する。図10〜図13は、各ステータスの切替時の処理の流れを示している。図10はステータスをライブ状態に切り替える際の処理の流れを示し、図11はステータスをフリーズ状態に切り替える際の処理の流れを示し、図12はステータスをライブ-ステレオ状態に切り替える際の処理の流れを示し、図13はステータスをフリーズ-ステレオ状態に切り替える際の処理の流れを示している。各処理の説明は以下の通りである。 Next, various processes called in the above-described process will be described. 10 to 13 show the flow of processing when switching the statuses. FIG. 10 shows the flow of processing when the status is switched to the live state, FIG. 11 shows the flow of processing when the status is switched to the freeze state, and FIG. 12 shows the flow of processing when switching the status to the live-stereo state. FIG. 13 shows the flow of processing when the status is switched to the freeze-stereo state. The description of each process is as follows.
図10は、図7のステップSA5、図8のステップSC3,SD8で行われる処理の流れを示している。まず、ステップS100では、CPU507は[Live]ボタンの表示を[Freeze]に切り替える。
FIG. 10 shows the flow of processing performed at step SA5 in FIG. 7 and steps SC3 and SD8 in FIG. First, in step S100, the
続いて、ステップS101では、CPU507は[Stereo-On]ボタンもしくは[Stereo-Off]ボタンを有効化する。有効化とは、ボタンが押下できない状態(例えばグレー状態)から押下可能な状態に切り替えることである。ただし、このステップS101が開始される時点で、既にボタンが有効であるならば、特に有効化は行わない。
In step S101, the
続いて、ステップS102では、CPU507はステータスボックスの表示を「Live」に切り替える。続いて、ステップS103では、CPU507はステータスフラグを「ライブ状態」に設定し、ステータスの切替に関する処理を終了する。
In step S102, the
図11は、図7のステップSB4、図9のステップSE6で行われる処理の流れを示している。まず、ステップS110では、CPU507は[Freeze]ボタンの表示を[Live]に切り替える。続いて、ステップS111では、CPU507はステータスボックスの表示を「Freeze」に切り替える。続いて、ステップS112では、CPU507はステータスフラグを「フリーズ状態」に設定し、ステータスの切替に関する処理を終了する。
FIG. 11 shows the flow of processing performed in step SB4 in FIG. 7 and step SE6 in FIG. First, in step S110, the
図12は、図7のステップSB8、図9のステップSE4で行われる処理の流れを示している。まず、ステップS120では、CPU507は[Live]ボタンの表示を[Freeze]に切り替える。ただし、このステップS120が開始される時点で、既にボタンが[Freeze]の表示になっているならば、特に表示の切り替えは行わない。
FIG. 12 shows the flow of processing performed in step SB8 in FIG. 7 and step SE4 in FIG. First, in step S120, the
続いて、ステップS121では、CPU507は[Stereo-On]ボタンの表示を[Stereo-Off]に切り替える。ただし、このステップS121が開始される時点で、既にボタンが[Stereo-Off]の表示になっているならば、特に表示の切り替えは行わない。
Subsequently, in step S121, the
続いて、ステップS122では、CPU507はステータスボックスの表示を「Live-Stereo」に切り替える。続いて、ステップS123では、CPU507はステータスフラグを「ライブ-ステレオ状態」に設定し、ステータスの切替に関する処理を終了する。
In step S122, the
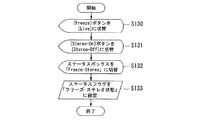
図13は、図8のステップSC7,SD6で行われる処理の流れを示している。まず、ステップS130では、CPU507は[Freeze]ボタンの表示を[Live]に切り替える。ただし、このステップS130が開始される時点で、既にボタンが[Freeze]の表示になっているならば、特に表示の切り替えは行わない。
FIG. 13 shows the flow of processing performed in steps SC7 and SD6 of FIG. First, in step S130, the
続いて、ステップS131では、CPU507は[Stereo-On]ボタンの表示を[Stereo-Off]に切り替える。ただし、このステップS131が開始される時点で、既にボタンが[Stereo-Off]の表示になっているならば、特に表示の切り替えは行わない。
Subsequently, in step S131, the
続いて、ステップS132では、CPU507はステータスボックスの表示を「Freeze-Stereo」に切り替える。続いて、ステップS133では、CPU507はステータスフラグを「フリーズ-ステレオ状態」に設定し、ステータスの切替に関する処理を終了する。
In step S132, the
図14〜図17は、通信時の処理の流れを示している。図14は内視鏡装置1とのネットワーク接続を開始する際の処理の流れを示し、図15は内視鏡装置1から環境データを受信する際の処理の流れを示し、図16は内視鏡装置1から画像データを受信する際の処理の流れを示し、図17は内視鏡装置1とのネットワーク接続を終了する際の処理の流れを示している。各処理の説明は以下の通りである。
14 to 17 show the flow of processing during communication. 14 shows the flow of processing when starting network connection with the
図14は、図7のステップSA3で行われる処理の流れを示している。まず、ステップS140では、CPU507は、アドレスボックス403に入力されたネットワークアドレスを取得する。続いて、ステップS141では、CPU507は、ネットワーク4を介して内視鏡装置1に対してネットワーク接続要求を送信する。ネットワーク接続要求には、ネットワークアドレスの文字列データも含まれる。続いて、ステップS142では、CPU507は、ネットワーク4を介して内視鏡装置1から受信した、ネットワーク接続要求に対する応答の内容を確認する。
FIG. 14 shows the flow of processing performed in step SA3 of FIG. First, in step S140, the
続いて、ステップS143では、CPU507は、ネットワーク接続要求に対する応答の内容に基づいて、内視鏡装置1と正常に接続されたか否かを確認する。内視鏡装置1と正常に接続できた場合、CPU507は、ネットワーク接続の開始に関する処理を終了する。また、内視鏡装置1と正常に接続できなかった場合、処理はステップS144に移行する。ステップS144では、CPU507は、ネットワーク接続に失敗したことを、図示しないエラーメッセージボックスに表示する処理を行う。エラーメッセージボックスが閉じられると、CPU507は、ネットワーク接続の開始に関する処理を終了する。
Subsequently, in step S143, the
図15は、図7のステップSB6、図8のステップSC5で行われる処理の流れを示している。まず、ステップS150では、CPU507は、ネットワーク4を介して内視鏡装置1に対して環境データ送信要求を送信する。続いて、ステップS151では、CPU507は、ネットワーク4を介して内視鏡装置1から受信した環境データの内容を確認する。
FIG. 15 shows the flow of processing performed in step SB6 in FIG. 7 and step SC5 in FIG. First, in step S <b> 150, the
続いて、ステップS152では、CPU507は、内視鏡装置1から環境データを正常に受信できたか否かを確認する。環境データを正常に受信できた場合、処理はステップS153に移行する。ステップS153では、CPU507は、受信した環境データをRAM505に記憶し、環境データの受信に関する処理を終了する。また、環境データを正常に受信できなかった場合、処理はステップS154に移行する。ステップS154では、CPU507は、環境データの受信に失敗したことを、図示しないエラーメッセージボックスに表示する処理を行う。エラーメッセージボックスが閉じられると、CPU507は、環境データの受信に関する処理を終了する。
Subsequently, in step S152, the
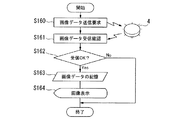
図16は、図7のステップSB2、図8のステップSD2で行われる処理の流れを示している。まず、ステップS160では、CPU507は、ネットワーク4を介して内視鏡装置1に対して画像データ送信要求を送信する。続いて、ステップS161では、CPU507は、内視鏡装置1から受信した画像データの内容を確認する。
FIG. 16 shows the flow of processing performed in step SB2 of FIG. 7 and step SD2 of FIG. First, in step S <b> 160, the
続いて、ステップS162では、CPU507は、内視鏡装置1から画像データを正常に受信できたか否かを確認する。画像データを正常に受信できた場合、処理はステップS163に移行する。ステップS163では、CPU507は、受信した画像データをRAM505に記憶する。RAM505に既に画像データが記憶されている場合には、CPU507は画像データを上書きで記憶する。
Subsequently, in step S <b> 162, the
続いて、ステップS164では、CPU507は、受信した画像データをピクチャボックスに表示する処理を行い、画像データの受信に関する処理を終了する。また、ステップS162において、画像データを正常に受信できなかったと判定した場合も、CPU507は、画像データの受信に関する処理を終了する。画像データの受信は連続して行われるため、受信に失敗した場合でも、その度にエラーメッセージボックスを表示することはしない。
Subsequently, in step S164, the
図17は、図9のステップSF3で行われる処理の流れを示している。まず、ステップS170では、CPU507は、ネットワーク4を介して内視鏡装置1に対してネットワーク接続終了要求を送信する。続いて、ステップS171では、CPU507は、内視鏡装置1から受信した、ネットワーク接続終了要求に対する応答の内容を確認する。
FIG. 17 shows the flow of processing performed in step SF3 of FIG. First, in step S <b> 170, the
続いて、ステップS172では、CPU507は、ネットワーク接続要求に対する応答の内容に基づいて、内視鏡装置1とのネットワーク接続が正常に終了したか否かを確認する。ネットワーク接続が正常に終了した場合、CPU507は、ネットワーク接続の終了に関する処理を終了する。また、ネットワーク接続が正常に終了しなかった場合、処理はステップS173に移行する。ステップS173では、CPU507は、ネットワーク接続に失敗したことを、図示しないエラーメッセージボックスに表示する処理を行う。エラーメッセージボックスが閉じられると、CPU507は、ネットワーク接続の終了に関する処理を終了する。
Subsequently, in step S172, the
次に、図8および図9に示した処理において呼び出されるゲージ計測について説明する。図18は、図8のステップSD4、図9のステップSE2で行われる処理の流れを示している。ゲージ計測では、モニタ502の画面にメインウィンドウが表示され、このメインウィンドウ内に、内視鏡装置1で撮像された計測対象物の画像やゲージ等が表示される。前述したように、ゲージ等を含むメインウィンドウを表示する場合、CPU507は、メインウィンドウを表示するためのグラフィック画像信号(表示信号)に、内視鏡装置1から受信した画像データを重畳する処理を行い、処理後の信号をモニタ502へ出力する。
Next, gauge measurement called in the processing shown in FIGS. 8 and 9 will be described. FIG. 18 shows a flow of processing performed in step SD4 in FIG. 8 and step SE2 in FIG. In the gauge measurement, a main window is displayed on the screen of the
図18に示すゲージ計測において、まず、ステップS200では、CPU507は、RAM505に記憶されている環境データを読み込む。続いて、ステップS201では、CPU507は、RAM505に記憶されている画像データを読み込む。続いて、ステップS202では、CPU507は、環境データに記録された計測領域を線としてメインウィンドウに表示する処理を行う。続いて、ステップS203では、CPU507は、操作部503から出力される信号に基づいてカーソル座標を取得する。
In the gauge measurement shown in FIG. 18, first, in step S <b> 200, the
続いて、ステップS204では、CPU507は、カーソル座標が左側計測領域内にあるか否かを確認する。カーソル座標が左側計測領域内にある場合、処理はステップS205に移行し、カーソル座標が左側計測領域内にない場合、CPU507は、ゲージ計測に関する処理を終了する。以下では、左側計測領域内のカーソル座標に位置する点を計測点と記載する。
Subsequently, in step S204, the
続いて、ステップS205では、CPU507は、環境データに基づいて画像データの補正処理を行う。この補正処理は、特開平10−248806号公報に記載されているものと同様である。続いて、ステップS206では、CPU507は、画像データに基づいて、左側計測領域内の計測点の画像座標(以下、計測点座標と記載)に対応した、右側計測領域内のマッチング点の画像座標(以下、マッチング点座標と記載)を算出する。より具体的には、CPU507は、計測点座標に基づいてパターンマッチング処理を実行し、左右2画像の対応点であるマッチング点座標を算出する。このパターンマッチング処理の方法は、特開2004−49638号公報に記載されたものと同様である。
Subsequently, in step S205, the
続いて、ステップS207では、CPU507は、計測点座標およびそのマッチング点座標に基づいて、空間座標(現実の空間上の3次元座標)を算出する。空間座標の計算方法は、特開2004−49638号公報に記載されているものと同様である。この空間座標のZ方向の座標が、挿入部2の先端の固体撮像素子2aの結像面から計測対象物までの距離(対象物距離)となる。
Subsequently, in step S207, the
続いて、ステップS208では、CPU507は、左側計測領域内の計測点座標の位置に計測アイコンを表示し、右側計測領域内のマッチング点座標にマッチングアイコンを表示する処理を行う。続いて、ステップS209では、CPU507は、ステップS207で算出した対象物距離に基づいて、インジケータ数を算出する。インジケータ数とは、表示するインジケータの数であり、1〜9の値をもつ。
Subsequently, in step S208, the
続いて、ステップS210では、CPU507は、インジケータ数に基づいてインジケータを表示する処理を行う。続いて、ステップS211では、CPU507は、ステップS207で算出した対象物距離に基づいて、対象物距離を表示する処理を行う。上記のインジケータの表示(ステップS210)および対象物距離の表示(ステップS211)の詳細については、後述する。
Subsequently, in step S210, the
続いて、ステップS212では、CPU507は、ゲージ計測を行うためのサンプル点の画像座標(以下、サンプル点座標と記載)を算出する。サンプル点座標は、例えば図19に示すように、計測点1900から見て上下左右の方向に、10、20、30、40pixel離れた点(計16点)の座標として算出される。以下では、計測点の上側に並んだサンプル点を上側サンプル点(図19の点1910)と記載し、計測点の下側に並んだサンプル点を下側サンプル点(図19の点1920)と記載し、計測点の左側に並んだサンプル点を左側サンプル点(図19の点1930)と記載し、計測点の右側に並んだサンプル点を右側サンプル点(図19の点1940)と記載する。サンプル点は、計測対象物の表面を近似する平面(後述するゲージ平面)を算出するために必要なものなので、3点以上のサンプル点を用いることが望ましい。また、サンプル点は、特にピクチャボックス404上には表示されない。
Subsequently, in step S212, the
続いて、ステップS213では、CPU507は、左側計測領域内のサンプル点座標に対応した、右側計測領域内のマッチング点座標を算出する。続いて、ステップS214では、CPU507は、サンプル点座標およびそのマッチング点座標に基づいて空間座標を算出する。
Subsequently, in step S213, the
続いて、ステップS215では、CPU507は、計測点の空間座標およびサンプル点の空間座標に基づいて、ゲージ平面を算出する。ゲージ平面は、ゲージの属する空間平面であり、計測対象物の表面を近似する平面である。後述するゲージ目盛り点およびゲージ周囲点の空間座標は、このゲージ平面上に位置する。ゲージ平面およびその算出方法の詳細については、後述する。
Subsequently, in step S215, the
続いて、ステップS216では、CPU507は、ゲージ径設定ボックスに設定されたゲージ半径を取得し、RAM505に記憶する。続いて、ステップS217では、CPU507は、ゲージ目盛り設定ボックスに設定されたゲージ目盛り間隔を取得し、RAM505に記憶する。
Subsequently, in step S <b> 216, the
続いて、ステップS218では、CPU507は、ゲージ平面、ゲージ半径、およびゲージ目盛り間隔に基づいて、ゲージ目盛り点の空間座標を算出する。ゲージ目盛り点は、ゲージ目盛り線を構成する点である。ゲージ目盛り点の空間座標の算出方法の詳細については、後述する。
Subsequently, in step S218, the
続いて、ステップS219では、CPU507は、ゲージ平面およびゲージ半径に基づいて、ゲージ周囲点の空間座標を算出する。ゲージ周囲点は、ゲージ周囲線を構成する点である。ゲージ周囲点の空間座標の算出方法の詳細については、後述する。
Subsequently, in step S219, the
続いて、ステップS220では、CPU507は、ゲージ目盛り点およびゲージ周囲点の空間座標に基づいて、空間上のゲージ目盛り点およびゲージ周囲点を左側計測領域内の画像平面に投影した点の画像座標を算出する。投影座標は、3次元空間から、挿入部2の先端の固体撮像素子2aが位置する撮像平面(結像面)への透視変換によって算出することができる。
Subsequently, in step S220, the
続いて、ステップS221では、CPU507は、ゲージ目盛り点の画像座標に基づいて、左側計測領域内の画像上にゲージ目盛り線を重畳表示する処理を行う。ゲージ目盛り線の表示の詳細については、後述する。続いて、ステップS222では、CPU507は、ゲージ周囲点の画像座標に基づいて、左側計測領域内の画像上にゲージ周囲線を重畳表示する処理を行う。ゲージ周囲線の表示の詳細については、後述する。ステップS222の後、CPU507は、ゲージ計測に関する処理を終了する。
Subsequently, in step S221, the
次に、図20を用いて、ステップS210,S211における、インジケータおよび対象物距離の表示の詳細を説明する。前述したように、インジケータ数は、対象物距離に比例して変化し、1〜9の値をもつ。 Next, details of display of the indicator and the object distance in steps S210 and S211 will be described with reference to FIG. As described above, the number of indicators varies in proportion to the object distance and has a value of 1 to 9.
図20(a)は、対象物距離が小さい場合(例えば15mm以下)のインジケータおよび対象物距離の表示例である。この場合、インジケータ数は、対象物距離に比例して1〜3の値をもつ。インジケータ2000aおよび対象物距離2010aの背景は、例えば緑色となっている。これは、対象物距離が小さく、計測対象物の画像がステレオ計測およびゲージ計測に適している状態にあることを示している。
FIG. 20A is a display example of an indicator and an object distance when the object distance is small (for example, 15 mm or less). In this case, the number of indicators has a value of 1 to 3 in proportion to the object distance. The background of the
図20(b)は、対象物距離が少し大きい場合(例えば15mm〜30mm)のインジケータおよび対象物距離の表示例である。この場合、インジケータ数は、対象物距離に比例して4〜6の値をもつ。インジケータ2000bおよび対象物距離2010bの背景は、例えば黄色となっている。これは、対象物距離が少し大きく、ステレオ計測およびゲージ計測にあまり適さない状態にあることを示している。
FIG. 20B is a display example of the indicator and the object distance when the object distance is slightly larger (for example, 15 mm to 30 mm). In this case, the number of indicators has a value of 4 to 6 in proportion to the object distance. The background of the
図20(c)は、対象物距離が非常に大きい場合(例えば30mm以上)のインジケータおよび対象物距離の表示例である。この場合、インジケータ数は、対象物距離に比例して7〜9の値をもつ。インジケータ2000cおよび対象物距離2010cの背景は、例えば赤色となっている。これは、対象物距離が非常に大きく、ステレオ計測およびゲージ計測に適さない状態にあることを示している。
FIG. 20C is a display example of the indicator and the object distance when the object distance is very large (for example, 30 mm or more). In this case, the number of indicators has a value of 7 to 9 in proportion to the object distance. The background of the
次に、ステップS215における、ゲージ平面およびその算出方法の詳細を説明する。ゲージ平面は、計測点の空間点を通り、かつサンプル点の空間点から算出される2本の空間直線(空間直線L1,L2とする)を含む平面として算出される。 Next, details of the gauge plane and its calculation method in step S215 will be described. The gauge plane is calculated as a plane that passes through the spatial point of the measurement point and includes two spatial straight lines (referred to as spatial straight lines L 1 and L 2 ) calculated from the spatial point of the sample point.
まず、図21を用いて、空間直線L1の算出方法を説明する。空間直線L1は、計測点の空間点、左側サンプル点の空間点、および右側サンプル点の空間点から求まる。図21(a)には、計測点の空間点P、4つの左側サンプル点の空間点Sl1〜Sl4、4つの右側サンプル点の空間点Sr1〜Sr4が示されている。図21(b)には、点Sl1〜Sl4から点PへのベクトルVl1〜Vl4、および点Pから点Sr1〜Sr4へのベクトルVr1〜Vr4が示されている。 First, with reference to FIG. 21, for explaining the method of calculating the spatial straight line L 1. Spatial straight line L 1, the spatial point of the measurement point, the spatial point of the left sample point, and obtained from the spatial point of the right sample points. FIG. 21A shows space points P of measurement points, four left sample point space points S 11 to S 14 , and four right sample point space points S r1 to S r4 . FIG. 21 (b) the point S l1 to S vector V l1 from l4 to point P ~V l4, and the vector V r1 ~V r4 from point P to point S r1 to S r4 are shown.
点P、点Sl1〜Sl4、および点Sr1〜Sr4の空間座標をそれぞれ(Px,Py,Pz)、(Slxi,Slyi,Slzi)、(Srxi,Sryi,Srzi)とすると(i=1〜4)、ベクトルVl1〜Vl4,Vr1〜Vr4の式は、以下の(1)式および(2)式のようになる。
Vli=(Px−Slxi,Py−Slyi,Pz−Slzi) ・・・(1)
Vri=(Srxi−Px,Sryi−Py,Srzi−Pz) ・・・(2)
The spatial coordinates of the point P, the points S l1 to S 14 , and the points S r1 to S r4 are respectively (P x , P y , P z ), (S lxi , S lyi , S lzi ), (S rxi , S rii). , S rzi ) (i = 1 to 4), the expressions of the vectors V 11 to V 14 and V r1 to V r4 are as shown in the following expressions (1) and (2).
V li = (P x -S lxi , P y -S lyi, P z -S lzi) ··· (1)
V ri = (S rxi -P x , S ryi -P y, S rzi -P z) ··· (2)
図21(c)には、ベクトルVl1〜Vl4,Vr1〜Vr4を平均化した平均ベクトルVa1が示されている。平均ベクトルVa1は、以下の(3)式のようになる。 FIG. 21C shows an average vector V a1 obtained by averaging the vectors V l1 to V l4 and V r1 to V r4 . The average vector V a1 is expressed by the following equation (3).

図21(d)には、点Pを通り、かつベクトルVa1に平行な空間直線L1が示されている。ベクトルVa1を(Va1x,Va1y,Va1z)とすると、空間直線L1の式は、以下の(4)式のようになる。 FIG. 21D shows a spatial straight line L 1 that passes through the point P and is parallel to the vector V a1 . Assuming that the vector V a1 is (V a1x , V a1y , V a1z ), the expression of the space straight line L 1 is as the following expression (4).
次に、図22を用いて、空間直線L2の算出方法を説明する。空間直線L2は、計測点の空間点、上側サンプル点の空間点、および下側サンプル点の空間点から求まる。図22(a)には、計測点の空間点P、4つの上側サンプル点の空間点Su1〜Su4、4つの下側サンプル点の空間点Sd1〜Sd4が示されている。図22(b)には、点Pから点Su1〜Su4へのベクトルVu1〜Vu4、および点Sd1〜Sd4から点PへのベクトルVd1〜Vd4が示されている。 Next, with reference to FIG. 22, for explaining the method of calculating the spatial straight line L 2. Spatial straight line L 2, the spatial point of the measurement point, the spatial point of the upper sample point, and obtained from the spatial point of the lower sample points. In FIG. 22A, the spatial point P of the measurement point, the spatial points S u1 to S u4 of the four upper sample points, and the spatial points S d1 to S d4 of the four lower sample points are shown. In FIG. 22 (b) the vector V u1 ~V u4 from point P to point S u1 to S u4, and the vector V d1 ~V d4 from the point S d1 to S d4 to the point P is shown.
点P、点Su1〜Su4、および点Sd1〜Sd4の空間座標をそれぞれ(Px,Py,Pz)、(Suxi,Suyi,Suzi)、(Sdxi,Sdyi,Sdzi)とすると(i=1〜4)、ベクトルVu1〜Vu4,Vd1〜Vd4の式は、以下の(5)式および(6)式のようになる。
Vui=(Suxi−Px,Suyi−Py,Suzi−Pz) ・・・(5)
Vdi=(Px−Sdxi,Py−Sdyi,Pz−Sdzi) ・・・(6)
Point P, the point S u1 to S u4, and the spatial coordinates of the point S d1 to S d4, respectively (P x, P y, P z), (S uxi, S uyi, S uzi), (S dxi, S dyi , S dzi ) (i = 1 to 4), the expressions of vectors V u1 to V u4 and V d1 to V d4 are as shown in the following expressions (5) and (6).
V ui = (S uxi -P x , S uyi -P y, S uzi -P z) ··· (5)
V di = (P x -S dxi , P y -S dyi, P z -S dzi) ··· (6)
図22(c)には、ベクトルVu1〜Vu4,Vd1〜Vd4を平均化した平均ベクトルVa2が示されている。平均ベクトルVa2は、以下の(7)式のようになる。 FIG. 22C shows an average vector V a2 obtained by averaging the vectors V u1 to V u4 and V d1 to V d4 . The average vector V a2 is expressed by the following equation (7).
図22(d)には、点Pを通り、かつベクトルVa2に平行な空間直線L2が示されている。ベクトルVa2を(Va2x,Va2y,Va2z)とすると、空間直線L2の式は、以下の(8)式のようになる。 FIG 22 (d), and through the point P, and the spatial straight line L 2 parallel to the vector V a2 are shown. Assuming that the vector V a2 is (V a2x , V a2y , V a2z ), the expression of the space straight line L 2 is as the following expression (8).
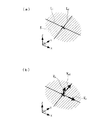
図23(a)には、計測点の空間点P、上記のようにして算出した空間直線L1,L2、ゲージ平面Sが示されている。上述したように、ゲージ平面Sは、点Pを通り、かつ空間直線L1,L2を含む平面として算出される。以下にその算出方法を示す。 FIG. 23A shows the spatial point P of the measurement point, the spatial straight lines L 1 and L 2 calculated as described above, and the gauge plane S. As described above, the gauge plane S is calculated as a plane that passes through the point P and includes the spatial straight lines L 1 and L 2 . The calculation method is shown below.
まず、ゲージ平面Sの式を以下の(9)式のように定義する。
S:Ax+By+Cz=1 ・・・(9)
First, the equation of the gauge plane S is defined as the following equation (9).
S: Ax + By + Cz = 1 (9)
ゲージ平面は点Pを通るので、以下の(10)式が成り立つ。
A・Px+B・Py+C・Pz=1 ・・・(10)
Since the gauge plane passes through the point P, the following equation (10) is established.
A * Px + B * Py + C * Pz = 1 (10)
また、ゲージ平面Sの法線ベクトルVpは(A,B,C)である。図23(b)より、ベクトルVpは空間直線L1の方向ベクトルに垂直であると共に空間直線L2の方向ベクトルにも垂直であることがわかる。空間直線L1,L2の方向ベクトルは、上記のようにして算出した平均ベクトルVa1,Va2であり、ベクトルVpと平均ベクトルVa1,Va2との内積が0であることから、以下の(11)式および(12)式が成り立つ。
A・Va1x+B・Va1y+C・Va1z=0 ・・・(11)
A・Va2x+B・Va2y+C・Va2z=0 ・・・(12)
Further, the normal vector V p of the gauge plane S is (A, B, C). FIG. 23B shows that the vector V p is perpendicular to the direction vector of the space line L 1 and is also perpendicular to the direction vector of the space line L 2 . The direction vectors of the space straight lines L 1 and L 2 are the average vectors V a1 and V a2 calculated as described above, and the inner product of the vector V p and the average vectors V a1 and V a2 is 0. The following formulas (11) and (12) hold.
A · V a1x + B · V a1y + C · V a1z = 0 (11)
A · V a2x + B · V a2y + C · V a2z = 0 (12)
(10)式〜(12)式より、A,B,Cを求めることで、ゲージ平面Sを算出することができる。 The gauge plane S can be calculated by obtaining A, B, and C from the equations (10) to (12).
次に、ステップS218における、ゲージ目盛り点の空間座標の算出方法の詳細を説明する。まず、図24を用いて、左右に並んだゲージ目盛り点の空間座標の算出方法を説明する。左右に並んだゲージ目盛り点の空間座標は、計測点の空間点P、空間直線L1、およびゲージ目盛り間隔から求まる。 Next, details of the method of calculating the spatial coordinates of the gauge scale points in step S218 will be described. First, a method for calculating the spatial coordinates of the gauge scale points arranged side by side will be described with reference to FIG. The spatial coordinates of the gauge scale points arranged side by side are obtained from the spatial point P of the measurement point, the space straight line L 1 , and the gauge scale interval.
図24(a)には、計測点の空間点P、空間直線L1、左右に並んだゲージ目盛り点の空間点Dl,Dr、ゲージ平面Sが示されている。点Dl,Drは、空間直線L1上にあり、かつ点Pからゲージ目盛り間隔Rだけ離れた位置にある2点である。 FIG. 24A shows a spatial point P of the measurement point, a spatial straight line L 1 , spatial points D 1 and D r of gauge scale points arranged on the left and right, and a gauge plane S. The points D 1 and D r are two points on the space straight line L 1 and located at a position separated from the point P by the gauge scale interval R.
このような点を求める場合は、図24(b)のように、点Pを中心とし、かつゲージ目盛り間隔Rを半径とする球Oを設定する。そして、この球Oと空間直線L1との交点が点Dl,Drとなる。球Oの式は、以下の(13)式のようになる。 When obtaining such a point, as shown in FIG. 24B, a sphere O having a point P as the center and a gauge scale interval R as a radius is set. The intersection of the sphere O and spatial straight line L 1 is the point of D l, D r. The equation of the sphere O is as the following equation (13).
点Dl,Drの空間座標は、(4)式および(13)式によって算出することができる。ここで、Rの値を変更することによって、複数のゲージ目盛り点の空間座標を算出することができる。例えば、ユーザが設定したゲージ半径が2.0mm、ゲージ目盛り間隔が0.5mmであった場合、Rの値を0.5mm間隔で0.5、1.0、1.5、2.0mmに設定することで、図24(c)のように、合計8点のゲージ目盛り点の空間座標を算出することができる。 The spatial coordinates of the points D 1 and D r can be calculated by the equations (4) and (13). Here, by changing the value of R, the spatial coordinates of a plurality of gauge scale points can be calculated. For example, when the gauge radius set by the user is 2.0 mm and the gauge scale interval is 0.5 mm, the value of R is set to 0.5, 1.0, 1.5, and 2.0 mm at intervals of 0.5 mm, so that FIG. Thus, the spatial coordinates of a total of 8 gauge scale points can be calculated.
次に、図25を用いて、上下に並んだゲージ目盛り点の空間座標の算出方法を説明する。上下に並んだゲージ目盛り点は、計測点の空間点P、空間直線L2、およびゲージ目盛り間隔から求まる。 Next, a method for calculating the spatial coordinates of the gauge scale points arranged vertically will be described with reference to FIG. The gauge scale points arranged vertically are obtained from the space point P of the measurement point, the space straight line L 2 , and the gauge scale interval.
図25(a)には、計測点の空間点P、空間直線L2、左右に並んだゲージ目盛り点の空間点Du,Dd、ゲージ平面Sが示されている。点Du,Ddは、空間直線L2上にあり、かつ点Pからゲージ目盛り間隔Rだけ離れた位置にある2点である。 FIG. 25A shows the space point P of the measurement point, the space line L 2 , the space points D u and D d of the gauge scale points arranged on the left and right, and the gauge plane S. The points D u and D d are two points on the space straight line L 2 and at a position separated from the point P by the gauge scale interval R.
点Du,Ddの空間座標は、(8)式および(13)式によって算出することができる。ここで、Rの値を変更することによって、複数のゲージ目盛り点の空間座標を算出することができる。例えば、上記と同様に、ユーザが設定したゲージ目盛り間隔が0.5mm、ゲージ半径が2.0mmであった場合、Rの値を0.5mm間隔で0.5、1.0、1.5、2.0mmに設定することで、図25(b)のように、合計8点のゲージ目盛り点の空間座標を算出することができる。 The spatial coordinates of the points D u and D d can be calculated by the equations (8) and (13). Here, by changing the value of R, the spatial coordinates of a plurality of gauge scale points can be calculated. For example, in the same way as above, when the gauge scale interval set by the user is 0.5 mm and the gauge radius is 2.0 mm, by setting the value of R to 0.5, 1.0, 1.5, 2.0 mm at intervals of 0.5 mm, As shown in FIG. 25B, the spatial coordinates of a total of 8 gauge scale points can be calculated.
次に、図26および図27を用いて、ステップS219における、ゲージ周囲点の空間座標の算出方法の詳細を説明する。ゲージ周囲点は、計測点の空間点P、空間直線L1,L2、およびゲージ半径rから求まる。 Next, the details of the method of calculating the spatial coordinates of the gauge peripheral point in step S219 will be described using FIG. 26 and FIG. The gauge peripheral point is obtained from the space point P of the measurement point, the space straight lines L1 and L2, and the gauge radius r.
図26(a)には、計測点の空間点P、空間直線L1,L2、上下左右に並んだゲージ周囲点の空間点Rl,Rr,Ru,Rd、ゲージ平面Sが示されている。点Rl,Rrは、空間直線L1上にあり、かつ点Pからゲージ半径rだけ離れた位置にある2点である。点Rl,Rrの空間座標は、(4)式と、(13)式の右辺のRをrとした式とによって算出することができる。また、点Ru,Rdは、空間直線L2上にあり、かつ点Pからゲージ半径rだけ離れた位置にある2点である。点Ru,Rdの空間座標は、(8)式および(13)式によって算出することができる。そして、これらの4点Rl,Rr,Ru,Rdに基づいて、ゲージ周囲点の空間点をより細かい間隔で求めていく。 In FIG. 26 (a), the space point P of the measurement point, the space straight lines L 1 and L 2 , the space points R 1 , R r , R u , R d , and the gauge plane S of the gage surrounding points aligned vertically and horizontally It is shown. The points R 1 and R r are two points on the space straight line L 1 and at a position separated from the point P by the gauge radius r. The spatial coordinates of the points R 1 and R r can be calculated by the equation (4) and the equation in which R on the right side of the equation (13) is r. The points R u and R d are two points that are on the space straight line L 2 and are separated from the point P by the gauge radius r. The spatial coordinates of the points R u and R d can be calculated by the equations (8) and (13). Then, based on these four points R 1 , R r , R u , R d , the spatial points around the gauge are obtained at finer intervals.
図26(b)には、点Pから点Rl,RuへのベクトルVRl,VRuが示されている。点Rl,Ruの空間座標をそれぞれ(Rlx,Rly,Rlz)、(Rux,Ruy,Ruz)とすると、ベクトルVRl,VRuは、以下の(14)式および(15)式のようになる。
VRl=(Rlx−Px,Rly−Py,Rlz−Pz) ・・・(14)
VRu=(Rux−Px,Ruy−Py,Ruz−Pz) ・・・(15)
FIG. 26B shows vectors V Rl and V Ru from the point P to the points R l and R u . Point R l, the spatial coordinates of R u respectively (R lx, R ly, R lz), (R ux, R uy, R uz) When the vector V Rl, V Ru, the following equation (14) and It becomes like (15) Formula.
V Rl = (R lx -P x , R ly -P y , R lz -P z ) (14)
V Ru = (R ux −P x , R ui −P y , R uz −P z ) (15)
図26(c)には、ベクトルVRl,VRuを平均化した平均ベクトルVAが示されている。平均ベクトルVAは、 以下の(16)式のようになる。 FIG. 26C shows an average vector V A obtained by averaging the vectors V Rl and V Ru . The average vector V A is expressed by the following equation (16).
図26(d)には、点Pを通り、かつ平均ベクトルVAを方向ベクトルとしてもつ空間直線LAが示されている。ベクトルVA1を(VAx,VAy,VAz)とすると、空間直線LAの式は、以下の(17)式のようになる。 FIG. 26D shows a spatial straight line L A that passes through the point P and has the average vector V A as a direction vector. The vector V A1 (V Ax, V Ay , V Az) When the formula of the spatial straight line L A is given by the following equation (17).
図27(a)には、空間直線LA上にあり、かつ点Pからゲージ半径r分だけ離れた空間点Rlu,Rrdが示されている。点Rlu,Rrdの空間座標は、(13)式の右辺のRをrとした式と(17)式とによって算出することができる。これにより、点Rl,Ruの間に位置するゲージ周囲点の空間点Rlu、および点Rr,Rdの間に位置するゲージ周囲点の空間点Rrdを算出することができる。さらに、これらのゲージ周囲点の空間点Rlu,Rrdに基づいて、ゲージ周囲点の空間点をより細かい間隔で求めていく。 In FIG. 27 (a) is located in a space straight line L A, and spatial point R lu away from the point P by the gauge radius r min, R rd is shown. The spatial coordinates of the points R lu and R rd can be calculated by the equation where R on the right side of the equation (13) is r and the equation (17). Thus, it is possible to calculate the points R l, spatial point of the gauge circumference point located between R u R lu, and the point R r, the spatial point R rd gauge peripheral points located between R d. Further, based on the spatial points Rlu and Rrd of the gauge peripheral points, the spatial points of the gauge peripheral points are obtained at finer intervals.
図27(b)には、点Pから点RluへのベクトルVRluが示されている。ベクトルVRl,VRuおよびベクトルVRluを用いて、上記と同様の方法で、ゲージ周囲点の空間点を求めると、図27(c)のように、点Rl,Rluの間に位置するゲージ周囲点の空間点Rllu、および点Rlu,Ruの間に位置するゲージ周囲点の空間点Rluuを算出することができる。このような処理を繰り返すことで、最終的に、図27(d)のように、合計32点のゲージ周囲点の空間点が求められ、その空間座標が算出される。なお、ここでは合計32点のゲージ周囲点の空間点が示されているが、より多くの点を求めても良い。 FIG. 27B shows a vector V Rlu from the point P to the point R lu . Using the vectors V Rl and V Ru and the vector V Rlu in the same manner as described above, the spatial point of the gauge surrounding point is obtained, as shown in FIG. 27 (c), between the points R l and R lu. spatial point of the gauge circumference point R llu, and point R lu, the spatial point R luu gauge peripheral points located between R u can be calculated to be. By repeating such processing, finally, as shown in FIG. 27D, a total of 32 spatial points around the gauge are obtained, and the spatial coordinates are calculated. Here, a total of 32 spatial points around the gauge are shown, but more points may be obtained.
次に、図28を用いて、ステップS221,S222における、ゲージ目盛り線およびゲージ周囲線の表示の詳細を説明する。上下方向に並んだゲージ目盛り線に関しては、図28(a)のように、ゲージ目盛り点2800を中心に所定の長さの直線2810が左右方向に描画される。また、左右方向に並んだゲージ目盛り線に関しては、図28(b)のように、ゲージ目盛り点2800を中心に所定の長さの直線2820が上下方向に描画される。このように、ゲージ目盛り点上に描画された直線がゲージ目盛り線となる。
Next, details of display of the gauge scale lines and the gauge peripheral lines in steps S221 and S222 will be described with reference to FIG. With respect to the gauge scale lines arranged in the vertical direction, as shown in FIG. 28A, a
また、ゲージ周囲線に関しては、図28(c)のように、隣り合うゲージ周囲点2830を互いにつなぐように線2840(例えば直線)が描画される。このように、ゲージ周囲点を互いにつないで描画された線が、図28(d)に示すゲージ周囲線2850となる。
Regarding the gauge peripheral line, as shown in FIG. 28C, a line 2840 (for example, a straight line) is drawn so as to connect adjacent gauge
図29は、計測アイコン2910、ゲージ目盛り線2920、ゲージ周囲線2930を含むゲージ2900の全体を示している。実際に左側計測領域内の画像上に表示されるのは図29のようなゲージであり、図28のようなゲージ目盛り点およびゲージ周囲点は表示されない。
FIG. 29 shows the
また、対象物距離に応じてインジケータおよび対象物距離の背景が変化するのと同様に、対象物距離に応じてゲージの表示色が変化する。表示色を変化させる理由は、インジケータおよび対象物距離の背景の表示色を変化させる理由と同様である。対象物距離が小さい場合(例えば15mm以下)、ゲージは緑色となる。対象物距離が少し大きい場合(例えば15mm〜30mm)、ゲージは黄色となる。対象物距離が非常に大きい場合(例えば30mm以上)、ゲージは赤色となる。 In addition, the display color of the gauge changes according to the object distance in the same manner as the indicator and the background of the object distance change according to the object distance. The reason for changing the display color is the same as the reason for changing the display color of the indicator and the background of the object distance. When the object distance is small (for example, 15 mm or less), the gauge is green. When the object distance is slightly large (for example, 15 mm to 30 mm), the gauge is yellow. When the object distance is very large (for example, 30 mm or more), the gauge is red.
また、計測点周辺の計測対象物の3次元的な形状や傾きに応じてゲージの形状が変化する。ゲージの形状が変化するのは、計測点周辺のサンプル点の空間座標に応じて、ゲージ平面の傾きが変化するためである。 In addition, the shape of the gauge changes according to the three-dimensional shape and inclination of the measurement object around the measurement point. The gauge shape changes because the inclination of the gauge plane changes according to the spatial coordinates of the sample points around the measurement point.
図30(a)は、計測点周辺の計測対象物の表面が、挿入部2の先端に位置する固体撮像素子2aの結像面に対してほぼ平行である場合(正対視)のゲージを示している。この場合、ゲージ平面も固体撮像素子2aの結像面に対してほぼ平行となるため、ゲージ目盛り線3000はほぼ等間隔に並んでおり、かつゲージ周囲線3010もほぼ円状になっている。
FIG. 30A shows a gauge when the surface of the measurement object around the measurement point is substantially parallel to the imaging surface of the solid-
図30(b)は、計測点周辺の計測対象物の表面が、固体撮像素子2aの結像面に対して傾いている場合のゲージを示している。より具体的には、計測点周辺の計測対象物の上側に向かうほど、対象物距離が大きくなっている場合である。この場合、上下方向に並んだゲージ目盛り線3020は、上側に向かうほど間隔が小さくなっており、かつゲージ周囲線3030も、上側に向かうほど楕円状につぶれた形状になっている。
FIG. 30B shows a gauge when the surface of the measurement object around the measurement point is tilted with respect to the imaging surface of the solid-
図30(c)も、計測点周辺の計測対象物の表面が、固体撮像素子2aの結像面に対して傾いている場合のゲージを示している。より具体的には、計測点周辺の計測対象物の左側に向かうほど、対象物距離が大きくなっている場合である。この場合、左右方向に並んだゲージ目盛り線3040は、左側に向かうほど間隔が小さくなっており、かつゲージ周囲線3050も、左側に向かうほど楕円状につぶれた形状になっている。
FIG. 30C also shows a gauge when the surface of the measurement object around the measurement point is inclined with respect to the imaging surface of the solid-
また、メインウィンドウでユーザが設定したゲージ半径およびゲージ目盛り間隔に応じて、ゲージのサイズが変化する。図31(a)は、ゲージ半径が2.0mm、ゲージ目盛り間隔が0.5mm場合のゲージを示している。図31(b)は、ゲージ半径が4.0mm、ゲージ目盛り間隔が1.0mm場合のゲージを示している。図31(a)の場合と比べて、ゲージ周囲線が広がり、かつゲージ目盛り間隔も大きくなっていることがわかる。図31(c)は、ゲージ半径が1.0mm、ゲージ目盛り間隔が0.2mm場合のゲージを示している。図31(a)の場合と比べて、ゲージ周囲線が縮まり、かつゲージ目盛り間隔も小さくなっていることがわかる。 In addition, the size of the gauge changes according to the gauge radius and gauge scale interval set by the user in the main window. FIG. 31A shows a gauge when the gauge radius is 2.0 mm and the gauge scale interval is 0.5 mm. FIG. 31B shows a gauge when the gauge radius is 4.0 mm and the gauge scale interval is 1.0 mm. Compared to the case of FIG. 31A, it can be seen that the gauge peripheral line is widened and the gauge scale interval is also increased. FIG. 31 (c) shows a gauge when the gauge radius is 1.0 mm and the gauge scale interval is 0.2 mm. Compared to the case of FIG. 31A, it can be seen that the gauge peripheral line is reduced and the gauge scale interval is also reduced.
上述したように、本実施形態によれば、計測対象物の表面を近似する平面上の複数点の空間座標に対応した複数点の画像座標で決まる位置にゲージが表示される。このゲージの形状は、画像の奥行き方向の計測対象物の傾きを反映したものとなるので、画像の奥行き方向の被写体の傾きをユーザに知らせることができる。 As described above, according to the present embodiment, a gauge is displayed at a position determined by a plurality of image coordinates corresponding to a plurality of spatial coordinates on a plane approximating the surface of the measurement object. Since the shape of the gauge reflects the inclination of the measurement object in the depth direction of the image, the user can be notified of the inclination of the subject in the depth direction of the image.
また、本実施形態によれば、ゲージ目盛り間隔だけ離れた2点(ゲージ目盛り点)の空間座標に対応した画像座標の位置にゲージ目盛り線が表示される。さらに、計測点の空間座標に対応した画像座標の位置に計測アイコンが表示され、計測点からゲージ半径だけ離れた点(ゲージ周囲点)の空間座標に対応した画像座標の位置にゲージ周囲線が表示される。ゲージ目盛り線やゲージ周囲線から把握される距離は計測対象物の大きさの基準となるので、計測対象物の大きさをユーザに知らせることができる。また、ゲージ目盛り間隔やゲージ半径はメインウィンドウ内の所定位置に表示されるため、ユーザはゲージ目盛り間隔やゲージ半径を知ることが可能である。したがって、ユーザは、そのゲージ目盛り間隔やゲージ半径を頼りに計測対象物の大きさを計測することができる。 Further, according to the present embodiment, the gauge scale line is displayed at the position of the image coordinates corresponding to the spatial coordinates of two points (gauge scale points) separated by the gauge scale interval. Furthermore, a measurement icon is displayed at the position of the image coordinate corresponding to the spatial coordinate of the measurement point, and a gauge peripheral line is displayed at the position of the image coordinate corresponding to the spatial coordinate of the point (gauge peripheral point) that is separated from the measurement point by the gauge radius Is displayed. Since the distance grasped from the gauge graduation line or the gauge peripheral line is a reference for the size of the measurement object, the user can be informed of the size of the measurement object. Further, since the gauge scale interval and gauge radius are displayed at predetermined positions in the main window, the user can know the gauge scale interval and gauge radius. Therefore, the user can measure the size of the measurement object by relying on the gauge scale interval and the gauge radius.
また、本実施形態によれば、以下の効果も得られる。従来の内視鏡装置では、搭載されるCPUの性能やRAMの容量の限界から、内視鏡装置上で動画像を用いてリアルタイムに計測を行うことが困難であった。しかし、本実施形態によれば、内視鏡装置1からネットワーク経由で動画像をPC5に伝送し、PC5上でリアルタイムに計測を行うことができる。本実施形態では、PC5上でゲージ計測を行うようにしているが、CPUの性能やRAMの容量が十分であれば、内視鏡装置1の計測処理部114が、本実施形態と同様のゲージ計測に関する処理を行うようにしてもよい。
Moreover, according to this embodiment, the following effects are also acquired. In the conventional endoscope apparatus, it is difficult to perform measurement in real time using a moving image on the endoscope apparatus because of the performance of the CPU mounted and the limit of the capacity of the RAM. However, according to this embodiment, a moving image can be transmitted from the
次に、本実施形態の変形例を説明する。まず、第1の変形例を説明する。上記では、ゲージの角度(傾き)は固定であったが、本変形例ではゲージの角度を任意に変更することができる。 Next, a modification of this embodiment will be described. First, a first modification will be described. In the above, the angle (tilt) of the gauge is fixed, but in this modification, the angle of the gauge can be arbitrarily changed.
図32は、本変形例におけるゲージ計測で行われる処理の流れを示している。図18に示した処理と異なるのは、ステップS230,S231,S232が追加されていることと、ステップS212のサンプル点座標の算出方法が異なっていることである。これらのステップの処理について、以下に説明する。 FIG. 32 shows the flow of processing performed in gauge measurement in this modification. What is different from the processing shown in FIG. 18 is that steps S230, S231, and S232 are added, and the calculation method of the sample point coordinates in step S212 is different. The processing of these steps will be described below.
ステップS230では、CPU507は、カーソルが左側計測領域内にある状態で、操作部503の有するマウスが左クリックされたか否かを確認する。マウスが左クリックされた場合、処理はステップS231に移行し、マウスが左クリックされなかった場合、処理はステップS205に移行する。ステップS231では、CPU507は、RAM505に記憶されたゲージ角度をインクリメント(増加)する。ゲージ角度の初期値は0deg(0°)であり、本変形例では例えばゲージ角度が30deg単位でインクリメントされる。
In step S230, the
ステップS232では、CPU507は、RAM505に記憶されたゲージ角度を読み込む。続いて、ステップS212では、CPU507は、ゲージ計測を行うためのサンプル点座標を算出する。図19では、計測点から上下左右に見た方向に並んだ点をサンプル点としていた。これに対して、本変形例では、図33のように、図19のサンプル点を、計測点を中心にゲージ角度だけ時計回りに回転させた点をサンプル点としている。
In step S232, the
上下左右の4方向を基準方向とすると、図33(a)では、計測点3300を中心に、基準方向から30deg分、時計回りに回転した方向にサンプル点3310が並んでいることがわかる。また、ステップS230において、再度マウスが左クリックされた場合は、ステップS231において、再度ゲージ角度が30degインクリメントされるので、ゲージ角度は60degとなる。この場合、図33(b)のように、計測点3320を中心に、上下左右の基準方向から60deg分、時計回りに回転した方向にサンプル点3330が並んでいることがわかる。
Assuming that the four directions of up, down, left and right are the reference directions, it can be seen in FIG. 33A that the
さらに、ステップS230において、再度マウスが左クリックされた場合は、ステップS231において、再度ゲージ角度が30degインクリメントされるので、ゲージ角度は90degとなる。この場合、図33(b)のように、計測点3340を中心に、上下左右の基準方向から90deg分、時計回りに回転した方向にサンプル点3350が並ぶことになるが、見た目上は、ゲージ角度が0degの状態に戻ることになる。
Furthermore, when the mouse is left-clicked again in step S230, the gauge angle is incremented by 30 deg again in step S231, so the gauge angle is 90 deg. In this case, as shown in FIG. 33 (b),
計測点座標を中心にサンプル点座標が回転するということは、それに伴って、算出される空間直線L1,L2およびゲージ平面も3次元空間上で回転するということである。そのため、ゲージも、計測点を中心に回転して表示されることになる。 The fact that the sample point coordinates rotate around the measurement point coordinates means that the calculated space straight lines L 1 and L 2 and the gauge plane also rotate in the three-dimensional space. Therefore, the gauge is also displayed by rotating around the measurement point.
図34(a)は、ゲージ角度が30degの場合に左側計測領域内の画像上に表示されたゲージを示している。計測点を中心にしてゲージが回転していることがわかる。図34(b)は、ゲージ角度が60degの場合に左側計測領域内の画像上に表示されたゲージを示している。計測点を中心にしてゲージが図34(a)の場合よりもさらに回転していることがわかる。図34(c)は、ゲージ角度が90degの場合に左側計測領域内の画像上に表示されたゲージを示している。計測点を中心にしてゲージが図34(b)の場合よりもさらに回転し、元の角度に戻っていることがわかる。 FIG. 34A shows a gauge displayed on the image in the left measurement area when the gauge angle is 30 deg. It can be seen that the gauge rotates around the measurement point. FIG. 34B shows the gauge displayed on the image in the left measurement area when the gauge angle is 60 deg. It can be seen that the gauge rotates further around the measurement point than in the case of FIG. FIG. 34C shows the gauge displayed on the image in the left measurement area when the gauge angle is 90 deg. It can be seen that the gauge rotates further around the measurement point than in the case of FIG. 34 (b) and returns to the original angle.
このように、ゲージの角度を任意に変更することで、画面に写っている計測対象物の角度に合わせて、ゲージによるサイズ計測を行うことができる。本変形例では、ゲージ角度を30degずつインクリメントさせていたが、他の角度を用いてもでも良い。ただし、インクリメントする角度は、15deg、30deg、45degなど、90degの約数を用いると良い。そうすれば、ゲージ角度をインクリメントしていくと、ゲージ角度はいずれ90degとなり、見た目上は、ゲージ角度が0degの状態に戻ることになる。 In this way, by arbitrarily changing the angle of the gauge, it is possible to perform size measurement using the gauge in accordance with the angle of the measurement object shown on the screen. In this modification, the gauge angle is incremented by 30 degrees, but other angles may be used. However, the increment angle may be a divisor of 90 deg, such as 15 deg, 30 deg, or 45 deg. Then, as the gauge angle is incremented, the gauge angle will eventually become 90 deg, and the gauge angle will return to the 0 deg state.
本変形例によれば、計測対象物が所定の方向に対して傾いて映っていた場合でも、ユーザは、ゲージを任意に回転させることで、精度の高いゲージ計測を行うことができる。 According to the present modification, even when the measurement object is reflected with respect to a predetermined direction, the user can perform highly accurate gauge measurement by arbitrarily rotating the gauge.
次に、本実施形態の第2の変形例を説明する。本変形例では、対象物距離が変化しても、ゲージ半径、ゲージ目盛り間隔が常に適切なサイズで表示されるように、ネットワーク計測ソフトがゲージ半径、ゲージ目盛り間隔の設定を自動的に変更する機能を備えている。本実施形態では、ユーザがゲージ設定ボックスにより設定するゲージ半径、ゲージ目盛り間隔は、3次元空間上の固定された長さであるため、対象物距離に応じて、2次元平面(固体撮像素子2aの結像面)に投影したそれらの長さが以下のように変化する。
Next, a second modification of the present embodiment will be described. In this modification, the network measurement software automatically changes the settings of the gauge radius and gauge scale interval so that the gauge radius and gauge scale interval are always displayed in an appropriate size even if the object distance changes. It has a function. In the present embodiment, the gauge radius and gauge scale interval set by the user using the gauge setting box is a fixed length in the three-dimensional space, and therefore, a two-dimensional plane (solid-
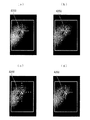
図35は、本実施形態における、対象物距離に応じたゲージの表示サイズの変化を示している。図35(a)は、対象物距離が小さい場合のゲージの表示例である。この場合、表示されたゲージ3500のゲージ半径、ゲージ目盛り間隔が共に非常に大きくなっている。このようなゲージ3500は、ゲージ目盛り間隔が大きすぎて計測対象物のサイズを詳細に測れなかったり、ゲージ3500が計測領域3510からはみ出したりするなど、必ずしも計測対象物のサイズを測る上で有効ではないことがある。
FIG. 35 shows a change in the display size of the gauge according to the object distance in the present embodiment. FIG. 35 (a) is a display example of the gauge when the object distance is small. In this case, the gauge radius and gauge scale interval of the displayed
図35(b)は、対象物距離が少し大きい場合のゲージの表示例である。この場合、表示されたゲージ3520のゲージ半径、ゲージ目盛り間隔が適切な大きさとなっている。図35(c)は、対象物距離が非常に大きい場合のゲージの表示例である。この場合、表示されたゲージ3530のゲージ半径、ゲージ目盛り間隔が共に非常に小さくなっている。このようなゲージ3530は、計測対象物のサイズを測る上で明らかに有効ではない。
FIG. 35B is a display example of a gauge when the object distance is slightly larger. In this case, the gauge radius and gauge scale interval of the displayed
このように、本実施形態では、対象物距離に応じて、ゲージ半径、ゲージ目盛り間隔の大きさが変化してしまうため、計測対象物のサイズを測る上で必ずしも有効ではないことがあった。そこで、本変形例では、対象物距離が変化しても、ゲージ半径、ゲージ目盛り間隔が常に適切なサイズで表示されるように、ネットワーク計測ソフトがゲージ半径、ゲージ目盛り間隔の設定を自動的に変更する機能を備えている。 Thus, in this embodiment, the size of the gauge radius and the gauge scale interval changes according to the object distance, and therefore it may not always be effective in measuring the size of the measurement object. Therefore, in this modification, the network measurement software automatically sets the gauge radius and gauge scale interval so that the gauge radius and gauge scale interval are always displayed in the appropriate size even if the object distance changes. It has a function to change.
図36は、本変形例におけるゲージ設定ボックスを示している。ゲージ設定ボックスの下側には、前述したゲージ径設定ボックス3600、ゲージ目盛り設定ボックス3610に加えて、pixel単位で長さを設定するゲージ半径設定ボックス3620、ゲージ目盛り設定ボックス3630が配置されている。
FIG. 36 shows a gauge setting box in this modification. Below the gauge setting box, in addition to the above-described gauge
さらにゲージ設定ボックスの左側には、ラジオボタン3640,3650も配置されている。ユーザは、これらのラジオボタン3640,4650によって、ゲージ半径およびゲージ目盛り間隔をmm(もしくはinch)単位で設定するか、pixel単位で設定するかを選択することができる。
Further,
ユーザが上側のラジオボタン3640を選択した場合、ゲージ設定ボックスは図36(a)のような状態となり、ネットワーク計測ソフトの動作モードは、ゲージ半径およびゲージ目盛り間隔をmm(もしくはinch)単位で設定するモードとなる。pixel単位で設定するゲージ径設定ボックス3620、ゲージ目盛り設定ボックス3630は無効状態となり、数値も表示されない。これは、本実施形態と同じモードである。
When the user selects the
一方、ユーザが下側のラジオボタン3650を選択した場合、ゲージ設定ボックスは図36(b)のような状態となり、ネットワーク計測ソフトの動作モードは、ゲージ半径およびゲージ目盛り間隔をpixel単位で設定する状態となる。mm(もしくはinch)単位で設定するゲージ径設定ボックス3600、ゲージ目盛り設定ボックス3610は無効状態となる。ただし、数値は表示される。本変形例では、このモードを選択する。
On the other hand, when the user selects the
図37は、本変形例におけるゲージ計測で行われる処理の流れを示している。図18に示したゲージ計測で行われる処理と異なるのは、単位長さの算出(ステップS240)とゲージ半径およびゲージ目盛り間隔の表示(ステップS243,S244)が追加されていること、ステップS216,S217の代わりにゲージ半径およびゲージ目盛り間隔をpixel単位で取得する(ステップS241,S242)ようになっていること、ゲージ目盛り点およびゲージ周囲点の空間座標の算出方法(ステップS218,S219)である。これらのステップについて、以下に説明する。 FIG. 37 shows the flow of processing performed in gauge measurement in this modification. 18 is different from the process performed in the gauge measurement shown in FIG. 18 in that a unit length calculation (step S240) and display of gauge radius and gauge scale interval (steps S243 and S244) are added, step S216. Instead of S217, the gauge radius and the gauge scale interval are acquired in units of pixels (steps S241 and S242), and the spatial coordinate calculation method of the gauge scale points and gauge peripheral points (steps S218 and S219). . These steps are described below.
まず、図38を用いて、ステップS240における単位長さの算出方法を説明する。単位長さとは、計測画面における1pixelに対応した、空間上におけるmm(もしくはinch)単位の長さのことであり、後述するゲージ目盛り点およびゲージ周囲点の空間座標を算出する際に使用する。単位長さは、対象物距離に応じて変化する。概して、対象物距離が大きいほど単位長さは小さくなり、対象物距離が小さいほど単位長さは大きくなる。 First, the unit length calculation method in step S240 will be described with reference to FIG. The unit length is the length in mm (or inch) unit in space corresponding to 1 pixel on the measurement screen, and is used when calculating the space coordinates of the gauge scale points and the gauge surrounding points described later. The unit length changes according to the object distance. In general, the unit length decreases as the object distance increases, and the unit length increases as the object distance decreases.
図38(a)には、計測点の空間点P、4つの左側サンプル点の空間点Sl1〜Sl4、4つの右側サンプル点の空間点Sr1〜Sr4が示されている。図38(b)には、点Sl1〜Sl4と点Pとの距離Ll1〜Ll4、および点Sr1〜Sr4と点Pとの距離Lr1〜Lr4が示されている。点P、点Sl1〜Sl4、および点Sr1〜Sr4の空間座標をそれぞれ(Px,Py,Pz)、(Slxi,Slyi,Slzi)、(Srxi,Sryi,Srzi)とすると(i=1〜4)、距離Ll1〜Ll4,Lr1〜Lr4の式は、以下の(18)式および(19)式のようになる。 FIG. 38A shows space points P of measurement points, four left sample point space points S 11 to S 14 , and four right sample point space points S r1 to S r4 . Figure 38 (b) is the point S l1 to S l4 and the distance L l1 ~L l4 between the point P, and the point S r1 to S r4 and the distance L r1 ~L r4 between the point P is shown. The spatial coordinates of the point P, the points S l1 to S 14 , and the points S r1 to S r4 are represented by (P x , P y , P z ), (S lxi , S lyi , S lzi ), (S rxi , S rii ), respectively. , S rzi ) (i = 1 to 4), the expressions of the distances L 11 to L 14 and L r1 to L r4 are as shown in the following expressions (18) and (19).
ここで、距離Ll1は点Sl1と点Pとの距離であり、点Sl1は計測点から10pixel離れたサンプル点から算出された空間点であるので、単位長さはLl1/10となる。また、距離Ll2は点Sl2と点Pとの距離であり、点Sl2は計測点から20pixel離れたサンプル点から算出された空間点であるので、単位長さはLl2/20となる。同様に、距離Ll3、Ll4については、単位長さはそれぞれLl3/30、Ll4/40となる。さらに、距離Lr1〜Lr4については、単位長さはそれぞれLr1/10、Lr2/20、Lr3/30、Lr4/40となる。これらの平均を取ることにより、左側サンプル点および右側サンプル点の空間点から求めた単位長さLlrpは、以下の(20)式のようになる。
Here, the distance L 11 is a distance between the point S 11 and the point P, and the point S 11 is a spatial point calculated from a
図38(c)には、計測点の空間点P、4つの上側サンプル点の空間点Su1〜Su4、4つの下側サンプル点の空間点Sd1〜Sd4が示されている。図38(d)には、点Su1〜Su4と点Pとの距離Lu1〜Lu4、および点Sd1〜Sd4と点Pとの距離Ld1〜Ld4が示されている。点Su1〜Su4,点Sd1〜Sd4の空間座標をそれぞれ(Suxi,Suyi,Suzi)、(Sdxi,Sdyi,Sdzi)とすると(i=1〜4)、距離Lu1〜Lu4,Ld1〜Ld4の式は、以下の(21)式および(22)式のようになる。 FIG. 38C shows the spatial points P of the measurement points, the spatial points S u1 to S u4 of the four upper sample points, and the spatial points S d1 to S d4 of the four lower sample points. FIG. 38D shows the distances L u1 to L u4 between the points S u1 to S u4 and the point P, and the distances L d1 to L d4 between the points S d1 to S d4 and the point P. Point S u1 to S u4, the spatial coordinates of the point S d1 to S d4, respectively (S uxi, S uyi, S uzi), (S dxi, S dyi, S dzi) When (i = 1~4), the distance Expressions of L u1 to L u4 and L d1 to L d4 are as shown in the following expressions (21) and (22).
また、上記と同様に、上側サンプル点および下側サンプル点の空間点から求めた単位長さLudpは、以下の(23)式のようになる。 Similarly to the above, the unit length L udp obtained from the space points of the upper sample point and the lower sample point is expressed by the following equation (23).
上記において求めた単位長さLlrp,Ludpのうち、より大きい方を採用し、これを単位長さLpとする。これは、単位長さが大きいほうが、上下方向に並んだサンプル点の空間点、および左右方向に並んだサンプル点の空間点のうち、挿入部2の先端に位置する固体撮像素子2aの結像面に対して、より平行に近い方向に並んでいると考えられるからである。言い換えると、上下方向に並んだサンプル点の空間点、および左右方向に並んだサンプル点の空間点のうち、単位長さが大きいほうに対応した空間点のほうが、挿入部2の先端に位置する固体撮像素子2aの結像面に対して、より平行に近い方向に並んでいると考えられるからである。
Of the unit lengths L lrp and L udp determined above, the larger one is adopted, and this is defined as the unit length L p . This is because the larger the unit length, the imaging of the solid-
ステップS241では、CPU507は、pixel単位のゲージ径設定ボックス3620に設定されたゲージ半径を取得し、RAM505に記憶する。ステップS242では、CPU507は、pixel単位のゲージ目盛り設定ボックス3630に設定されたゲージ目盛り間隔を取得し、RAM505に記憶する。
In step S <b> 241, the
ステップS218では、CPU507は、ゲージ平面、ゲージ半径、およびゲージ目盛り間隔に基づいて、ゲージ目盛り点の空間座標を算出する。ただし、ステップS241,S242で取得したゲージ半径およびゲージ目盛り間隔はpixel単位であるので、CPU507は、これらに単位長さLpを乗算して、mm(もしくはinch)単位に変換する。これ以降、CPU507は、前述した方法と同様の方法でゲージ目盛り点の空間座標を算出する。
In step S218, the
ステップS219では、CPU507は、ゲージ平面およびゲージ半径に基づいて、ゲージ周囲点の空間座標を算出する。ただし、ステップS241で取得したゲージ半径はpixel単位であるので、CPU507は、これに単位長さLpを乗算して、mm(もしくはinch)単位に変換する。これ以降、CPU507は、前述した方法と同様の方法でゲージ周囲点の空間座標を算出する。
In step S219, the
ステップS243では、CPU507は、mm(もしくはinch)単位に変換されたゲージ半径をmm(もしくはinch)単位のゲージ径設定ボックス3600に表示する処理を行う。ステップS244では、CPU507は、mm(もしくはinch)単位に変換されたゲージ目盛り間隔をmm(もしくはinch)単位のゲージ目盛り設定ボックス3610に表示する処理を行う。
In step S243, the
図39は、本変形例における、対象物距離に応じたゲージの表示サイズの変化を示している。図39(a)は、対象物距離が小さい場合のゲージの表示例である。図39(b)は、対象物距離が図39(a)の場合よりも少し大きい場合のゲージの表示例である。図39(c)は、図39(a)の場合よりも対象物距離が非常に大きい場合のゲージの表示例である。図39(a)〜(c)に示すように、対象物距離が変化してもゲージ3900の表示サイズは変化せず、ほぼ一定である。これは、対象物距離が変化しても、pixel単位のゲージ半径およびゲージ目盛り間隔が一定になるように、mm(もしくはinch)単位のゲージ半径およびゲージ目盛り間隔が変更されるからである。
FIG. 39 shows a change in the display size of the gauge according to the object distance in the present modification. FIG. 39A shows an example of gauge display when the object distance is small. FIG. 39B is a display example of a gauge when the object distance is slightly larger than that in FIG. FIG. 39C is a display example of a gauge when the object distance is much larger than in the case of FIG. As shown in FIGS. 39A to 39C, even if the object distance changes, the display size of the
図40は、本変形例における、対象物距離に応じたゲージ設定ボックスの表示の変化を示している。図40(a)、(b)、(c)は、それぞれ対象物距離が小さい場合、少し大きい場合、非常に大きい場合のゲージ設定ボックスの表示例である。対象物距離に応じて、mm(もしくはinch)単位のゲージ径設定ボックス4000、ゲージ目盛り設定ボックス4010の値が変化することがわかる。
FIG. 40 shows a change in display of the gauge setting box according to the object distance in the present modification. 40A, 40 </ b> B, and 40 </ b> C are display examples of the gauge setting box when the object distance is small, slightly large, or very large. It can be seen that the values of the gauge
本変形例によれば、対象物距離が変化しても、ゲージ半径、ゲージ目盛り間隔が常に適切なサイズで表示されるので、ユーザは、ゲージを用いて、効率的に計測対象物のサイズを測ることができる。 According to this modified example, even if the object distance changes, the gauge radius and the gauge scale interval are always displayed in appropriate sizes, so the user can use the gauge to efficiently measure the size of the measurement object. Can be measured.
次に、本実施形態の第3の変形例を説明する。本実施形態では、サンプル点間隔は常に一定であったが、本変形例では、ユーザがサンプル点間隔を任意に変更することができる。さらに、本変形例では、対象物距離に応じて、ネットワーク計測ソフトがサンプル点間隔を自動的に変更する機能を備えている。 Next, a third modification of the present embodiment will be described. In the present embodiment, the sample point interval is always constant, but in the present modification, the user can arbitrarily change the sample point interval. Furthermore, in this modification, the network measurement software has a function of automatically changing the sample point interval according to the object distance.
本実施形態では、サンプル点間隔は常に一定であった。そのため、図41(a)のように、丸くくぼんだ領域4100をもつ計測対象物に対してゲージ計測を行う際、カーソルの位置によっては、図41(b)のように、サンプル点4110が、くぼんだ領域4100とそうでない領域とにまたがって設定され、正確なゲージ平面を算出できないことがあった。そこで、サンプル点として用いる範囲を設定できるように、本変形例では、ユーザがサンプル点間隔を任意に変更することができる。
In this embodiment, the sample point interval is always constant. Therefore, when gauge measurement is performed on a measurement object having a rounded and recessed
ゲージ計測中に、ユーザが左側計測領域内でマウスを右クリックすると、一定期間ゲージが非表示となり、図42(a)のように、サンプル点4200が表示される。この状態で、ユーザがマウスを一定期間右クリックしないままでおくと、サンプル点4200が非表示となり、ゲージが再度表示される。
When the user right-clicks the mouse in the left measurement area during the gauge measurement, the gauge is not displayed for a certain period of time, and the
図42(a)の状態から、ユーザがマウスを右クリックすると、図42(b)のように、サンプル点間隔が小さくなって、サンプル点4200が表示される。この状態で、ユーザがマウスを一定期間右クリックしないままでおくと、サンプル点が非表示となり、ゲージが再度表示される。このとき、間隔が小さくなったサンプル点を用いて、ゲージの計算が行われる。
When the user right-clicks the mouse from the state of FIG. 42A, the sample point interval is reduced and the
図42(b)の状態から、ユーザがマウスを右クリックすると、図42(c)のように、サンプル点間隔が大きくなって、サンプル点4200が表示される。この状態で、ユーザがマウスを一定期間右クリックしないままでおくと、サンプル点が非表示となり、ゲージが再度表示される。このとき、間隔が大きくなったサンプル点を用いて、ゲージの計算が行われる。図42(c)の状態から、再度ユーザがマウスを右クリックすると、図42(d)のように、サンプル点間隔が元に戻り、図42(a)と同じ状態になる。
When the user right-clicks the mouse from the state of FIG. 42B, the sample point interval is increased and the
このように、ユーザが左側計測領域内でマウスを右クリックすることにより、サンプル点間隔を任意に変更することができる。CPU507は、ユーザによるマウスの操作結果に応じて操作部503から出力される信号に基づいてサンプル点間隔を設定する。なお、上記の例では、サンプル点間隔は3段階しか変化していないが、より多くの段階にサンプル点間隔を変化させることができるようにしても良い。
Thus, the sample point interval can be arbitrarily changed by the user right-clicking the mouse in the left measurement area. The
上記の方法では、ユーザがサンプル点間隔を任意に変更していたが、他の方法として、対象物距離に応じて、ネットワーク計測ソフトがサンプル点間隔を自動的に変更する機能を備えていても良い。この方法を以下に説明する。 In the above method, the user arbitrarily changed the sample point interval. However, as another method, the network measurement software may have a function of automatically changing the sample point interval according to the object distance. good. This method will be described below.
図43は、ネットワーク計測ソフトが保持しているサンプル点間隔テーブルの一例を示している。サンプル点間隔テーブルは、対象物距離とサンプル点間隔との関係を示したものである。サンプル点間隔テーブルでは、対象物距離が大きくなるに従って、サンプル点間隔が大きくなっていることがわかる。 FIG. 43 shows an example of the sample point interval table held by the network measurement software. The sample point interval table shows the relationship between the object distance and the sample point interval. In the sample point interval table, it can be seen that the sample point interval increases as the object distance increases.
一般的に、対象物距離に関係なく、サンプル点の空間点は、空間上においてできるだけ一定の大きさの領域に分布していることが望ましい。そのほうが、ゲージ平面の算出条件が、対象物距離によって変化しないからである。そのため、サンプル点間隔テーブルでは、対象物距離が大きくなるに従って、サンプル点間隔が大きくなるように設定されている。 In general, it is desirable that the spatial points of the sample points are distributed in a region having a constant size as much as possible in the space regardless of the object distance. This is because the calculation condition of the gauge plane does not change depending on the object distance. Therefore, in the sample point interval table, the sample point interval is set to increase as the object distance increases.
図44は、サンプル点間隔テーブルを用いた場合に、サンプル点間隔がどのように変化するかを示している。図44(a)は、対象物距離が小さい場合のサンプル点であり、サンプル点間隔は大きくなっている。図44(b)は、対象物距離が少し大きい場合のサンプル点間隔であり、サンプル点間隔は中くらいである。図44(c)は、対象物距離が非常に大きい場合のサンプル点間隔であり、サンプル点間隔は小さくなっている。図44では、サンプル点を表示しているが、実際には、サンプル点は表示されない。このように、対象物距離に応じて、ネットワーク計測ソフトがサンプル点間隔を自動的に変更する機能を備えているので、ユーザはマウスカーソルを移動させるだけで、適切なサンプル点間隔を設定することができる。 FIG. 44 shows how the sample point interval changes when the sample point interval table is used. FIG. 44A shows sample points when the object distance is small, and the sample point interval is large. FIG. 44B shows sample point intervals when the object distance is slightly large, and the sample point interval is medium. FIG. 44C shows sample point intervals when the object distance is very large, and the sample point intervals are small. In FIG. 44, sample points are displayed, but actually no sample points are displayed. In this way, the network measurement software has a function to automatically change the sample point interval according to the object distance, so the user can set an appropriate sample point interval simply by moving the mouse cursor. Can do.
本変形例によれば、ユーザがサンプル点間隔を任意に変更する、または、対象物距離に応じて、ネットワーク計測ソフトがサンプル点間隔を自動的に変更することによって、ユーザは、ゲージを用いて、効率的にかつ精度良く計測対象物のサイズを測ることができる。 According to this modification, the user can change the sample point interval arbitrarily, or the network measurement software can automatically change the sample point interval according to the object distance, so that the user can use the gauge. The size of the measurement object can be measured efficiently and accurately.
以上、図面を参照して本発明の実施形態について詳述してきたが、具体的な構成は上記の実施形態に限られるものではなく、本発明の要旨を逸脱しない範囲の設計変更等も含まれる。 As described above, the embodiments of the present invention have been described in detail with reference to the drawings. However, the specific configuration is not limited to the above-described embodiments, and includes design changes and the like without departing from the gist of the present invention. .
1・・・内視鏡装置、2・・・挿入部(電子内視鏡)、3・・・計測対象物、4・・・ネットワーク、5・・・PC(画像処理装置)、105・・・CCU(映像信号生成部)、108・・・映像信号処理回路(表示信号生成部)、114・・・計測処理部(座標算出部、平面算出部)、115・・・ネットワークI/F(送信部)、507・・・CPU(座標算出部、平面算出部、表示信号生成部)、508・・・ネットワークI/F(受信部)
DESCRIPTION OF
Claims (11)
前記座標算出部によって算出された、基準点を含む3点以上のサンプル点の3次元座標から平面を算出する平面算出部と、
前記平面上の、複数のゲージ目盛り点の3次元座標に基づいて、前記基準点から所定の3次元距離を有する位置を示すゲージを表示するための表示信号を生成する表示信号生成部と、
を備え、
前記平面算出部は、前記3点以上のサンプル点の3次元座標から前記基準点を通る2本の空間直線を算出し、前記2本の空間直線に基づいて前記平面を算出し、
前記表示信号生成部は、前記2本の空間直線の一方上に設定された、前記基準点からの3次元距離が等しい2点の3次元座標に基づいて、前記ゲージを表示するための前記表示信号を生成する
ことを特徴とする画像処理装置。 A coordinate calculation unit that calculates three-dimensional coordinates on the subject corresponding to image coordinates in an image obtained by imaging the subject;
A plane calculation unit that calculates a plane from three-dimensional coordinates of three or more sample points including a reference point calculated by the coordinate calculation unit;
A display signal generating unit that generates a display signal for displaying a gauge indicating a position having a predetermined three-dimensional distance from the reference point, based on three-dimensional coordinates of a plurality of gauge scale points on the plane;
Equipped with a,
The plane calculation unit calculates two spatial straight lines passing through the reference point from three-dimensional coordinates of the three or more sample points, calculates the plane based on the two spatial straight lines ,
The display signal generating unit is configured to display the gauge based on the three-dimensional coordinates of two points set on one of the two space straight lines and having the same three-dimensional distance from the reference point. An image processing apparatus that generates a signal.
前記撮像信号に基づいて映像信号を生成する映像信号生成部と、
前記映像信号に基づく画像における画像座標に対応した前記被写体上の3次元座標を算出する座標算出部と、
前記座標算出部によって算出された、基準点を含む3点以上のサンプル点の3次元座標から平面を算出する平面算出部と、
前記平面上の、複数のゲージ目盛り点の3次元座標に基づいて、前記基準点から所定の3次元距離を有する位置を示すゲージを表示するための表示信号を生成する表示信号生成部と、
を備え、
前記平面算出部は、前記3点以上のサンプル点の3次元座標から前記基準点を通る2本の空間直線を算出し、前記2本の空間直線に基づいて前記平面を算出し、
前記表示信号生成部は、前記2本の空間直線の一方上に設定された、前記基準点からの3次元距離が等しい2点の3次元座標に基づいて、前記ゲージを表示するための前記表示信号を生成する
ことを特徴とする内視鏡装置。 An electronic endoscope for imaging a subject and generating an imaging signal;
A video signal generation unit that generates a video signal based on the imaging signal;
A coordinate calculation unit that calculates three-dimensional coordinates on the subject corresponding to image coordinates in an image based on the video signal;
A plane calculation unit that calculates a plane from three-dimensional coordinates of three or more sample points including a reference point calculated by the coordinate calculation unit;
A display signal generating unit that generates a display signal for displaying a gauge indicating a position having a predetermined three-dimensional distance from the reference point, based on three-dimensional coordinates of a plurality of gauge scale points on the plane;
Equipped with a,
The plane calculation unit calculates two spatial straight lines passing through the reference point from three-dimensional coordinates of the three or more sample points, calculates the plane based on the two spatial straight lines,
The display signal generating unit is configured to display the gauge based on the three-dimensional coordinates of two points set on one of the two space straight lines and having the same three-dimensional distance from the reference point. An endoscope apparatus characterized by generating a signal .
前記内視鏡装置は、
被写体を撮像し撮像信号を生成する電子内視鏡と、
前記撮像信号に基づいて映像信号を生成する映像信号生成部と、
前記映像信号を外部へ送信する送信部と、を有し、
前記画像処理装置は、
前記映像信号を受信する受信部と、
前記映像信号に基づく画像における画像座標に対応した前記被写体上の3次元座標を算出する座標算出部と、
前記座標算出部によって算出された、基準点を含む3点以上のサンプル点の3次元座標から平面を算出する平面算出部と、
前記平面上の、複数のゲージ目盛り点の3次元座標に基づいて、前記基準点から所定の3次元距離を有する位置を示すゲージを表示するための表示信号を生成する表示信号生成部と、を有し、
前記平面算出部は、前記3点以上のサンプル点の3次元座標から前記基準点を通る2本の空間直線を算出し、前記2本の空間直線に基づいて前記平面を算出し、
前記表示信号生成部は、前記2本の空間直線の一方上に設定された、前記基準点からの3次元距離が等しい2点の3次元座標に基づいて、前記ゲージを表示するための前記表示信号を生成する
ことを特徴とする内視鏡システム。 An endoscope system including an endoscope device and an image processing device,
The endoscope apparatus is
An electronic endoscope for imaging a subject and generating an imaging signal;
A video signal generation unit that generates a video signal based on the imaging signal;
A transmission unit for transmitting the video signal to the outside,
The image processing apparatus includes:
A receiver for receiving the video signal;
A coordinate calculation unit that calculates three-dimensional coordinates on the subject corresponding to image coordinates in an image based on the video signal;
A plane calculation unit that calculates a plane from three-dimensional coordinates of three or more sample points including a reference point calculated by the coordinate calculation unit;
A display signal generating unit that generates a display signal for displaying a gauge indicating a position having a predetermined three-dimensional distance from the reference point, based on three-dimensional coordinates of a plurality of gauge scale points on the plane; Yes, and
The plane calculation unit calculates two spatial straight lines passing through the reference point from three-dimensional coordinates of the three or more sample points, calculates the plane based on the two spatial straight lines,
The display signal generating unit is configured to display the gauge based on the three-dimensional coordinates of two points set on one of the two space straight lines and having the same three-dimensional distance from the reference point. An endoscope system characterized by generating a signal .
前記座標算出部によって算出された、基準点を含む3点以上のサンプル点の3次元座標から平面を算出する平面算出部と、
前記平面上の、複数のゲージ目盛り点の3次元座標に基づいて、前記基準点から所定の3次元距離を有する位置を示すゲージを表示するための表示信号を生成する表示信号生成部と、
としてコンピュータを機能させるためのプログラムであって、
前記平面算出部は、前記3点以上のサンプル点の3次元座標から前記基準点を通る2本の空間直線を算出し、前記2本の空間直線に基づいて前記平面を算出し、
前記表示信号生成部は、前記2本の空間直線の一方上に設定された、前記基準点からの3次元距離が等しい2点の3次元座標に基づいて、前記ゲージを表示するための前記表示信号を生成することを特徴とするプログラム。 A coordinate calculation unit that calculates three-dimensional coordinates on the subject corresponding to image coordinates in an image obtained by imaging the subject;
A plane calculation unit that calculates a plane from three-dimensional coordinates of three or more sample points including a reference point calculated by the coordinate calculation unit;
A display signal generating unit that generates a display signal for displaying a gauge indicating a position having a predetermined three-dimensional distance from the reference point, based on three-dimensional coordinates of a plurality of gauge scale points on the plane;
A program for causing a computer to function as,
The plane calculation unit calculates two spatial straight lines passing through the reference point from three-dimensional coordinates of the three or more sample points, calculates the plane based on the two spatial straight lines,
The display signal generating unit is configured to display the gauge based on the three-dimensional coordinates of two points set on one of the two space straight lines and having the same three-dimensional distance from the reference point. A program characterized by generating a signal .
Priority Applications (1)
| Application Number | Priority Date | Filing Date | Title |
|---|---|---|---|
| JP2008273430A JP5242335B2 (en) | 2008-10-23 | 2008-10-23 | Image processing apparatus, endoscope apparatus, endoscope system, and program |
Applications Claiming Priority (1)
| Application Number | Priority Date | Filing Date | Title |
|---|---|---|---|
| JP2008273430A JP5242335B2 (en) | 2008-10-23 | 2008-10-23 | Image processing apparatus, endoscope apparatus, endoscope system, and program |
Publications (3)
| Publication Number | Publication Date |
|---|---|
| JP2010102113A JP2010102113A (en) | 2010-05-06 |
| JP2010102113A5 JP2010102113A5 (en) | 2011-12-08 |
| JP5242335B2 true JP5242335B2 (en) | 2013-07-24 |
Family
ID=42292813
Family Applications (1)
| Application Number | Title | Priority Date | Filing Date |
|---|---|---|---|
| JP2008273430A Expired - Fee Related JP5242335B2 (en) | 2008-10-23 | 2008-10-23 | Image processing apparatus, endoscope apparatus, endoscope system, and program |
Country Status (1)
| Country | Link |
|---|---|
| JP (1) | JP5242335B2 (en) |
Families Citing this family (7)
| Publication number | Priority date | Publication date | Assignee | Title |
|---|---|---|---|---|
| JP5530225B2 (en) | 2010-03-09 | 2014-06-25 | オリンパス株式会社 | Endoscope apparatus and program |
| US8903144B2 (en) | 2010-12-01 | 2014-12-02 | Olympus Corporation | Endoscope apparatus and method of measuring object |
| JP6120537B2 (en) * | 2012-11-22 | 2017-04-26 | オリンパス株式会社 | Measuring endoscope device |
| WO2016039292A1 (en) * | 2014-09-11 | 2016-03-17 | オリンパス株式会社 | Endoscope system |
| JP6335839B2 (en) * | 2015-05-11 | 2018-05-30 | オリンパス株式会社 | Medical device, medical image generation method, and medical image generation program |
| JP6373322B2 (en) * | 2016-09-23 | 2018-08-15 | オリンパス株式会社 | Endoscope apparatus and program |
| JP6400767B2 (en) * | 2017-03-28 | 2018-10-03 | オリンパス株式会社 | Measuring endoscope device |
Family Cites Families (4)
| Publication number | Priority date | Publication date | Assignee | Title |
|---|---|---|---|---|
| JP2778739B2 (en) * | 1989-05-10 | 1998-07-23 | オリンパス光学工業株式会社 | Measurement endoscope device |
| JPH06339454A (en) * | 1993-06-01 | 1994-12-13 | Olympus Optical Co Ltd | Measuring endoscope device |
| JP4590087B2 (en) * | 2000-11-21 | 2010-12-01 | オリンパス株式会社 | Endoscope apparatus and scale display method |
| JP2005087468A (en) * | 2003-09-17 | 2005-04-07 | Shoji Kawahito | Image pickup device provided with distance image measurement function and endoscopic apparatus |
-
2008
- 2008-10-23 JP JP2008273430A patent/JP5242335B2/en not_active Expired - Fee Related
Also Published As
| Publication number | Publication date |
|---|---|
| JP2010102113A (en) | 2010-05-06 |
Similar Documents
| Publication | Publication Date | Title |
|---|---|---|
| JP5242335B2 (en) | Image processing apparatus, endoscope apparatus, endoscope system, and program | |
| JP5073564B2 (en) | Endoscope device for measurement and program | |
| JP5530225B2 (en) | Endoscope apparatus and program | |
| US8496575B2 (en) | Measuring endoscope apparatus, program and recording medium | |
| US8004560B2 (en) | Endoscope apparatus | |
| US8558879B2 (en) | Endoscope apparatus and measuring method | |
| JP5980611B2 (en) | Measurement endoscope apparatus and program | |
| JP5231173B2 (en) | Endoscope device for measurement and program | |
| JP5186286B2 (en) | Endoscope device for measurement and program | |
| JP5026769B2 (en) | Endoscope device for measurement, program, and recording medium | |
| JP5307407B2 (en) | Endoscope apparatus and program | |
| JP2011170276A (en) | Endoscope device and program | |
| JP5153381B2 (en) | Endoscope device | |
| JP6081209B2 (en) | Endoscope apparatus and program | |
| JP5253109B2 (en) | Endoscope apparatus and endoscopic image program | |
| JP2005173336A (en) | Industrial endoscope device and shape dimension measuring method using the same | |
| JP2005077832A (en) | Industrial endoscope system | |
| JP2014026217A (en) | Endoscope apparatus and program | |
| JP2013027433A (en) | Image processing device and image processing method | |
| JP6426215B2 (en) | Endoscope apparatus and program | |
| JP5791989B2 (en) | Endoscope apparatus and program | |
| JP2023018984A (en) | Insertion support system, insertion support method and program | |
| JP2022052467A (en) | Examination support device, examination support method, and examination support program | |
| JP2022073020A (en) | Image display method, display control apparatus, and program | |
| JP2021064264A (en) | Image processing apparatus and image processing method |
Legal Events
| Date | Code | Title | Description |
|---|---|---|---|
| A521 | Request for written amendment filed |
Free format text: JAPANESE INTERMEDIATE CODE: A523 Effective date: 20111024 |
|
| A621 | Written request for application examination |
Free format text: JAPANESE INTERMEDIATE CODE: A621 Effective date: 20111024 |
|
| A521 | Request for written amendment filed |
Free format text: JAPANESE INTERMEDIATE CODE: A523 Effective date: 20120309 |
|
| A977 | Report on retrieval |
Free format text: JAPANESE INTERMEDIATE CODE: A971007 Effective date: 20121207 |
|
| A131 | Notification of reasons for refusal |
Free format text: JAPANESE INTERMEDIATE CODE: A131 Effective date: 20130108 |
|
| A521 | Request for written amendment filed |
Free format text: JAPANESE INTERMEDIATE CODE: A523 Effective date: 20130219 Free format text: JAPANESE INTERMEDIATE CODE: A821 Effective date: 20130219 |
|
| TRDD | Decision of grant or rejection written | ||
| A01 | Written decision to grant a patent or to grant a registration (utility model) |
Free format text: JAPANESE INTERMEDIATE CODE: A01 Effective date: 20130319 |
|
| A61 | First payment of annual fees (during grant procedure) |
Free format text: JAPANESE INTERMEDIATE CODE: A61 Effective date: 20130403 |
|
| FPAY | Renewal fee payment (event date is renewal date of database) |
Free format text: PAYMENT UNTIL: 20160412 Year of fee payment: 3 |
|
| R151 | Written notification of patent or utility model registration |
Ref document number: 5242335 Country of ref document: JP Free format text: JAPANESE INTERMEDIATE CODE: R151 |
|
| FPAY | Renewal fee payment (event date is renewal date of database) |
Free format text: PAYMENT UNTIL: 20160412 Year of fee payment: 3 |
|
| S531 | Written request for registration of change of domicile |
Free format text: JAPANESE INTERMEDIATE CODE: R313531 |
|
| R350 | Written notification of registration of transfer |
Free format text: JAPANESE INTERMEDIATE CODE: R350 |
|
| R250 | Receipt of annual fees |
Free format text: JAPANESE INTERMEDIATE CODE: R250 |
|
| R250 | Receipt of annual fees |
Free format text: JAPANESE INTERMEDIATE CODE: R250 |
|
| R250 | Receipt of annual fees |
Free format text: JAPANESE INTERMEDIATE CODE: R250 |
|
| R250 | Receipt of annual fees |
Free format text: JAPANESE INTERMEDIATE CODE: R250 |
|
| S111 | Request for change of ownership or part of ownership |
Free format text: JAPANESE INTERMEDIATE CODE: R313111 |
|
| R371 | Transfer withdrawn |
Free format text: JAPANESE INTERMEDIATE CODE: R371 |
|
| S111 | Request for change of ownership or part of ownership |
Free format text: JAPANESE INTERMEDIATE CODE: R313111 |
|
| R371 | Transfer withdrawn |
Free format text: JAPANESE INTERMEDIATE CODE: R371 |
|
| LAPS | Cancellation because of no payment of annual fees |