JP4836632B2 - Elemental analysis method - Google Patents
Elemental analysis method Download PDFInfo
- Publication number
- JP4836632B2 JP4836632B2 JP2006100591A JP2006100591A JP4836632B2 JP 4836632 B2 JP4836632 B2 JP 4836632B2 JP 2006100591 A JP2006100591 A JP 2006100591A JP 2006100591 A JP2006100591 A JP 2006100591A JP 4836632 B2 JP4836632 B2 JP 4836632B2
- Authority
- JP
- Japan
- Prior art keywords
- sample
- primary ion
- incident angle
- analysis method
- depth
- Prior art date
- Legal status (The legal status is an assumption and is not a legal conclusion. Google has not performed a legal analysis and makes no representation as to the accuracy of the status listed.)
- Expired - Fee Related
Links
Images


Landscapes
- Other Investigation Or Analysis Of Materials By Electrical Means (AREA)
- Analysing Materials By The Use Of Radiation (AREA)
Description
本発明は、二次イオン質量分析法を用いた元素分析方法に係り、特に二次イオン質量分析法を用いた微量含有元素の深さ方向の元素分析方法に関する。 The present invention relates to an elemental analysis method using secondary ion mass spectrometry, and more particularly to an elemental analysis method in the depth direction of trace elements using secondary ion mass spectrometry.
二次イオン質量分析(Secondary Ion Mass Spectrometry、SIMS)法は、酸素やそれよりも重いイオンを一次イオンビームとして試料に照射して試料表面をスパッタエッチングし、放射された二次イオンを質量分析器により元素同定する元素分析法である。SIMS法は、試料を構成する主要元素の解析よりも、ppbからppmの濃度の分析能力を有しているため、試料に含まれる微量元素の分析に適している。SIMS法は、例えば、LSI等の半導体装置のシリコン基板に形成されたBやP等のドーパントが注入された拡散領域の深さ方向の分析や、注入の際に意図しない領域に注入されたドーパントの濃度分析等に用いられている。 Secondary Ion Mass Spectrometry (SIMS) is a method in which a sample surface is irradiated with oxygen or heavier ions as a primary ion beam, the sample surface is sputter-etched, and the emitted secondary ions are mass-analyzed. This is an elemental analysis method for element identification. The SIMS method is suitable for analysis of trace elements contained in a sample because it has an analysis capability of a concentration of ppb to ppm rather than analysis of main elements constituting the sample. In the SIMS method, for example, analysis in the depth direction of a diffusion region into which a dopant such as B or P formed on a silicon substrate of a semiconductor device such as LSI is implanted, or a dopant implanted in an unintended region at the time of implantation It is used for concentration analysis.
半導体装置は、いわゆるスケーリング則にしたがってその集積度の向上と共に深さ方向のサイズの縮小化が進められており、極薄膜の深さ方向の分析や、試料の極最表面での元素分析のニーズが高まっている。
しかしながら、試料が金属膜の場合、試料最表面においてその結晶性に依存した表面形状の変化が生じ易く、高精度の定量分析が困難であるという問題がある。 However, when the sample is a metal film, there is a problem that a change in surface shape depending on the crystallinity is likely to occur on the outermost surface of the sample, making it difficult to perform quantitative analysis with high accuracy.
そこで、本発明は上記問題点に鑑みてなされたもので、本発明の目的は、二次イオン質量分析法により金属試料に含まれる元素の深さ方向の濃度分布を高精度に測定可能な元素分析方法を提供することである。 Therefore, the present invention has been made in view of the above problems, and an object of the present invention is to provide an element capable of measuring the concentration distribution in the depth direction of an element contained in a metal sample with high accuracy by secondary ion mass spectrometry. It is to provide an analysis method.
本発明の一観点によれば、深さ方向に亘って略同等の含有量を有する主要金属元素を含む試料の表面に一次イオンビームを照射して、前記試料から放出された主要金属元素の二次イオン強度が分析対象の深さ範囲において試料の表面付近における二次イオン強度を基準として20%以内の範囲となる一次イオン入射角度に設定して、該主要金属元素よりも低い含有量の元素の深さ方向の濃度を測定する元素分析方法が提供される。 According to one aspect of the present invention, a primary ion beam is irradiated on the surface of a sample including a main metal element having a substantially equal content in the depth direction, and two main metal elements emitted from the sample are irradiated. An element having a lower content than the main metal element by setting the primary ion incident angle so that the secondary ion intensity is within a range of 20% with reference to the secondary ion intensity near the surface of the sample in the depth range of the analysis target. An elemental analysis method for measuring the concentration in the depth direction is provided.
本発明によれば、試料の主要金属元素の深さ方向の二次イオン強度の変動率が、分析対象の深さ範囲において試料の表面付近における二次イオン強度を基準として20%以内の範囲となる一次イオン入射角度に設定するので、主要金属元素の二次イオン強度が、例えば試料最表面においてその結晶性等に影響を回避して、試料自体の真の濃度分布と対応するようになる。そして、この一次イオン入射角度に設定して分析対象の元素の深さ方向分析を行うので、高精度な分析が可能となる。さらに、良好な再現性も得られる。 According to the present invention, the variation rate of the secondary ion intensity in the depth direction of the main metal element of the sample is within a range within 20% with reference to the secondary ion intensity near the surface of the sample in the depth range of the analysis target. Therefore, the secondary ion intensity of the main metal element avoids the influence of the crystallinity on the outermost surface of the sample, for example, and corresponds to the true concentration distribution of the sample itself. And since it sets to this primary ion incident angle and the depth direction analysis of the element to be analyzed is performed, a highly accurate analysis is attained. Furthermore, good reproducibility is also obtained.
本発明によれば、二次イオン質量分析法により金属試料に含まれる元素の深さ方向の濃度分布を高精度に測定可能な元素分析方法を提供できる。 ADVANTAGE OF THE INVENTION According to this invention, the elemental analysis method which can measure the concentration distribution of the depth direction of the element contained in a metal sample with a high precision by secondary ion mass spectrometry can be provided.
以下、図面を参照しつつ実施の形態を説明する。 Hereinafter, embodiments will be described with reference to the drawings.
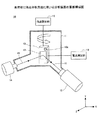
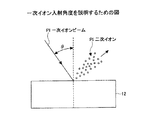
図1は、本発明に係る分析方法に用いる分析装置の要部構成図である。図2は1次イオン入射角度を説明するための図である。 FIG. 1 is a configuration diagram of a main part of an analyzer used in an analysis method according to the present invention. FIG. 2 is a diagram for explaining the primary ion incident angle.
図1および図2を参照するに、本発明に係る分析方法に用いる分析装置10は、真空容器11内に、試料12を載置する試料ステージ13と、1次イオンビームを放射するイオンガン14と、1次イオンビームの照射により試料12の表面から放出された2次イオンの元素分析を行う質量分析器15と、試料ステージ13を回転させて一次イオン入射角度を設定可能な角度設定部16と、1次イオンビームの照射により試料12あるいは試料ステージ13に流れる電流を測定する電流測定部18等から構成される。また、試料ステージ13は、図に示したY軸の周りに回転自在でかつ、X軸、Y軸、Z軸に微動可能なゴニオメータが備えられている。試料ステージ13は角度設定部16により自動あるいは手動でY軸周りの角度が設定可能である。試料ステージ13の表面には開口部13a、いわゆるファラデーカップが設けられている。ファラデーカップは、後ほど説明する一次イオン入射角度の絶対値校正において使用される。
Referring to FIGS. 1 and 2, an
分析装置10は、SIMS法を用いて元素分析が可能な装置であり、本発明の特徴部分以外は、公知のSIMS法を用いる分析装置と同様の構成を有する。ここでは、試料12がB(硼素)をイオン注入法により導入したMo(モリブデン)金属膜として説明する。なお、本発明の適用において試料がこれに限定されるわけではない。
The
次に分析装置10の動作を説明する。分析装置10は、イオンガン14により酸素イオンやそれ以上重い元素のイオンからなる一次イオンビームPIが放射される。ここでは、図1に示すXZ面に平行に一次イオンビームPIが放射されるとする。一次イオンビームPIが試料12の表面に入射する角度は、図2に示すように試料12の表面に垂直な方向を基準として、そこから一次イオンビームPIまでの角度が一次イオンビーム入射角度θである。一次イオンビーム入射角度θは、図1に示す試料ステージ13をY軸を軸として回転させることで設定できる。
Next, the operation of the
一次イオンビームPIが試料表面に衝突するとその衝撃によって、試料12を構成する元素がたたきだされ原子およびイオンが放出される。このイオンが二次イオンSIである。なお、放出された原子とイオンとの総個数に対する二次イオンSIの個数の割合が二次イオン化率(=二次イオンSIの個数/(放出された原子とイオンとの総個数))である。
When the primary ion beam PI collides with the sample surface, the elements constituting the
放出された二次イオンSIは質量分析器15に入射し、四重極質量分析計等により原子数ごとにカウントあるいはカウント率(単位時間当たりのカウント)が計数される。得られたカウントあるいはカウント率は、図示されないコンピュータ等により解析され、原子番号毎の度数分布(スペクトル)が得られる。得られたスペクトルは記憶装置等に保持される。
The released secondary ions SI are incident on the
本願発明者は、試料12に含まれる分析対象の元素(B)の濃度の深さ方向の分布を分析するにあたって、次に説明する問題に直面した。
The inventor of the present application faced the problem described below when analyzing the distribution of the concentration of the element (B) to be analyzed contained in the
図3は、SIMS法による深さ方向の濃度分布の分析方法の問題点を説明するための図である。縦軸はB強度を示し、横軸は試料の表面からの深さを示す。また、図中の4本の曲線は、一次イオン入射角度を0度("−○−"で示す。)、10度("−△−"で示す。)、15度("−□−"で示す。)、および20度("−▽−"で示す。)に異ならせて分析して得られた結果を示している。 FIG. 3 is a diagram for explaining the problems of the analysis method of the concentration distribution in the depth direction by the SIMS method. The vertical axis represents the B intensity, and the horizontal axis represents the depth from the surface of the sample. The four curves in the figure indicate the primary ion incident angle of 0 degrees (indicated by “−O−”), 10 degrees (indicated by “−Δ−”), and 15 degrees (“− □ −”). ) And 20 degrees (indicated by “− ▽ −”), and the results obtained by analysis are shown.
図3を参照するに、深さが1nm〜12nm付近の試料12の極最表面でのB強度は、4本の曲線が互いに分離しており、一次イオン入射角度によって得られるB強度が異なることが分かる。さらに20nm以上の深さでも、3本に分離しており一次イオン入射角度によって得られるB強度が異なることが分かる。このように同一試料のB濃度の分布が異なる結果となり、どの分布が真の分布なのか判断できないという分析方法にとっては深刻な問題である。
Referring to FIG. 3, the B intensity at the extreme outermost surface of the
本願発明者はこのような現象は、一次イオンビームPIの照射により、試料12の最表面における結晶性に依存した表面形状の変化が一次イオン入射角度によって異なることが一因であると推察している。そこで、本願発明者はこの問題を解決するために以下に説明する分析方法を見出したものである。
The inventor of the present application speculates that this phenomenon is caused by the change in the surface shape depending on the crystallinity on the outermost surface of the
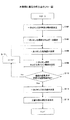
図4は、本発明に係る分析方法のフロー図である。図4を参照しつつ、本発明に係る分析方法を説明する。なお、本分析方法は図1に示す分析装置10を用いるので、図1を合わせて参照する。
FIG. 4 is a flowchart of the analysis method according to the present invention. The analysis method according to the present invention will be described with reference to FIG. In addition, since this analysis method uses the
最初に、試料ステージ13に対する一次イオン入射角度の絶対値を校正する(S102)。具体的には、一次イオンビームPIを試料ステージ13の表面に固定された試料12に照射して、試料12に流れる電流(試料電流)を電流測定部18により検出する。角度設定部16により、一次イオン入射角度を例えば−70度から70度に亘って5度毎にこの操作を行う。
First, the absolute value of the primary ion incident angle with respect to the
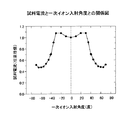
図5は、試料電流と一次イオン入射角度との関係図である。なお、図5は、試料としてシリコン基板を用い、一次イオンビームとして5keVに加速したN2 +を用いた。 FIG. 5 is a relationship diagram between the sample current and the primary ion incident angle. In FIG. 5, a silicon substrate was used as a sample, and N 2 + accelerated to 5 keV was used as a primary ion beam.
図5を参照するに、試料電流は、一次イオン入射角度が0度を通る対称線に対して左右対称の特性を示す。この特性を用いて、試料ステージ13のY軸の周りの角度位置との相対角度を得る。試料ステージ13の角度位置をその相対角度分だけ補正することで、一次イオン入射角度と試料ステージ13の角度を合わせられる。なお、このステップは既にこのステップを実施済みの試料ステージ13については行う必要はない。
Referring to FIG. 5, the sample current exhibits a symmetrical property with respect to a symmetry line through which the primary ion incident angle passes 0 degree. Using this characteristic, a relative angle with the angular position around the Y axis of the
なお、このステップ(S102)において、一次イオンビームPIを試料ステージ13の表面に直接照射し、試料ステージ13に流れる電流を電流測定部18により検出してもよい。この場合も試料12に直接照射した場合と同じ特性図(図5)が得られ、試料12に照射した場合と同様の効果が得られる。但し、一次イオンビームPIを照射する試料ステージ13の表面は、試料12の表面と平行な面である必要がある。なお、一次イオンビームPIをファラデーカップ13aに照射してもよい。これにより、一次イオンビームPIの飛散を回避して効率良く測定可能である。
In this step (S102), the surface of the
次いで、一次イオンビームPIの照射エネルギーを設定する(S104)。一次イオンビームPIの照射エネルギーは、任意に設定でき特に限定されないが、分析の対象となる深さや、深さ方向に応じて設定することが好ましい。例えば、試料12の極最表面を分析する場合は照射エネルギーが低いほどよく、例えば1.0keV以下の設定することが好ましい。なお、以前行った分析と一次イオンビームPIの照射エネルギーを異ならせる場合は、本発明の分析方法を実施して、一次イオン入射角度を決定する必要がある。
Next, the irradiation energy of the primary ion beam PI is set (S104). The irradiation energy of the primary ion beam PI can be arbitrarily set and is not particularly limited, but is preferably set according to the depth to be analyzed and the depth direction. For example, when analyzing the extreme outermost surface of the
次いで、一次イオン入射角度θ1を設定する(S106)。ここで、一次イオン入射角度θ1は任意に選択可能であるが、例えば0度に設定する。なお、この場合、例えばθ2では5度、θ3では10度というように次第に増加させていく。
Next, the primary ion incident angle θ 1 is set (S106). Here, the primary ion incident angle θ 1 can be arbitrarily selected, but is set to 0 degrees, for example. In this case, for example, the angle is gradually increased to 5 degrees for
次いで、一次イオンビームPIを試料12に照射し、試料12の深さ方向に亘って放出された2次イオンのうち、主要金属元素(Mo)の強度を測定する(S108)。
Next, the
図6Aは、Mo強度の深さプロファイルの一例であり、ここでは一次イオン入射角度が0度の場合に得られた深さプロファイルを示している。 FIG. 6A is an example of a depth profile of Mo intensity. Here, the depth profile obtained when the primary ion incident angle is 0 degree is shown.
図6Aを参照するに、Mo強度は最表面から一旦小さなピーク(I0で示す。)をとり、それよりも深い位置では急速に減少している。試料12自体のMo濃度は深さ方向にわたって、略一定の濃度に形成されているので、一次イオン入射角度が0度の場合は真の分布から外れている。
Referring to FIG. 6A, the Mo intensity once has a small peak (indicated by I 0 ) from the outermost surface, and rapidly decreases at a deeper position. Since the Mo concentration of the
次いで、得られた主要金属元素(Mo)の強度の変動率が所定の範囲内か否かを判断する(S110)。具体的には、所定の範囲は、試料の表面付近でのMo強度の最小値あるいは最大値をI0として、I0に対して測定対象となる深さに亘る強度の変動率が20%以内(さらに好ましくは15%以内)とすることが好ましい。すなわち、分析対象となる深さ(図6Aでは表面から100nmの深さまで)に範囲における変動幅をΔIとして、変動率=ΔI/I0×100が20%以内となるか否かを判断する。試料の表面でのMo強度I0、および変動幅ΔIは以下のようにして決定する。なお、以下の説明において、最小値および最大値は、分析対象となる深さの範囲における最小値および最大値を意味する。ただし、試料の極最表面の主要金属元素(Mo)の強度が急激に変化する範囲を除いて、最小値および最大値を決める。 Next, it is determined whether or not the intensity variation rate of the obtained main metal element (Mo) is within a predetermined range (S110). Specifically, the predetermined range, the minimum value or maximum value of Mo strength near the surface of the sample as I 0, variation ratio of the intensity over the depth to be measured relative to I 0 is within 20% (More preferably within 15%). That is, it is determined whether or not the variation rate = ΔI / I 0 × 100 is within 20%, assuming that the variation width in the range to the depth to be analyzed (in FIG. 6A, from the surface to a depth of 100 nm) is ΔI. The Mo intensity I 0 on the surface of the sample and the fluctuation range ΔI are determined as follows. In the following description, the minimum value and the maximum value mean the minimum value and the maximum value in the depth range to be analyzed. However, the minimum value and the maximum value are determined except for the range in which the strength of the main metal element (Mo) on the extreme outermost surface of the sample changes rapidly.
図6B、図6C、および図6Dは、Mo強度の深さプロファイルの他の例であり、一次イオン入射角度が、図6Bでは10度、図6Cでは15度、図6Dでは20度の場合に得られた深さプロファイルを示している。 6B, 6C, and 6D are other examples of the depth profile of the Mo intensity when the primary ion incidence angle is 10 degrees in FIG. 6B, 15 degrees in FIG. 6C, and 20 degrees in FIG. 6D. The obtained depth profile is shown.
図6Bを参照するに、Mo強度は、試料の極最表面において、Mo強度が急激に減少している。これは試料12の表面に付着した有機物等のコンタミネーションや自然酸化膜の影響であると考えられる。それよりも深い方向では、最大値を示し、その後深くなるにつれて減少し、一定値(最小値)を示している。このように、極最表面のコンタミネーションの影響による強度変化を除いて、表面側の最大値をI0とし、分析対象となる深さの範囲における最大値と最小値との差を変動幅ΔIとする。
Referring to FIG. 6B, the Mo intensity decreases sharply at the extreme outermost surface of the sample. This is considered to be due to contamination of organic matter and the like attached to the surface of the
この決定方法によれば、図6Bでは、強度I0は8.3×10⁵であり、変動幅ΔIは3.7×10⁵であるので、変動率は、45%である。これは20%を超えているので、分析対象となる元素分析のための一次イオン入射角度として選択されない。 According to this determination method, in FIG. 6B, the intensity I 0 is 8.3 × 10 5 and the variation width ΔI is 3.7 × 10 5 , so the variation rate is 45%. Since this exceeds 20%, it is not selected as the primary ion incident angle for elemental analysis to be analyzed.
図6Cを参照するに、深さプロファイルは、試料の極最表面においてMo強度が急激に減少し、極小値を示した後に最大値を示し、その後深くなるにつれて漸減し、一定値(最小値)を示している。このように試料の表面付近で最大値を取る場合は、その最大値をI0とする。強度I0は点Aの位置の強度8.1×10⁵であり、変動幅ΔIは点Aと点Bでの強度差0.9×10⁵であるので、変動率は、11%である。これは20%を下回っているので分析対象となる元素分析のための一次イオン入射角度として選択される。 Referring to FIG. 6C, the depth profile shows a maximum value after the Mo intensity sharply decreases at the extreme outermost surface of the sample, shows a minimum value, and then gradually decreases as the depth gets deeper, and then reaches a constant value (minimum value). Is shown. Thus, when taking the maximum value near the surface of the sample, the maximum value is set to I 0 . Since the intensity I 0 is the intensity 8.1 × 10 5 at the position of the point A and the fluctuation width ΔI is an intensity difference of 0.9 × 10 5 between the points A and B, the fluctuation rate is 11%. . Since this is less than 20%, it is selected as the primary ion incident angle for elemental analysis to be analyzed.
図6Dを参照するに、深さプロファイルは、試料の極最表面においてMo強度が急激に減少し、最小値を示し、その後深くなるにつれて漸増し最大値を示し、さらに漸減している。このように試料の表面付近で最小値のみを取る場合は、その最小値を強度I0とする。また、変動幅ΔIは、最小値(ここでは強度I0)と最大値との差である。強度I0は7×10⁵であり、変動幅ΔIは点Aと点Bでの強度差2.2×10⁵であるので、変動率は、31%である。これは20%を上回っているので分析対象となる元素分析のための一次イオン入射角度として選択されない。 Referring to FIG. 6D, in the depth profile, the Mo intensity sharply decreases at the extreme outermost surface of the sample, shows a minimum value, then gradually increases, shows a maximum value, and further decreases gradually. Thus, when only the minimum value is taken near the surface of the sample, the minimum value is set as the intensity I 0 . The fluctuation range ΔI is the difference between the minimum value (in this case, the intensity I 0 ) and the maximum value. Since the intensity I 0 is 7 × 10 5 and the variation width ΔI is 2.2 × 10 5 between the points A and B, the variation rate is 31%. Since this exceeds 20%, it is not selected as the primary ion incident angle for elemental analysis to be analyzed.
変動率が所定の強度範囲外(S110で"No")の場合は、次の一次イオン入射角度θ2に設定して(S112,S106)、上述したステップと同様にS108、S110を行う。 When the fluctuation rate is outside the predetermined intensity range (“No” in S110), the next primary ion incident angle θ 2 is set (S112, S106), and S108 and S110 are performed in the same manner as the above-described steps.
また、変動率が所定の範囲内(S110で"Yes")である場合は、その一次イオン入射角度を分析対象の元素(B)を分析するための一次イオン入射角度に決定する(S114)。具体的には、試料ステージ13の角度位置を角度設定部16により、決定された一次イオン入射角度に合わせる。ここでは、先の図6Cで示したように一次イオン入射角度は15度に決定される。なお、複数の一次イオン入射角度において変動率が所定の範囲内の場合は、変動率が最も小さい一次イオン入射角度を選択することが好ましい。
When the variation rate is within the predetermined range (“Yes” in S110), the primary ion incident angle is determined as the primary ion incident angle for analyzing the element (B) to be analyzed (S114). Specifically, the angle setting unit 16 adjusts the angular position of the
次いで、一次イオンビームPIを試料12に照射して分析対象の元素(B)の深さ方向分析を行う(S116)。その結果、先に示した図3で示した15度のB強度の深さ方向プロファイルが得られる。なお、この際、主要金属元素(Mo)の深さ方向分析を行ってもよい。
Next, the
本実施の形態によれば、試料12の主要金属元素(Mo)の深さ方向の二次イオン強度の変動率が所定の範囲内となる一次イオン入射角度に設定する。これにより、主要金属元素の二次イオン強度が、例えば試料12の最表面においてその結晶性等に影響されず、試料自体の真の濃度分布と対応するようになる。そして、この一次イオン入射角度に設定して分析対象の元素の深さ方向分析を行うので、高精度な分析が可能となる。さらに、良好な再現性も得られる。
According to the present embodiment, the primary ion incident angle is set such that the variation rate of the secondary ion intensity in the depth direction of the main metal element (Mo) of the
本願発明者は、本発明の分析方法において、以下の効果も合わせて見出した。 The inventor of the present application has also found the following effects in the analysis method of the present invention.
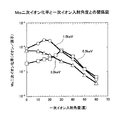
図7は、Mo二次イオン化率と一次イオンビームの入射角度との関係図である。なお、一次イオンビームの照射エネルギーを0.5keV("−□−"で示す。)、1.0keV("−○−"で示す。)、および3.0keV("−△−"で示す。)に設定して測定した。また、試料は上述した試料と同様の試料を用いている。)
図7を参照するに、一次イオンビームの照射エネルギーが1.0keVでは、一次イオン入射角度が15度において二次イオン化率が最大値を示している。
FIG. 7 is a relationship diagram between the Mo secondary ionization rate and the incident angle of the primary ion beam. Note that the irradiation energy of the primary ion beam is 0.5 keV (indicated by “− □ −”), 1.0 keV (indicated by “−O−”), and 3.0 keV (indicated by “−Δ−”). ) And measured. In addition, the sample is the same sample as described above. )
Referring to FIG. 7, when the irradiation energy of the primary ion beam is 1.0 keV, the secondary ionization rate shows the maximum value when the primary ion incident angle is 15 degrees.
また、本願発明者は、一次イオンビームの照射エネルギーが3.0keVの場合は、上述した分析法において決定された一次イオン入射角度は0度であることを確認している。一方、図7に示すように、一次イオンビームの照射エネルギーが3.0keVの場合は、一次イオン入射角度が0度で二次イオン化率が最大となる。また、一次イオンビームの照射エネルギーが0.5keVの場合も、上述した分析法において決定された一次イオン入射角度は30度であることを確認しており、図7に示すように、一次イオン入射角度が30度で二次イオン化率が最大となる。 The inventors of the present application have confirmed that when the irradiation energy of the primary ion beam is 3.0 keV, the primary ion incident angle determined by the above-described analysis method is 0 degree. On the other hand, as shown in FIG. 7, when the irradiation energy of the primary ion beam is 3.0 keV, the secondary ionization rate becomes maximum when the primary ion incident angle is 0 degree. Further, even when the irradiation energy of the primary ion beam is 0.5 keV, it has been confirmed that the primary ion incident angle determined in the above-described analysis method is 30 degrees, and as shown in FIG. The secondary ionization rate is maximized at an angle of 30 degrees.
これらのことから、上述した分析方法において決定された一次イオン入射角度(以下、説明の便宜のため「一次イオン入射角度θA」あるいは単に「θA」と称する。)は、二次イオン化率が最大となる角度であり、そのため、これ以外の一次イオン入射角度に設定するよりも定量性が高まり、よりいっそうの高精度の分析が可能となる。 For these reasons, the primary ion incidence angle determined in the above-described analysis method (hereinafter referred to as “primary ion incidence angle θ A ” or simply “θ A ” for convenience of explanation) has a secondary ionization rate. This is the maximum angle, and therefore, the quantitativeness is improved as compared with the case of setting the incident angle of the primary ion other than this, and analysis with higher accuracy becomes possible.
この作用を本願発明者は以下のように推察している。すなわち、一次イオン入射角度θAでは、試料表面に十分な主要金属元素の酸化物(MoOX)が形成され、かつ試料表面において主要金属元素をイオン化させるのに必要なエネルギーを十分に与えることができると考えられる。そのため、深さ方向亘って主要金属元素の二次イオン強度が略一定となり、かつ、二次イオン化率が最大となっていると考えられる。 The present inventor presumes this effect as follows. That is, at the primary ion incident angle θ A , a sufficient oxide (MoO x ) of the main metal element is formed on the sample surface, and sufficient energy is provided to ionize the main metal element on the sample surface. It is considered possible. Therefore, it is considered that the secondary ion intensity of the main metal element is substantially constant over the depth direction and the secondary ionization rate is maximized.
なお、上述した実施の形態では、試料12の最表面から所定の深さまでの深さ範囲における元素濃度を分析の対象としたが、たとえば分析対象の金属膜の表面に他の膜が形成されている場合は、分析対象の金属膜の表面から所定の深さまでの深さ範囲において本発明の分析方法を適用する。
In the above-described embodiment, the element concentration in the depth range from the outermost surface of the
次に、本発明の分析方法に係る実施例と、本発明によらない比較例を説明する。ここでは、分析対象となる試料は、シリコン基板とその上にシリコン酸化膜(膜厚30nm)およびMo膜(膜厚350nm)を積層した積層体であり、Mo膜側からP(リン)を注入したものである。
Next, examples according to the analysis method of the present invention and comparative examples not according to the present invention will be described. Here, the sample to be analyzed is a stacked body in which a silicon substrate and a silicon oxide film (
図8は、実施例および比較例の深さプロファイルを示す図である。縦軸は、MoおよびSiについてはカウント率(カウント/秒)、Pの深さプロファイルについてはP濃度(原子/cm3)を示している。また、横軸はMo膜の表面からの深さ(nm)を示している。なお、MoおよびSiの深さプロファイルについては一次イオン入射角度を15度に設定して得られたものである。なお、図中、実施例は"−□−"で示し、比較例は"−▽−"で示している。 FIG. 8 is a diagram illustrating the depth profiles of the example and the comparative example. The vertical axis represents the count rate (counts / second) for Mo and Si, and the P concentration (atoms / cm 3 ) for the depth profile of P. The horizontal axis represents the depth (nm) from the surface of the Mo film. The depth profiles of Mo and Si were obtained by setting the primary ion incident angle to 15 degrees. In the drawing, the example is indicated by “− □ −”, and the comparative example is indicated by “− ▽ −”.
実施例および比較例のPの深さプロファイルの分析において、一次イオンビームの照射エネルギーを1.0keVに設定した。また、実施例に係る分析方法では、一次イオン入射角度を15度に設定した。なお、一次イオン入射角度が15度では、分析対象の深さに亘ってMo強度の変動率が20%以内であった。また、本発明によらない比較例として、一次イオン入射角度を30度に設定した。なお、一次イオン入射角度が30度では分析対象の深さに亘ってMo強度の変動率が20%を超えていた。 In the analysis of the depth profile of P in the examples and comparative examples, the irradiation energy of the primary ion beam was set to 1.0 keV. In the analysis method according to the example, the primary ion incident angle was set to 15 degrees. When the primary ion incident angle was 15 degrees, the variation rate of Mo intensity was within 20% over the depth of the analysis target. As a comparative example not according to the present invention, the primary ion incident angle was set to 30 degrees. When the primary ion incident angle was 30 degrees, the variation rate of Mo intensity exceeded 20% over the depth of the analysis target.
図8を参照するに、実施例は、比較例よりも、深さが10nm〜20nmに存在するP濃度のピーク値が大きく、深さが200nm〜300nmでは低くなっており、十分ダイナミックレンジが得られている。比較例では、ドーパントのPがシリコン酸化膜の表面に1018原子/cm3台の濃度で存在しているように見えるのに対して、実施例では、シリコン酸化膜の表面では、1018原子/cm3よりも低くなっており、良好な検出限界が得られていることが分かる。実施例によれば、適正なP濃度の深さプロファイルを得ることができる。 Referring to FIG. 8, in the example, the peak value of the P concentration existing at a depth of 10 nm to 20 nm is larger than that of the comparative example, and the depth is low at 200 nm to 300 nm, so that a sufficient dynamic range is obtained. It has been. In the comparative example, it appears that the dopant P is present at a concentration of 10 18 atoms / cm 3 on the surface of the silicon oxide film, whereas in the example, 10 18 atoms are present on the surface of the silicon oxide film. It is lower than / cm 3, indicating that a good detection limit is obtained. According to the embodiment, an appropriate P concentration depth profile can be obtained.
以上、本発明の好ましい実施の形態について詳述したが、本発明は係る特定の実施の形態に限定されるものではなく、特許請求の範囲に記載された本発明の範囲内において、種々の変形・変更が可能である。 The preferred embodiment of the present invention has been described in detail above, but the present invention is not limited to the specific embodiment, and various modifications can be made within the scope of the present invention described in the claims.・ Change is possible.
例えば、上述した実施の形態では、試料としてBあるいはPが不純物として注入されたMo金属膜を例に説明したが、本発明は、Mo金属膜の変わりに他の金属元素の金属膜や2種以上の元素からなる合金膜にも適用可能である。合金膜の場合、それに含まれるいずれかの元素を主要金属元素として本発明を適用すればよい。また、不純物元素もBやPに限定されないことはいうまでもない。 For example, in the above-described embodiment, the Mo metal film in which B or P is implanted as an impurity has been described as an example. However, the present invention is not limited to the Mo metal film, but a metal film of other metal elements or two kinds of films. The present invention can also be applied to an alloy film made of the above elements. In the case of an alloy film, the present invention may be applied with any element contained therein as a main metal element. Needless to say, the impurity element is not limited to B or P.
なお、以上の説明に関してさらに以下の付記を開示する。
(付記1) 深さ方向に亘って略同等の含有量を有する主要金属元素を含む試料の表面に一次イオンビームを照射して、
前記試料から放出された主要金属元素の二次イオン強度が分析対象の深さ範囲において試料の表面付近における二次イオン強度を基準として20%以内の範囲となる一次イオン入射角度に設定して、該主要金属元素よりも低い含有量の元素の深さ方向の濃度を測定する元素分析方法。
(付記2) 前記元素が主要金属元素に導入された不純物元素であることを特徴とする付記1記載の元素分析方法。
(付記3) 前記分析対象の深さ範囲は、試料の表面から所定の深さまでの範囲であることを特徴とする付記1または2記載の元素分析方法。
(付記4) 前記一次イオンビームの照射エネルギーに応じて一次イオン入射角度を設定することを特徴とする付記1〜3のうち、いずれか一項記載の元素分析方法。
(付記5) 前記一次イオン入射角度を異ならせつつ一次イオンビームを試料に照射して試料に流れる電流量を測定し、得られた一次イオン入射角度と該電流量との関係に基づいて、一次イオン入射角度の絶対値を決定することを特徴とする付記1〜4のうち、いずれか一項記載の元素分析方法。
(付記6) 前記試料は一次イオン入射角度を増減させる方向に回転自在の試料ステージに載置され、
一次イオン入射角度を異ならせつつ一次イオンビームを試料ステージに照射して試料ステージに流れる電流量を測定し、得られた一次イオン入射角度と該電流量との関係に基づいて、一次イオン入射角度の絶対値を決定することを特徴とする付記1〜4のうち、いずれか一項記載の元素分析方法。
(付記7) 前記一次イオンビームは、試料ステージに形成された開口部に照射することを特徴とする付記6記載の元素分析方法。
In addition, the following additional notes are disclosed regarding the above description.
(Appendix 1) Irradiating the surface of a sample containing a main metal element having substantially the same content in the depth direction with a primary ion beam,
The secondary ion intensity of the main metal element released from the sample is set to a primary ion incident angle that is within a range of 20% with reference to the secondary ion intensity near the surface of the sample in the depth range of the analysis target, An elemental analysis method for measuring a concentration in a depth direction of an element having a lower content than the main metal element.
(Supplementary note 2) The elemental analysis method according to supplementary note 1, wherein the element is an impurity element introduced into a main metal element.
(Additional remark 3) The depth range of the said analysis object is a range from the surface of a sample to predetermined depth, The elemental analysis method of
(Additional remark 4) The primary ion incident angle is set according to the irradiation energy of the said primary ion beam, The elemental analysis method as described in any one of Additional remarks 1-3 characterized by the above-mentioned.
(Supplementary Note 5) The amount of current flowing through the sample is measured by irradiating the sample with the primary ion beam while changing the incident angle of the primary ions, and the primary ion is measured based on the relationship between the obtained primary ion incident angle and the amount of current. The elemental analysis method according to any one of supplementary notes 1 to 4, wherein an absolute value of an ion incident angle is determined.
(Appendix 6) The sample is placed on a sample stage that is rotatable in a direction to increase or decrease the primary ion incident angle,
Measure the amount of current flowing through the sample stage by irradiating the sample stage with the primary ion beam while varying the primary ion incident angle. Based on the relationship between the obtained primary ion incident angle and the current amount, the primary ion incident angle The elemental analysis method according to any one of supplementary notes 1 to 4, wherein the absolute value of the element is determined.
(Additional remark 7) The said primary ion beam irradiates the opening part formed in the sample stage, The elemental analysis method of Additional remark 6 characterized by the above-mentioned.
10 分析装置
11 真空容器
12 試料
13 試料ステージ
14 イオンガン
15 質量分析器
16 角度設定部
18 電流測定部
PI 一次イオンビーム
SI 二次イオン
DESCRIPTION OF
Claims (4)
測定された該主要金属元素の二次イオン強度が分析対象の深さ範囲において試料の表面付近における二次イオン強度を基準として20%以内の範囲であるかを判定し、
前記測定された前記主要金属元素の二次イオン強度が前記20%以内の範囲となる一次イオン入射角度に設定して、該主要金属元素よりも低い含有量の元素の深さ方向の濃度を測定する
元素分析方法。 The surface of the sample containing the main metal element having substantially the same content in the depth direction is irradiated with a primary ion beam, and the main metal element released from the sample in the depth direction of the sample Measure the secondary ionic strength of
The secondary ion intensity near the surface of the sample secondary ion intensity in the depth range of analyte measured the major metallic element to determine the range within 20%, based,
The primary ion incident angle at which the measured secondary ion intensity of the main metal element is within the range of 20% is set, and the concentration in the depth direction of the element having a lower content than the main metal element is measured. Elemental analysis method.
Priority Applications (1)
| Application Number | Priority Date | Filing Date | Title |
|---|---|---|---|
| JP2006100591A JP4836632B2 (en) | 2006-03-31 | 2006-03-31 | Elemental analysis method |
Applications Claiming Priority (1)
| Application Number | Priority Date | Filing Date | Title |
|---|---|---|---|
| JP2006100591A JP4836632B2 (en) | 2006-03-31 | 2006-03-31 | Elemental analysis method |
Publications (2)
| Publication Number | Publication Date |
|---|---|
| JP2007271574A JP2007271574A (en) | 2007-10-18 |
| JP4836632B2 true JP4836632B2 (en) | 2011-12-14 |
Family
ID=38674509
Family Applications (1)
| Application Number | Title | Priority Date | Filing Date |
|---|---|---|---|
| JP2006100591A Expired - Fee Related JP4836632B2 (en) | 2006-03-31 | 2006-03-31 | Elemental analysis method |
Country Status (1)
| Country | Link |
|---|---|
| JP (1) | JP4836632B2 (en) |
Families Citing this family (1)
| Publication number | Priority date | Publication date | Assignee | Title |
|---|---|---|---|---|
| JP5050568B2 (en) * | 2007-03-02 | 2012-10-17 | 富士通株式会社 | Depth direction impurity element concentration analysis method |
Family Cites Families (11)
| Publication number | Priority date | Publication date | Assignee | Title |
|---|---|---|---|---|
| JP2574792B2 (en) * | 1987-03-27 | 1997-01-22 | 日本電信電話株式会社 | Element distribution analysis in the depth direction |
| JPH05188020A (en) * | 1991-09-17 | 1993-07-27 | Sony Corp | Quantitative analysis method by secondary ion mass spectrometry and secondary ion mass spectrometry device |
| JPH05290797A (en) * | 1992-04-09 | 1993-11-05 | Matsushita Electric Ind Co Ltd | Secondary ion mass spectrometry |
| JP2962073B2 (en) * | 1992-10-23 | 1999-10-12 | 富士通株式会社 | Measurement method of concentration distribution of trace elements |
| JPH0954053A (en) * | 1995-08-18 | 1997-02-25 | Shimadzu Corp | Surface analyzer |
| JP2000206063A (en) * | 1999-01-08 | 2000-07-28 | Nec Corp | Method for analyzing impurity concentration of interface |
| JP2000221148A (en) * | 1999-01-29 | 2000-08-11 | Nec Corp | Method for analyzing element distribution in depthwise direction |
| JP2001091482A (en) * | 1999-09-27 | 2001-04-06 | Nec Corp | Contained element analyzing method |
| JP2002310961A (en) * | 2001-04-19 | 2002-10-23 | Fujitsu Ltd | Depthwise element distribution measuring method |
| JP2003004674A (en) * | 2001-06-22 | 2003-01-08 | Matsushita Electric Ind Co Ltd | Sample for quantitative analysis and preparing method thereof |
| JP2004226229A (en) * | 2003-01-23 | 2004-08-12 | Fujitsu Ltd | Method of analyzing distribution in depth direction of group v element in group iv semiconductor |
-
2006
- 2006-03-31 JP JP2006100591A patent/JP4836632B2/en not_active Expired - Fee Related
Also Published As
| Publication number | Publication date |
|---|---|
| JP2007271574A (en) | 2007-10-18 |
Similar Documents
| Publication | Publication Date | Title |
|---|---|---|
| US6173036B1 (en) | Depth profile metrology using grazing incidence X-ray fluorescence | |
| Hönicke et al. | Characterization of ultra-shallow aluminum implants in silicon by grazing incidence and grazing emission X-ray fluorescence spectroscopy | |
| US7456399B1 (en) | Calibrating multiple photoelectron spectroscopy systems | |
| WO1997006430A1 (en) | Method and apparatus for total reflection x-ray fluorescence spectroscopy | |
| Trojek | Reduction of surface effects and relief reconstruction in X-ray fluorescence microanalysis of metallic objects | |
| US8011830B2 (en) | Method and system for calibrating an X-ray photoelectron spectroscopy measurement | |
| WO2013035082A1 (en) | Combined method of secondary ion mass spectroscopy and energy dispersive x-ray for quantitative chemical analysis of various solid materials and thin films without the use of specific patterns or standards | |
| JP4836632B2 (en) | Elemental analysis method | |
| KR100955434B1 (en) | Nondestructive characterization of thin films using measured basis spectra and/or based on acquired spectrum | |
| CN113340922B (en) | Calibration method and element test method of energy spectrometer | |
| US7358492B2 (en) | Apparatus, method, and computer program product for deconvolution analysis | |
| Klockenkämper et al. | Comparison of shallow depth profiles of cobalt‐implanted Si wafers determined by total reflection x‐ray fluorescence analysis after repeated stratified etching and by rutherford backscattering spectrometry | |
| Qiu et al. | Calibration of thickness-dependent k-factors for germanium X-ray lines to improve energy-dispersive X-ray spectroscopy of SiGe layers in analytical transmission electron microscopy | |
| JP5904030B2 (en) | Secondary ion mass spectrometry method and standard sample | |
| Staub et al. | Quantitative determination of dopant dose in shallow implants using the low energy X-ray emission spectroscopy technique | |
| JP2018205126A (en) | Secondary ion mass spectrometry method and secondary ion mass spectroscope | |
| Anderle et al. | Ultra shallow depth profiling by secondary ion mass spectrometry techniques | |
| JP5391942B2 (en) | Primary ion energy correction method in secondary ion mass spectrometry | |
| Bubert et al. | Dose determination of nickel implantations in silicon wafers | |
| JP2008215989A (en) | Concentration analyzing method of element in depth direction | |
| JP3374497B2 (en) | Concentration distribution measurement method | |
| KR100664868B1 (en) | Standard Specimen for Secondary Ion Mass Spectrometry and Method for Analyzing The Same by Secondary Ion Mass Spectrometry | |
| Moore et al. | B1. 24 Rutherford backscattering, resonance scattering, PIXE and forward (recoil) scattering | |
| JP5874409B2 (en) | Secondary ion mass spectrometry method and secondary ion mass spectrometer | |
| JP5564841B2 (en) | Secondary ion mass spectrometry and secondary ion mass spectrometry system |
Legal Events
| Date | Code | Title | Description |
|---|---|---|---|
| A621 | Written request for application examination |
Free format text: JAPANESE INTERMEDIATE CODE: A621 Effective date: 20081205 |
|
| A131 | Notification of reasons for refusal |
Free format text: JAPANESE INTERMEDIATE CODE: A131 Effective date: 20110607 |
|
| A521 | Written amendment |
Free format text: JAPANESE INTERMEDIATE CODE: A523 Effective date: 20110802 |
|
| TRDD | Decision of grant or rejection written | ||
| A01 | Written decision to grant a patent or to grant a registration (utility model) |
Free format text: JAPANESE INTERMEDIATE CODE: A01 Effective date: 20110830 |
|
| A01 | Written decision to grant a patent or to grant a registration (utility model) |
Free format text: JAPANESE INTERMEDIATE CODE: A01 |
|
| A61 | First payment of annual fees (during grant procedure) |
Free format text: JAPANESE INTERMEDIATE CODE: A61 Effective date: 20110927 |
|
| FPAY | Renewal fee payment (event date is renewal date of database) |
Free format text: PAYMENT UNTIL: 20141007 Year of fee payment: 3 |
|
| R150 | Certificate of patent or registration of utility model |
Free format text: JAPANESE INTERMEDIATE CODE: R150 |
|
| LAPS | Cancellation because of no payment of annual fees |