JP4693474B2 - Method and apparatus for monitoring the concentration of a test component in a human or animal body - Google Patents
Method and apparatus for monitoring the concentration of a test component in a human or animal body Download PDFInfo
- Publication number
- JP4693474B2 JP4693474B2 JP2005117542A JP2005117542A JP4693474B2 JP 4693474 B2 JP4693474 B2 JP 4693474B2 JP 2005117542 A JP2005117542 A JP 2005117542A JP 2005117542 A JP2005117542 A JP 2005117542A JP 4693474 B2 JP4693474 B2 JP 4693474B2
- Authority
- JP
- Japan
- Prior art keywords
- test component
- value
- time
- function
- values
- Prior art date
- Legal status (The legal status is an assumption and is not a legal conclusion. Google has not performed a legal analysis and makes no representation as to the accuracy of the status listed.)
- Expired - Fee Related
Links
Images


Classifications
-
- A—HUMAN NECESSITIES
- A61—MEDICAL OR VETERINARY SCIENCE; HYGIENE
- A61B—DIAGNOSIS; SURGERY; IDENTIFICATION
- A61B5/00—Measuring for diagnostic purposes; Identification of persons
- A61B5/145—Measuring characteristics of blood in vivo, e.g. gas concentration, pH value; Measuring characteristics of body fluids or tissues, e.g. interstitial fluid, cerebral tissue
- A61B5/14532—Measuring characteristics of blood in vivo, e.g. gas concentration, pH value; Measuring characteristics of body fluids or tissues, e.g. interstitial fluid, cerebral tissue for measuring glucose, e.g. by tissue impedance measurement
Description
本発明はヒトや動物の生体中の被験成分濃度をモニタリングする方法並びにその装置に関するもので、モニタリングする同成分濃度に換算しえる何らかの被験成分値y(tn)を一連の時刻tnにおいて観測し同成分濃度を算出するものである。 The present invention relates to a method and apparatus for monitoring the concentration of a test component in a living body of a human or animal, and observes some test component value y (t n ) that can be converted to the monitored component concentration at a series of times t n . The concentration of the same component is calculated.
このような方法ならびに同方法を実施するための装置は、たとえば米国特許第5,507,288号明細書に記載がある。ちなみに、同米国特許に記載された方法は医療上重要な意味をもつパラメターである患者体内のグルコース濃度を継続的にモニターしようとするものである。グルコース濃度を経時的に、かつ継続的にインビボ・モニタリングすることで真性糖尿病の長期にわたる影響で生じる極度に重篤な事態(網膜症を原因とする失明など)の発生を防止できることが証明されている。このような経時的データの記録に基づいて所定の医薬品(インシュリン)についてその必要な量を正確なタイミングで投与できることになり、ひいては血糖値レベルを健常者のそれに匹敵する狭い目標域内に常時維持することができることになるのである。 Such a method as well as an apparatus for carrying out the method are described, for example, in US Pat. No. 5,507,288. Incidentally, the method described in the US patent seeks to continuously monitor the glucose concentration in a patient, which is a medically important parameter. Proven to monitor the glucose concentration over time and continuously in vivo to prevent the occurrence of extremely severe events (such as blindness due to retinopathy) caused by the long-term effects of diabetes mellitus. Yes. Based on such time-lapse data recording, the required amount of a given drug (insulin) can be administered at an accurate timing, and the blood glucose level is constantly maintained within a narrow target range comparable to that of a healthy person. It will be possible.
治療薬品の投与や関連する医療行為の効率をより一層向上させるためには被験成分の濃度をその時点時点で捉えるに留まらずその先の濃度の予測もできることが望ましい。被験成分濃度の先々の値が予測できることは、糖尿病に関しては非常に大きな意義を持つ。その意義はグルコースの血中濃度が限界値を越えて上昇するのをインシュリンの投与で押しとどめることが可能となることに留まらない。それに加えてすぐにもグルコースの血中濃度が限界値以下にまで低下しそうであるといった状況が予見できるようになり、したがって気を失うなどの危険が迫っていることを事前に患者自身に予告でき、患者は糖分の摂取を行ってその危険を未然に防止できるようになることを意味する。 In order to further improve the efficiency of administration of a therapeutic drug and related medical practices, it is desirable that the concentration of the test component is not limited to that point in time but can be predicted. The ability to predict previous values of test component concentrations is of great significance for diabetes. The significance is not limited to the fact that the blood glucose concentration rises beyond the limit value and can be suppressed by administration of insulin. In addition, it is possible to foresee a situation where the blood glucose level is likely to drop below the limit value soon, so it is possible to notify the patient in advance that there is an imminent danger such as loss of consciousness. This means that the patient can prevent the danger by taking sugar.
ヒトや動物の生体内の被験成分濃度についてその先々到達するであろう値を予測するには、先々の同成分の濃度はそれまでの同成分濃度値の実績にのみ依存するのではなく、その時までの食事や投与された医薬品さらには患者当人の運動量など様々なパラメターが関与するものであり、そのような予測値の算出は単に実測値を獲得するのと比べてより一層複雑な行為となる。 In order to predict the value that will be reached in advance for the concentration of a test component in human or animal organisms, the concentration of the same component does not depend only on the previous results of the same component concentration value, but at that time. Various parameters such as diet, administered medicines, and patient's exercise amount are involved, and calculation of such predicted values is more complicated than simply acquiring actual measured values. Become.
米国特許第6,272,480号明細書にも血液中のグルコース濃度をモニタリングする一方法の開示がある。同米国特許による同濃度のモニタリング方法は血中のグルコース濃度についてそれまでに測定された経時的データから同濃度の先々における値を人工の神経系を用いて予測するものである。しかし、使用される人工神経系にはその使用に先立ってトレーニングを加える必要があり、同トレーニング時に対象とした濃度・時間パターン以外の濃度・時間関係状況が発生するに至っては信頼性ある予測値が得られないという問題がある。 US Pat. No. 6,272,480 also discloses a method for monitoring glucose concentration in blood. The monitoring method of the same concentration according to the US patent predicts the value of the same concentration in the future from the time-lapse data measured so far using the artificial nervous system. However, the artificial nervous system to be used needs to be trained prior to its use, and a reliable predictive value will occur if a concentration / time-related situation other than the concentration / time pattern targeted during the training occurs. There is a problem that cannot be obtained.
欧州特許出願公開第1 102 194号明細書は血中のグルコース濃度を経時的に測定し患者個人個人の状況に関する記録、たとえば、炭水化物の摂取記録やインシュリンの投与記録といった特定の観点に関する記録を勘案して同経時的測定値をその後にくる未来の時刻にまで外挿する方法を開示している。この方法の現実的な適用に当たっては、患者個人個人のこのような状況記録を作成、入手しなければならないがそれがこの方法にとって重大な欠陥となっている。なぜならばそのようなデータが簡単に入手できるとは言いがたくまた入手してもエラーを含んでいることが多いからである。 European Patent Application Publication No. 1 102 194 takes into account the records of specific aspects such as the record of individual intake of patients, such as records of carbohydrate intake and insulin administration, by measuring blood glucose levels over time. Thus, a method of extrapolating the same time-measurement value to a future time after that is disclosed. In practical application of this method, it is necessary to create and obtain such a situation record for each individual patient, which is a serious flaw for this method. This is because such data cannot easily be obtained, and even if obtained, it often contains errors.
本願発明の目的は、以上の状況に鑑み、ヒトや動物の生体中の被験成分濃度を連続的にモニタリングすると共にその後先々の同成分濃度を予測する手段を提供することである。本方法は、その中でも特に、過去の時間帯における濃度値の記録のほかには、たとえば食事やインシュリンの摂取記録といったような患者個人個人に係わる状況の記録を必要とせずに先々到達するであろう濃度値を予測するというものである。 In view of the above situation, an object of the present invention is to provide means for continuously monitoring the concentration of a test component in a living body of a human or animal and predicting the concentration of the same component thereafter. Among other things, this method arrives first without requiring the recording of the situation related to the individual patient, such as a record of intake of meals and insulin, in addition to recording of concentration values in the past time zone. It predicts wax concentration values.
本目的は、ヒトや動物の生体内における被験成分の時刻と共に変化する濃度を算出するという「被験成分濃度の継続的なモニタリング方法」によって実現される。より具体的には、同成分の濃度に換算しえる被験成分値y(tn)を一連の時刻tnにおいて求めようとするものであり、同方法は予測対象時点までの時間Δtのあいだの被験成分の予測値y(tn0+Δt)を予測するのにも用いられるものであり、同方法は次の工程:
被験成分値
![]()
![]()
![]()
![]()
![]()
Test component value
![]()
![]()
![]()
![]()
![]()
以上のほか、本目的はヒトや動物の生体内における被験成分の時刻と共に変化する濃度を算出するという「被験成分濃度の継続的なモニタリング装置」によっても実現される。より具体的には、同装置は同成分の濃度に換算しえる何らかの測定パラメターに関する一連の時刻tnにおける測定値を測定し測定信号として出力する測定ユニット(12)と、同成分の濃度に換算できる同成分の被験成分値y(tn)を前記一連の時刻における測定値に基づいて算出する分析ユニット(3)で構成される。同分析ユニットは予測実施時間Δtにわたる被験成分の予測値y(tn0+Δt)を予測するのにも用いることが可能であり、その予測の実行には、被験成分値
![]()
![]()
![]()
![]()
![]()
![]()
![]()
![]()
![]()
![]()
本発明になる方法にあっては、ヒトやあるいは動物の生体と同生体中の被験成分はある程度のノイズが入り込みはするものの一意的な値を与える動的なシステムとして、数学的に扱われる。このシステムの経時的な変化は被験成分の濃度の決定に関与する独立変数の数によって定まる次元数の相空間における相の軌跡として表現される。たとえば、糖尿病に関するケースにあっては、これらの独立変数は血中グルコース濃度の将来値の決定にかかわる摂取したブレッド単位の数とインシュリンの投与量値とされる。 In the method according to the present invention, a test component in the living body of a human or animal is treated mathematically as a dynamic system that gives a unique value although a certain amount of noise enters. The change in the system over time is expressed as a phase trajectory in a dimensional phase space determined by the number of independent variables involved in determining the concentration of the test component. For example, in the case of diabetes, these independent variables are the number of bread units ingested and the insulin dose value involved in determining the future value of blood glucose concentration.
ただし、現実においては、被験成分の濃度の決定に関与する独立変数の数は一般には未知で、そのためにシステムの前記経時的な変化が相の軌跡を用いて記述される相空間の次元数も不明である。 However, in reality, the number of independent variables involved in the determination of the concentration of test component generally is unknown, also the number of dimensions of the phase space where the temporal change of the system is described using the trajectory of the phase to its It is unknown.
本発明にあっては、被験成分値を予測するためには、そのシステムが大きな次元数をもちかねないとしてもそれら全ての相におよぶ相の軌跡を知る必要はないという事実を利用するものである。同相の軌跡データに一点を外挿するのに必要なのはその一点の近傍の相軌跡データが必要なだけである。特に、外挿のためには当該システムの全ての相空間を考慮する必要はなく、かなり少ない次元数の相空間を恣意的に構築しその低次元数の空間内での動きを検討することで充分となる。 In the present invention, in order to predict a test component value, the fact that the system does not need to know the trajectory of all phases, even if the system may have a large number of dimensions, is used. is there. What is needed a point on the trajectory data of the same phase to extrapolate is only necessary phase trajectory data in the vicinity of the one point. In particular, it is not necessary to consider all the phase spaces of the system for extrapolation. By arbitrarily constructing a phase space with a very small number of dimensions and examining its movement in the low-dimensional number space, It will be enough.
当該システムの動きに大きく影響している自由度要素を取り込むに足る次元数が考慮されれば充分となる。すなわち当該システムの動きに無視できる程度にしか影響しない自由度要素は考慮の対象としないで、ここに構築する空間の次元数を少なくするのである。 It is sufficient to consider the number of dimensions sufficient to capture the degree of freedom element that greatly affects the movement of the system. In other words, the degree of freedom that has a negligible influence on the movement of the system is not taken into consideration, and the number of dimensions of the space constructed here is reduced.
動的システムにおいて二次的システムが二次システム以外のシステムに弱くしかつながっていない場合には考慮から除外できる自由度要素は特に多い。糖尿病を例に採って考えると、投与したインシュリンの量、摂取したブレッド単位の数および患者の運動量に依存する二次的システムはホルモンの効果による血液中の糖レベルの調整機構には弱いつながりしか持っていない。 There are many degrees of freedom that can be excluded from consideration when a secondary system is only weakly connected to a non-secondary system in a dynamic system. Taking diabetes as an example, a secondary system that depends on the amount of insulin administered, the number of bread units taken, and the amount of exercise in the patient is only weakly linked to the mechanism of hormonal regulation of blood sugar levels. do not have.
一連の時刻tnにおける被験成分値y(tn)を集めた経時的データは、基本的に当該システムの動的変化状況のすべてを含むものである。したがって一連の時刻tnにおける有限個の被験成分値y(tn)の集合から(外挿しようとする位置の近傍にあるせいぜい10個程度の被験成分の集合で充分であることが多い)時刻tnoにおける被験成分値y(tn0)の近傍における相の軌跡の局部的近似値を算出し、すなわち予測対象時間Δt分の将来期間に対して外挿し被験成分の予測値y(tn0+Δt)を算出することが可能となる。 The time-lapse data obtained by collecting test component values y (t n ) at a series of times t n basically includes all the dynamic changes of the system. Therefore, from a set of finite number of test component values y (t n ) at a series of times t n (a set of about 10 test components in the vicinity of the position to be extrapolated is often sufficient). A local approximate value of the locus of the phase in the vicinity of the test component value y (t n0 ) at t no is calculated, that is, extrapolated to the future period of the prediction target time Δt, and the test component predicted value y (t n0 + Δt) ) Can be calculated.
ここで関数Fひいては相の軌跡を近傍近似する元になる被験成分値を互いに近接しすぎる時刻のもので構成することを避けることが重要である。そうしないと観察される値の集合が測定誤差やそれら値に含まれるノイズの影響ばかりを示し当該被験成分の濃度の一定時間帯にわたる動的な状態を反映しないものとなる可能性が高くなる。 Here, it is important to avoid configuring the test component values that are close to the function F and thus the phase locus in proximity to each other at times that are too close to each other. Otherwise, the observed set of values will only show measurement errors and the effects of noise contained in those values, and will likely not reflect the dynamic state of the concentration of the test component over a certain period of time.
測定値に含まれる誤差を統計学的観点から小さくするためにはできるだけ細かい間隔で一連の測定時刻tnを設定しそれら時刻における被験成分値y(tn)を測定することが望ましい。したがって、相の軌跡を局所近似するに当たっては互いに直接に隣り合う時刻tnにおいて測定された被験成分値y(tn)を使用するのでなく、前回から2個目、3個目あるいはn個目に当たる被験成分値を使用することも必要になる。 In order to reduce the error included in the measurement value from a statistical point of view, it is desirable to set a series of measurement times t n at intervals as small as possible and measure the test component value y (t n ) at those times. Therefore, in locally approximating the locus of the phase, the test component value y (t n ) measured at the time t n directly adjacent to each other is not used, but the second, third or nth from the previous time. It is also necessary to use the test component value corresponding to
これを理由として数式1にあってはΔnなるパラメターが採用され被験成分値y(tn)の内で互いの測定時刻tnが充分に離れているものを選びそれらを前記関数Fの変数として採用している。
For this reason, in
定められた許容誤差の範囲内で被験成分値y(tn)の経時的変化を近似するのにこのようにして決定された関数Fを使用できるか否かは数式1を用いて検査できる。原則として時刻tn0における被験値y(tn0)の近傍Uに属する時点tkのすべてについてその和を求めねばならない。とはいっても、これはエラーを含むとわかっている個々の被験成分値y(tn)を、たとえば適当なフィルターにかけ、この和に含めないことを禁じるものではない。関数Fは一次式で表されるとは限らずまた被験成分値のみならずこの値の一次あるいは二次導関数をも変数として含む数式で表される。しかし、関数Fは一次式とするのが望ましい。中でも次にしめすa0からamを係数とする一次式をこの関数Fとすることが適当であることがわかっている。

実際には次式の値を最小にするa0からamの値を関数Fの変数に係わる係数として採用する。また、そのためには、a0からamの値を決定するために採用する時刻tnの時点数を必要充分の数にしておく必要がある。
本願発明の方法は何段階にも繰り返すことができ、それによって予測値y(tn0+Δt)から別のも一つの予測値y(tn+2Δt)さらにはさらに先々の予測値を算出が可能になる。すなわち一つの予測値y(tn0+nΔt)は本発明の方法を複数回繰り返すことで算出できることになる。この工程においては、予測対象にする時刻範囲をΔt単位で変更しそれに応じてUが移動するが、その度に近傍Uに属する一繋がりの被験成分値を近似するために用いられる係数a0からamを再計算することが重要である。 The method of the present invention can be repeated in any number of steps, whereby another predicted value y (t n + 2Δt) and further predicted values can be calculated from the predicted value y (t n0 + Δt). Become. That is, one predicted value y (t n0 + nΔt) can be calculated by repeating the method of the present invention a plurality of times. In this step, the time range to be predicted is changed in units of Δt, and U moves accordingly. From each time, the coefficient a 0 used for approximating a series of test component values belonging to the neighborhood U is used. it is important to re-calculate a m.
将来の時刻tnの時点における被験成分値y(tn)を予測するために本発明になる方法を何段もの工程にして繰り返す替りにΔtとしてより大きい値を採用しさらにそれに合わせて算出した係数a0からamの値を用いることにより一段階で大きく離れた将来のy(tn+Δt)を求めることもできる。しかし、大きく離れるほど複数段の工程にし本方法を繰り返す方が高い精度の予測値を与えることがわかっている。 In order to predict the test component value y (t n ) at the time t n in the future, instead of repeating the method according to the present invention through several steps, a larger value was adopted as Δt and calculated accordingly. by using the value of a m from the coefficient a 0 can also be determined in the future large distance in one step y (t n + Δt). However, it has been found that the greater the distance, the more accurate the predicted value is obtained when this method is repeated in multiple steps.
一意的に状態値が定まるシステムの動的振る舞いを一連の時刻tnで表される時点に対応した有限個の被験成分値y(tn)で表現することが可能なことは文献:“Takens time delay embedding”, by T. Schreiber, Phys, Rep. 85, 1-64(1999)に記載されている。この T. Schreiberになる出版物において使用された用語法においては被験成分値が対応する一連の時刻の内で直接隣り合う時点間の間隔を遅延と呼んでいる。この T. Schreiber になる出版物をここに記載することで、その内容を本願の記載を補完するための参照資料とするものである。 It is possible to express the dynamic behavior of a system in which a state value is uniquely determined by a finite number of test component values y (t n ) corresponding to a point in time represented by a series of times t n : “Takens time delay embedding ”, by T. Schreiber, Phys, Rep. 85, 1-64 (1999). In the terminology used in this T. Schreiber publication, the interval between time points immediately adjacent to each other within a series of times corresponding to the test component values is called a delay. This publication, which will become T. Schreiber, is included here as a reference to supplement the description of this application.
以下、添付図面を参照しながら、さらに詳細にわたって本願発明ならびにその実施例を説明する。ここで説明する特徴についてはそれぞれを単独であるいは適宜組み合わせることでより一層すぐれた本願発明の実施とすることができる。 Hereinafter, the present invention and its embodiments will be described in more detail with reference to the accompanying drawings. With respect to the features described here, the invention of the present application can be further improved by combining them individually or appropriately.
図1には本願発明の装置における基本的な構成部品を示した。センサー1はある特定のパラメターについて一連の時刻tnの各時点における値を観測する。その観測結果である測定信号は、図示したケースでは無線方式であるが、受信機2に送出され、さらにマイクロプロセッサ4並びに記憶ユニット5を備えた分析ユニット3に伝達される。
FIG. 1 shows basic components in the apparatus of the present invention. The
以上に替えて入力ユニット6からデータならびにコマンドの双方を分析ユニット3に伝達することもできる。出力ユニット7からは結果が出力されるが同出力ユニット7はディスプレイやその他の一般的な出力機器であって良い。分析ユニット3においてなされるデータ処理はデジタル方式のものであり、それに要するアナログ・デジタル変換器が備わっていることは言うまでもない。この種の装置の基本構成は既知のもの(たとえば米国特許5,507,288)でありここでその詳細の説明を要しない。また本願発明は広い範囲の観測技術に対して適用できるものであり、上述の通り、めざす作業に必要な信号をその観測信号から導出できる限りにおいて様々な種類の観測信号を獲得する観察技術を採用できる。
In place of the above, both data and commands can be transmitted from the input unit 6 to the
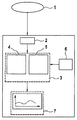
図2はセンサー1の詳細を模式図により示すものであり、間質液は体内挿入型のカテーテル10を用いて皮下脂肪組織からポンプ11によって吸い出され分光分析器12を通過し廃棄液容器13に送出される。この分光分析器12においてはその中を間質液が通過する配管14があり、同配管には透明な測定セル15が配置されており同測定セル15には光センサー16発せられる光が一次光として照射される。同測定セル15を通過した光、二次光は光検出管17により測定され測定結果として獲得された信号は図示されてはいないある種の電子機器によって生データ信号に変換され、図1の模式図で説明的に示した通り分析ユニット3にまで送出・伝達される。分析ユニット3ではこの生データ信号から被験成分値y(tn)を確定することになる。確定された同値y(tn)に基づいて被験成分の一連の時刻tnにおける濃度が算出できる。実施例においてはこのこの被験成分値y(tn)は時刻tnにおける患者のグルコースレベルの値である。
FIG. 2 is a schematic diagram showing the details of the
このような被験成分値y(tn)は以上述べたものとは別の様々な方法によって確定することが可能であることはいうまでもない。たとえば、グルコースの酵素変換に基づきその過程で発生する過酸化水素を電気化学的に捉えるという方法が採用できる。 It goes without saying that such a test component value y (t n ) can be determined by various methods other than those described above. For example, a method of electrochemically capturing hydrogen peroxide generated in the process based on enzymatic conversion of glucose can be employed.
図3にはある患者のグルコースレベルの経時的変化を示すカーブを示した。同図3のグラフには説明のために30分後のグルコースレベルを予測する予測値が2箇所、バツ印およびプラス印で示されている。これらについては次の通りである。すなわち、これら2箇所の内バツ印で示した予測値は連続線が示すその後の獲得した実測値と良く一致しており、またその予測精度も優れている。このような予測値と実測値の良好な一致が起こるのは実際のグルコースレベルが予測後のインタバル期間にインシュリンの投与や炭水化物の摂取がなされない場合に限られることは自明の通りである。図3にプラス印で示した右側の予測値は問題をはらむ限界値以下のレベルになることを予測するものである。予測値がこのように低い値である場合には警告信号が発せられ、患者に対してグルコースレベルが危険なまでに低下する可能性を警告すると共にそれに対応して炭水化物の摂取しそのような低下が実際に起こらないようにすることを促すことになる。 FIG. 3 shows a curve showing a change in glucose level of a patient over time. In the graph of FIG. 3, for the purpose of explanation, two predicted values for predicting the glucose level after 30 minutes are indicated by a cross mark and a plus mark. These are as follows. That is, the predicted values indicated by the cross marks in these two locations are in good agreement with the actual values obtained thereafter indicated by the continuous line, and the prediction accuracy is also excellent. Obviously, such a good match between the predicted value and the actually measured value occurs only when the actual glucose level is not administered with insulin or carbohydrate during the interval after the prediction. The predicted value on the right side indicated by a plus sign in FIG. 3 is used to predict that the level will be below the limit value causing the problem. If the predicted value is such a low value, a warning signal is issued to warn the patient that the glucose level may fall unsafely and correspondingly reduce the intake of carbohydrates Will be encouraged not to actually happen.
図3のグラフにおいて曲線で表されている被験成分値y(tn)は1秒間隔で観察された測定値に基づいている。このように頻繁に測定を実施することは統計的な手法によってデータの処理を進める上で有用なことであるが必ずしもこのような頻度で測定しなければならないというものではない。多くの利用目的にあっては、分レベルの測定間隔、たとえば2ないし5分間の間隔とすることで充分こと足りる。 The test component value y (t n ) represented by the curve in the graph of FIG. 3 is based on measured values observed at 1 second intervals. Such frequent measurement is useful for proceeding with data processing by a statistical method, but it does not necessarily have to be measured at such a frequency. For many purposes, a minute level measurement interval, for example, an interval of 2 to 5 minutes is sufficient.
ここで示した実施例にあっては、測定値はフィルタリング・アルゴリズムで処理される。すなわち各時刻において実測された測定値ごとにそれが作業用信号に及ぼす度合いに応じたウェイト係数で評価される(「制御可能型フィルタリング・アルゴリズム」と呼ばれる)。この型のフィルタリング・アルゴリズムにあっては信号変更パラメター(測定を実施する時点に対応付けられ、すなわちチェンジオーバー時刻を示すパラメターである)が測定時点ごとにその測定との密接な関係において観察される信号の変化に基づいて作成され、同ウェイト係数は各測定時点の測定値ごとに決定された信号変化パラメターの関数として動的に適正化される。このようなフィルタリング・アルゴリズムはカルマン・フィルター・アルゴリズムとして知られるものであり、たとえば独国特許第10343863.7号明細書に記載されている。ここで引用したこの独国特許はここでの引用をもって本願明細書の一部とみなすものである。
In the embodiment shown here, the measured values are processed with a filtering algorithm. In other words, each measured value actually measured at each time is evaluated by a weight coefficient corresponding to the degree to which it affects the work signal (referred to as “controllable filtering algorithm”). In this type of filtering algorithm, signal change parameters (corresponding to the time at which the measurement is performed, that is, a parameter indicating the changeover time) are observed in close relation to the measurement at each measurement time. Created based on signal changes, the weight coefficients are dynamically optimized as a function of signal change parameters determined for each measurement at each measurement point. Such a filtering algorithm is known as the Kalman filter algorithm and is described, for example, in
以下に記載する方法にあっては測定値を複雑な統計的処理に付す必要は発生しない。すなわち、それに替えて被験成分値y(tn)の各々として、たとえば数個の測定値の平均値を当てることやさらには各測定値をそのまま被験成分値y(tn)とすることができる。 In the method described below, it is not necessary to subject the measurement value to complicated statistical processing. That is, instead of that, as each of the test component values y (t n ), for example, an average value of several measured values can be applied, and further, each measured value can be used as the test component value y (t n ) as it is. .
このようにして獲られた被験成分値y(tn)は、まず、被験成分値
![]()
![]()
![]()
![]()
![]()
![]()
これら係数a0ないしamは近傍Uからの一連の被験成分値をy(tk)とする次の数式の値を最小にするa0ないしamの値のセットとして求められる。
もし、測定値は高頻度で採取されそれらに対応した細かい間隔でつづく一連の測定時刻tnにおける被験成分値y(tn)が算出される場合には互いに直接に隣り合う時刻tnにおいて測定された被験成分値y(tn)すべてを上述のa0ないしamの値のセットを求めるための数式に使用するのでなく、前回から2個目、3個目あるいは4個目に当たる被験成分値を使用すること、すなわちΔnを1とせずにそのほかの整数とすることが望ましい。時刻tn0の近傍Uに属する時刻tkの時点に対応するすべての値を上述の式の通りに合計するのが原則であるが、たとえば適当なフィルターを使うことで、被験成分値y(tk)の内で異常値と考えられるようなものを合計に算入する対象から除外することを禁ずるものではない。 If the measured value is measured at time t n directly adjacent to each other when the test component values in a series of measurement time t n that follows a fine intervals corresponding to those taken frequently y (t n) is calculated have been tested component values y (t n) to a 0 not above all not to use the formula for obtaining the set of values of a m, 2 th from the last three eyes or test components impinging on the 4 th It is desirable to use a value, that is, Δn is not set to 1 but other integers. In principle, all the values corresponding to the time t k belonging to the vicinity U of the time t n0 are summed as in the above formula. However, for example, by using an appropriate filter, the test component value y (t It is not forbidden to exclude those considered as outliers in k ) from being included in the total.
一連の被験成分値y(tn)のそれぞれを測定するそれぞれの時刻tnは等間隔で並んでいることが理想である。しかし、ヒトや動物の生体における被験成分値はそれらの値同士のあいだで高い自己相関性を持っており、それらをある程度継続した時間にわたって観測する場合にあっては、この測定時刻の分布に少々のばらつきがあってもそれに基づいて算出する予測値への影響は充分に小さいものに留まる。たとえば、乳酸(空気が存在する環境下での)やクレアチンの濃度は時間単位の期間にわたって高い自己相関関係を保っている。グルコースのような比較的速く変化する被験成分であっても30分間へだたった2時点間の自己相関係数は0.8以上である。 Ideally, the respective times t n for measuring each of the series of test component values y (t n ) are arranged at equal intervals. However, test component values in human and animal organisms have a high autocorrelation between these values, and when they are observed over a certain period of time, the distribution of this measurement time is a little. Even if there is a variation, the influence on the predicted value calculated based on the variation remains small enough. For example, lactic acid (in the presence of air) and creatine concentrations maintain a high autocorrelation over a period of time. Even a test component that changes relatively quickly, such as glucose, has an autocorrelation coefficient of 0.8 or more over only 30 minutes.
関数
![]()
![]()
上述したように、パラメター、m、はシステムの動的振る舞いを表現する「テイクンズ時間遅延エンベディング」の方法にしたがって相空間を構築する時の相空間の次元数に対応する。現実的には、mはほとんどのケースにおいて3から10までのいずれかの値とされるもので、その中でも5から8とするのが好ましいと考えられ、また実験的にその最適な値を決定することができる。相空間の次元数を決定する、すなわちこのパラメターの数を決定する方法の一つは、俗に「不適正隣接(false nearest neighbor)」分析と呼ばれる方法である。この方法については出版物:M. B. Kennel et al., Phys. Rev. A 45 3403(1995)に記載がある。ここの参照文献として記載することで本願明細書の記述を補完すると共に、本明細書の一部とするものである。 As described above, the parameter m corresponds to the number of dimensions of the phase space when the phase space is constructed in accordance with the “Takens time delay embedding” method that expresses the dynamic behavior of the system. In practice, m is assumed to be any value from 3 to 10 in most cases, and it is considered that 5 to 8 is preferable, and the optimum value is determined experimentally. can do. One way to determine the number of dimensions of the phase space, i.e. to determine the number of parameters, is the so-called “false nearest neighbor” analysis. This method is described in the publication: MB Kennel et al., Phys. Rev. A 45 3403 (1995). It is intended as a part of this specification while supplementing the description of this specification by describing it as a reference here.
係数a0ないしamが決定されると次の数式によって予測値の算出が可能となる。
その後、ここで算出された予測値を既定の閾値上限はたは下限と比較し、同予測値がその上限値および/または下限値を超えるときにしかるべく警告を発することになる。 Thereafter, the predicted value calculated here is compared with a predetermined threshold upper limit or lower limit, and an appropriate warning is issued when the predicted value exceeds the upper limit value and / or the lower limit value.
このように発せられた警告に対して当該患者が炭水化物を摂取したり、インシュリンを投与したりする対応をとることになるが血中のグルコースの濃度がこのように炭水化物を摂取したり、インシュリンを投与したりしたことに反応した変化を示すまでにはいくらかの時間を要する。したがって10ないし90分程度先立ってあるいはより好ましくは20ないし40分先立って被験成分値が予測できれば、同被験成分の濃度に関して次に生起する危険な上昇や下降に対する対抗措置をとる時間的余裕が生まれることになる。たとえば30分といった長い時間にわたる先々の予測を行う場合にはΔt=30minとして一段階でこの予測値を算出するよりも、たとえば一段階あたり5分として、同じ方法の予測を数回繰り返す方がより正確な被験成分の予測値が得られることがわかっている。繰り返しの各段階において前記係数a0ないしamを既に算出した被験成分の予測値y(tn0+Δt)の元に算出しなおす必要がある。ここで算出された係数a0ないしamは時刻tn0+Δtの時点における被験成分値のU近傍に属する一連の被験成分値y(tn)を近似するために使用される。またその結果得られた値はさらに次の予測値y(tn0+2Δt)を算出するために使われる。このような段階的に進める方法に基づく場合には、予測する先の時刻までの間隔Δtを予測を行うためのよりどころとしての実測値に基づく被験成分値y(tn)の各々が関係する時点の時刻間間隔と同一にすることが望ましい。もし一連の時刻tnの互いに隣り合う時刻間の間隔がdtであるならば予測時点までの期間(Δt)はΔt=dt・Δnとなる。 In response to such warnings, the patient will take carbohydrates or insulin, but the glucose level in the blood will take carbohydrates or insulin. It takes some time to show changes in response to administration. Therefore, if the test component value can be predicted about 10 to 90 minutes in advance or more preferably 20 to 40 minutes in advance, there is a time margin for taking countermeasures against the next dangerous increase or decrease in the concentration of the test component. It will be. For example, when performing a prediction over a long time such as 30 minutes, it is better to repeat the prediction of the same method several times, for example, 5 minutes per step than to calculate this prediction value in one step with Δt = 30 min. It is known that an accurate predicted value of the test component can be obtained. Repeating said to coefficient a 0 is no need to re-calculate the original prediction value y of the test component that has already calculated a m (t n0 + Δt) at each stage of. Here to not factor a 0 is calculated a m are used to approximate a set of test component values y (t n) that belongs to the neighborhood U of the test component values as of time t n0 + Δt. The value obtained as a result is further used to calculate the next predicted value y (t n0 + 2Δt). When based on such a method of proceeding stepwise, each of the test component values y (t n ) based on the actual measurement value as a basis for predicting the interval Δt until the predicted time is related. It is desirable to make it equal to the time interval at the time. If the interval between adjacent times in a series of times t n is dt, the period (Δt) until the prediction time is Δt = dt · Δn.
以上述べた方法は将来の被験成分値y(tn)の予測のために用いる他、実測値に対応してそれまでに算出された被験成分値y(tn)の中に存在する異常値や測定エラーに基づいたものを見つけ出すためにも使用できる。図4に説明目的で示されたように、一般には測定で確認された被験成分値y(tn)とそれら値を入手する以前に予測した被験成分予測値y(tn)とのあいだには高い一致が認められる。スムーズな連続曲線は予測値の経時的動向を示すもので、短時間のあいだに強い変化を示す曲線は実測値の経時的動向を示している。予測先までの期間は2分であり合計15段階の予測が順次なされ最終的には30分後の値が予測されている。したがって図4では因みにy軸が血中グルコース濃度を示すのではなく、測定信号の強度をそのまま示している。電気化学的な観察により獲得したこの測定信号はその強度(ナノアンペアの単位の電流)の高低に対応して血中グルコース濃度が算出されるという関係にあるものである。 The method described above is used for predicting the future test component value y (t n ), and in addition to the actual measurement value, the abnormal value existing in the test component value y (t n ) calculated so far It can also be used to find things based on measurement errors. As shown in FIG. 4 for illustrative purposes, the test component value y (t n ) generally confirmed by measurement and the predicted test component value y (t n ) predicted before obtaining those values are generally used. Is highly consistent. A smooth continuous curve shows a trend of predicted values over time, and a curve showing a strong change in a short time shows a trend of measured values over time. The period up to the prediction destination is 2 minutes, and a total of 15 predictions are made sequentially, and finally a value after 30 minutes is predicted. Therefore, in FIG. 4, the y-axis does not indicate the blood glucose concentration, but indicates the intensity of the measurement signal as it is. This measurement signal obtained by electrochemical observation has a relationship in which the blood glucose concentration is calculated corresponding to the intensity (current in nanoamperes).
関数Fを算出する元になる被験成分値
![]()
![]()
![]()
![]()
![]()
![]()
この座標軸のセットに対しては一次変換を行うのが好ましく、変換後の座標を図5に示したごとく、いわゆる差分のエリプソイドのメインとなる軸に沿って位置するいわゆる潜在座標とするのが便利である。図5においてはこのような差分のエプソイドを2次元の相空間において示した。それによると相空間を構築する軸は遅延座標軸、y(t)とy(t−k)となる。差分のエリプソイドは、それぞれを黒色の円で示した分布するデータ点を囲むことになる。またこれら黒色の円で示したデータは時間軸に沿って順次接続されると相間の関係を示す曲線を形成することになる。 It is preferable to perform a linear transformation on the set of coordinate axes, and it is convenient to use the so-called latent coordinates located along the main axis of the so-called differential ellipsoid as shown in FIG. It is. In FIG. 5, such differential epsoids are shown in a two-dimensional phase space. According to this, the axes for constructing the phase space are the delay coordinate axes, y (t) and y (tk). The differential ellipsoid surrounds the distributed data points, each represented by a black circle. The data indicated by the black circles form a curve indicating the relationship between the phases when sequentially connected along the time axis.
差分のエリプソイドは相空間に分散して位置するデータ点に基づいて計算できる。当該エリプソイドのメインの各軸はデータ点のその相空間内での方向に沿った分散を示している。図5にはさらに実行した変換によって形成された新しい相空間が2軸、T(1)とT(2)、によって示されている。第一の潜在座標軸T(1)は差分のエプソイドの最長慣性軸に沿って延び、第二の潜在座標軸T(2)は二番目に長い慣性軸に沿って延びるものとする。数字上、潜在座標軸への変換は、たとえば、主成分分析(M. Otto, Chemometrics, Wiley, Weinheim(ドイツ),1999年,124から133頁)または単独値分解(W.H. Press ら、 Numerical Recipes, Cambridge University Press, Cambridge(UK), 1989年, 52 から 61頁)と呼ばれる手法によって実行できるものである。 The difference ellipsoid can be calculated based on data points distributed in the phase space. Each main axis of the ellipsoid represents the variance along the direction of the data point in its phase space. In FIG. 5, the new phase space formed by the further transformations is indicated by two axes, T (1) and T (2). It is assumed that the first latent coordinate axis T (1) extends along the longest inertial axis of the differential epoxide, and the second latent coordinate axis T (2) extends along the second longest inertial axis. Numerically, conversion to latent coordinate axes can be performed, for example, by principal component analysis (M. Otto, Chemometrics, Wiley, Weinheim (Germany), 1999, pages 124 to 133) or single value decomposition (WH Press et al., Numerical Recipes, Cambridge University Press, Cambridge (UK), 1989, 52-61).
このような潜在座標軸への変換を実行することで変換後の座標軸の中で一つあるいは数個の座標軸が関数Fに及ぼす影響を許容誤差範囲σの元で無視できるようになり、関数Fの計算に必要な分析において、その分だけ少ない数の座標軸を考慮するだけ良いことになる。 By performing the conversion to the latent coordinate axes, the influence of one or several coordinate axes on the function F among the converted coordinate axes can be ignored under the allowable error range σ. In the analysis necessary for the calculation, it is only necessary to consider a smaller number of coordinate axes.
本願発明のこれらまたはこれら以外の特徴ならびにそれらがもたらす利点は以上の詳細説明ならびに別掲する請求項の記述から完全に理解できるものである。別掲する特許請求の範囲は同請求項における記述によって規定されるものであり、明細書に記述した特長や利点の個々の観点からの説明に左右されるものでない旨留意されたい。 These and other features of the present invention and the advantages they provide will be fully understood from the foregoing detailed description and the appended claims. It should be noted that the appended claims are defined by the description in the claims and do not depend on the description from the individual viewpoints of the features and advantages described in the specification.
上記で使用した表現、「好ましくは」、「広く」ならびに「典型的に」はそれらが言及する発明の請求範囲を限定するものでなくまたそれらと共に示した特徴がその通りであることが本願の特許請求範囲の発明を実施するにあたって決定的意味を持つとか、不可欠であるとか、あるいは重要であるとかの意味さえをも持つものではない。むしろ、このような表現は、そこで述べたものとは別の特徴に替えて採用できる、あるいは追加的に採用できるとの点を述べるに留まるものであり、したがって本願発明の実施にあってはこれらの特徴を採用しても採用しなくても本願発明の個々の実施は可能となるものである。 The expressions used above, “preferably”, “broadly” and “typically” do not limit the scope of the invention to which they refer, and the features presented therewith are as such. It does not have any decisive, essential, or even significant meaning in practicing the claimed invention. Rather, such an expression is merely to describe that it can be used in place of, or in addition to, features other than those described there. The present invention can be implemented individually with or without the above feature.
1 センサー
2 受信機
3 分析ユニット
4 マイクロプロセッサ
5 データ記憶ユニット
6 入力ユニット
7 出力ユニット
10 カテーテル
11 ポンプ
12 光学的測定ユニット
13 廃棄液容器
14 配管
15 測定セル
16 光センサー
17 光検出器
DESCRIPTION OF
Claims (3)
被験成分濃度に関連する被験成分値y(tn)を連続する時刻tnで求める工程と、
数式
前記予測値y(tn0+Δt)が、所定値からしきい値を超えて変動する場合に信号を発生する工程とを含み、
関数
該関数Fが、数式:
該係数a0〜amが、合計
Obtaining a test component value y (t n ) related to the test component concentration at successive times t n ;
Formula
Generating a signal when the predicted value y (t n0 + Δt) fluctuates from a predetermined value beyond a threshold value,
function
The function F has the formula:
The coefficients a 0 ~a m is, the total
被験成分濃度に関連する被験成分値y(t n )を連続する時刻tnにおける測定信号として測定する測定ユニット(12)と、
数式
前記予測値y(t n0 +Δt)が、所定値からしきい値を超えて変動する場合に信号を発生する工程を処理するマイクロプロセッサ(4)であって、
関数
該関数Fが、数式:
該係数a 0 〜a m が、合計
該関数Fを使用して予測値を算出する装置。 A continuously monitored device a test component concentrations in a human or animal in vivo,
A measurement unit (12) for measuring a test component value y (t n ) related to the test component concentration as a measurement signal at successive times t n ;
Formula
A microprocessor (4) for processing a step of generating a signal when the predicted value y (t n0 + Δt) fluctuates from a predetermined value beyond a threshold value,
function
The function F has the formula:
The coefficients a 0 ~a m is, the total
Equipment that to calculate the predicted values using the function number F.
Applications Claiming Priority (2)
| Application Number | Priority Date | Filing Date | Title |
|---|---|---|---|
| DE102004020160A DE102004020160A1 (en) | 2004-04-24 | 2004-04-24 | Method and device for monitoring a concentration of an analyte in the living body of a human or animal |
| DE102004020160.9 | 2004-04-24 |
Publications (3)
| Publication Number | Publication Date |
|---|---|
| JP2005308742A JP2005308742A (en) | 2005-11-04 |
| JP2005308742A5 JP2005308742A5 (en) | 2010-11-11 |
| JP4693474B2 true JP4693474B2 (en) | 2011-06-01 |
Family
ID=34934888
Family Applications (1)
| Application Number | Title | Priority Date | Filing Date |
|---|---|---|---|
| JP2005117542A Expired - Fee Related JP4693474B2 (en) | 2004-04-24 | 2005-04-14 | Method and apparatus for monitoring the concentration of a test component in a human or animal body |
Country Status (5)
| Country | Link |
|---|---|
| US (2) | US7188034B2 (en) |
| EP (1) | EP1589438B1 (en) |
| JP (1) | JP4693474B2 (en) |
| CA (1) | CA2504661C (en) |
| DE (1) | DE102004020160A1 (en) |
Families Citing this family (63)
| Publication number | Priority date | Publication date | Assignee | Title |
|---|---|---|---|---|
| US6391005B1 (en) | 1998-03-30 | 2002-05-21 | Agilent Technologies, Inc. | Apparatus and method for penetration with shaft having a sensor for sensing penetration depth |
| US8641644B2 (en) | 2000-11-21 | 2014-02-04 | Sanofi-Aventis Deutschland Gmbh | Blood testing apparatus having a rotatable cartridge with multiple lancing elements and testing means |
| WO2002100254A2 (en) | 2001-06-12 | 2002-12-19 | Pelikan Technologies, Inc. | Method and apparatus for lancet launching device integrated onto a blood-sampling cartridge |
| US7981056B2 (en) | 2002-04-19 | 2011-07-19 | Pelikan Technologies, Inc. | Methods and apparatus for lancet actuation |
| US8337419B2 (en) | 2002-04-19 | 2012-12-25 | Sanofi-Aventis Deutschland Gmbh | Tissue penetration device |
| US9226699B2 (en) | 2002-04-19 | 2016-01-05 | Sanofi-Aventis Deutschland Gmbh | Body fluid sampling module with a continuous compression tissue interface surface |
| US9795747B2 (en) | 2010-06-02 | 2017-10-24 | Sanofi-Aventis Deutschland Gmbh | Methods and apparatus for lancet actuation |
| DE60238119D1 (en) | 2001-06-12 | 2010-12-09 | Pelikan Technologies Inc | ELECTRIC ACTUATOR ELEMENT FOR A LANZETTE |
| US9427532B2 (en) | 2001-06-12 | 2016-08-30 | Sanofi-Aventis Deutschland Gmbh | Tissue penetration device |
| US7025774B2 (en) | 2001-06-12 | 2006-04-11 | Pelikan Technologies, Inc. | Tissue penetration device |
| ES2336081T3 (en) | 2001-06-12 | 2010-04-08 | Pelikan Technologies Inc. | SELF-OPTIMIZATION PUNCTURE DEVICE WITH MEANS OF ADAPTATION TO TEMPORARY VARIATIONS IN CUTANEOUS PROPERTIES. |
| US7909778B2 (en) | 2002-04-19 | 2011-03-22 | Pelikan Technologies, Inc. | Method and apparatus for penetrating tissue |
| US8372016B2 (en) | 2002-04-19 | 2013-02-12 | Sanofi-Aventis Deutschland Gmbh | Method and apparatus for body fluid sampling and analyte sensing |
| US7297122B2 (en) | 2002-04-19 | 2007-11-20 | Pelikan Technologies, Inc. | Method and apparatus for penetrating tissue |
| US8267870B2 (en) | 2002-04-19 | 2012-09-18 | Sanofi-Aventis Deutschland Gmbh | Method and apparatus for body fluid sampling with hybrid actuation |
| US9795334B2 (en) | 2002-04-19 | 2017-10-24 | Sanofi-Aventis Deutschland Gmbh | Method and apparatus for penetrating tissue |
| US7708701B2 (en) | 2002-04-19 | 2010-05-04 | Pelikan Technologies, Inc. | Method and apparatus for a multi-use body fluid sampling device |
| US8360992B2 (en) | 2002-04-19 | 2013-01-29 | Sanofi-Aventis Deutschland Gmbh | Method and apparatus for penetrating tissue |
| US7892183B2 (en) | 2002-04-19 | 2011-02-22 | Pelikan Technologies, Inc. | Method and apparatus for body fluid sampling and analyte sensing |
| US7547287B2 (en) | 2002-04-19 | 2009-06-16 | Pelikan Technologies, Inc. | Method and apparatus for penetrating tissue |
| US7674232B2 (en) | 2002-04-19 | 2010-03-09 | Pelikan Technologies, Inc. | Method and apparatus for penetrating tissue |
| US7976476B2 (en) | 2002-04-19 | 2011-07-12 | Pelikan Technologies, Inc. | Device and method for variable speed lancet |
| US7331931B2 (en) | 2002-04-19 | 2008-02-19 | Pelikan Technologies, Inc. | Method and apparatus for penetrating tissue |
| US7901362B2 (en) | 2002-04-19 | 2011-03-08 | Pelikan Technologies, Inc. | Method and apparatus for penetrating tissue |
| US7175642B2 (en) | 2002-04-19 | 2007-02-13 | Pelikan Technologies, Inc. | Methods and apparatus for lancet actuation |
| US9248267B2 (en) | 2002-04-19 | 2016-02-02 | Sanofi-Aventis Deustchland Gmbh | Tissue penetration device |
| US7491178B2 (en) | 2002-04-19 | 2009-02-17 | Pelikan Technologies, Inc. | Method and apparatus for penetrating tissue |
| US8579831B2 (en) | 2002-04-19 | 2013-11-12 | Sanofi-Aventis Deutschland Gmbh | Method and apparatus for penetrating tissue |
| US8784335B2 (en) | 2002-04-19 | 2014-07-22 | Sanofi-Aventis Deutschland Gmbh | Body fluid sampling device with a capacitive sensor |
| US8702624B2 (en) | 2006-09-29 | 2014-04-22 | Sanofi-Aventis Deutschland Gmbh | Analyte measurement device with a single shot actuator |
| US8221334B2 (en) | 2002-04-19 | 2012-07-17 | Sanofi-Aventis Deutschland Gmbh | Method and apparatus for penetrating tissue |
| US7229458B2 (en) | 2002-04-19 | 2007-06-12 | Pelikan Technologies, Inc. | Method and apparatus for penetrating tissue |
| US9314194B2 (en) | 2002-04-19 | 2016-04-19 | Sanofi-Aventis Deutschland Gmbh | Tissue penetration device |
| US7232451B2 (en) | 2002-04-19 | 2007-06-19 | Pelikan Technologies, Inc. | Method and apparatus for penetrating tissue |
| US8574895B2 (en) | 2002-12-30 | 2013-11-05 | Sanofi-Aventis Deutschland Gmbh | Method and apparatus using optical techniques to measure analyte levels |
| ATE476137T1 (en) | 2003-05-30 | 2010-08-15 | Pelikan Technologies Inc | METHOD AND DEVICE FOR INJECTING LIQUID |
| DK1633235T3 (en) | 2003-06-06 | 2014-08-18 | Sanofi Aventis Deutschland | Apparatus for sampling body fluid and detecting analyte |
| WO2006001797A1 (en) | 2004-06-14 | 2006-01-05 | Pelikan Technologies, Inc. | Low pain penetrating |
| EP1671096A4 (en) | 2003-09-29 | 2009-09-16 | Pelikan Technologies Inc | Method and apparatus for an improved sample capture device |
| EP1680014A4 (en) | 2003-10-14 | 2009-01-21 | Pelikan Technologies Inc | Method and apparatus for a variable user interface |
| EP1706026B1 (en) | 2003-12-31 | 2017-03-01 | Sanofi-Aventis Deutschland GmbH | Method and apparatus for improving fluidic flow and sample capture |
| US7822454B1 (en) | 2005-01-03 | 2010-10-26 | Pelikan Technologies, Inc. | Fluid sampling device with improved analyte detecting member configuration |
| US8828203B2 (en) | 2004-05-20 | 2014-09-09 | Sanofi-Aventis Deutschland Gmbh | Printable hydrogels for biosensors |
| US9775553B2 (en) | 2004-06-03 | 2017-10-03 | Sanofi-Aventis Deutschland Gmbh | Method and apparatus for a fluid sampling device |
| WO2005120365A1 (en) | 2004-06-03 | 2005-12-22 | Pelikan Technologies, Inc. | Method and apparatus for a fluid sampling device |
| US8652831B2 (en) | 2004-12-30 | 2014-02-18 | Sanofi-Aventis Deutschland Gmbh | Method and apparatus for analyte measurement test time |
| EP1728468A1 (en) * | 2005-06-04 | 2006-12-06 | Roche Diagnostics GmbH | Evaluation of blood glucose concentration values for adaptation of insulin dosage |
| EP2051620B1 (en) * | 2006-08-08 | 2010-04-28 | Koninklijke Philips Electronics N.V. | Method and device for monitoring a physiological parameter |
| US8439837B2 (en) * | 2006-10-31 | 2013-05-14 | Lifescan, Inc. | Systems and methods for detecting hypoglycemic events having a reduced incidence of false alarms |
| ES2683852T3 (en) * | 2007-01-23 | 2018-09-28 | Ascensia Diabetes Care Holdings Ag | Analyte test device |
| EP1967132B8 (en) | 2007-03-09 | 2015-06-03 | Roche Diagnostics GmbH | Medical data transmission system |
| US20090160656A1 (en) * | 2007-10-11 | 2009-06-25 | Mahesh Seetharaman | Analyte monitoring system alarms |
| DE102007046864A1 (en) * | 2007-09-28 | 2009-04-09 | Endress + Hauser Conducta Gesellschaft für Mess- und Regeltechnik mbH + Co. KG | Measured value plausibility and quality evaluating method for e.g. control circuit, involves forming and evaluating derivative of measured value according to time, where measured value is compared with predefined warning limit value |
| US7731659B2 (en) * | 2007-10-18 | 2010-06-08 | Lifescan Scotland Limited | Method for predicting a user's future glycemic state |
| US7695434B2 (en) * | 2007-10-19 | 2010-04-13 | Lifescan Scotland, Ltd. | Medical device for predicting a user's future glycemic state |
| WO2009126900A1 (en) | 2008-04-11 | 2009-10-15 | Pelikan Technologies, Inc. | Method and apparatus for analyte detecting device |
| US20110160555A1 (en) * | 2008-07-31 | 2011-06-30 | Jacques Reifman | Universal Models for Predicting Glucose Concentration in Humans |
| US9375169B2 (en) | 2009-01-30 | 2016-06-28 | Sanofi-Aventis Deutschland Gmbh | Cam drive for managing disposable penetrating member actions with a single motor and motor and control system |
| EP2420184B1 (en) | 2009-04-17 | 2016-05-11 | ARKRAY, Inc. | Data provision method, program and server device |
| US8843321B2 (en) * | 2010-01-26 | 2014-09-23 | Roche Diagnostics Operations, Inc. | Methods and systems for processing glucose data measured from a person having diabetes |
| US8965476B2 (en) | 2010-04-16 | 2015-02-24 | Sanofi-Aventis Deutschland Gmbh | Tissue penetration device |
| US10307109B2 (en) | 2011-04-20 | 2019-06-04 | Novo Nordisk A/S | Glucose predictor based on regularization networks with adaptively chosen kernels and regularization parameters |
| KR101962315B1 (en) * | 2017-03-29 | 2019-07-17 | 이화여자대학교 산학협력단 | Method of prediction mercury concentration in blood |
Family Cites Families (15)
| Publication number | Priority date | Publication date | Assignee | Title |
|---|---|---|---|---|
| FI931234A (en) | 1993-03-19 | 1994-09-20 | Instrumentarium Oy | Procedure for monitoring a patient's condition |
| US5748851A (en) | 1994-02-28 | 1998-05-05 | Kabushiki Kaisha Meidensha | Method and apparatus for executing short-term prediction of timeseries data |
| DE4415896A1 (en) | 1994-05-05 | 1995-11-09 | Boehringer Mannheim Gmbh | Analysis system for monitoring the concentration of an analyte in the blood of a patient |
| EP0910023A2 (en) * | 1997-10-17 | 1999-04-21 | Siemens Aktiengesellschaft | Method and device for the neuronal modelling of a dynamic system with non-linear stochastic behavior |
| JPH11296598A (en) | 1998-04-07 | 1999-10-29 | Seizaburo Arita | System and method for predicting blood-sugar level and record medium where same method is recorded |
| US6272364B1 (en) | 1998-05-13 | 2001-08-07 | Cygnus, Inc. | Method and device for predicting physiological values |
| US6925393B1 (en) | 1999-11-18 | 2005-08-02 | Roche Diagnostics Gmbh | System for the extrapolation of glucose concentration |
| JP3563333B2 (en) | 2000-08-04 | 2004-09-08 | Necエレクトロニクス株式会社 | High-side switch for inrush current and overcurrent control method |
| DE60133653T2 (en) | 2000-08-18 | 2009-06-04 | Animas Technologies Llc | APPARATUS FOR PREDICTING HYPOGLYECURE DROPS |
| CA2738579C (en) | 2002-03-22 | 2016-11-01 | Animas Technologies Llc | Improving performance of an analyte monitoring device |
| US7278983B2 (en) | 2002-07-24 | 2007-10-09 | Medtronic Minimed, Inc. | Physiological monitoring device for controlling a medication infusion device |
| EP2327359B1 (en) | 2002-08-13 | 2015-01-21 | University Of Virginia Patent Foundation | Method, system, and computer program product for processing of self-monitoring blood glucose (smbg) data to enhance diabetic self-management |
| DE10343863A1 (en) * | 2003-09-23 | 2005-04-14 | Roche Diagnostics Gmbh | Method and device for continuously monitoring the concentration of an analyte |
| US20070060870A1 (en) | 2005-08-16 | 2007-03-15 | Tolle Mike Charles V | Controller device for an infusion pump |
| US20070060869A1 (en) | 2005-08-16 | 2007-03-15 | Tolle Mike C V | Controller device for an infusion pump |
-
2004
- 2004-04-24 DE DE102004020160A patent/DE102004020160A1/en not_active Withdrawn
-
2005
- 2005-04-08 EP EP05007701.5A patent/EP1589438B1/en active Active
- 2005-04-14 JP JP2005117542A patent/JP4693474B2/en not_active Expired - Fee Related
- 2005-04-21 CA CA002504661A patent/CA2504661C/en not_active Expired - Fee Related
- 2005-04-25 US US11/113,606 patent/US7188034B2/en active Active
-
2007
- 2007-02-15 US US11/675,580 patent/US7650244B2/en active Active
Also Published As
| Publication number | Publication date |
|---|---|
| US7650244B2 (en) | 2010-01-19 |
| EP1589438A3 (en) | 2006-03-22 |
| US20050240356A1 (en) | 2005-10-27 |
| EP1589438B1 (en) | 2015-11-04 |
| US7188034B2 (en) | 2007-03-06 |
| CA2504661C (en) | 2009-08-18 |
| DE102004020160A1 (en) | 2005-11-10 |
| JP2005308742A (en) | 2005-11-04 |
| EP1589438A2 (en) | 2005-10-26 |
| CA2504661A1 (en) | 2005-10-24 |
| US20070148778A1 (en) | 2007-06-28 |
Similar Documents
| Publication | Publication Date | Title |
|---|---|---|
| JP4693474B2 (en) | Method and apparatus for monitoring the concentration of a test component in a human or animal body | |
| JP6408479B2 (en) | Patient monitoring system and patient monitoring method | |
| EP2408354B1 (en) | Systems and methods for monitoring heart rate and blood pressure correlation | |
| EP3358485A1 (en) | General noninvasive blood glucose prediction method based on timing analysis | |
| CA2418003C (en) | Method and apparatus for multiple patient parameter variability analysis and display | |
| US20090088606A1 (en) | Systems and methods for patient specific adaptable telemonitoring alerts | |
| US9615781B2 (en) | Systems and methods for monitoring depth of consciousness | |
| AU2011213041B2 (en) | System and method for diagnosing sleep apnea based on results of multiple approaches to sleep apnea identification | |
| JP2005524437A (en) | Blood flow oxygen measuring system and method | |
| KR102487983B1 (en) | Apparatus and Method for construction of disease prediction model, and Apparatus for disease prediction. | |
| US20150261924A1 (en) | Healthcare system and method | |
| JP2007014751A (en) | Method and device for evaluating a series of glucose concentration values concerning body fluid of diabetic in order to adjust insulin dosage | |
| JP2004209257A (en) | Blood ingredient analysis system using method of erasing abnormal data and spectroscopy applied therewith | |
| WO2005096922A1 (en) | Physiological assessment system | |
| US11580432B2 (en) | System monitor and method of system monitoring to predict a future state of a system | |
| US7678047B2 (en) | Chaologic brain function diagnosis apparatus | |
| JP2011120618A (en) | Device for evalution of autonomic nervous function and program | |
| Verdru et al. | Wearable seizure detection devices in refractory epilepsy | |
| JP2016529989A (en) | Method and apparatus for determining smoothed data points in a stream of data points | |
| WO2014042840A1 (en) | System and method for measuring cardiac output | |
| JP2018033795A (en) | Depressive state determination method and depressive state determination device | |
| US20220287564A1 (en) | An Interactive Health-Monitoring Platform for Wearable Wireless Sensor Systems | |
| CN109414201A (en) | Biological information measures auxiliary device, vital information measurement device, biological information measurement householder method and auxiliary program | |
| JP6318047B2 (en) | Disease prediction apparatus and program | |
| KR102035731B1 (en) | Method and apparatus for measuring pain depth using photoplethysmograph |
Legal Events
| Date | Code | Title | Description |
|---|---|---|---|
| A977 | Report on retrieval |
Free format text: JAPANESE INTERMEDIATE CODE: A971007 Effective date: 20061228 |
|
| A131 | Notification of reasons for refusal |
Free format text: JAPANESE INTERMEDIATE CODE: A131 Effective date: 20070410 |
|
| A601 | Written request for extension of time |
Free format text: JAPANESE INTERMEDIATE CODE: A601 Effective date: 20070709 |
|
| A602 | Written permission of extension of time |
Free format text: JAPANESE INTERMEDIATE CODE: A602 Effective date: 20070712 |
|
| A601 | Written request for extension of time |
Free format text: JAPANESE INTERMEDIATE CODE: A601 Effective date: 20070809 |
|
| A602 | Written permission of extension of time |
Free format text: JAPANESE INTERMEDIATE CODE: A602 Effective date: 20070814 |
|
| A521 | Written amendment |
Free format text: JAPANESE INTERMEDIATE CODE: A523 Effective date: 20070907 |
|
| A02 | Decision of refusal |
Free format text: JAPANESE INTERMEDIATE CODE: A02 Effective date: 20080401 |
|
| A521 | Written amendment |
Free format text: JAPANESE INTERMEDIATE CODE: A523 Effective date: 20080724 |
|
| A911 | Transfer to examiner for re-examination before appeal (zenchi) |
Free format text: JAPANESE INTERMEDIATE CODE: A911 Effective date: 20080909 |
|
| A912 | Re-examination (zenchi) completed and case transferred to appeal board |
Free format text: JAPANESE INTERMEDIATE CODE: A912 Effective date: 20081003 |
|
| A521 | Written amendment |
Free format text: JAPANESE INTERMEDIATE CODE: A821 Effective date: 20080904 |
|
| A601 | Written request for extension of time |
Free format text: JAPANESE INTERMEDIATE CODE: A601 Effective date: 20100126 |
|
| A602 | Written permission of extension of time |
Free format text: JAPANESE INTERMEDIATE CODE: A602 Effective date: 20100129 |
|
| A601 | Written request for extension of time |
Free format text: JAPANESE INTERMEDIATE CODE: A601 Effective date: 20100326 |
|
| A602 | Written permission of extension of time |
Free format text: JAPANESE INTERMEDIATE CODE: A602 Effective date: 20100331 |
|
| RD03 | Notification of appointment of power of attorney |
Free format text: JAPANESE INTERMEDIATE CODE: A7423 Effective date: 20100525 |
|
| A601 | Written request for extension of time |
Free format text: JAPANESE INTERMEDIATE CODE: A601 Effective date: 20100824 |
|
| A602 | Written permission of extension of time |
Free format text: JAPANESE INTERMEDIATE CODE: A602 Effective date: 20100827 |
|
| A524 | Written submission of copy of amendment under section 19 (pct) |
Free format text: JAPANESE INTERMEDIATE CODE: A524 Effective date: 20100927 |
|
| A521 | Written amendment |
Free format text: JAPANESE INTERMEDIATE CODE: A523 Effective date: 20110118 |
|
| A01 | Written decision to grant a patent or to grant a registration (utility model) |
Free format text: JAPANESE INTERMEDIATE CODE: A01 |
|
| A61 | First payment of annual fees (during grant procedure) |
Free format text: JAPANESE INTERMEDIATE CODE: A61 Effective date: 20110222 |
|
| FPAY | Renewal fee payment (event date is renewal date of database) |
Free format text: PAYMENT UNTIL: 20140304 Year of fee payment: 3 |
|
| R150 | Certificate of patent or registration of utility model |
Free format text: JAPANESE INTERMEDIATE CODE: R150 |
|
| LAPS | Cancellation because of no payment of annual fees |