JP4580976B2 - Biological sample analyzer with quality control function and method for displaying quality control measurement results - Google Patents
Biological sample analyzer with quality control function and method for displaying quality control measurement results Download PDFInfo
- Publication number
- JP4580976B2 JP4580976B2 JP2007334004A JP2007334004A JP4580976B2 JP 4580976 B2 JP4580976 B2 JP 4580976B2 JP 2007334004 A JP2007334004 A JP 2007334004A JP 2007334004 A JP2007334004 A JP 2007334004A JP 4580976 B2 JP4580976 B2 JP 4580976B2
- Authority
- JP
- Japan
- Prior art keywords
- quality control
- measurement
- sample
- displaying
- display
- Prior art date
- Legal status (The legal status is an assumption and is not a legal conclusion. Google has not performed a legal analysis and makes no representation as to the accuracy of the status listed.)
- Expired - Lifetime
Links
Images


Landscapes
- Automatic Analysis And Handling Materials Therefor (AREA)
Description
本発明は、複数の測定項目における精度管理機能を備えた生体試料分析装置に関し、特に血液や尿などの試料に含まれる複数種の成分を測定する試料分析装置に関する。 The present invention relates to a biological sample analyzer having an accuracy management function for a plurality of measurement items, and more particularly to a sample analyzer for measuring a plurality of types of components contained in a sample such as blood and urine.
試料分析装置においては定期的に精度管理をすることが必要である。例えば、血液分析装置の場合、精度管理用の血液試料をその血液分析装置に供し、それで得られた各項目の精度管理測定結果と管理目標値との差を調べることが一般的に行われている。測定結果が管理目標値と大きく離れていれば、分析装置または分析試薬に何らかの異常があることが考えられ、そのメンテナンスを行うようにされている。 In the sample analyzer, it is necessary to periodically control the accuracy. For example, in the case of a blood analyzer, it is a common practice to use a blood sample for accuracy control in the blood analyzer and examine the difference between the accuracy control measurement result of each item obtained and the control target value. Yes. If the measurement result is far from the management target value, it is possible that there is some abnormality in the analyzer or the analysis reagent, and the maintenance is performed.
血液や尿などの生体試料を分析する分析装置はその試料に含まれている複数種の成分を分析できるようになっている。このような分析装置では、複数種の検出部を備えたり、複数種の試薬を用いて試料を染色させたり、反応させたりしている。これらの測定項目は各測定項目で検出部や試薬が同じであったり、異なったりしている。そのため、一つの測定項目だけでは精度管理として不充分なことがあり、複数または全ての測定項目を精度管理測定することが多い。 An analyzer for analyzing a biological sample such as blood or urine can analyze a plurality of types of components contained in the sample. In such an analyzer, a plurality of types of detection units are provided, or a sample is stained or reacted using a plurality of types of reagents. These measurement items have the same or different detection parts and reagents in each measurement item. For this reason, there is a case where only one measurement item is insufficient for accuracy management, and in many cases, a plurality of or all measurement items are subjected to accuracy management measurement.
このように複数の項目について精度管理を行なえば、各測定項目間の関連によっては、分析装置もしくは分析試薬の状態をより正確に捉えることが可能になるであろう。しかし、各項目どうしの値まで容易に把握することは難しいので、単に各項目が管理目標範囲に入っているか否かを判断しているだけの運用が一般的である。 If accuracy management is performed for a plurality of items in this way, it will be possible to more accurately capture the state of the analyzer or analysis reagent depending on the relationship between the measurement items. However, since it is difficult to easily grasp the values of the items, it is common to simply determine whether each item is within the management target range.
精度管理測定する各項目の測定情報を容易に活用することができるように、複数の精度管理結果が値として管理目標値に対しどうであるのか、管理目標範囲に入っているのかをその程度までひとめで把握できる分析装置を提供することを目的とする。 In order to be able to easily use the measurement information of each item to be managed with accuracy management, how much multiple quality control results are in relation to the management target value as a value and whether it is within the management target range to that extent The purpose is to provide an analyzer that can be grasped at a glance.
この発明はこのような事情を考慮してなされたもので、血液または尿に含まれる粒子の種類に対応する測定項目毎に測定値を取得する粒子分析装置であって、精度管理試料を測定した場合に、精度管理試料の管理目標値、管理目標範囲および精度管理試料を測定して得られた精度管理測定値を、測定項目名毎に表記したレーダーチャート図を作成して表示する機能を備え、精度管理試料を測定して得られた精度管理測定値が、血液または尿に含まれる粒子の種類に対応する測定項目毎の測定値であり、レーダーチャート図において、精度管理測定値が管理目標範囲に入っていない測定項目名を反転表示することを特徴とする粒子分析装置を提供するものである。 The present invention has been made in view of such circumstances, and is a particle analyzer that acquires measurement values for each measurement item corresponding to the type of particles contained in blood or urine, and measures a quality control sample. In this case, a function is provided to create and display a radar chart diagram for each measurement item name, including the control target value, control target range, and control target value of the control sample. , quality control measurements obtained by measuring the quality control sample is, Ri measurements der of each measurement item corresponding to the type of the particles contained in the blood or urine, in a radar chart, the quality control measurement value management there is provided a particle analyzer which is characterized that you highlight the measurement item names that are not in the target range.
また、この発明は、血液または尿に含まれる粒子成分の種類に対応する測定項目毎に測定値を取得する粒子分析装置により複数の測定項目について精度管理測定を行うことによって得られた複数の精度管理測定値の表示方法であって、測定に用いられた精度管理試料の管理目標値、管理目標範囲および精度管理試料を測定して得られた精度管理測定値を、測定項目毎に表記したレーダーチャート図を作成して表示し、精度管理試料を測定して得られた精度管理測定値が、血液または尿に含まれる粒子の種類に対応する測定項目毎の測定値であり、レーダーチャート図において、精度管理測定値が管理目標範囲に入っていない測定項目名を反転表示することを特徴とする精度管理測定値の表示方法を提供するものである。
Further, the present invention provides a plurality of accuracy obtained by performing quality control measurement on a plurality of measurement items by a particle analyzer that acquires measurement values for each measurement item corresponding to the type of particle component contained in blood or urine. A method for displaying managed measurement values, a radar that displays the control target value, control target range, and control accuracy measurement value obtained by measuring the control target sample for each measurement item. creates and displays the chart, quality control measurements obtained by measuring the quality control sample is, Ri measurements der of each measurement item corresponding to the type of the particles contained in the blood or urine, a radar chart in, there is provided a display method of a quality control measure, it characterized that you highlight the measurement item names quality control measurement is not in the management target range.
この発明によれば、複数の精度管理結果が値として管理目標値に対しどうであるのか、管理目標範囲に入っているのかをその程度までひとめで把握できるため、精度管理で得られる多数の測定情報を容易に活用することができる。 According to the present invention, since it is possible to grasp at a glance whether a plurality of quality control results are in relation to the management target value as a value or within the management target range, a large number of measurements obtained by quality control can be obtained. Information can be used easily.
この発明における精度管理試料の管理目標値とは、その分析装置でその精度管理試料を測定したら得られるはずの値をさす。管理目標値自体の設定は標準装置にてその精度管理試料を測定して求めた値や、標準測定方法としての別法で測定した値や、その分析装置でたくさん測定した測定結果の平均値などから、分析項目の特性を考慮して設定される。 The control target value of the quality control sample in this invention refers to a value that should be obtained when the quality control sample is measured by the analyzer. The control target value itself is set by measuring the quality control sample with the standard device, the value measured by another method as the standard measurement method, the average value of the measurement results measured a lot with the analyzer, etc. From the above, it is set in consideration of the characteristics of the analysis item.
この発明における精度管理試料の管理目標範囲とは、その分析装置でその精度管理試料を測定したら得られるはずの値の範囲をさす。この範囲の設定はその分析装置の再現性から設定されたり、測定結果として容認できる誤差範囲などから分析項目の特性を考慮して設定されたりする。 The control target range of the quality control sample in this invention refers to a range of values that should be obtained when the quality control sample is measured by the analyzer. The setting of this range is set from the reproducibility of the analyzer, or is set in consideration of the characteristics of the analysis item from the allowable error range as a measurement result.
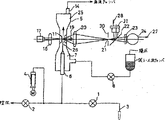
以下、図面を参照しながら分析装置として、尿中有形成分分析装置を実施例として説明する。図1の尿中有形成分分析装置は精度管理用試料に所定の染色処理をして、フローセルに流されているところに励起光を照射し、試料中の有形成分の分析をすることができる。まず、弁1および2を所定時間開けることにより、廃液チャンバーからの陰圧により吸引ノズル3から試料液が弁1および2に満たされる。シリンジ4が一定流量で液を押し出すことにより、試料用ノズル6から試料液が吐出されると同時に、弁8を開けることによりフローセル5のチャンバー7にシース液が供給される。これによって試料は、チャンバー7の内径にしたがって細く絞られシースフローを形成し、オリフィス11を通過する。オリフィス11の形状は内径の一辺が100〜300μmの角柱形状をし、材質は光学硝子(石英硝子も含む)でできている。このようにシースフローを形成することによって粒子を1個ずつオリフィス11の中心を一列に整列して流すことができる。オリフィス11を通過した試料液とシース液とはチャンバー25に設けた回収管14を通って排出される。
Hereinafter, a urine sediment analyzer will be described as an embodiment as an analyzer with reference to the drawings. The urine particle analyzer shown in FIG. 1 performs a predetermined staining process on the quality control sample, irradiates excitation light to the portion flowing in the flow cell, and analyzes the particle component in the sample. it can. First, by opening the valves 1 and 2 for a predetermined time, the sample liquid is filled into the valves 1 and 2 from the suction nozzle 3 by the negative pressure from the waste liquid chamber. When the syringe 4 pushes out the liquid at a constant flow rate, the sample liquid is discharged from the
オリフィス11のほぼ中心のサンプル流26ヘレーザ17から発振したレーザ光がコンデンサレンズ18で楕円状に絞られて照射される。レーザ光の形状は試料の流れの方向には血球粒子径と同程度、例えば10μm前後と狭く、試料の流れ方向および照射光軸方向と直交する方向の形状は、血球粒子径より十分広く、例えば150〜300μm程度である。サンプル流26に照射されたレーザ光で細胞(有形物)に当たらずそのままフローセル5を透過した透過光ビームストッパ19で遮光される。細胞(有形物)に照射され、狭い角度で発せられる前方散乱光および前方蛍光はコレクターレンズ20により集光され、遮光板30のピンホール21を通過する。そして、前方蛍光はダイクロイックミラー22を透過し、フィルター23でさらに散乱光が除かれた後にフォトマルチプライヤーチューブ(PMT)24で検出され、電気信号27に変換されて出力される。前方散乱光はダイクロイックミラー22で反射されフォトダイオード31で受光されて電気信号28に変換されて出力される。
The laser beam oscillated from the
信号処理部にて、細胞による蛍光信号である電気信号27は、信号のピークの大きさを蛍光強度(Fl)、信号の発生時間を蛍光パルス幅(Flw)と信号処理される。同様に細胞による前方散乱光信号である電気信号28は、信号のピークの大きさを前方散乱光強度(Fsc)、信号の発生時間を前方散乱光パルス幅(Fscw)と信号処理される。
In the signal processing unit, the
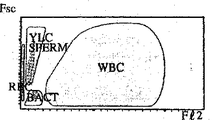
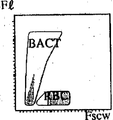
このようにして得られた前方散乱光信号強度、前方散乱光パルス幅、蛍光信号強度、蛍光パルス幅をパラメータとして用いることにより、大きさの分布幅の大きな尿中有形成分を分類する。図3では大きな有形成分である円柱(CAST)と上皮細胞(EC)とを蛍光パルス幅(Flw)と前方散乱光パルス幅(Fscw)とのパラメータで分類計数する。図4と図5では小さな有形成分である赤血球(RBC)と細菌(BACT)を前方散乱光強度(Fsc)、前方散乱光パルス幅(Fscw)と蛍光強度(Fl)をパラメータとして組合せることにより分類計数をする。図2ではその中間の大きさの有形成分である白血球(WBC)を蛍光強度(Fl)と前方散乱光強度(Fsc)とのパラメータで分類計数する。なおFl2はFlより信号強度のレンジを広げて処理した蛍光強度である。 By using the forward scattered light signal intensity, the forward scattered light pulse width, the fluorescent signal intensity, and the fluorescent pulse width obtained as described above as parameters, the urine components having a large size distribution width are classified. In FIG. 3, cylinders (CAST) and epithelial cells (EC), which are large components, are classified and counted using parameters of the fluorescence pulse width (Flw) and the forward scattered light pulse width (Fscw). In FIGS. 4 and 5, red blood cells (RBC) and bacteria (BACT), which are small components, are combined using forward scattered light intensity (Fsc), forward scattered light pulse width (Fscw), and fluorescent intensity (Fl) as parameters. Classification by In FIG. 2, white blood cells (WBC), which are intermediate components, are classified and counted using parameters of fluorescence intensity (Fl) and forward scattered light intensity (Fsc). Fl2 is the fluorescence intensity processed by expanding the signal intensity range from Fl.
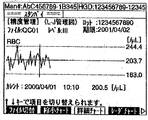
精度管理物質としては、赤血球、白血球、細菌、円柱、上皮細胞の各尿中有形成分と同様な散乱光及び蛍光を備えた粒子を含んだ試料が用いられる。この試料について管理目標値と管理目標範囲が各項目の濃度だけではなく特定項目の測定パラメータ平均値についても設定される。 As the quality control substance, a sample containing particles having scattered light and fluorescence similar to the urine formed components of red blood cells, white blood cells, bacteria, cylinders, and epithelial cells is used. For this sample, the management target value and the management target range are set not only for the concentration of each item but also for the measurement parameter average value of a specific item.
精度管理項目として、通常の各測定項目の濃度だけではなく、特定項目の測定パラメータ値をも用いるようにして、精度管理の能力をより高度なものとしている。しかし、精度管理項目がこれほど多くなると、各項目値の大小まで把握することが難しくなる。そこでこれらの精度管理項目を各測定項目濃度と特定項目の測定パラメータ値とに分け、各精度管理結果をチャート図で表記したものが図6である。 As the quality control item, not only the density of each normal measurement item but also the measurement parameter value of a specific item is used, so that the quality control capability is enhanced. However, when there are so many quality control items, it becomes difficult to grasp the size of each item value. Therefore, FIG. 6 shows these quality control items divided into measurement item concentrations and measurement parameter values of specific items, and each quality control result is shown in a chart.
図6のチャート図の中心実線が管理目標値を表わし、外側と内側の破線が管理目標範囲の上限と下限を表わす。測定項目である赤血球(RBC)、白血球(WBC)、細菌(BACT)、円柱(CAST)、上皮細胞(EC)の濃度が左側のチャート図に表わされる。特定項目の測定パラメータ値として平均蛍光強度(Fl、Fl2)、平均前方散乱光強度(Fsc、Fsc2)、平均前方散乱光パルス幅(Fscw)が右側のチャート図に表わされる。尿中有形成分の分布幅が大きいので、蛍光強度と前方散乱光強度については信号の大きな項目と小さな項目の2項目を用いて精度管理している。 The central solid line in the chart of FIG. 6 represents the management target value, and the outer and inner dashed lines represent the upper limit and the lower limit of the management target range. Concentrations of red blood cells (RBC), white blood cells (WBC), bacteria (BACT), cylinders (CAST), and epithelial cells (EC), which are measurement items, are shown in the left chart. The average fluorescence intensity (Fl, Fl2), average forward scattered light intensity (Fsc, Fsc2), and average forward scattered light pulse width (Fscw) are shown in the chart on the right as measurement parameter values of specific items. Since the distribution range of the urine formed component is large, the accuracy of the fluorescence intensity and the forward scattered light intensity is controlled by using two items of a large signal and a small item.
図6では管理目標範囲に入っていない測定項目は反転させて分かりやすくし、管理目標値に対する大小を他の項目とともにひとめで把握できるようになっている。そのうえ、測定項目だけではなく、各パラメータも同様に確認することができるため、管理目標範囲に入っていない場合の処置や原因特定も容易になる。 In FIG. 6, the measurement items that are not within the management target range are reversed to make it easy to understand, and the magnitude of the management target value can be grasped at a glance together with other items. In addition, since not only the measurement items but also each parameter can be confirmed in the same manner, it is easy to specify the treatment and cause when the parameters are not within the management target range.
図7のような精度管理測定値の経時変化や前回精度管理測定時のチャート図を画面表示切り換えることによって、すぐに見れるようにすることで精度管理結果の把握がより容易にできる。 By switching the display of the quality control measurement value with time as shown in FIG. 7 or the chart display at the time of the previous quality control measurement, it is possible to easily see the quality control result by making it immediately visible.
さらに、この精度管理測定結果のチャート図に前回の精度管理測定結果を重ねて表示できる機能を持たせれば、画面表示を切り換えることなしに前回との比較確認することができ、より有用である。また、前回までの精度管理測定結果の分布範囲をも重ねて表示できる機能を持たせれば、この装置でのいままでの測定結果と比較確認することができ、より有用である。 Furthermore, if the chart of the quality control measurement result is provided with a function that can display the quality control measurement result of the previous time, the comparison with the previous time can be confirmed without switching the screen display, which is more useful. In addition, if the function of displaying the distribution range of the quality control measurement results up to the previous time is provided, it is more useful because it can be compared with the previous measurement results of this device.
1;弁
2;弁
3;吸引ノズル
4;シリンジ
5;フローセル
6;試料用ノズル
7;チャンバー
8;弁
11;オリフィス
14;回収管
17;レーザー
18;コンデンサレンズ
19;ビームストッパ
20;コレクターレンズ
21;ピンホール
22;ダイクロイックミラー
23;フィルター
24;フォトマルチプライヤーチューブ
25;チャンバー
26;サンプル流
27;電気信号
28;電気信号
30;遮光板
31;フォトダイオード
1; Valve 2; Valve 3; Suction nozzle 4;
Claims (7)
Priority Applications (1)
| Application Number | Priority Date | Filing Date | Title |
|---|---|---|---|
| JP2007334004A JP4580976B2 (en) | 2007-12-26 | 2007-12-26 | Biological sample analyzer with quality control function and method for displaying quality control measurement results |
Applications Claiming Priority (1)
| Application Number | Priority Date | Filing Date | Title |
|---|---|---|---|
| JP2007334004A JP4580976B2 (en) | 2007-12-26 | 2007-12-26 | Biological sample analyzer with quality control function and method for displaying quality control measurement results |
Related Parent Applications (1)
| Application Number | Title | Priority Date | Filing Date |
|---|---|---|---|
| JP10365966A Division JP2000187037A (en) | 1998-12-24 | 1998-12-24 | Sample analyzing device provided with function of controlling accuracy |
Publications (2)
| Publication Number | Publication Date |
|---|---|
| JP2008089609A JP2008089609A (en) | 2008-04-17 |
| JP4580976B2 true JP4580976B2 (en) | 2010-11-17 |
Family
ID=39373884
Family Applications (1)
| Application Number | Title | Priority Date | Filing Date |
|---|---|---|---|
| JP2007334004A Expired - Lifetime JP4580976B2 (en) | 2007-12-26 | 2007-12-26 | Biological sample analyzer with quality control function and method for displaying quality control measurement results |
Country Status (1)
| Country | Link |
|---|---|
| JP (1) | JP4580976B2 (en) |
Families Citing this family (3)
| Publication number | Priority date | Publication date | Assignee | Title |
|---|---|---|---|---|
| JP5220647B2 (en) | 2009-02-12 | 2013-06-26 | 株式会社日立ハイテクノロジーズ | Automatic analyzer |
| JP6875137B2 (en) | 2017-01-31 | 2021-05-19 | シスメックス株式会社 | Quality control method, quality control system, control device, analyzer and quality control abnormality judgment method |
| EP4700780A1 (en) * | 2024-08-22 | 2026-02-25 | Shenzhen Mindray Bio-Medical Electronics Co., Ltd. | Sample analysis system, information management system and module, and information management method |
Family Cites Families (9)
| Publication number | Priority date | Publication date | Assignee | Title |
|---|---|---|---|---|
| JPH01124747A (en) * | 1987-11-10 | 1989-05-17 | Konica Corp | Generating method for conversion expression |
| JPH0638798B2 (en) * | 1988-11-21 | 1994-05-25 | 日本電気株式会社 | Health examination interview support system |
| JP2525063B2 (en) * | 1990-03-03 | 1996-08-14 | 株式会社日立製作所 | Automatic analysis method |
| JP3169598B2 (en) * | 1990-07-06 | 2001-05-28 | 株式会社日立製作所 | Automatic analysis method and automatic analyzer |
| JPH06215011A (en) * | 1992-11-26 | 1994-08-05 | Chuo Computer Syst Kk | Method and device for opening and reading information by individual classifications |
| JP3213097B2 (en) * | 1992-12-28 | 2001-09-25 | シスメックス株式会社 | Particle analyzer and method |
| JPH08211064A (en) * | 1995-02-02 | 1996-08-20 | Hitachi Ltd | Automatic analyzer |
| JP3875754B2 (en) * | 1995-11-17 | 2007-01-31 | シスメックス株式会社 | Standard solution for flow cytometer |
| JPH102902A (en) * | 1996-06-14 | 1998-01-06 | Toshiba Corp | Automatic analyzer |
-
2007
- 2007-12-26 JP JP2007334004A patent/JP4580976B2/en not_active Expired - Lifetime
Also Published As
| Publication number | Publication date |
|---|---|
| JP2008089609A (en) | 2008-04-17 |
Similar Documents
| Publication | Publication Date | Title |
|---|---|---|
| US10061973B2 (en) | Method and apparatus for automated platelet identification within a whole blood sample from microscopy images | |
| JP5381741B2 (en) | Optical measuring apparatus and optical measuring method | |
| JP5433517B2 (en) | Analysis apparatus and analysis method | |
| EP2626686A1 (en) | Flow cytometer with digital holographic microscope | |
| CN105917211A (en) | Optical engine for flow cytometer, flow cytometer system and methods of use | |
| CN105910968B (en) | Bioaerosol laser monitoring, early warning and identification device and method | |
| CN101498646A (en) | Forward-scattering signal inspection device and method, cell or particle analyzer | |
| CN102192872A (en) | Optical measuring device and optical measuring method | |
| CN102998259A (en) | Optical measuring apparatus, flow cytometer, and optical measuring method | |
| CN104805004A (en) | Blood cell analyzer | |
| JPH05322883A (en) | Instrument for analyzing cell in urine | |
| JP2009162660A (en) | Detection method and detection apparatus | |
| US20150177118A1 (en) | Fluidic optical cartridge | |
| CN120476301A (en) | Hematology Flow System Interface | |
| JP2000187037A (en) | Sample analyzing device provided with function of controlling accuracy | |
| JP4580976B2 (en) | Biological sample analyzer with quality control function and method for displaying quality control measurement results | |
| US9068915B2 (en) | Method and system for calibrating a flow cytometer | |
| US11686662B2 (en) | Microparticle sorting device and method for sorting microparticles | |
| US6468803B1 (en) | Method for calibrating a sample analyzer | |
| KR101895760B1 (en) | Blood cell analysis system and control method thereof | |
| JP7555732B2 (en) | Cell measuring method and cell measuring device | |
| JP2000046723A (en) | Method for inspecting function of platelet | |
| JPH03154850A (en) | Specimen inspecting device | |
| JP2010071982A (en) | Asbestos identifying method by attenuation factor comparison of laser-induced fluorescence intensity | |
| JPH0486546A (en) | Specimen inspection device |
Legal Events
| Date | Code | Title | Description |
|---|---|---|---|
| A131 | Notification of reasons for refusal |
Free format text: JAPANESE INTERMEDIATE CODE: A131 Effective date: 20100119 |
|
| A521 | Request for written amendment filed |
Free format text: JAPANESE INTERMEDIATE CODE: A523 Effective date: 20100318 |
|
| A02 | Decision of refusal |
Free format text: JAPANESE INTERMEDIATE CODE: A02 Effective date: 20100420 |
|
| A521 | Request for written amendment filed |
Free format text: JAPANESE INTERMEDIATE CODE: A523 Effective date: 20100720 |
|
| A911 | Transfer to examiner for re-examination before appeal (zenchi) |
Free format text: JAPANESE INTERMEDIATE CODE: A911 Effective date: 20100726 |
|
| TRDD | Decision of grant or rejection written | ||
| A01 | Written decision to grant a patent or to grant a registration (utility model) |
Free format text: JAPANESE INTERMEDIATE CODE: A01 Effective date: 20100817 |
|
| A01 | Written decision to grant a patent or to grant a registration (utility model) |
Free format text: JAPANESE INTERMEDIATE CODE: A01 |
|
| A61 | First payment of annual fees (during grant procedure) |
Free format text: JAPANESE INTERMEDIATE CODE: A61 Effective date: 20100830 |
|
| FPAY | Renewal fee payment (event date is renewal date of database) |
Free format text: PAYMENT UNTIL: 20130903 Year of fee payment: 3 |
|
| R150 | Certificate of patent or registration of utility model |
Free format text: JAPANESE INTERMEDIATE CODE: R150 |
|
| R250 | Receipt of annual fees |
Free format text: JAPANESE INTERMEDIATE CODE: R250 |
|
| R250 | Receipt of annual fees |
Free format text: JAPANESE INTERMEDIATE CODE: R250 |
|
| EXPY | Cancellation because of completion of term |