JP4417143B2 - SAMPLE ANALYZER, PROGRAM, AND RECORDING MEDIUM CONTAINING THE PROGRAM - Google Patents
SAMPLE ANALYZER, PROGRAM, AND RECORDING MEDIUM CONTAINING THE PROGRAM Download PDFInfo
- Publication number
- JP4417143B2 JP4417143B2 JP2004069098A JP2004069098A JP4417143B2 JP 4417143 B2 JP4417143 B2 JP 4417143B2 JP 2004069098 A JP2004069098 A JP 2004069098A JP 2004069098 A JP2004069098 A JP 2004069098A JP 4417143 B2 JP4417143 B2 JP 4417143B2
- Authority
- JP
- Japan
- Prior art keywords
- scattered light
- cell group
- average value
- reticulocytes
- sample
- Prior art date
- Legal status (The legal status is an assumption and is not a legal conclusion. Google has not performed a legal analysis and makes no representation as to the accuracy of the status listed.)
- Expired - Lifetime
Links
- PWPJGUXAGUPAHP-UHFFFAOYSA-N lufenuron Chemical compound C1=C(Cl)C(OC(F)(F)C(C(F)(F)F)F)=CC(Cl)=C1NC(=O)NC(=O)C1=C(F)C=CC=C1F PWPJGUXAGUPAHP-UHFFFAOYSA-N 0.000 title 2
- 210000003743 erythrocyte Anatomy 0.000 claims description 97
- 210000001995 reticulocyte Anatomy 0.000 claims description 84
- 239000000523 sample Substances 0.000 claims description 78
- 210000004027 cell Anatomy 0.000 claims description 74
- 238000004458 analytical method Methods 0.000 claims description 59
- 238000001514 detection method Methods 0.000 claims description 59
- 102000001554 Hemoglobins Human genes 0.000 claims description 44
- 108010054147 Hemoglobins Proteins 0.000 claims description 44
- 239000012472 biological sample Substances 0.000 claims description 23
- 230000003287 optical effect Effects 0.000 claims description 19
- 238000004364 calculation method Methods 0.000 claims description 18
- 238000000034 method Methods 0.000 claims description 13
- 238000002835 absorbance Methods 0.000 claims description 12
- 238000012284 sample analysis method Methods 0.000 claims description 4
- 230000001678 irradiating effect Effects 0.000 claims description 3
- 238000005259 measurement Methods 0.000 description 28
- XEEYBQQBJWHFJM-UHFFFAOYSA-N Iron Chemical compound [Fe] XEEYBQQBJWHFJM-UHFFFAOYSA-N 0.000 description 24
- 238000009826 distribution Methods 0.000 description 21
- 210000001772 blood platelet Anatomy 0.000 description 18
- 238000010586 diagram Methods 0.000 description 17
- 210000004369 blood Anatomy 0.000 description 13
- 239000008280 blood Substances 0.000 description 13
- 238000012545 processing Methods 0.000 description 13
- 229910052742 iron Inorganic materials 0.000 description 12
- 239000002245 particle Substances 0.000 description 11
- 238000011160 research Methods 0.000 description 11
- 210000000265 leukocyte Anatomy 0.000 description 9
- 208000007502 anemia Diseases 0.000 description 8
- 239000003153 chemical reaction reagent Substances 0.000 description 8
- 238000002360 preparation method Methods 0.000 description 6
- 206010058116 Nephrogenic anaemia Diseases 0.000 description 5
- 238000004891 communication Methods 0.000 description 4
- 230000004069 differentiation Effects 0.000 description 4
- 208000015710 Iron-Deficiency Anemia Diseases 0.000 description 3
- 238000004519 manufacturing process Methods 0.000 description 3
- 238000012360 testing method Methods 0.000 description 3
- 208000017667 Chronic Disease Diseases 0.000 description 2
- 102000003951 Erythropoietin Human genes 0.000 description 2
- 108090000394 Erythropoietin Proteins 0.000 description 2
- 229920002153 Hydroxypropyl cellulose Polymers 0.000 description 2
- 206010022971 Iron Deficiencies Diseases 0.000 description 2
- UIIMBOGNXHQVGW-UHFFFAOYSA-M Sodium bicarbonate Chemical compound [Na+].OC([O-])=O UIIMBOGNXHQVGW-UHFFFAOYSA-M 0.000 description 2
- 229940105423 erythropoietin Drugs 0.000 description 2
- 235000010977 hydroxypropyl cellulose Nutrition 0.000 description 2
- 210000002751 lymph Anatomy 0.000 description 2
- 230000002093 peripheral effect Effects 0.000 description 2
- OXCMYAYHXIHQOA-UHFFFAOYSA-N potassium;[2-butyl-5-chloro-3-[[4-[2-(1,2,4-triaza-3-azanidacyclopenta-1,4-dien-5-yl)phenyl]phenyl]methyl]imidazol-4-yl]methanol Chemical compound [K+].CCCCC1=NC(Cl)=C(CO)N1CC1=CC=C(C=2C(=CC=CC=2)C2=N[N-]N=N2)C=C1 OXCMYAYHXIHQOA-UHFFFAOYSA-N 0.000 description 2
- 210000002966 serum Anatomy 0.000 description 2
- 101100327917 Caenorhabditis elegans chup-1 gene Proteins 0.000 description 1
- 101100206389 Caenorhabditis elegans tag-124 gene Proteins 0.000 description 1
- 102000008857 Ferritin Human genes 0.000 description 1
- 108050000784 Ferritin Proteins 0.000 description 1
- 238000008416 Ferritin Methods 0.000 description 1
- 206010018910 Haemolysis Diseases 0.000 description 1
- 101000987586 Homo sapiens Eosinophil peroxidase Proteins 0.000 description 1
- 101000920686 Homo sapiens Erythropoietin Proteins 0.000 description 1
- 102000007238 Transferrin Receptors Human genes 0.000 description 1
- 108010033576 Transferrin Receptors Proteins 0.000 description 1
- 238000000149 argon plasma sintering Methods 0.000 description 1
- 210000000601 blood cell Anatomy 0.000 description 1
- 238000004820 blood count Methods 0.000 description 1
- 238000006243 chemical reaction Methods 0.000 description 1
- 239000003795 chemical substances by application Substances 0.000 description 1
- 230000003247 decreasing effect Effects 0.000 description 1
- 239000012895 dilution Substances 0.000 description 1
- 238000010790 dilution Methods 0.000 description 1
- 201000010099 disease Diseases 0.000 description 1
- 208000037265 diseases, disorders, signs and symptoms Diseases 0.000 description 1
- 230000000694 effects Effects 0.000 description 1
- 230000008588 hemolysis Effects 0.000 description 1
- 102000044890 human EPO Human genes 0.000 description 1
- 210000003734 kidney Anatomy 0.000 description 1
- 239000004973 liquid crystal related substance Substances 0.000 description 1
- 210000004698 lymphocyte Anatomy 0.000 description 1
- 210000001616 monocyte Anatomy 0.000 description 1
- 210000005259 peripheral blood Anatomy 0.000 description 1
- 239000011886 peripheral blood Substances 0.000 description 1
- 230000028327 secretion Effects 0.000 description 1
- 239000000243 solution Substances 0.000 description 1
- 238000010186 staining Methods 0.000 description 1
- 239000012192 staining solution Substances 0.000 description 1
- 210000002700 urine Anatomy 0.000 description 1
Images


Classifications
-
- G—PHYSICS
- G01—MEASURING; TESTING
- G01N—INVESTIGATING OR ANALYSING MATERIALS BY DETERMINING THEIR CHEMICAL OR PHYSICAL PROPERTIES
- G01N15/00—Investigating characteristics of particles; Investigating permeability, pore-volume or surface-area of porous materials
- G01N15/10—Investigating individual particles
- G01N15/14—Optical investigation techniques, e.g. flow cytometry
- G01N15/1456—Optical investigation techniques, e.g. flow cytometry without spatial resolution of the texture or inner structure of the particle, e.g. processing of pulse signals
- G01N15/1459—Optical investigation techniques, e.g. flow cytometry without spatial resolution of the texture or inner structure of the particle, e.g. processing of pulse signals the analysis being performed on a sample stream
-
- G—PHYSICS
- G01—MEASURING; TESTING
- G01N—INVESTIGATING OR ANALYSING MATERIALS BY DETERMINING THEIR CHEMICAL OR PHYSICAL PROPERTIES
- G01N15/00—Investigating characteristics of particles; Investigating permeability, pore-volume or surface-area of porous materials
- G01N15/10—Investigating individual particles
- G01N2015/1006—Investigating individual particles for cytology
-
- G—PHYSICS
- G01—MEASURING; TESTING
- G01N—INVESTIGATING OR ANALYSING MATERIALS BY DETERMINING THEIR CHEMICAL OR PHYSICAL PROPERTIES
- G01N15/00—Investigating characteristics of particles; Investigating permeability, pore-volume or surface-area of porous materials
- G01N15/10—Investigating individual particles
- G01N15/14—Optical investigation techniques, e.g. flow cytometry
- G01N2015/1402—Data analysis by thresholding or gating operations performed on the acquired signals or stored data
-
- G—PHYSICS
- G01—MEASURING; TESTING
- G01N—INVESTIGATING OR ANALYSING MATERIALS BY DETERMINING THEIR CHEMICAL OR PHYSICAL PROPERTIES
- G01N15/00—Investigating characteristics of particles; Investigating permeability, pore-volume or surface-area of porous materials
- G01N15/10—Investigating individual particles
- G01N15/14—Optical investigation techniques, e.g. flow cytometry
- G01N2015/1477—Multiparameters
-
- Y—GENERAL TAGGING OF NEW TECHNOLOGICAL DEVELOPMENTS; GENERAL TAGGING OF CROSS-SECTIONAL TECHNOLOGIES SPANNING OVER SEVERAL SECTIONS OF THE IPC; TECHNICAL SUBJECTS COVERED BY FORMER USPC CROSS-REFERENCE ART COLLECTIONS [XRACs] AND DIGESTS
- Y10—TECHNICAL SUBJECTS COVERED BY FORMER USPC
- Y10T—TECHNICAL SUBJECTS COVERED BY FORMER US CLASSIFICATION
- Y10T436/00—Chemistry: analytical and immunological testing
- Y10T436/10—Composition for standardization, calibration, simulation, stabilization, preparation or preservation; processes of use in preparation for chemical testing
- Y10T436/101666—Particle count or volume standard or control [e.g., platelet count standards, etc.]
Landscapes
- Chemical & Material Sciences (AREA)
- Biochemistry (AREA)
- Physics & Mathematics (AREA)
- Health & Medical Sciences (AREA)
- Life Sciences & Earth Sciences (AREA)
- Analytical Chemistry (AREA)
- Dispersion Chemistry (AREA)
- General Health & Medical Sciences (AREA)
- General Physics & Mathematics (AREA)
- Immunology (AREA)
- Pathology (AREA)
- Investigating Or Analysing Biological Materials (AREA)
- Investigating Or Analysing Materials By Optical Means (AREA)
- Investigating, Analyzing Materials By Fluorescence Or Luminescence (AREA)
Description
この発明は、試料分析装置、プログラムおよびそのプログラムを記録した記録媒体に関し、特に、散乱光情報に基づいて生体試料を分析する試料分析装置、プログラムおよびびそのプログラムを記録した記録媒体に関する。 The present invention relates to a sample analyzer, a program, and a recording medium that records the program, and more particularly, to a sample analyzer that analyzes a biological sample based on scattered light information, a program, and a recording medium that records the program.
従来、フローサイトメータを使用して血液を分析する血液分析装置が知られている(例えば、特許文献1および2参照)。
また、網状赤血球の大きさは、その細胞に含まれているヘモグロビン量と密接な関係があることが指摘されている(例えば、非特許文献1)。
Further, it has been pointed out that the size of reticulocytes is closely related to the amount of hemoglobin contained in the cells (for example, Non-Patent Document 1).
上記特許文献1および2などの従来の血液分析装置においては、装置を大型化させたり、試薬の消費量を増加させたりすることなく、治療方法の決定に有用な測定項目をさらに増加させたり、出力された測定データの信頼性をさらに向上させることが求められている。
In the conventional blood analyzers such as
上記特許文献1には、光散乱パターンを使用して赤血球の容積とヘモグロビンの濃度を解析する装置が開示されている。
しかし、その解析方法は、第1および第2の信号をペアとして、容積および屈折率が既知の赤血球により発生された相当する信号のペアと比較することにより、前記第1および第2の信号の大きさから赤血球の容積および屈折率を決定するという複雑なものであるという問題がある。
However, the analysis method compares the first and second signals by comparing the first and second signals with a corresponding pair of signals generated by red blood cells of known volume and refractive index. There is a problem of determining the volume and refractive index of red blood cells from the size.
非特許文献1によれば、網状赤血球の大きさは、その細胞に含まれているヘモグロビン量と密接な関係があることが指摘されている。
しかし、使用者は、従来の血液分析装置を使用して網状赤血球の大きさ情報を得たとしても、その情報から即座にヘモグロビン量を取得することは困難である。
また、大きさ情報として得た網状赤血球の分析結果が、量を示す情報であるヘモグロビン量と密接な関係があるということは、使用者にとって非常に理解しにくいものである。
According to Non-Patent
However, even if the user obtains reticulocyte size information using a conventional blood analyzer, it is difficult to immediately obtain the amount of hemoglobin from the information.
In addition, it is very difficult for the user to understand that the analysis result of reticulocytes obtained as size information is closely related to the amount of hemoglobin, which is information indicating the amount.
また、非特許文献1には単に、網状赤血球の大きさは、その細胞に含まれているヘモグロビン量と密接な関係があることが示されているだけであり、その事実を従来の血液分析装置にどのように組み込むかについては開示されていない。
Further, Non-Patent
この発明の第1の局面による試料分析装置は、生体試料に光を照射して前記生体試料に含まれる細胞から散乱光情報を取得する検出部と、前記検出部によって取得された散乱光情報に基づいて網状赤血球からなる群を含む細胞群を作成する細胞群作成手段と、網状赤血球からなる細胞群に含まれる各網状赤血球の散乱光強度の平均値を取得する平均値取得手段と、前記平均値取得手段が取得した平均値に基づいて網状赤血球からなる細胞群に含まれる網状赤血球のヘモグロビン量に相当する値である内容量相当値を算出する算出手段と、前記算出手段によって算出された前記内容量相当値を出力する出力手段と、を備える。 A sample analyzer according to a first aspect of the present invention includes a detection unit that irradiates a biological sample with light and acquires scattered light information from cells contained in the biological sample, and the scattered light information acquired by the detection unit. A cell group creating means for creating a cell group including a group consisting of reticulocytes based on, an average value acquiring means for acquiring an average value of scattered light intensity of each reticulocyte contained in a cell group consisting of reticulocytes, and the average Based on the average value acquired by the value acquisition means, a calculation means for calculating a content equivalent value that is a value corresponding to the hemoglobin amount of reticulocytes contained in a cell group consisting of reticulocytes, and the calculation means calculated by the calculation means Output means for outputting a content equivalent value.
この発明の第2の局面による試料分析装置は、生体試料に光を照射して前記生体試料に含まれる細胞から散乱光情報を取得する検出部と、前記検出部によって取得された散乱光情報に基づいて成熟赤血球からなる群を含む細胞群を作成する細胞群作成手段と、成熟赤血球からなる細胞群に含まれる各成熟赤血球の散乱光強度の平均値を取得する平均値取得手段と、前記平均値取得手段が取得した平均値に基づいて成熟赤血球からなる細胞群に含まれる成熟赤血球のヘモグロビン量に相当する値である内容量相当値を算出する算出手段と、前記算出手段によって算出された前記内容量相当値を出力する出力手段と、を備える。 A sample analyzer according to a second aspect of the present invention includes a detection unit that irradiates a biological sample with light and acquires scattered light information from cells included in the biological sample, and the scattered light information acquired by the detection unit. A cell group creating means for creating a cell group including a group consisting of mature erythrocytes, an average value acquiring means for acquiring an average value of scattered light intensity of each mature erythrocyte contained in a cell group consisting of mature erythrocytes, and the average Based on the average value acquired by the value acquisition means, a calculation means for calculating an internal volume equivalent value that is a value corresponding to the hemoglobin amount of mature erythrocytes contained in a cell group consisting of mature erythrocytes, and the calculation means calculated by the calculation means Output means for outputting a content equivalent value .
この発明の第3の局面による試料分析方法を実行するためのプログラムは、情報取得手段が、生体試料に光を照射して前記生体試料に含まれる各細胞から取得された散乱光情報を取得するステップと、細胞群作成手段が、前記散乱光情報に基づいて網状赤血球からなる群を含む細胞群を作成するステップと、平均値取得手段が、網状赤血球からなる細胞群に含まれる各網状赤血球の散乱光強度の平均値を取得するステップと、算出手段が、平均値取得手段によって取得された平均値に基づいて網状赤血球からなる細胞群に含まれる網状赤血球のヘモグロビン量に相当する値である内容量相当値を算出するステップと、出力手段が、前記算出手段によって算出された前記内容量相当値を出力するステップと、を備える。 In the program for executing the sample analysis method according to the third aspect of the present invention, the information acquisition unit irradiates the biological sample with light and acquires scattered light information acquired from each cell included in the biological sample. A step of creating a cell group including a group of reticulocytes based on the scattered light information, and an average value acquiring unit of each reticulocyte included in the cell group of reticulocytes. The step of obtaining the average value of the scattered light intensity, and the calculation means is a value corresponding to the hemoglobin amount of reticulocytes contained in a cell group composed of reticulocytes based on the average value obtained by the average value obtaining means A step of calculating an amount equivalent value, and an output unit outputting the internal capacity equivalent value calculated by the calculation unit .
この発明の第4の局面による試料分析方法を実行するためのプログラムは、情報取得手段が、生体試料に光を照射して前記生体試料に含まれる各細胞から取得された散乱光情報を取得するステップと、細胞群作成手段が、前記散乱光情報に基づいて成熟赤血球からなる群を含む細胞群を作成するステップと、平均値取得手段が、成熟赤血球からなる細胞群に含まれる各成熟赤血球の散乱光強度の平均値を取得するステップと、算出手段が、平均値取得手段によって取得された平均値に基づいて成熟赤血球からなる細胞群に含まれる成熟赤血球のヘモグロビン量に相当する値である内容量相当値を算出するステップと、出力手段が、前記算出手段によって算出された前記内容量相当値を出力するステップと、を備える。
In the program for executing the sample analysis method according to the fourth aspect of the present invention, the information acquisition means irradiates the biological sample with light and acquires scattered light information acquired from each cell included in the biological sample. a step, cell group creation means, and creating a cell group containing the group consisting of mature red blood cells based on the scattered light information, the average value acquisition means, each mature erythrocytes contained in the cell groups of mature red blood cells The step of obtaining the average value of the scattered light intensity, and the calculation means is a value corresponding to the amount of hemoglobin of mature erythrocytes contained in a cell group consisting of mature erythrocytes based on the average value obtained by the average value acquisition means A step of calculating an amount equivalent value, and an output unit outputting the internal capacity equivalent value calculated by the calculation unit.
以下、本発明の実施形態を図面に基づいて説明する。
本発明の一実施形態による試料分析装置は、血液を分析して白血球(WBC)、赤血球(RBC)および血小板(PLT)などの数を算出する血球計数装置である。
Hereinafter, embodiments of the present invention will be described with reference to the drawings.
A sample analyzer according to an embodiment of the present invention is a blood cell counter that analyzes blood to calculate the number of white blood cells (WBC), red blood cells (RBC), platelets (PLT), and the like.
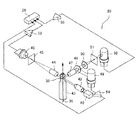
図1は、本発明の一実施形態による試料分析装置およびその周辺機器の全体構成を示した斜視図である。
図1に示すように、本実施形態の試料分析装置10は、装置本体1と、装置本体1に通信ケーブルを介して接続されるデータ処理端末2とを含む。
装置本体1は、装置本体1に陽圧や陰圧を供給する空圧源5にチューブを介して接続されている。また、装置本体1は、検体を収容した検体容器を自動で装置本体1に供給するサンプラ部6に接続されている。また、装置本体1は、図示しない試薬容器にチューブを介して接続され、空圧源5から供給される陰圧を使用して試薬容器から試薬を吸引する。
FIG. 1 is a perspective view showing the overall configuration of a sample analyzer and its peripheral devices according to an embodiment of the present invention.
As shown in FIG. 1, the
The apparatus
装置本体1は、血液の吸引を行う試料吸引部14a、14b、液晶ディスプレイを含む本体側表示部11、および、キーボードを含む本体側入力部12などを備えている。
試料吸引部14aは、使用者が検体容器を保持しながら血液を吸引させるマニュアルモードで使用される吸引部であり、試料吸引部14bは、サンプラ部6を使用して自動で血液を吸引するサンプラモードで使用される吸引部である。
データ処理端末2は、端末本体15、CRTディスプレイを含む端末側表示部16、および、キーボードや図示しないマウスを含む端末側入力部18を含む。
データ処理端末2は、分析結果のリストを印字するためのページプリンタ3、粒度分布図やスキャッタグラムを印字するカラーグラフィックプリンタ4、および、分析結果を検査伝票形式の用紙に印字するデータプリンタ7にそれぞれ通信ケーブルを介して接続されている。
The apparatus
The sample suction unit 14a is a suction unit used in a manual mode in which a user sucks blood while holding a sample container, and the sample suction unit 14b is a sampler that automatically sucks blood using the
The
The
図2は、装置本体1およびデータ処理端末2の内部構成を示すブロック図である。
図2に示すように、装置本体1は、試料吸引部14a,14b、試料調製部16、検出部19、本体側制御部26、本体側表示部11、本体側入力部12、および、出入力インターフェイス32aを含む。
試料調製部16は、試料吸引部14aおよび14bによって吸引された血液と図示しない試薬容器から吸引した試薬とを混合することによって、希釈、溶血、および染色などの処理をする。そして、これらの処理によって作成された測定用試料を検出部19に供給する。
検出部19は、光学系検出部20と、電気系検出部22と吸光度検出部24とを含む。
光学系検出部20については後述する。
FIG. 2 is a block diagram showing the internal configuration of the apparatus
As shown in FIG. 2, the apparatus
The
The detection unit 19 includes an optical
The optical
電気系検出部22は、RF/DC検出方式を採用した検出器と、シースフローDC検出方式を採用した検出器とを含む。なお、シースフローDC検出方式を採用した検出器としては、例えば、米国特許第6,525,807号明細書に第1測定部として記載された検出器が使用できる。
吸光度検出部24としては、発光ダイオードと、受光素子と、それらの間に配置された透明なセルとを含む検出器が使用されている。吸光度検出部24は、希釈液のみの透過光強度とヘモグロビン測定用試料の透過光強度とを本体側制御部26に出力し、本体側制御部26は、これらの透過光強度の差(吸光度)からヘモグロビン(HGB)濃度を算出する。
本体側制御部26は、CPU、ROM、RAM、A/D変換回路などを含み、検出部19から出力されるアナログ信号をデジタル信号に変換し、それらのデータから分析結果を算出する。そして、本体側制御部26は、算出した分析結果を出入力インターフェイス32aを介してデータ処理端末2に送信する。また、本体側制御部26は、分析結果の算出に使用される後述する演算式を記憶している。
The electrical detection unit 22 includes a detector that employs an RF / DC detection method and a detector that employs a sheath flow DC detection method. In addition, as a detector which employ | adopted the sheath flow DC detection system, the detector described as a 1st measurement part in US Patent 6,525,807 can be used, for example.
As the absorbance detection unit 24, a detector including a light emitting diode, a light receiving element, and a transparent cell disposed therebetween is used. The absorbance detection unit 24 outputs the transmitted light intensity of only the diluted solution and the transmitted light intensity of the hemoglobin measurement sample to the main body
The main body
また、本体側制御部26は、試料吸引部14a,14b、試料調製部16、および検出部19などの動作を制御する。また、本体側制御部26は、本体側入力部12から入力されたデータを受け付けるとともに、所定の情報を本体側表示部11に表示させる。本体側表示部11に表示させる情報としては、分析結果のうち主要な項目や、エラーの情報などが挙げられる。
端末本体15は、出入力インターフェイス32bと、端末側制御部34とを含む。出入力インターフェイス32aと32bとは通信ケーブル33を介して接続されている。
端末側制御部34は、CPU,ROM、RAM、およびハードディスクなどを含む。端末側制御部34は、出入力インターフェイス32bを介して装置本体1から送信された分析結果を端末側表示部16に表示させたり、各種プリンタ(図1参照)に印字させたりすることができる。
また、端末側制御部34は、端末側入力部18から入力された情報を装置本体1に送信することができる。
The main
The terminal body 15 includes an input / output interface 32b and a terminal-side control unit 34. The input / output interfaces 32 a and 32 b are connected via a
The terminal side control unit 34 includes a CPU, a ROM, a RAM, a hard disk, and the like. The terminal-side control unit 34 can display the analysis result transmitted from the apparatus
Further, the terminal side control unit 34 can transmit information input from the terminal
図3は、光学系検出部20の構成を示した斜視図である。
図3に示すように、光学系検出部20は、ノズル36、レーザダイオード40、コリメータレンズ42、シースフローセル43、集光レンズ44、ピンホール板45、フォトダイオード46、集光レンズ47、ダイクロイックミラー48、フォトマルチプライヤチューブ(以下、フォトマルとよぶ)49、フィルタ50、ピンホール板51、フォトマルチプライヤチューブ(以下、フォトマルとよぶ)52、および、アンプ53〜55を含む。
FIG. 3 is a perspective view showing the configuration of the optical
As shown in FIG. 3, the optical
試料調製部16(図2参照)から供給された測定用試料は、ノズル36を介してシースフローセル43のオリフィス部38を流れる。
レーザダイオード40から発せられた光は、シースフローセル40のオリフィス部38を流れる測定用試料をコリメータレンズ42を介して照射する。オリフィス部38を流れる測定用試料によって前方に散乱した光(前方散乱光)は、集光レンズ44とピンホール板45とを介してフォトダイオード46に入射する。
オリフィス部38を流れる測定用試料によって側方に散乱した光(側方散乱光)は、集光レンズ47とダイクロイックミラー48とを介してフォトマル49に入射する。
The measurement sample supplied from the sample preparation section 16 (see FIG. 2) flows through the
The light emitted from the
Light scattered laterally by the measurement sample flowing through the orifice portion 38 (side scattered light) enters the
光が照射されることによって、オリフィス部38を流れる測定用試料から発せられた蛍光(側方蛍光)は、集光レンズ47とダイクロイックミラー48とフィルタ50とピンホール板51とを介してフォトマル52に入射する。
フォトダイオード46は、入射された前方散乱光をその強度に応じた電気的な情報に変換して前方散乱光強度として出力する。フォトマル49は、入射された側方散乱光をその強度に応じた電気的な情報に変換して側方散乱光強度として出力する。フォトマル52は、入射された側方蛍光をその強度に応じた電気的な情報に変換して側方蛍光強度として出力する。
フォトダイオード46から出力される前方散乱光強度と、フォトマル49から出力される側方散乱光強度と、フォトマル52から出力される側方蛍光強度とは、それぞれアンプ53,54,55によって増幅され、本体側制御部26に入力される。
Fluorescence (side fluorescence) emitted from the measurement sample flowing through the
The
The forward scattered light intensity output from the
図1〜図10を参照して、本実施形態の試料分析装置の動作について説明する。
使用者が本体側入力部12または端末側入力部18を操作して、分析動作開始の指示をすると、選択されているモードに応じて試料吸引部14aまたは14bが血液の吸引を行い、試料調製部16が、所定の測定用試料を作成し、検出部19の各検出部に供給する。そして、光学系検出部20は光学情報として散乱光強度および蛍光強度を本体側制御部26に出力する。電気系検出部22は、電気情報を本体側制御部26に出力する。吸光度検出部24は、透過光強度を本体側制御部26に出力する。本体側制御部26は、検出部19から出力された情報を解析して、種々の測定項目についての分析結果を得る。そして、本体側制御部26は、分析結果のうち所定の項目を本体側表示部11に表示させるとともに、分析結果の全てをデータ処理端末2に送信する。そして、データ処理端末2の端末側制御部34は、送信された分析結果を端末側表示部16に表示させる。
With reference to FIGS. 1-10, operation | movement of the sample analyzer of this embodiment is demonstrated.
When the user operates the main body
以下、光学系検出部20を使用して網状赤血球(RET)および成熟赤血球の分析を行う動作についてさらに詳しく説明する。
網状赤血球および成熟赤血球の分析を行う場合、試料調製部16は、試料吸引部14aまたは14bによって吸引された血液を約200倍に希釈し、所定の染色液で染色する。このようにして調製された測定用試料は、光学系検出部20に供給される。そして、光学系検出部20は、測定用試料に光を照射して、前方散乱光強度、側方散乱光強度、および、側方蛍光強度を本体側制御部26に出力する。本体側制御部26は、光学系検出部20から出力された情報のうち、前方散乱光強度および側方蛍光強度を使用して網状赤血球および成熟赤血球についての分析を行う。なお、試料の調製に使用される試薬としては、米国特許第5,821,127号明細書に記載されている試薬を使用することができる。
Hereinafter, the operation of analyzing reticulocytes (RET) and mature erythrocytes using the optical
When analyzing reticulocytes and mature erythrocytes, the
図4は、光学系検出部20から光学情報を出力された本体側制御部26が、網状赤血球および成熟赤血球を分析する処理を示すフローチャートである。
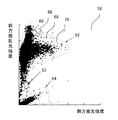
光学系検出部20から前方散乱光強度、側方散乱光強度、および、側方蛍光強度が本体側制御部26に入力されると、本体側制御部26は、前方散乱光強度と側方蛍光強度とを所定期間取得し、記憶する(ステップS1)。
次に、本体側制御部26は、記憶した前方散乱光強度と側方蛍光強度とから、前方散乱光強度を縦軸、側方蛍光強度を横軸とする2次元分布図(スキャッタグラム)を作成し、記憶する(ステップS2)。本体側制御部26に記憶されたスキャッタグラム58を図5に示す。
FIG. 4 is a flowchart showing a process in which the main body
When the forward scattered light intensity, the side scattered light intensity, and the side fluorescent light intensity are input from the optical
Next, the main body
次に、本体側制御部26は、図6に示すように、作成されたスキャッタグラムについて、成熟赤血球領域60、網状赤血球領域62、破砕赤血球領域63、および、血小板領域64の各細胞群を作成し、記憶する(ステップS3)。
成熟赤血球領域60、網状赤血球領域62、および、血小板領域64の作成は、米国特許第5,006,986号明細書および米国特許第5,117,357号明細書記載の方法に従って行うことができる。成熟赤血球は細胞内にRNAを含有しないので、得られる側方蛍光強度は非常に小さい。網状赤血球は、細胞内にRNAを含有するので、比較的大きい側方蛍光強度が得られる。上記方法は、このことを利用して、所定量以上の側方蛍光強度を発する細胞を網状赤血球に分類する方法である。一方、細胞に光を照射して得られる散乱光強度は、細胞の大きさを反映する。血小板は、成熟赤血球や網状赤血球より小さいので、血小板を成熟赤血球および網状赤血球から分類することができる。
Next, as shown in FIG. 6, the main body
The generation of the
破砕赤血球領域63の作成は、米国特許公開公報第2001−53551号明細書記載の方法に従って行うことができる。
次に、本体側制御部26は、図7に示すように、網状赤血球領域62を、側方蛍光強度に応じて3等分してLFR領域66、MFR領域68、および、HFR領域70を作成し、記憶する(ステップS4)。
ここで、側方蛍光強度が大きい細胞ほど含有しているRNA量が多い細胞であることから、側方蛍光強度が大きい網状赤血球ほど幼若な網状赤血球であると言える。すなわち、HFR領域70に属する網状赤血球は、MFR領域68に属する網状赤血球より幼若であり、MFR領域68に属する網状赤血球は、LFR領域66に属する網状赤血球より幼若であると言える。
Creation of the disrupted red
Next, as shown in FIG. 7, the main body
Here, since cells with higher side fluorescence intensity contain more RNA, it can be said that reticulocytes with higher side fluorescence intensity are younger reticulocytes. That is, reticulocytes belonging to the
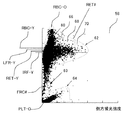
次に、本体側制御部26は、細胞群散乱光情報として、RET−YとRBC−Yを算出し、記憶する(ステップS5)。
図8に示すように、RET−Yは、網状赤血球領域62に含まれる全ての細胞(すなわち網状赤血球)の前方散乱光強度の平均値である。
RBC−Yは、成熟赤血球領域60に含まれる全ての細胞(すなわち成熟赤血球)の前方散乱光強度の平均値である。
次に、本体側制御部26は、IRF−YとLFR−Yを算出し、記憶する(ステップ6)。
Next, the main body
As shown in FIG. 8, RET-Y is an average value of the forward scattered light intensity of all cells (that is, reticulocytes) included in the
RBC-Y is an average value of the forward scattered light intensity of all cells (ie, mature erythrocytes) included in the
Next, the main body
図8に示すように、IRF−Yは、MFR領域68とHFR領域70とに含まれる全ての細胞(すなわち幼若な網状赤血球)の前方散乱光強度の平均値である。
LFR−Yは、LFR領域66に含まれる全ての細胞(すなわち成熟赤血球に近い網状赤血球)の前方散乱光強度の平均値である。
次に、本体側制御部26は、成熟赤血球領域60に含まれる細胞数(成熟赤血球数)RBC−Oと、網状赤血球領域62に含まれる細胞数(網状赤血球数)RET#と、網状赤血球領域62に含まれる細胞数(網状赤血球数)の全赤血球数に対する割合RET%と、血小板領域64に含まれる細胞数(血小板数)RLT−Oと、破砕赤血球領域63に含まれる細胞数(破砕赤血球数)FRC#と、破砕赤血球領域63に含まれる細胞数(破砕赤血球数)の全赤血球数に対する割合FRC%とを算出し、記憶する(ステップS7)。
As shown in FIG. 8, IRF-Y is an average value of the forward scattered light intensity of all cells (that is, young reticulocytes) included in the
LFR-Y is an average value of the forward scattered light intensity of all the cells included in the LFR region 66 (that is, reticulocytes close to mature erythrocytes).
Next, the main body
次に、本体側制御部26は、ステップS5で記憶したRET−YおよびRBC−Yの算出結果からそれぞれ、内容量相当値としてRET−HeおよびRBC−Heを算出し、記憶する(ステップS8)。
RET−Heは、本体側制御部26に記憶されている以下の式を使用して算出される。RET−Heは、網状赤血球に含まれるヘモグロビンの量に相当する。
<式2>
RET−He=A×exp(B×RET−Y)
(但し、A=5.8439、B=0.0098)
Next, the main body
RET-He is calculated using the following equation stored in the main
<
RET-He = A × exp (B × RET-Y)
(However, A = 5.8439, B = 0.0098)
RBC−Heは、本体側制御部26に記憶されている以下の式を使用して算出される。RBC−Heは、成熟赤血球に含まれるヘモグロビンの量、すなわち、MCH(平均赤血球血色素量)に相当する。
<式3>
RBC−He=C×exp(D×RBC−Y)
(但し、C=5.8439、D=0.0098)
RBC-He is calculated using the following equation stored in the main body
<
RBC-He = C × exp (D × RBC-Y)
(However, C = 5.8439, D = 0.0098)
次に、本体側制御部26は、ステップS8で記憶したRET−HeおよびRBC−Heの算出結果からDelta−Heを算出し、記憶する(ステップS9)。
Delta−Heは、RET−HeからRBC−Heを引くことによって算出される。
次に、本体側制御部26は、ステップS1〜S9で記憶したデータの全てをデータ処理端末2の端末側制御部34に送信する(ステップS10)。
そして、本体側制御部26は、網状赤血球および成熟赤血球の分析制御ルーチンを終了し、他の測定項目についての分析制御を開始する。
Next, the main
Delta-He is calculated by subtracting RBC-He from RET-He.
Next, the main body
And the main body
なお、式2および式3は、以下の方法で決定されたものである。
式3は、あらかじめ複数の検体を分析して成熟赤血球の前方散乱光強度(RBC−Y)とMCH(平均赤血球血色素量)とを取得し、それらの分析結果を2次元分布図にプロットし、RBC−YとMCHの関係を示す式を求めることによって得られたものである。
図11を使用して式3の求め方を具体的に説明する。
図11は、式3の決定のために使用される2次元分布図を示す図である。
まず、約500個の検体を光学系検出部20を使用して分析し、RBC−Yを取得した。
また、同じ約500個の検体について、電気系検出部22を使用してRBC数(以下、RBCという)を取得し、吸光度検出部24を使用してHGB濃度(以下、HGBという)を取得した。
そして、得られたRBCとHGBから、以下の式4を使用してMCHを算出した。
<式4>
MCH=(HGB/RBC)×1000
The method for obtaining
FIG. 11 is a diagram showing a two-dimensional distribution chart used for the determination of
First, about 500 specimens were analyzed using the optical
For the same approximately 500 samples, the RBC number (hereinafter referred to as RBC) was acquired using the electrical detection unit 22, and the HGB concentration (hereinafter referred to as HGB) was acquired using the absorbance detection unit 24. .
And MCH was computed using the following formula |
<
MCH = (HGB / RBC) × 1000
そして、上記の約500個の検体についての分析結果をプロットして、縦軸をMCH、横軸をRBC−Yとする2次元分布図160(図11参照)を作成した。
そして、2次元分布図160の分布の状態から、RBC−YとMCHの関係を示す式として曲線162で表される式を算出した。この式が上述の式3である。
式2は、以下のように決定された。
RBC−Yは、成熟赤血球の前方散乱光強度の平均値であり、MCHは成熟赤血球に含まれるヘモグロビン量である。一方、RET−Yは、網状赤血球の前方散乱光強度の平均値であるから、式3を使用したRBC−Heの算出と同様の演算をすれば、網状赤血球に含まれるヘモグロビン量に相当する値が得られる。このことから、RET−Heを算出するための式2として式3と同じ形式の式を用いた。なお、MCHは、本来、赤血球(成熟赤血球と網状赤血球とを含む)に含まれるヘモグロビン量であるが、抹消血液中に含まれる成熟赤血球の数は、網状赤血球の数より十分に多いため、MCHは成熟赤血球に含まれるヘモグロビン量と考えて差し支えない。
なお、上記実施形態では、式2を上述の方法で決定したが、あらかじめ複数の検体を分析して網状赤血球の前方散乱光強度(RET−Y)と網状赤血球に含まれるヘモグロビン量とを取得し、それらの分析結果を2次元分布図にプロットし、2次元分布図の分布状態からRBC−Yと網状赤血球に含まれるヘモグロビン量との関係を示す式を求めることによって決定してもよい。網状赤血球に含まれるヘモグロビン量は、例えばADVIA120(Bayer Diagnostics製)を用いて取得することができる。
Then, the analysis results of the above about 500 specimens were plotted, and a two-dimensional distribution map 160 (see FIG. 11) with MCH on the vertical axis and RBC-Y on the horizontal axis was created.
Then, from the distribution state of the two-
RBC-Y is an average value of the forward scattered light intensity of mature erythrocytes, and MCH is the amount of hemoglobin contained in mature erythrocytes. On the other hand, since RET-Y is an average value of the forward scattered light intensity of reticulocytes, a value corresponding to the amount of hemoglobin contained in reticulocytes is obtained by performing the same calculation as the calculation of RBC-
In the above embodiment,
図9および図10を使用して、本体側制御部26が全ての測定項目についての分析制御を終了した後に端末側表示部16に表示される画面について説明する。
図9および図10は、本体側制御部26による試料の分析が全て終了すると端末側表示部16に表示される分析結果画面71を示しており、図9は、メイン画面が選択された場合、図10は、リサーチ(RBC系)画面が選択された場合を示している。
分析結果画面71は、検体情報表示部72および分析結果表示部74を含む。
検体情報表示部72は、分析した検体(血液)の検体番号が表示される検体番号表示部102、分析した検体を採取した患者の識別番号が表示される患者ID表示部103、上記患者の名前が表示される患者名表示部104、上記患者の誕生日が表示される誕生日表示部105、上記患者の性別が表示される性別表示部106、上記患者が入院している病棟が表示される病棟表示部107、上記患者の担当医が表示される担当医表示部108、任意のコメントが表示されるコメント表示部109、検体を分析した年月日が表示される測定年月日表示部110、および、検体を分析した時刻が表示される測定時刻表示部111を含む。
The screen displayed on the terminal
9 and 10 show an
The
The sample
分析結果表示部74は、タグ表示部76を含み、タグ表示部76の下には選択されたタグに対応する画面が表示される。
タグ表示部76は、主要な分析結果を表示させるためのメインタグ114、得られた分析結果の全てを表示させるためのグラフタグ116、白血球に関する分析結果を表示させるためのWBCタグ118、赤血球に関する分析結果を表示させるためのRBCタグ120、上記患者から採取した検体の分析結果を時系列に表示させるための時系列タグ122、検体の陽性または陰性の度合を表示させるためのQ−Flagタグ124、所定のサービスデータを表示させるためのサービスタグ126、電気系検出部22に含まれるRF/DC検出器から出力される電気情報を解析して得られるHPC数を表示するためのHPCタグ128、白血球に関するリサーチ項目を表示させるためのリサーチ(WBC系)タグ130、および、赤血球に関するリサーチ項目を表示させるためのリサーチ(RBC系)タグ132を含む。
The analysis
The
図9に示す画面では、メインタグ114が選択されているので、主要な分析結果を示すメイン画面101が表示されている。メイン画面101は、分析データ表示部78a、78b、および、フラグ表示部80を含む。
分析データ表示部78aおよび78bは、項目欄136、データ欄138、単位欄140、および、正常範囲欄142を含む。
項目欄136には、測定項目(分析項目)が表示され、データ欄138には、分析結果が表示され、単位欄140には、データ欄138に表示されている分析結果の単位が表示され、正常範囲欄142には、分析された検体が正常範囲に対してどの位置にあるかが表示される。
In the screen shown in FIG. 9, since the
The analysis
Measurement items (analysis items) are displayed in the
分析データ表示部78aおよび78bに表示されている測定項目のうち、WBC,RET%,RET#,IRF,LFR,MFR,HFR,RET−He,NRBC#,NRBC%,NEUT#,LYMPH#,MONO#,EO#,BASO#、NEUT%,LYMPH%,MONO%,EO%,および、BASO%は、光学系検出部20を使用して算出されたものであり、RBC,HCT,MCV,PLT,RDW−SD,RDW−CV,PDW,MPV,および、P−LCRは電気系検出部22を使用して算出されたものであり、HGBは吸光度検出部24を使用して算出されたものであり、MCHおよびMCHCは電気系検出部22および吸光度検出部24を使用して算出されたものであり、PLTは、光学系検出部20または電気系検出部22を使用して算出されたものである。
Of the measurement items displayed in the analysis
フラグ表示部80は、WBCに関するフラグ(分析結果が正常でないことを示すメッセージ)を表示するWBCフラグ表示部144、RBCおよびRETに関するフラグを表示するRBC/RETフラグ表示部146、およびPLTに関するフラグを表示するPLTフラグ表示部148を含む。図9に示す画面においては、これらのフラグ表示部にはフラグは表示されていない。
図10に示す画面では、リサーチ(RBC系)タグ132が選択されているので、赤血球に関するリサーチ項目を含む画面として、リサーチ(RBC系)画面151が表示されている。
リサーチ(RBC系)画面151は、分析データ表示部82a、82b、82c、フラグ表示部86、および、スキャッタグラム/粒度分布図表示部88を含む。
分析データ表示部82a、82b、および82cには、測定項目(分析項目)、分析結果およびその単位が表示される。
The
In the screen shown in FIG. 10, since the research (RBC system)
The research (RBC system)
The analysis
分析データ表示部82a、82b、および82cには、メイン画面101に表示される測定項目のうち赤血球に関する項目と、RBC−O、PLT−I,PLT−O,RBC−He、D−He,RET−Y,RBC−Y,IRF−Y,RPI,FRC#、およびFRC%が表示される。
RBC−Oは、前述のように、成熟赤血球領域60に含まれる細胞数であり、成熟赤血球の数に相当する量である。本実施形態の試料分析装置は、電気系検出部22を使用して赤血球数RBCを算出しており、2つの測定原理で同じ測定項目を分析することによって、分析結果に対する信頼性を向上させている。
RBC−Heは、前述のように、成熟赤血球に含まれるヘモグロビンの量、すなわち、MCH(平均赤血球血色素量)に相当する値である。本実施形態の試料分析装置は、電気系検出部22および吸光度検出部24を使用してMCHを算出しており、2つの測定原理で同じ測定項目を分析することによって、分析結果に対する信頼性を向上させている。
Among the measurement items displayed on the
As described above, RBC-O is the number of cells contained in the
As described above, RBC-He is a value corresponding to the amount of hemoglobin contained in mature erythrocytes, that is, MCH (average erythrocyte hemoglobin amount). The sample analyzer of the present embodiment calculates the MCH using the electric system detection unit 22 and the absorbance detection unit 24, and analyzes the same measurement item by two measurement principles, thereby improving the reliability of the analysis result. It is improving.
PLT−Iは、電気系検出部22を使用して算出された血小板数であり、PLT−Oは、血小板領域64に含まれる細胞数である。本実施形態の試料分析装置は、PLT−IとPLT−Oのうち、より信頼性の高い値を血小板数PLTとすることによって、分析結果に対する信頼性を向上させている。
D−Heは前述したDelta−Heを意味する。
RET−Heは、前述のように、網状赤血球に含まれるヘモグロビン量に相当する値であるので、重さを示す単位であるpgが付けられている。これによって使用者は、RET−Heが量に関連する値であることを容易に理解することができる。
PLT-I is the number of platelets calculated using the electric system detection unit 22, and PLT-O is the number of cells included in the
D-He means Delta-He mentioned above.
Since RET-He is a value corresponding to the amount of hemoglobin contained in reticulocytes as described above, pg, which is a unit indicating weight, is attached. This allows the user to easily understand that RET-He is a value related to the quantity.
同様に、RBC−Heは、赤血球に含まれるヘモグロビン量に相当する値であるので、重さを示す単位であるpgが付けられている。これによって使用者は、RBC−Heが量に関連する値であることを容易に理解することができる。
RPIは、RET%とHCTの分析結果(この例では、0.75%と42.4%)から算出される値であり、赤血球の産生状態の評価に有用である。
スキャッタグラム/粒度分布図表示部88は、スキャッタグラム90,92,94,96、粒度分布図98、および100を含む。
Similarly, since RBC-He is a value corresponding to the amount of hemoglobin contained in red blood cells, pg, which is a unit indicating weight, is attached. This allows the user to easily understand that RBC-He is a quantity related value.
RPI is a value calculated from the analysis results of RET% and HCT (in this example, 0.75% and 42.4%), and is useful for evaluating the production state of red blood cells.
Scattergram / particle size distribution
スキャッタグラム90は、図5に示したスキャッタグラム58のうち側方蛍光強度が小さい領域のみを拡大して表示したものである。
スキャッタグラム92は、図5に示したスキャッタグラム58を表示したものである。
スキャッタグラム94は、図5に示したスキャッタグラム58の血小板領域64付近を拡大して表示したものである。
スキャッタグラム96は、NRBC#およびNRBC%を算出するために、網状赤血球および成熟赤血球を分析するための測定用試料とは異なる測定用試料を使用して作成したスキャッタグラムである。
The
The
The
The
粒度分布図98は、電気系検出部22を使用して作成された赤血球の粒度分布を示す粒度分布図である。
粒度分布図100は、電気系検出部22を使用して作成された血小板の粒度分布を示す粒度分布図である。
上述のRBCやPLT−Iは、これらの粒度分布図を分析することによって得られる分析結果である。
The particle size distribution diagram 98 is a particle size distribution diagram showing the particle size distribution of red blood cells created using the electric system detector 22.
The particle size distribution diagram 100 is a particle size distribution diagram showing the particle size distribution of platelets created using the electric system detection unit 22.
The above RBC and PLT-I are analysis results obtained by analyzing these particle size distribution diagrams.
図9および図10に示したように、メイン画面101には内容量相当値であるRET-Heは表示されているが、網状赤血球の前方散乱光強度の平均値であるRET-Yは表示されていない。一方、リサーチ(RBC系)画面151には、RET-HeとともにRET-Yも表示されている。これによって、使用者は、メイン画面101を使用すれば主要な項目についての分析結果を迅速に知ることができ、リサーチ(RBC系)画面151を使用すれば赤血球に関する詳細な項目についての分析結果についても知ることができるので、便利である。さらに、これらの画面はタグを使用して容易に切り替え可能である。
As shown in FIG. 9 and FIG. 10, the
網状赤血球に含まれるヘモグロビン量を分析することの臨床的意義について説明する。
代表的な貧血として、鉄欠乏性貧血と慢性疾患に合併する貧血(anemia of chronic disorder: ACD)が挙げられる。鉄欠乏性貧血の治療においては、鉄剤の投与が非常に有効であるが、ACDの治療においては、鉄剤の投与は有効でない場合もある。
従って、貧血の治療にあたっては、鉄欠乏製貧血とACDとの鑑別が必要になる。この鑑別のためには、血液中の鉄量の変化(鉄動態)を把握することが有効である。鉄動態を把握する検査には、血清鉄、血清フェリチン、可溶性トランスフェリン受容体(sTfR)などの検査が挙げられるが、これらの検査は感度が不十分であるとともに、費用が多くかかる。
The clinical significance of analyzing the amount of hemoglobin contained in reticulocytes will be described.
Typical anemia includes iron deficiency anemia and anemia associated with chronic diseases (anemia of chronic disorder: ACD). In the treatment of iron deficiency anemia, administration of iron is very effective, but in the treatment of ACD, administration of iron may not be effective.
Therefore, in the treatment of anemia, it is necessary to distinguish between iron deficiency anemia and ACD. For this discrimination, it is effective to grasp the change in iron content in blood (iron dynamics). Tests for determining iron dynamics include tests for serum iron, serum ferritin, soluble transferrin receptor (sTfR), etc., but these tests are insensitive and costly.
一方、網状赤血球に含まれるヘモグロビン量は、新規に産生される網状赤血球の鉄含有量を反映するものであるため、この量を分析することは鉄動態の把握に有効である。
本実施形態の試料分析装置を使用してRET−Heを出力すれば、網状赤血球に含まれるヘモグロビン量に相当する値が得られ、低コストで、しかも迅速に鉄動態を把握することができ、貧血の鑑別に有効である。
On the other hand, since the amount of hemoglobin contained in reticulocytes reflects the iron content of newly produced reticulocytes, analysis of this amount is effective for grasping iron dynamics.
If RET-He is output using the sample analyzer of this embodiment, a value corresponding to the amount of hemoglobin contained in the reticulocytes can be obtained, and the iron dynamics can be grasped quickly at low cost. Effective for differentiation of anemia.
さらに近年、腎性貧血の治療法として、遺伝子組み替えヒトエリストポエチン(rHuEPO)の投与が普及している。腎性貧血は、腎臓でのエリスロポエチン(EPO)の産生・分泌が低下することが原因となる疾患である。
腎性貧血の治療において、rHuEPOを投与したにも係わらず改善が認められないことがしばしば起こる。その原因として最も多いのは、rHuEPOの投与により機能性鉄欠乏状態となる場合が挙げられる。この場合には、rHuEPOの投与に加えて鉄剤を投与する必要がある。
Furthermore, in recent years, administration of genetically modified human erythropoietin (rHuEPO) has become widespread as a treatment method for renal anemia. Renal anemia is a disease caused by decreased production and secretion of erythropoietin (EPO) in the kidney.
In the treatment of renal anemia, it often happens that no improvement is observed despite the administration of rHuEPO. The most frequent cause is the case where functional iron deficiency is caused by administration of rHuEPO. In this case, it is necessary to administer an iron agent in addition to rHuEPO.
従って、腎性貧血の治療においても、鉄動態を把握することが重要であり、網状赤血球に含まれるヘモグロビン量を分析することは有効である。
この場合にも、本実施形態の試料分析装置を使用してRET−Heを出力すれば、網状赤血球に含まれるヘモグロビン量に相当する値が得られ、低コストで、しかも迅速に鉄動態を把握することができ、腎性貧血の治療に有効である。
また、本実施形態の試料分析装置が算出したDelta−Heは、赤血球の産生状態を評価する指標として使用でき、上記の貧血の鑑別や治療に有効である。
Therefore, it is important to understand iron dynamics in the treatment of renal anemia, and it is effective to analyze the amount of hemoglobin contained in reticulocytes.
Also in this case, if RET-He is output using the sample analyzer of this embodiment, a value corresponding to the amount of hemoglobin contained in the reticulocyte can be obtained, and the iron dynamics can be grasped quickly and at low cost. Effective in the treatment of renal anemia.
Moreover, Delta-He calculated by the sample analyzer of the present embodiment can be used as an index for evaluating the production state of erythrocytes, and is effective for the above-mentioned anemia discrimination and treatment.
なお、上記実施形態の試料分析装置においては、ステップS6(図4参照)で算出したLFR−Yを端末側表示部16に表示させていないが、これを表示させてもよい。LFR−Yは、成熟赤血球への分化段階にある網状赤血球のサイズおよびヘモグロビン含有量を反映する値として利用できる。なお、IRF−Yは、幼若な網状赤血球のサイズおよびヘモグロビン含有量を反映する値として利用できる。従って、これらの値も貧血の鑑別および治療に有効である。
In the sample analyzer of the above embodiment, the LFR-Y calculated in step S6 (see FIG. 4) is not displayed on the terminal
上記実施形態の試料分析装置においては、本体側制御部26がRET−YとRBC−Yの比を算出し、これを端末側表示部16に表示させてもよい。RET−YとRBC−Yの比は、赤血球の算出状態を評価する指標として使用でき、貧血の鑑別や治療に有効である。
上記実施形態の試料分析装置においては、散乱光情報を使用して網状赤血球および成熟赤血球の内容物に相当する値を算出したが、他の細胞、例えばリンパ球や単球の内容物に相当する値を算出して出力してもよい。
上記実施形態の試料分析装置においては、本体側制御部26が分析結果を算出し、端末側表示部16が分析結果の全てを表示する構成であるが、本体側表示部11が分析結果の全てを表示してもよいし、端末側制御部34が分析結果を算出してもよい。
In the sample analyzer of the above embodiment, the main body
In the sample analyzer of the above embodiment, the values corresponding to the contents of reticulocytes and mature erythrocytes are calculated using scattered light information, but they correspond to the contents of other cells such as lymphocytes and monocytes. A value may be calculated and output.
In the sample analyzer of the above embodiment, the main body
上記実施形態の試料分析装置においては、細胞群散乱光情報として、網状赤血球の前方散乱光強度の平均値や成熟赤血球の前方散乱光強度の平均値を用いているが、これらの前方散乱光強度の重心値や最頻値を用いてもよい。
上記実施形態の試料分析装置においては、前方散乱光強度と側方蛍光強度とからスキャッタグラムを作成しているが、2種類の散乱光強度からスキャッタグラムを作成してもよいし、散乱光強度と電気情報(電気的強度)とからスキャッタグラムを作成してもよい。
In the sample analyzer of the above embodiment, the average value of the forward scattered light intensity of reticulocytes and the average value of the forward scattered light intensity of mature erythrocytes is used as the cell group scattered light information. Centroid value or mode value may be used.
In the sample analyzer of the above embodiment, a scattergram is created from the forward scattered light intensity and the side fluorescence intensity, but a scattergram may be created from two types of scattered light intensities, or the scattered light intensity. A scattergram may be created from the electrical information (electrical strength).
本発明の試料分析装置は、必ずしも装置本体1とデータ処理端末2とを含む構成とする必要はなく、データ処理端末2の機能が装置本体1に組み込まれた試料分析装置に本発明を適用してもよい。
上記発明の試料分析装置を、尿分析装置などの他の試料分析装置に適用してもよい。
上記実施形態においては、試料分析装置に本発明を適用したが、試料分析装置を制御するためのプログラムに本発明を適用してもよい。また、前記プログラムを記録したコンピュータ読取可能な記録媒体に本発明を適用してもよい。
The sample analyzer of the present invention is not necessarily configured to include the apparatus
The sample analyzer of the above invention may be applied to other sample analyzers such as a urine analyzer.
In the above embodiment, the present invention is applied to the sample analyzer. However, the present invention may be applied to a program for controlling the sample analyzer. Further, the present invention may be applied to a computer-readable recording medium that records the program.
1 装置本体
2 データ処理端末
3 ページプリンタ
4 カラーグラフィックプリンタ
5 空圧源
6 サンプラ部
7 データプリンタ
10 試料分析装置
11 本体側表示部
12 本体側入力部
14a、14b 試料吸引部
15 端末本体
16 端末側表示部
18 端末側入力部
19 検出部
20 光学系検出部
22 電気系検出部
24 吸光度検出部
26 本体側制御部
28 本体側入力部
30 本体側表示部
32a 出入力インターフェイス
32b 出入力インターフェイス
33 通信ケーブル
34 端末側制御部
DESCRIPTION OF
Claims (10)
前記検出部によって取得された散乱光情報に基づいて網状赤血球からなる群を含む細胞群を作成する細胞群作成手段と、
網状赤血球からなる細胞群に含まれる各網状赤血球の散乱光強度の平均値を取得する平均値取得手段と、
前記平均値取得手段が取得した平均値に基づいて網状赤血球のヘモグロビン含有量に相当する値である内容量相当値を算出する算出手段と、
前記算出手段によって算出された前記内容量相当値を出力する出力手段と、を備える試料分析装置。 A detection unit that irradiates light on a biological sample and acquires scattered light information from cells contained in the biological sample;
A cell group creating means for creating a cell group including a group consisting of reticulocytes based on the scattered light information acquired by the detection unit;
Average value acquisition means for acquiring an average value of scattered light intensity of each reticulocyte contained in a cell group consisting of reticulocytes ,
Calculating means for calculating an internal volume equivalent value that is a value corresponding to the hemoglobin content of reticulocytes based on the average value acquired by the average value acquiring means;
Sample analyzer and an output means for outputting the contents quantity equivalent value calculated by said calculating means.
前記検出部によって取得された散乱光情報に基づいて成熟赤血球からなる群を含む細胞群を作成する細胞群作成手段と、
成熟赤血球からなる細胞群に含まれる各成熟赤血球の散乱光強度の平均値を取得する平均値取得手段と、
前記平均値取得手段が取得した平均値に基づいて成熟赤血球からなる細胞群に含まれる成熟赤血球のヘモグロビン含有量に相当する値である内容量相当値を算出する算出手段と、
前記算出手段によって算出された前記内容量相当値を出力する出力手段と、を備える試料分析装置。 A detection unit that irradiates light on a biological sample and acquires scattered light information from cells contained in the biological sample;
A cell group creating means for creating a cell group containing a group of mature red blood cells based on the scattered light information acquired by the detection unit;
Mean value acquisition means for acquiring an average value of scattered light intensity of each mature red blood cell contained in a cell group consisting of mature red blood cells,
A calculation means for calculating a content equivalent value that is a value corresponding to the hemoglobin content of mature erythrocytes contained in a cell group consisting of mature erythrocytes based on the average value acquired by the average value acquisition means;
A sample analyzer comprising: output means for outputting the internal volume equivalent value calculated by the calculation means .
前記細胞群作成手段は、前記散乱光情報および前記蛍光情報に基づいて前記細胞群を作成する請求項1〜4のいずれか1項に記載の試料分析装置。 The detection unit further acquires fluorescence information from the cells,
The sample analysis apparatus according to any one of claims 1 to 4, wherein the cell group creating unit creates the cell group based on the scattered light information and the fluorescence information.
情報取得手段が、前記生体試料に光を照射して前記生体試料に含まれる各細胞から取得された散乱光情報を取得するステップと、
細胞群作成手段が、前記散乱光情報に基づいて網状赤血球からなる群を含む細胞群を作成するステップと、
平均値取得手段が、網状赤血球からなる細胞群に含まれる各網状赤血球の散乱光強度の平均値を取得するステップと、
算出手段が、平均値取得手段によって取得された平均値に基づいて網状赤血球からなる細胞群に含まれる網状赤血球のヘモグロビン量に相当する値である内容量相当値を算出するステップと、
出力手段が、前記算出手段によって算出された前記内容量相当値を出力するステップと、を備えた試料分析方法を実行するためのプログラム。 A program for executing a method for analyzing a biological sample,
An information acquisition means for irradiating the biological sample with light to acquire scattered light information acquired from each cell included in the biological sample;
A cell group creating means creating a cell group including a group of reticulocytes based on the scattered light information;
An average value obtaining means obtaining an average value of scattered light intensity of each reticulocyte contained in a cell group composed of reticulocytes ; and
A step of calculating a content equivalent value that is a value corresponding to the amount of hemoglobin of reticulocytes contained in a cell group consisting of reticulocytes based on the average value acquired by the average value acquisition means;
Output means, a program for executing a sample analysis method and a step of outputting the contents quantity equivalent value calculated by said calculating means.
情報取得手段が、前記生体試料に光を照射して前記生体試料に含まれる各細胞から取得された散乱光情報を取得するステップと、An information acquisition means for irradiating the biological sample with light to acquire scattered light information acquired from each cell included in the biological sample;
細胞群作成手段が、前記散乱光情報に基づいて成熟赤血球からなる群を含む細胞群を作成するステップと、A step of creating a cell group including a group of mature erythrocytes based on the scattered light information;
平均値取得手段が、成熟赤血球からなる細胞群に含まれる各成熟赤血球の散乱光強度の平均値を取得するステップと、An average value obtaining means obtaining an average value of scattered light intensity of each mature red blood cell contained in a cell group consisting of mature red blood cells;
算出手段が、平均値取得手段によって取得された平均値に基づいて成熟赤血球からなる細胞群に含まれる成熟赤血球のヘモグロビン量に相当する値である内容量相当値を算出するステップと、A step of calculating a content equivalent value that is a value corresponding to the amount of hemoglobin of mature erythrocytes contained in a cell group consisting of mature erythrocytes based on the average value acquired by the average value acquisition means;
出力手段が、前記算出手段によって算出された前記内容量相当値を出力するステップと、を備えた試料分析方法を実行するためのプログラム。A program for executing a sample analysis method, comprising: an output unit outputting the internal volume equivalent value calculated by the calculation unit.
Priority Applications (5)
| Application Number | Priority Date | Filing Date | Title |
|---|---|---|---|
| JP2004069098A JP4417143B2 (en) | 2004-03-11 | 2004-03-11 | SAMPLE ANALYZER, PROGRAM, AND RECORDING MEDIUM CONTAINING THE PROGRAM |
| EP05005237.2A EP1574839B1 (en) | 2004-03-11 | 2005-03-10 | Sample analyzer and computer program product |
| US11/076,048 US7283217B2 (en) | 2004-03-11 | 2005-03-10 | Sample analyzer and computer product |
| US11/844,522 US7450223B2 (en) | 2004-03-11 | 2007-08-24 | Sample analyzer |
| US12/204,736 US7633604B2 (en) | 2004-03-11 | 2008-09-04 | Sample analyzer and computer program product |
Applications Claiming Priority (1)
| Application Number | Priority Date | Filing Date | Title |
|---|---|---|---|
| JP2004069098A JP4417143B2 (en) | 2004-03-11 | 2004-03-11 | SAMPLE ANALYZER, PROGRAM, AND RECORDING MEDIUM CONTAINING THE PROGRAM |
Related Child Applications (1)
| Application Number | Title | Priority Date | Filing Date |
|---|---|---|---|
| JP2009023188A Division JP4969596B2 (en) | 2009-02-04 | 2009-02-04 | Sample analyzer, sample analysis method, and program |
Publications (3)
| Publication Number | Publication Date |
|---|---|
| JP2005257450A JP2005257450A (en) | 2005-09-22 |
| JP2005257450A5 JP2005257450A5 (en) | 2007-04-12 |
| JP4417143B2 true JP4417143B2 (en) | 2010-02-17 |
Family
ID=34824606
Family Applications (1)
| Application Number | Title | Priority Date | Filing Date |
|---|---|---|---|
| JP2004069098A Expired - Lifetime JP4417143B2 (en) | 2004-03-11 | 2004-03-11 | SAMPLE ANALYZER, PROGRAM, AND RECORDING MEDIUM CONTAINING THE PROGRAM |
Country Status (3)
| Country | Link |
|---|---|
| US (3) | US7283217B2 (en) |
| EP (1) | EP1574839B1 (en) |
| JP (1) | JP4417143B2 (en) |
Families Citing this family (44)
| Publication number | Priority date | Publication date | Assignee | Title |
|---|---|---|---|---|
| JP4417143B2 (en) * | 2004-03-11 | 2010-02-17 | シスメックス株式会社 | SAMPLE ANALYZER, PROGRAM, AND RECORDING MEDIUM CONTAINING THE PROGRAM |
| JP4964446B2 (en) * | 2005-09-14 | 2012-06-27 | シスメックス株式会社 | Analytical apparatus and sample information processing program |
| US7551279B2 (en) * | 2005-09-19 | 2009-06-23 | Jmar Technologies, Inc. | Systems and methods for detecting normal levels of bacteria in water using a multiple angle light scattering (MALS) instrument |
| US7554661B2 (en) * | 2005-09-19 | 2009-06-30 | Jmar Technologies, Inc. | Systems and methods for detection and classification of waterborne particles using a multiple angle light scattering (MALS) instrument |
| JP4976038B2 (en) * | 2006-03-29 | 2012-07-18 | シスメックス株式会社 | Method for measuring hematological samples |
| JP4759438B2 (en) * | 2006-05-17 | 2011-08-31 | シスメックス株式会社 | Urine component analyzer |
| JP5010443B2 (en) * | 2006-12-20 | 2012-08-29 | シスメックス株式会社 | Blood cell analyzer and blood cell analysis method |
| EP4151985A1 (en) * | 2007-02-01 | 2023-03-22 | Sysmex Corporation | Sample analyzer |
| JP4949898B2 (en) | 2007-03-09 | 2012-06-13 | シスメックス株式会社 | Blood cell analyzer |
| JP5025371B2 (en) * | 2007-07-31 | 2012-09-12 | シスメックス株式会社 | Blood analyzer |
| JP5244351B2 (en) * | 2007-09-13 | 2013-07-24 | シスメックス株式会社 | Sample analyzer |
| EP2037281B1 (en) | 2007-09-13 | 2018-10-10 | Sysmex Corporation | Sample analyzer |
| JP5479672B2 (en) * | 2007-09-27 | 2014-04-23 | シスメックス株式会社 | Blood or urine analyzer and data processor |
| JP5198094B2 (en) | 2008-03-07 | 2013-05-15 | シスメックス株式会社 | Analysis equipment |
| EP2098867B1 (en) | 2008-03-07 | 2019-12-11 | Sysmex Corporation | Analyzer and transportation device |
| JP5192263B2 (en) * | 2008-03-07 | 2013-05-08 | シスメックス株式会社 | Analytical apparatus and sample transport method |
| JP5166996B2 (en) * | 2008-06-30 | 2013-03-21 | シスメックス株式会社 | Analysis equipment |
| JP5289798B2 (en) * | 2008-03-07 | 2013-09-11 | シスメックス株式会社 | Analytical apparatus and sample transport method |
| JP5280882B2 (en) * | 2008-06-30 | 2013-09-04 | シスメックス株式会社 | Analysis equipment |
| EP2280278A4 (en) | 2008-05-09 | 2015-04-08 | Sysmex Corp | Blood analyzer, blood analysis method and hemolytic agent |
| US8603773B2 (en) * | 2008-09-19 | 2013-12-10 | Beckman Coulter | Method and system for analyzing a blood sample |
| JP5441466B2 (en) * | 2009-03-24 | 2014-03-12 | シスメックス株式会社 | Veterinary blood cell analyzer |
| JP5670052B2 (en) * | 2009-03-26 | 2015-02-18 | シスメックス株式会社 | Blood analyzer, blood analysis method and computer program |
| CA2759392A1 (en) | 2009-04-27 | 2010-11-04 | Abbott Laboratories | Method for discriminating red blood cells from white blood cells by using forward scattering from a laser in an automated hematology analyzer |
| JP5667353B2 (en) | 2009-09-25 | 2015-02-12 | シスメックス株式会社 | Blood cell counter, diagnosis support apparatus, diagnosis support method, and computer program |
| US8906308B2 (en) | 2010-01-15 | 2014-12-09 | Abbott Laboratories | Method for determining volume and hemoglobin content of individual red blood cells |
| US9522396B2 (en) | 2010-12-29 | 2016-12-20 | S.D. Sight Diagnostics Ltd. | Apparatus and method for automatic detection of pathogens |
| CN104094099B (en) | 2011-04-15 | 2017-05-03 | 罗氏血液诊断股份有限公司 | Measuring volume and constituents of cells |
| EP2520926B1 (en) * | 2011-05-05 | 2022-06-15 | Sysmex Corporation | Blood analyzer, blood analysis method, and computer program product |
| EP2798350B1 (en) | 2011-12-29 | 2021-07-28 | Sight Diagnostics Ltd. | Methods and systems for detecting a pathogen in a biological sample |
| EP2999988A4 (en) | 2013-05-23 | 2017-01-11 | S.D. Sight Diagnostics Ltd. | Method and system for imaging a cell sample |
| IL227276A0 (en) | 2013-07-01 | 2014-03-06 | Parasight Ltd | A method and system for preparing a monolayer of cells, particularly suitable for diagnosis |
| CN105659151B (en) | 2013-08-26 | 2018-06-29 | 思迪赛特诊断有限公司 | Digital micrograph System and method for |
| WO2016030897A1 (en) | 2014-08-27 | 2016-03-03 | S.D. Sight Diagnostics Ltd | System and method for calculating focus variation for a digital microscope |
| JP6612050B2 (en) | 2014-08-28 | 2019-11-27 | シスメックス株式会社 | Hematology analyzer, diagnosis support method, and computer program |
| CN106687810B (en) * | 2014-12-31 | 2019-10-22 | 深圳迈瑞生物医疗电子股份有限公司 | A kind of erythroblast alarm method, device and the stream type cell analyzer of non-diagnostic purpose |
| JP6952683B2 (en) | 2015-09-17 | 2021-10-20 | エス.ディー.サイト ダイアグノスティクス リミテッド | Methods and devices for detecting entities in body samples |
| JP6629429B2 (en) * | 2016-03-28 | 2020-01-15 | 富士フイルム株式会社 | Cell analysis system |
| US11733150B2 (en) | 2016-03-30 | 2023-08-22 | S.D. Sight Diagnostics Ltd. | Distinguishing between blood sample components |
| AU2017263807B2 (en) | 2016-05-11 | 2023-02-02 | S.D. Sight Diagnostics Ltd | Performing optical measurements on a sample |
| US11307196B2 (en) | 2016-05-11 | 2022-04-19 | S.D. Sight Diagnostics Ltd. | Sample carrier for optical measurements |
| WO2019097387A1 (en) | 2017-11-14 | 2019-05-23 | S.D. Sight Diagnostics Ltd | Sample carrier for optical measurements |
| CN111602046B (en) * | 2018-04-28 | 2024-01-09 | 深圳迈瑞生物医疗电子股份有限公司 | Blood analyzer and analysis method |
| CN111157508B (en) * | 2020-03-06 | 2022-09-06 | 成都博奥晶芯生物科技有限公司 | Continuous acquisition method for fluorescence data of microfluidic chip |
Family Cites Families (19)
| Publication number | Priority date | Publication date | Assignee | Title |
|---|---|---|---|---|
| US4735504A (en) * | 1983-10-31 | 1988-04-05 | Technicon Instruments Corporation | Method and apparatus for determining the volume & index of refraction of particles |
| JP2674704B2 (en) | 1988-06-07 | 1997-11-12 | 東亜医用電子株式会社 | Two-dimensional distribution fractionation method |
| JP2674705B2 (en) * | 1988-06-10 | 1997-11-12 | 東亜医用電子株式会社 | One-dimensional distribution fractionation method |
| US5488469A (en) * | 1991-08-30 | 1996-01-30 | Omron Corporation | Cell analyzing apparatus |
| US5360739A (en) | 1991-12-05 | 1994-11-01 | Miles Inc. | Methods for the identification and characterization of reticulocytes in whole blood |
| US5350695A (en) | 1991-12-05 | 1994-09-27 | Miles Inc. | Methods for the identification and characterization of reticulocytes in whole blood |
| JP3425830B2 (en) | 1995-10-06 | 2003-07-14 | シスメックス株式会社 | New compounds and their uses |
| US5872627A (en) * | 1996-07-30 | 1999-02-16 | Bayer Corporation | Method and apparatus for detecting scattered light in an analytical instrument |
| US6114173A (en) * | 1997-04-03 | 2000-09-05 | Bayer Corporation | Fully automated method and reagent composition therefor for rapid identification and characterization of reticulocytes erythrocytes and platelets in whole blood |
| JP4101994B2 (en) * | 1999-01-21 | 2008-06-18 | シスメックス株式会社 | Particle analyzer and automatic particle analysis method |
| US6228652B1 (en) * | 1999-02-16 | 2001-05-08 | Coulter International Corp. | Method and apparatus for analyzing cells in a whole blood sample |
| WO2000058727A1 (en) * | 1999-03-31 | 2000-10-05 | Bayer Corporation | Single channel, single dilution detection method |
| US6784981B1 (en) * | 2000-06-02 | 2004-08-31 | Idexx Laboratories, Inc. | Flow cytometry-based hematology system |
| JP4464534B2 (en) | 2000-06-20 | 2010-05-19 | シスメックス株式会社 | Method for measuring disrupted red blood cells |
| US7013260B2 (en) * | 2001-01-30 | 2006-03-14 | Sysmex Corporation | Display device and sample analysis device equipped with the display device |
| US6979570B2 (en) * | 2001-07-26 | 2005-12-27 | Sysmex Corporation | Particle analyzer and particle analyzing method |
| JP4751535B2 (en) * | 2001-07-26 | 2011-08-17 | シスメックス株式会社 | Fractionation method and blood analyzer using the same |
| US7405082B2 (en) * | 2002-09-10 | 2008-07-29 | Sysmex Corporation | Methods and devices for measuring reticulocytes |
| JP4417143B2 (en) * | 2004-03-11 | 2010-02-17 | シスメックス株式会社 | SAMPLE ANALYZER, PROGRAM, AND RECORDING MEDIUM CONTAINING THE PROGRAM |
-
2004
- 2004-03-11 JP JP2004069098A patent/JP4417143B2/en not_active Expired - Lifetime
-
2005
- 2005-03-10 US US11/076,048 patent/US7283217B2/en active Active
- 2005-03-10 EP EP05005237.2A patent/EP1574839B1/en active Active
-
2007
- 2007-08-24 US US11/844,522 patent/US7450223B2/en active Active
-
2008
- 2008-09-04 US US12/204,736 patent/US7633604B2/en active Active
Also Published As
| Publication number | Publication date |
|---|---|
| US20050219527A1 (en) | 2005-10-06 |
| JP2005257450A (en) | 2005-09-22 |
| US7450223B2 (en) | 2008-11-11 |
| US7633604B2 (en) | 2009-12-15 |
| EP1574839A1 (en) | 2005-09-14 |
| US20090076736A1 (en) | 2009-03-19 |
| EP1574839B1 (en) | 2020-06-10 |
| US7283217B2 (en) | 2007-10-16 |
| US20080024759A1 (en) | 2008-01-31 |
Similar Documents
| Publication | Publication Date | Title |
|---|---|---|
| JP4417143B2 (en) | SAMPLE ANALYZER, PROGRAM, AND RECORDING MEDIUM CONTAINING THE PROGRAM | |
| JP4949898B2 (en) | Blood cell analyzer | |
| US8017078B2 (en) | Blood cell analyzer, blood cell analyzing method, and computer program product | |
| JP5670052B2 (en) | Blood analyzer, blood analysis method and computer program | |
| US8808623B2 (en) | Diagnosis assisting system, diagnosis assisting information providing device and computer program product | |
| JP4679843B2 (en) | Hematology analyzer and analysis program | |
| JP4926812B2 (en) | Blood cell analyzer and body fluid analysis method | |
| JP4532592B2 (en) | Reticulocyte measurement method | |
| CN111542744B (en) | Blood analyzer, blood analysis method, and computer-readable storage medium | |
| JP4101994B2 (en) | Particle analyzer and automatic particle analysis method | |
| EP2028495A2 (en) | Sample analyzer, sample analyzing method, and computer program product | |
| JP2008209383A (en) | Sample analyzer | |
| JPH04184168A (en) | Classification of leucocyte by flow cytometry | |
| WO2021077327A1 (en) | Method for analyzing red blood cells in blood sample and blood analysis system | |
| JP2005265495A (en) | Cell analyzer and cell analyzing method | |
| JP4969596B2 (en) | Sample analyzer, sample analysis method, and program | |
| JP4474135B2 (en) | Method and apparatus for measuring reticulocyte |
Legal Events
| Date | Code | Title | Description |
|---|---|---|---|
| A521 | Request for written amendment filed |
Free format text: JAPANESE INTERMEDIATE CODE: A523 Effective date: 20070222 |
|
| A621 | Written request for application examination |
Free format text: JAPANESE INTERMEDIATE CODE: A621 Effective date: 20070222 |
|
| A977 | Report on retrieval |
Free format text: JAPANESE INTERMEDIATE CODE: A971007 Effective date: 20080619 |
|
| A131 | Notification of reasons for refusal |
Free format text: JAPANESE INTERMEDIATE CODE: A131 Effective date: 20081209 |
|
| A521 | Request for written amendment filed |
Free format text: JAPANESE INTERMEDIATE CODE: A523 Effective date: 20090204 |
|
| A131 | Notification of reasons for refusal |
Free format text: JAPANESE INTERMEDIATE CODE: A131 Effective date: 20091006 |
|
| A521 | Request for written amendment filed |
Free format text: JAPANESE INTERMEDIATE CODE: A523 Effective date: 20091015 |
|
| TRDD | Decision of grant or rejection written | ||
| A01 | Written decision to grant a patent or to grant a registration (utility model) |
Free format text: JAPANESE INTERMEDIATE CODE: A01 Effective date: 20091110 |
|
| A01 | Written decision to grant a patent or to grant a registration (utility model) |
Free format text: JAPANESE INTERMEDIATE CODE: A01 |
|
| A61 | First payment of annual fees (during grant procedure) |
Free format text: JAPANESE INTERMEDIATE CODE: A61 Effective date: 20091125 |
|
| R150 | Certificate of patent or registration of utility model |
Ref document number: 4417143 Country of ref document: JP Free format text: JAPANESE INTERMEDIATE CODE: R150 Free format text: JAPANESE INTERMEDIATE CODE: R150 |
|
| FPAY | Renewal fee payment (event date is renewal date of database) |
Free format text: PAYMENT UNTIL: 20121204 Year of fee payment: 3 |
|
| FPAY | Renewal fee payment (event date is renewal date of database) |
Free format text: PAYMENT UNTIL: 20121204 Year of fee payment: 3 |
|
| FPAY | Renewal fee payment (event date is renewal date of database) |
Free format text: PAYMENT UNTIL: 20151204 Year of fee payment: 6 |
|
| R250 | Receipt of annual fees |
Free format text: JAPANESE INTERMEDIATE CODE: R250 |
|
| R250 | Receipt of annual fees |
Free format text: JAPANESE INTERMEDIATE CODE: R250 |
|
| R250 | Receipt of annual fees |
Free format text: JAPANESE INTERMEDIATE CODE: R250 |
|
| R250 | Receipt of annual fees |
Free format text: JAPANESE INTERMEDIATE CODE: R250 |
|
| R250 | Receipt of annual fees |
Free format text: JAPANESE INTERMEDIATE CODE: R250 |
|
| R250 | Receipt of annual fees |
Free format text: JAPANESE INTERMEDIATE CODE: R250 |
|
| EXPY | Cancellation because of completion of term |