JP4371510B2 - Magnetic resonance imaging system - Google Patents
Magnetic resonance imaging system Download PDFInfo
- Publication number
- JP4371510B2 JP4371510B2 JP35736299A JP35736299A JP4371510B2 JP 4371510 B2 JP4371510 B2 JP 4371510B2 JP 35736299 A JP35736299 A JP 35736299A JP 35736299 A JP35736299 A JP 35736299A JP 4371510 B2 JP4371510 B2 JP 4371510B2
- Authority
- JP
- Japan
- Prior art keywords
- magnetic resonance
- temperature
- display
- magnetic field
- calculation
- Prior art date
- Legal status (The legal status is an assumption and is not a legal conclusion. Google has not performed a legal analysis and makes no representation as to the accuracy of the status listed.)
- Expired - Fee Related
Links
Images


Description
【0001】
【発明が属する技術分野】
本発明は磁気共鳴イメージング(以下、MRIと記述する)装置に係わり、特に、体内温度をモニターしながら処理を行うインターベンショナルに好適なMRI装置に関する。
【0002】
【従来の技術】
近年、患者にメスを入れる外科手術による治療でなく、低侵襲で同じ効果を上げる治療法が注目されている。例えば、レントゲン透視下で経皮的に針を挿入し、レーザー照射により椎間板ヘルニアの患部を蒸散させてしまう治療法である。同様にレントゲン透視下で寒剤を流し込んで患部を凍結切除するクライオサージエリー治療法もある。これらレントゲン透視下での低侵襲性の治療法はインターベンショナル治療と呼ばれ、その治療効果も満足できることから普及し始めている。
【0003】
あるいは、電磁波や赤外線を患部に照射して体内組織の一部の温度を上昇させ、熱に弱いとされる腫瘍細胞を選択的に死滅させるハイパーサーミヤーの治療法も注目されている。
【0004】
【発明が解決しようとする課題】
上述のインターベンショナル治療法はレントゲン透視下で行われるため、術者および患者のX線被曝の問題がある。また、患部の蒸散や切除がどの程度行われたか術中に評価できないことや、患部周辺の正常組織の温度変化を把握することができない問題がある。
【0005】
また、ハイパーサーミヤー治療法は正常細胞と腫瘍細胞の死滅の境界温度を極めて正確に管理する必要がある。しかし、治療中に無侵襲で体内の温度や温度分布を正確に計測する手段がなかった。
【0006】
一方、MRI法で体内組織の核磁気共鳴(以下、NMRと記述する)信号より体内の温度を知る幾つかの方法が開発されている。その方法の主なものとして、1)温度によりNMR信号の緩和時間が変化することを捉え、その変化量から温度を算出する。2)温度変化に伴って、NMR信号の共鳴周波数の変移を測定して、その変移周波数や位相変化量から温度算出する。3)NMR信号の温度に依存する拡散定数を測定して、温度を求める方法(特公平6-14911号公報)などがある。
【0007】
しかしながら、上述したインターベンショナル治療では治療部位の温度変化の計測は、形態の監視とともに行われなければならないが、上述した温度計測では形態を高い空間分解能で描出することができないため、これら温度計測は治療等の処置の進行過程を監視するのに適用されていない。画像表示手段としても、形態や機能を示すMRIの画像と、温度分布図あるいは検査部位の温度表示とを組合せて表示できるMRI装置は無かった。
【0008】
本発明は上記課題に鑑みて為されたもので、MRI撮影下で治療部位の温度をモニターしながらインターベンショナルを施行するのに好適なMRI装置を提供することを目的とする。また本発明は、治療処置の経過を判断するための断層画像と温度情報を実質的に表示することが可能なMRI装置を提供することを目的とする。さらに本発明は、治療部位の温度を示す情報を、治療を施す者が利用しやすい形で提供することができるMRI装置を提供することを目的とする。
【0009】
【課題を解決するための手段】
上記目的を達成する本発明のMRI装置は、一定の磁場強度を発生する静磁場発生手段と、磁場強度勾配を発生する傾斜磁場発生手段と、高周波磁場を発生する手段と、前記被検体からのNMR信号を検出する手段と、前記NMR信号を用いて被検体の断層画像を再構成し結果を表示する計算・表示手段と、これら各手段を制御する制御手段とを備え、前記計算・表示手段は、前記被検体の検査部位の温度変化を示す数値や温度分布を示す画像を算出する手段と、算出した温度情報と断層画像と交互あるいは同時に表示する手段とを備える。
【0010】
尚、本発明において温度情報とは温度変化を示す数値、温度分布画像、温度変化を示す数値を処理したグラフや等温線など、温度に関するすべての情報を意味する。
【0011】
本発明の好適な態様において、制御手段は、被検体の断層画像用のNMR信号を計測する間に、温度計測用のNMR信号を計測する制御を行い、断層画像用のNMR信号を再構成した断層画像と、温度計測用のNMR信号を計算して得られた温度情報とを、同時あるいは交互に表示する。
【0012】
本発明の他の好適な態様において、制御手段は、被検体から得られたNMR信号を用いて、断層画像用の信号強度データと温度情報算出用の位相データを作成し、信号強度データを再構成した断層画像と位相データから算出した温度情報とを同時あるいは交互に表示する。
【0013】
【発明の実施の形態】
以下、本発明の好適な実施例を図面を参照して説明する。
【0014】
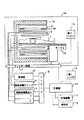
図1は本発明を適用したMRI装置の全体構成図を示す。図1に示すMRI装置は、静磁場発生磁石2と、傾斜磁場コイル3及び傾斜磁場電源4から構成される傾斜磁場発生系と、高周波コイル5と高周波電力アンプ6から構成される高周波磁場発生系と、NMR信号を検出するための検出コイル7と、受信器8 (信号処理系)と、傾斜磁場発生系および高周波磁場発生系を所定の撮影シーケンスに従って制御するシーケンサ9(制御系)と、計算機10及び記憶装置11から構成される演算処理系と、第1ディスプレイ12、第2ディスプレイ13及び操作卓14から構成される操作系と、被検者1を搬送するテーブル15とを備えている。
【0015】
検出コイル7に外部からの電磁波ノイズが混入しないように一部のユニットは電磁シールド室16内に設置されている。このため、シールド室内のユニットと外部のユニットはフィルター回路17を介して接続されている。
【0016】
静磁場発生磁石2は被検者1の検査部位を含む空間に均一で安定な磁場強度を発生させている。磁場発生の手段としては永久磁石や常電導コイルあるいは超電導コイル方式があるが、図1に示す装置では対向する一対の超電導コイル18と、この超電導コイル18を囲むように磁気回路を構成する鉄ヨーク19で組み立てられている。このような構成により、静磁場発生磁石2の被検者1の搬入口は広い空間を確保することができ、磁石2内に配設されている被検者1に術者が直接治療等の処置を施すことができる。また、被検者1の検査部位を含む球空間は、例えば3ppm以下の均一度に調整されている。この磁石の性能により、リアルタイムでMRI画像を撮るMRフルオロスコピーやエコープレーナイメージング(EPI)の撮影機能が可能となっている。
【0017】
静磁場発生磁石2は、一対の永久磁石を上下に配置した構造の開放型でもよい。この場合には被検者の周囲が開放されているので、治療等の処理をさらに容易に行うことができる。
【0018】
傾斜磁場発生系は、互いに直交するx、y、zの3軸方向に磁束密度を変化させるように巻かれた傾斜磁場コイル3(図ではx、y、zを一体で示してある)と、それぞれのx、y、zの傾斜磁場コイル3を駆動する傾斜磁場電源4とから構成される。後述のシーケンサ9からの制御信号に従って傾斜磁場電源4を駆動して傾斜磁場コイル3に流れる電流値を変化させることにより3軸からなる傾斜磁場パルスGx、Gy、Gzを被検者1の検査部位に印加するようになっている。この傾斜磁場は、後述する検査部位から得られるNMR信号の空間的な分布を把握するのに用いられる。
【0019】
高周波磁場系は、被検者1の検査部位の原子核を共鳴励起するための高周波磁場発生する高周波コイル5と、高周波コイル5に高周波電流を流すための高周波電力アンプ6から構成されている。高周波電力アンプ6もまたシーケンサ9の制御信号で制御されている。高周波電力アンプ6の動作周波数は、装置の磁場強度で決る検査対象原子核の共鳴周波数に合わされている。検査対象原子核は、通常は水素である。
【0020】
検出コイル7は、被検者1の検査部位の励起された水素原子核の高周波磁場であるNMR信号を電気信号として検出する機能を有している。この検出コイル7はMRIの検査施行中に同時に治療処置ができるように空隙が設けられている。受信器8は、検出コイル7で検出された微弱なNMR信号を増幅・検波し、その後の計算機10での処理が可能なディジタル信号に変換するアナログ/ディジタル変換の機能を有する。受信器8もシーケンサ9でその動作タイミングが制御されており、かつ、ディジタルに変換されたNMR信号は計算機10に入力されるように接続されている。
【0021】
演算処理系は計算機10と画像等を記憶する記憶装置11と処理後のデータを表示する第1ディスプレイ12と第2ディスプレイ13とMRI装置を操作するための操作卓14から構成されている。ここで、第2ディスプレイは術者(図には記載してない)が治療等の処置中に表示内容を確認できるように磁石2の近傍に配置されている。計算機10は被検者1の検査部位のNMR信号を処理して検査部位の解剖学的な断層画像のみならずNMR信号の周波数や位相の変位量や緩和時間の変化量などから検査部位の温度を算出し、第1ディスプレイ12と第2ディスプレイ13に表示する。
【0022】
また、計算機10は上述の各ユニットの動作を制御するシーケンサ9に接続されており、制御に必要な指令をシーケンサ9に送る。
【0023】
本発明のMRI装置において、計算機10及びシーケンサ9から構成される制御系は次のような制御を行う。
1) 連続的な形態的或いは機能的画像の計測、表示を行い、その間に所望の間隔で温度計測を行い、形態的或いは機能的画像と温度情報(数値、位相画像等)を同時に表示する。或いは連続的な温度計測、モニターを行い、その間に所望の間隔で形態計測を行い、温度情報と形態画像を同時に表示する。
2) 連続的な計測によって得られたNMR信号を用いて、温度情報と形態的或いは機能的画像を並行して作成し、表示する。
【0024】
これら機能は、プログラムとして計算機上10に組み込まれ、このプログラムに従い、計算機10は得られたNMR信号を用いて画像再構成、温度計算等の計算を行う。機能の選択、各機能において実行されるシーケンサ、撮影条件、表示条件等の設定は操作卓14を介して行うことができる。
【0025】
温度情報および形態画像の同時表示を可能にする計算機10の画像表示部分の構成を図2に示す。イメージメモリ202及びグラフィックメモリ203は演算部において処理された画像データおよび文字・数値データを記憶するメモリである。データは、データバス201を介して送られたこれらメモリに送られ、書き込まれる。画像データは、NMR信号をフーリエ変換することにより作成された断層画像や位相画像のデータであり、文字・数値データは、温度数値、温度分布等高線、温度変化グラフ等である。
【0026】
イメージメモリ202のデータは1枚の画像毎にルックアップテーブルメモリ205に入力される。グラフィックメモリ203のデータは、表示単位毎にテーブルメモリ206に入力される。
【0027】
コントロール回路204はこれらデータの表示に関する制御信号209、210をそれぞれルックアップテーブルメモリ205及びテーブルメモリ206に送る。即ち、オペレータの操作により、表示される画像の濃度や階調などが設定されると、これら処理のための信号209がコントロール回路204からルックアップテーブルメモリ205に入力され、ここで濃度や階調に関する処理が行われる。またコントロール回路204からの信号210により温度情報の表示/非表示の選択がなされる。
【0028】
ルックアップテーブルメモリ205及びテーブルメモリ206の信号は合成回路207で加算され、D/A回路208でビデオ信号に変換され、第1ディスプレイ12及び第2ディスプレイ13に入力される。
【0029】
次にこのような構成におけるMRI装置の動作について説明する。
【0030】
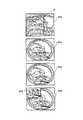
図3は図1に示したMRI装置にて検査部位の温度をモニターしながら患部を治療するインターベンショナル治療を行う一例の過程を示したフローチャート図である。図4は第1ディスプレイと第2ディスプレイで表示される画像を示す。
【0031】
まず、被検者1の検査部位、例えば胴部にNMR信号を検出する高周波コイル7を装着して磁石2の中心に配設する(ステップ301)。
【0032】
次に検査部位である胴部の体軸に沿った断層画像を撮影する(ステップ302)。これは例えば穿針のルートと治療部位を含む断面を決めるための予備計測であり、スピンエコー法など公知のシーケンスによって撮影する。撮影された画像401は、図4に示すように第1ディスプレイ12と第2のディスプレイ13に表示される。
【0033】
術者は表示された画像401に基づき治療部位を含む新たな断層面Bを特定し(ステップ303)、新たな断層面の画像を高速撮影法で撮影する(ステップ304)。この操作を連続的に繰り返す。高速撮影法としては、例えば後述するMRフルオロスコピーが選択される。
【0034】
この連続撮影によって得られた画像は、第1ディスプレイ12と第2ディスプレイ13に表示される。これにより、術者は実質的にリアルタイムでバイオプシ(経皮索針)の作業を画像402で観察しながら行える。
【0035】
画像402で針が治療部位に達したことを確認すると、レーザ照射による患部の蒸散治療を施行する(ステップ305)。この治療の過程は、引き続き形態画像の連続撮影を行い、それを第1ディスプレイ12と第2ディスプレイ13に表示することにより確認される(ステップ306)。この場合、必要に応じて機能的な画像を撮影し、その画像を表示してもよい。或いは治療部位を高い解像度で撮影するために画像の視野を変える等撮影条件を変えて撮影してもよい。このように撮影と表示を連続的に繰返し実行することで、術者に実質的なリアルタイムの画像を提供する。
【0036】
このような連続撮影の過程で、一定間隔で検査部位の温度をモニターする。温度モニターの時間間隔は、温度をモニターするのに適した時間間隔の値を治療に応じて術者が計算機10に入力することにより設定される。この時間間隔の値は治療の過程に合わせて変化させることもできる。即ち、治療の途中であっても計算機10からの入力によってモニターする間隔を変更することができる。
【0037】
温度モニターでは、まず蒸散治療の開始から一定の時間が経過したか否かを判定する(ステップ307)。一定の時間が経過すると、計算機10はシーケンサに指令し、温度計測シーケンスを実行する。温度計測シーケンスはステップ304、306で実行される高速撮影法によるシーケンスと同じでも、また異なっていてもよい。
【0038】
この温度計測シーケンスの実行により、治療部位を含む周辺組織のNMR信号を計測する(ステップ308)。ここで計測したNMR信号は、温度変化を位相の変化として含む信号であり、これを計算機10で処理することにより温度を算出することができ、また温度分布図を構成することができる。温度変化の算出については後述する。こうして得られた温度情報(数値として温度変化或いは温度分布図)を第1ディスプレイ12と第2ディスプレイ13に表示する。
【0039】
この温度情報は断層画像403と必要に応じて交互に表示するか、一定の周期で繰返し表示するか、例えば図4に示すように、温度あるいは温度分布の表示405を断層像404の一部に表示する。
【0040】
このような温度計測は、治療の過程で設定された時間間隔毎に実行され、その都度、温度情報が更新し第1ディスプレイ12と第2ディスプレイ13に表示する(ステップ306〜308)。
【0041】
治療の進行過程を断層像上で確認後、検査と治療を終了し、被検者を磁石2より搬出して終了する(ステップ309、310)。
【0042】
上述のように構成することで、術者は治療中にその進行過程をMRI画像で常に観察できるとともに、治療行為に件う温度変化を一定時間間隔でモニターすることができる。
【0043】
次に上記ステップ304(306)及びステップ308の撮影シーケンスについて説明する。
【0044】
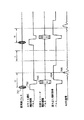
上述したようにステップ304ではMRフルオロスコピー等の連続高速撮影を行う。図5はその高速撮影法の一例としてグラディエントエコーによるシーケンスを示した図であり、図6はMRフルオロスコピーを説明する図である。
【0045】
グラディエントエコーによるシーケンスはMRフルオロスコピーに適用されるシーケンスとしてよく知られているものであるが、簡単に説明すると、ここでは体軸と直交する断層面の核スピンを選択的に励起するため、スライス選択傾斜磁場パルス(ここではy軸の傾斜磁場パルス)501を印加した状態で、高周波パルス502の電流を高周波コイル5に流す。次に、位相エンコード傾斜磁場パルス(ここではz軸傾斜磁場パルス)503を印加し、励起された核スピンの歳差運動の位相をz軸に沿ってエンコードする。更に読み出し傾斜磁場パルス(x軸の傾斜磁場パルス)504を印加した状態で、核スピンの歳差運動をNMR信号として受信用の検出コイル7で検出する。受信されたNMR信号は、受信器8で例えば256点のデジタル信号に変換されて計算機10のメモリーに記録される。
【0046】
このようなNMR信号の検出を、z軸傾斜磁場パルス503の強度を変えながら繰り返す。z軸傾斜磁場パルス503の強度は、例えば第1の値から第128の値になるまで繰り返し、これにより1枚の断層画像の再構成に必要なデータを収集する。
【0047】
図中、y軸の傾斜磁場パルス506とx軸の傾斜磁場パルス507は計測の繰り返しにおいて、直前の計測における核スピンの歳差運動の残留成分を強制的に緩和させるために用いられる。また、y軸の傾斜磁場パルス508とx軸の傾斜磁場パルス509は前述の核スピンの歳差運動のy軸方向とx軸方向の位相ずれを打ち消し、最大振幅でNMR信号として検出できるようにするために用いられている。
【0048】
図6はこのようなNMR信号測定の繰り返しから順次連続画像601、602、603…を作成することを説明する図で、図中y軸の傾斜磁場とx軸の傾斜磁場は省略しているが、高周波パルスの印加からNMR信号の計測までは、図5の示すシーケンスと同じであり、位相エンコード傾斜磁場(z軸の傾斜磁場)パルス503の第1の値におけるNMR信号の測定を第1ビュー、第2の値におけるNMR信号の測定を第2ビューと称している。第3の値以下についても同様である。
【0049】
上述したように各ビューのNMR信号はデジタル信号として計算機10のメモリーに記録され、例えば第128ビューまでのNMR信号の測定が終了すると、計算機10のメモリーには128×256のマトリクスのNMR信号が記録されたことになる。計算機10はこのマトリクスのNMR信号を二次元フーリエ変換し、x-z面の断層画像を得る。この断層図601は、第1ディスプレイ12と第2ディスプレイ13に表示される。
【0050】
連続撮影では第128ビューまでNMR信号が測定されると、z軸の傾斜磁場パルス503を再び第1の値にして、次のサイクルの第1ビューから第128ビューまでのNMR信号が順次計測される。
【0051】
計算機は、最初のサイクルの第2ビューから第128ビューまでのNMR信号に次のサイクルの第1ビューのNMR信号を加えた新たな128×256マトリクスデータを二次元フーリエ変換して断層図602を構成する。
【0052】
遂次、第3ビューから第128ビューまでのNMR信号と次の第1ビューと第2ビューのNMR信号を加えた128×256マトリクスデータから断層図603を構成する。このように画像構成処理を行なうことで、単一ビューのNMR信号を計測する時間間隔毎に新たな断層画図が第1ディスプレイ12と第2ディスプレイ13に表示される。図5のシーケンスにおいて第1ビューの計測時間が約50ミリ秒であるとすると、1秒間に20枚の画像が更新されることになるので、これにより術者はリアルタイムで画像上の変化を観察することができる。
【0053】
図7は、ステップ308で行う温度分布を求める計測シーケンスを示した図である。このシーケンスも図5に示すシーケンスと同じグラディエントエコー法によるシーケンスであり、同じ条件に設定されている。即ち、ステップ304で計測した断面と同じ断面を励起し、NMR信号705を例えば128点の離散的データとして計測し、位相エンコード傾斜磁場(z軸)703の強度を変化して、繰返しNMR信号を計測する。これにより得られたマトリクスデータ(例えば128×128)は計算機10のメモリに記録される。
【0054】
計算機10はこのマトリクスデータを二次元フーリエ変換して各ピクセルの信号の位相図S(t)を得る。この場合、予めレーザー治療を開始する時点(時刻0)の温度(体温の36度に等しい)の核スピンのNMR信号を計測し、このときの位相図S(0)の各ピクセルの信号の位相がゼロになるようにエコー時間TE(高周波パルス701で励起してからNMR信号705のピークを検出するまでの時間)を調整しておく。このようにすることで、位相図S(t)の位相は、時間tの間の温度変化によって生じたNMR信号の共鳴周波数の位相変化として測定することができる。
【0055】
ここで、S(0)とS(t)の位相を各ピクセル毎に比較すると位置に対応した温度変化に伴う位相変位量ΔS (t)が計算で求められる。一般に位相変移量ΔS (t)と温度変化ΔT (t)との関係は次式で表されるので、
ΔT=ΔS/(TE×f×0.01×10−6×360)
(式中、fは共鳴周波数、TEはエコー時間である)この式から治療過程での温度変化、すなわち36度からの変化を求めることができる。
【0056】
既に述べたように温度モニターのステップ308では、レーザ照射の治療が継続する間、上述の温度計測を一定の時間間隔Δtで繰り返す。この場合、各温度計測で求めた位相と基準の位相図S(0)との変化から体内組織の温度を求めてもよいが、直前の計測で求めた位相を基準に順次位相変化を求めることにより、誤差を最小にした体内組織の温度の経時変化を求めることができる。
【0057】
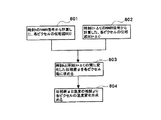
このような温度計測の一例を図8に示す。ここでは、まず時刻tにおいて温度計測シーケンス(図7)で求めた位相図S(t)を基準とする(801)。この計測時刻から、ステップ307に設定したΔt後の時間(t+Δt)に、再び温度計測シーケンスを実行して128×128マトリクスのNMR信号を計測し、位相図S(t+Δt)を計算し(802)、この位相図S(t+Δt)と基準とした位相図S(t)の各ピクセル毎の位相変化φを求める(803)。この位相変化からΔtの間の温度変化を求める(804)。次に時刻(t+Δt)からさらにΔt経過した時点で、再び位相図S(t+2Δt)を求め、今度はS(t+Δt)を基準として、S(t+Δt)とS(t+2Δt)の位相変化を求める。このように逐次直近の位相図を比較計算に用いることで、Δtが短ければ被検体の動きなどの誤差を排除することができ位置情報の正確な温度変化量を求めることができる。
【0058】
尚、温度変化を算出する方法としては、上述した位相差から算出する方法の他、例えば特公平6-14911号公報に記載された、N MR信号の温度に依存する拡散定数を測定して温度を求める方法など公知の方法を採用することができる。
【0059】
次にステップ304(306)で得られた画像とステップ308で得られた温度情報の表示方法について説明する。
【0060】
図9(a)〜(c)はそれぞれ第1ディスプレイ12及び第2ディスプレイ13による温度表示の一例を示す図である。(a)ではステップ306で撮影した治療効果を観察する画像(形態画像或いは機能画像、以下単に形態画像という)901をディスプレイの右半分に表示し、ステップ308で計測したNMR信号より計算した温度分布を示す図902を左半分に表示してある。この場合、温度分布は温度が一目でわかるように所定の色分けがなされていてもよい。例えば温度変化を5度きざみに30度から50度までを青色−黄色−赤色まで順次色相が変化するようにすることもできる。この表示により、術者は治療の進行と治療部位周辺の温度を把握しながら治療行為を進めることができる。
【0061】
(b)では形態画像をディスプレイの全面に表示し、温度分布図903を縮小してディスプレイの任意の位置に移動可能な表示したものである。この表示方式によれば形態画像を大きく表示でき、関心領域から離れた部位の上に温度分布のウインドウ画面903が表示できる。
【0062】
(c)では形態画像をディスプレイの全面に表示し、NMR信号から計算した温度を等高線904や数値905を形態画像の該当部位の上に重ねて表示したものである。このような表示方式を選択することで、一つの画像で、治療の過程を観察するとともに、温度のモニターもできることになる。
【0063】
図10(a)、(b)はさらに別の温度表示方法の例を示すもので、同図(a)は形態画像1001上で検査部位をポインター(カーソル)1002で指定し、指定した位置の温度を画面上の所望の位置(形態画像の邪魔にならない位置)1003に数値表示するようにしたものである。この表示方法により目的部位の温度を正確に把握することができる。
【0064】
図10(b)は、目的部位の温度変化を時間軸で表示する方式を示したものである。上述したように温度計測は時々刻々の変化を測定しているので、これを時間軸に対しプロットしグラフを描出する。このような表示方式を採用することにより、温度変化曲線から目的部位が目標温度に達する時間を予測することが可能となる。このような温度変化曲線は、画面上の関心領域の観察に邪魔にならない位置にウィンドウを設けて表示することができる。
【0065】
以上、本発明の第1の実施例を説明したが、この実施例では治療効果を観察する画像を連続撮影する過程で、任意の時間間隔で温度計測のためのNMR信号の計測を行い、それを用いて作成した温度分布図、温度数値、グラフなどの温度情報を、治療効果を観察する画像と同時に表示するようにしたことにより、クライオサージエリー、ハイパーサーミヤ等の温度変化を伴うインターベンショナル治療を効果的に行うことができる。
【0066】
尚、以上の実施例では、ステップ304(306)で行う高速撮影法のシーケンスおよびステップ308で行う温度計測シーケンスとしてグラディエントエコー法によるシーケンス(図5、図7)を例示したが、計測シーケンスはこれに限定されず、種々の変更が可能である。例えば、図11に示すスピンエコー法のシーケンスを採用してもよい。
【0067】
スピンエコー法によるシーケンスは、90°高周波パルスによる励起から所定の時間TE/2に180°高周波パルスを印加し、核スピンの位相を反転し、スピンエコーとしてNMR信号を計測するもので、印加した傾斜磁場以外の磁場歪により拡散した核スピンの位相を整合できるため、磁場歪の影響のない画像が得られる。従って形態の描出を優先したい場合には好適である。
【0068】
このスピンエコー法によるシーケンスにおいても、常温(例えば36℃)でNMR信号の位相誤差がキャンセルされるようにエコー時間TEを設定しておくと、熱的治療において核スピンの拡散定数やケミカルシフト値が変化すると、TEにおけるNMR信号の位相がわずかに変化する。従って計測したNMR信号の位相シフト量を求めることにより温度変化を計算することができる。
【0069】
次に本発明の第2の実施例を図12のフロー図を参照して説明する。尚、図12において図3のフロー図と同じステップについては同じ番号で示した。この実施例でも被検者を磁石中心に配設した後、体軸に沿った断層像を取得し、これをもとに治療部位を含む断面を設定し、その断面について高速撮影法による連続撮影を行いながら、治療を開始するまでのステップ(301〜304)は図3に示す第1の実施例と同様である。
【0070】
即ち、連続撮影(例えば、MRフルオロスコピー)により第1ディスプレイ12と第2ディスプレイ13には画像402が表示されるので、これを観察しながら、術者は実質的にリアルタイムでバイオプシ(経皮索針)の作業を行い、次のステップ305では、レーザ照射による患部の蒸散治療を施行する。
【0071】
この蒸散治療の開始と同時に治療部位を含む断面のNMR信号を計測する(311)。計算機10はこのNMR信号を演算処理して、NMR信号強度の分布図とNMR信号の位相図を求める。周知のようにNMR信号は強度情報と位相情報を有しているので、同じ信号から強度分布図、即ち形態画像と位相図とを求めることができる。このステップ311においても撮影シーケンスとして高速撮影を優先したい場合にはグラディエントエコー法のシーケンスを採用してもよいし、形態画像を優先したい場合にはスピンエコー法のシーケンスを採用してもよい。
【0072】
形態画像は第1ディスプレイ12と第2ディスプレイ13に表示される。この際、図6で示した処理と同様に、逐次1ビューのNMR信号を入れ替えながら絶対値を表示することで、1ビューの計測時間毎に画像が更新され、術者はリアルタイムの画像観察が可能になる。
【0073】
一方、位相情報については、128×128 のマトリクスデータを得た時点で最初の位相図S(t1)を求め、次いで128ビューの信号が全て入れ替わった時点で、次の位相図S(t2)を求める。次にこれら位相図の各ピクセルの位相変化から温度変化を計算によって求める。温度の計算は図1の実施例と同様である。このように逐次128ビューの信号が入れ替わるたびに位相図を求め、直前の位相図との位相差から順次温度変化を計算することにより、図8に示す計測と同様に、被検体の動きなどの誤差を排除して位置情報の正確な温度変化量を求めることができる。
【0074】
こうして求められた温度情報は、第1ディスプレイ12と第2ディスプレイ13にNMR信号強度分布図と同時に或いは交互に表示される。温度情報の表示方法は、第1の実施例と同様、温度分布図、数値表示、グラフなど任意の表示方法を選択することができる。
【0075】
上述した例では形態画像(絶対値図)は1ビュー計測(約5 0ミリ秒)毎に更新され、温度情報は128ビュー計測(約6.4秒)毎に更新される。術者は治療の進行過程を断層像上で確認後、検査と治療を終了し、被検者1を磁石2より搬出して終了する(ステップ309、310)。治療の継続の場合は、ステップ305とステップ311に戻り断層像の撮影と表示・温度計測と表示が繰返される。
【0076】
本発明の第2の実施例によれば、治療の進行過程を観察する断層面の形態的や機能的な画像(NMR信号の絶対値図)と治療に伴う温度変化を示す温度分布図(NMR信号の位相図より算出)とを同一の計測シーケンスで得ることができるので、システム構成を単純にできる特長がある。
【0077】
尚、以上の実施例では形態画像を連続撮影する過程で温度モニターを行う場合を説明したが、本発明はこれら実施例に限定されず、形態画像の撮影と温度計測とを任意の組み合わせで実施することも本発明の範囲に含まれる。
【0078】
【発明の効果】
本発明によれば、MRI装置の制御手段の機能として、一つの撮影の過程で温度計測を任意に組み合わせる機能を持たせるとともに、表示手段の機能として形態画像と温度情報とを合成して表示する機能を持たせたことにより、特に熱治療を伴うインターベンショナル処置において、治療部位の温度を把握しながら確実に治療を進めることができる。また温度表示の機能として、温度分布図のみならず数値機能やグラフ機能を持たせたことにより、術者が利用しやすい温度情報を提供することができる。
【図面の簡単な説明】
【図1】本発明が適用されるMRI装置の全体構成を示す図。
【図2】MRI装置の表示部の構成を示す図。
【図3】本発明のMRI装置による検査の一実施例を示すフローチャート。
【図4】図3の検査フローにおけるディスプレイの表示例を示す図。
【図5】本発明のMRI装置で採用される高速撮影シーケンスの一例を示す図。
【図6】本発明のMRI装置で採用される連続撮影、画像処理を説明する図。
【図7】本発明のMRI装置で採用される温度計測シーケンスの一例を示す図。
【図8】本発明による温度計測の一実施例を示すフローチャート示す。
【図9】 本発明のMRI装置によるディスプレイの表示例を示す図。
【図10】本発明のMRI装置によるディスプレイの他の表示例を示す図。
【図11】本発明のMRI装置で採用される撮影シーケンスの他の例を示す図。
【図12】本発明のMRI装置による検査の他の実施例を示すフローチャート。
【符号の説明】
1……被検者
2……磁石
3……傾斜磁場コイル
4……傾斜磁場電源
5……高周波コイル
6……高周波電力アンプ
7……検出コイル
8……受信器
9……シーケンサ
10……計算機
11……記憶装置
12……第1ディスプレイ
13……第2ディスプレイ
14……操作卓
15……テーブル[0001]
[Technical field to which the invention belongs]
The present invention relates to a magnetic resonance imaging (hereinafter referred to as MRI) apparatus, and more particularly, to an MRI apparatus suitable for interventional processing in which processing is performed while monitoring the body temperature.
[0002]
[Prior art]
In recent years, attention has been focused on a treatment method that achieves the same effect with minimal invasiveness, rather than a surgical treatment in which a scalpel is inserted into a patient. For example, it is a treatment method in which a needle is inserted percutaneously under X-ray fluoroscopy and the affected part of the herniated disc is evaporated by laser irradiation. Similarly, there is a cryosurgery treatment method in which a cryogen is poured under X-ray fluoroscopy and the affected part is frozen and excised. These minimally invasive therapeutic methods under X-ray fluoroscopy are called interventional treatments and are beginning to become popular because they can satisfy the therapeutic effects.
[0003]
Alternatively, hyperthermia treatment methods that selectively irradiate tumor cells, which are considered to be heat-sensitive, by raising the temperature of a part of the body tissue by irradiating the affected area with electromagnetic waves or infrared rays have attracted attention.
[0004]
[Problems to be solved by the invention]
Since the above-mentioned interventional treatment is performed under X-ray fluoroscopy, there is a problem of X-ray exposure for the operator and the patient. In addition, there are problems that the degree of transpiration and resection of the affected area cannot be evaluated during the operation, and the temperature change of the normal tissue around the affected area cannot be grasped.
[0005]
In addition, hyperthermia therapy requires extremely accurate control of the boundary temperature between the death of normal cells and tumor cells. However, there was no means for accurately measuring the temperature and temperature distribution in the body non-invasively during treatment.
[0006]
On the other hand, several methods have been developed to know the temperature in the body from the nuclear magnetic resonance (hereinafter referred to as NMR) signal of the body tissue by MRI. The main methods are as follows: 1) Grasping that the relaxation time of the NMR signal changes with temperature, and calculate the temperature from the amount of change. 2) The change in the resonance frequency of the NMR signal is measured along with the temperature change, and the temperature is calculated from the change frequency and the phase change amount. 3) There is a method of measuring the diffusion constant depending on the temperature of the NMR signal to obtain the temperature (Japanese Patent Publication No. 6-14911).
[0007]
However, in the above-described interventional treatment, the measurement of the temperature change at the treatment site must be performed together with the monitoring of the form. However, the above-described temperature measurement cannot depict the form with high spatial resolution, so these temperature measurements are performed. Is not applied to monitor the progress of treatment such as therapy. As an image display means, there is no MRI apparatus capable of displaying a combination of an MRI image showing the form and function and a temperature distribution diagram or a temperature display of an examination site.
[0008]
The present invention has been made in view of the above problems, and an object thereof is to provide an MRI apparatus suitable for performing interventional while monitoring the temperature of a treatment site under MRI imaging. Another object of the present invention is to provide an MRI apparatus capable of substantially displaying a tomographic image and temperature information for determining the progress of a therapeutic treatment. Furthermore, an object of the present invention is to provide an MRI apparatus that can provide information indicating the temperature of a treatment site in a form that is easy for a person performing the treatment to use.
[0009]
[Means for Solving the Problems]
The MRI apparatus of the present invention that achieves the above object comprises a static magnetic field generating means for generating a constant magnetic field strength, a gradient magnetic field generating means for generating a magnetic field strength gradient, a means for generating a high-frequency magnetic field, Means for detecting NMR signals, calculation / display means for reconstructing a tomographic image of the subject using the NMR signals and displaying the results, and control means for controlling these means, the calculation / display means Comprises means for calculating a numerical value indicating a temperature change of the examination region of the subject and an image indicating a temperature distribution, and means for alternately or simultaneously displaying the calculated temperature information and the tomographic image.
[0010]
In the present invention, the temperature information means all information related to temperature such as a numerical value indicating a temperature change, a temperature distribution image, a graph in which the numerical value indicating the temperature change is processed, and an isotherm.
[0011]
In a preferred embodiment of the present invention, the control means performs control to measure the NMR signal for temperature measurement while measuring the NMR signal for the tomographic image of the subject, and reconstructs the NMR signal for the tomographic image. A tomographic image and temperature information obtained by calculating an NMR signal for temperature measurement are displayed simultaneously or alternately.
[0012]
In another preferred aspect of the present invention, the control means creates signal intensity data for tomographic images and phase data for temperature information calculation using the NMR signal obtained from the subject, and regenerates the signal intensity data. The configured tomographic image and the temperature information calculated from the phase data are displayed simultaneously or alternately.
[0013]
DETAILED DESCRIPTION OF THE INVENTION
Preferred embodiments of the present invention will be described below with reference to the drawings.
[0014]
FIG. 1 shows an overall configuration diagram of an MRI apparatus to which the present invention is applied. The MRI apparatus shown in FIG. 1 includes a static magnetic
[0015]
Some units are installed in the
[0016]
The static magnetic
[0017]
The static magnetic
[0018]
The gradient magnetic field generation system includes a gradient magnetic field coil 3 (x, y, and z are integrally shown in the figure) wound so as to change the magnetic flux density in three axial directions of x, y, and z orthogonal to each other. It is composed of a gradient magnetic
[0019]
The high-frequency magnetic field system includes a high-
[0020]
The detection coil 7 has a function of detecting an NMR signal, which is a high-frequency magnetic field of excited hydrogen nuclei at the examination site of the subject 1, as an electrical signal. This detection coil 7 is provided with a gap so that therapeutic treatment can be performed simultaneously during the MRI examination. The
[0021]
The arithmetic processing system includes a
[0022]
The
[0023]
In the MRI apparatus of the present invention, the control system composed of the
1) Measurement and display of continuous morphological or functional images, while measuring temperature at desired intervals, and displaying morphological or functional images and temperature information (numerical values, phase images, etc.) simultaneously. Alternatively, continuous temperature measurement and monitoring are performed, and during that time, shape measurement is performed at a desired interval, and temperature information and a shape image are displayed simultaneously.
2) Using the NMR signal obtained by continuous measurement, temperature information and a morphological or functional image are created and displayed in parallel.
[0024]
These functions are incorporated in the
[0025]
FIG. 2 shows the configuration of the image display portion of the
[0026]
Data in the
[0027]
The
[0028]
The signals of the look-up
[0029]
Next, the operation of the MRI apparatus having such a configuration will be described.
[0030]
FIG. 3 is a flowchart showing an example of a process of performing an interventional treatment for treating an affected area while monitoring the temperature of the examination site with the MRI apparatus shown in FIG. FIG. 4 shows images displayed on the first display and the second display.
[0031]
First, a high-frequency coil 7 for detecting an NMR signal is attached to an examination site of the subject 1, for example, a trunk, and is arranged at the center of the magnet 2 (step 301).
[0032]
Next, a tomographic image is taken along the body axis of the trunk, which is the examination site (step 302). This is a preliminary measurement for determining a cross section including a needle route and a treatment site, for example, and is imaged by a known sequence such as a spin echo method. The captured
[0033]
The surgeon specifies a new tomographic plane B including the treatment site based on the displayed image 401 (step 303), and takes an image of the new tomographic plane by high-speed imaging (step 304). This operation is continuously repeated. For example, MR fluoroscopy described later is selected as the high-speed imaging method.
[0034]
Images obtained by this continuous shooting are displayed on the
[0035]
When it is confirmed from the
[0036]
In the process of such continuous imaging, the temperature of the examination site is monitored at regular intervals. The time interval of the temperature monitor is set by the operator inputting a value of a time interval suitable for monitoring the temperature to the
[0037]
In the temperature monitor, it is first determined whether or not a certain time has elapsed since the start of the transpiration treatment (step 307). When a certain time has elapsed, the
[0038]
By executing this temperature measurement sequence, the NMR signal of the surrounding tissue including the treatment site is measured (step 308). The NMR signal measured here is a signal including a temperature change as a phase change, and the temperature can be calculated by processing this with the
[0039]
The temperature information is displayed alternately with the
[0040]
Such temperature measurement is performed at every time interval set in the course of treatment, and the temperature information is updated and displayed on the
[0041]
After confirming the progress of treatment on the tomogram, the examination and treatment are finished, and the subject is taken out of the
[0042]
By configuring as described above, the surgeon can always observe the progress of the treatment with MRI images during treatment, and can monitor the temperature change related to the treatment action at regular time intervals.
[0043]
Next, the photographing sequence in steps 304 (306) and step 308 will be described.
[0044]
As described above, in
[0045]
Gradient echo sequence is a well-known sequence applied to MR fluoroscopy, but in brief, it is a slice to selectively excite nuclear spins on the tomographic plane perpendicular to the body axis. In a state where a selective gradient magnetic field pulse (here, a y-axis gradient magnetic field pulse) 501 is applied, the current of the high-
[0046]
Such detection of the NMR signal is repeated while changing the intensity of the z-axis gradient
[0047]
In the figure, a gradient
[0048]
FIG. 6 is a diagram for explaining the sequential creation of
[0049]
As described above, the NMR signal of each view is recorded as a digital signal in the memory of the
[0050]
In continuous shooting, when the NMR signal is measured up to the 128th view, the z-axis gradient
[0051]
The computer performs a two-dimensional Fourier transform of the new 128 × 256 matrix data obtained by adding the NMR signal of the first view of the next cycle to the NMR signal of the first cycle from the second view to the 128th view, and generates a
[0052]
Sequentially, a
[0053]
FIG. 7 is a diagram showing a measurement sequence for obtaining the temperature distribution performed in
[0054]
The
[0055]
Here, when the phases of S (0) and S (t) are compared for each pixel, a phase displacement amount ΔS (t) accompanying a temperature change corresponding to the position is obtained by calculation. Generally, the relationship between the phase shift amount ΔS (t) and the temperature change ΔT (t) is expressed by the following equation.
ΔT = ΔS / (TE × f × 0.01 × 10−6 × 360)
(Where f is the resonance frequency and TE is the echo time) From this equation, the temperature change during the treatment process, that is, the change from 36 degrees can be obtained.
[0056]
As described above, in
[0057]
An example of such temperature measurement is shown in FIG. Here, the phase diagram S (t) obtained by the temperature measurement sequence (FIG. 7) at the time t is used as a reference (801). From this measurement time, at the time (t + Δt) after Δt set in
[0058]
As a method of calculating the temperature change, in addition to the method of calculating from the above-described phase difference, for example, a diffusion constant depending on the temperature of the NMR signal described in Japanese Patent Publication No. 6-14911 is measured to determine the temperature change. A known method such as a method for obtaining the value can be employed.
[0059]
Next, the display method of the image obtained in step 304 (306) and the temperature information obtained in
[0060]
9A to 9C are diagrams showing examples of temperature display by the
[0061]
In (b), the morphological image is displayed on the entire surface of the display, and the temperature distribution diagram 903 is reduced and displayed so as to be movable to an arbitrary position on the display. According to this display method, a morphological image can be displayed in a large size, and a temperature
[0062]
In (c), the morphological image is displayed on the entire surface of the display, and the temperature calculated from the NMR signal is displayed by superimposing the
[0063]
FIGS. 10 (a) and 10 (b) show another example of the temperature display method. In FIG. 10 (a), the examination site is designated with a pointer (cursor) 1002 on the
[0064]
FIG. 10 (b) shows a method of displaying the temperature change of the target part on the time axis. As described above, since the temperature measurement measures the change every moment, it is plotted with respect to the time axis to draw a graph. By adopting such a display method, it is possible to predict the time for the target portion to reach the target temperature from the temperature change curve. Such a temperature change curve can be displayed by providing a window at a position that does not interfere with the observation of the region of interest on the screen.
[0065]
As described above, the first embodiment of the present invention has been described. In this embodiment, in the process of continuously capturing images for observing the therapeutic effect, NMR signals are measured for temperature measurement at arbitrary time intervals. Temperature information such as temperature distribution charts, temperature values, graphs, etc. created using this function is displayed at the same time as an image for observing the treatment effect, thereby intervening with temperature changes such as cryosurgery and hyperthermia. Can effectively perform national treatment.
[0066]
In the above embodiment, the high-speed imaging sequence performed in step 304 (306) and the temperature measurement sequence performed in
[0067]
The sequence by the spin echo method applies a 180 ° high frequency pulse at a predetermined time TE / 2 after excitation by a 90 ° high frequency pulse, inverts the phase of the nuclear spin, and measures an NMR signal as a spin echo. Since the phase of the nuclear spin diffused by the magnetic field distortion other than the gradient magnetic field can be matched, an image without the influence of the magnetic field distortion can be obtained. Therefore, it is suitable when priority is given to the drawing of the form.
[0068]
Even in this sequence by the spin echo method, if the echo time TE is set so that the phase error of the NMR signal is canceled at room temperature (for example, 36 ° C.), the diffusion constant and chemical shift value of the nuclear spin in thermal treatment Changes the phase of the NMR signal in TE slightly. Therefore, the temperature change can be calculated by obtaining the phase shift amount of the measured NMR signal.
[0069]
Next, a second embodiment of the present invention will be described with reference to the flowchart of FIG. In FIG. 12, the same steps as those in the flowchart of FIG. 3 are indicated by the same numbers. Also in this embodiment, after the subject is arranged at the center of the magnet, a tomographic image along the body axis is acquired, and a cross section including the treatment site is set based on the acquired tomographic image. The steps (301 to 304) until the start of the treatment are performed in the same manner as in the first embodiment shown in FIG.
[0070]
That is, the
[0071]
Simultaneously with the start of the transpiration treatment, the NMR signal of the cross section including the treatment site is measured (311). The
[0072]
The morphological image is displayed on the
[0073]
On the other hand, for the phase information, the first phase diagram S (t1) is obtained when 128 × 128 matrix data is obtained, and then the next phase diagram S (t2) is obtained when all 128 view signals are replaced. Ask. Next, the temperature change is obtained by calculation from the phase change of each pixel in these phase diagrams. The temperature calculation is the same as in the embodiment of FIG. In this way, each time the 128 view signals are sequentially switched, a phase diagram is obtained, and by calculating the temperature change sequentially from the phase difference from the previous phase diagram, as in the measurement shown in FIG. An accurate temperature change amount of the position information can be obtained by eliminating the error.
[0074]
The temperature information thus obtained is displayed on the
[0075]
In the example described above, the morphological image (absolute value diagram) is updated every 1 view measurement (about 50 milliseconds), and the temperature information is updated every 128 view measurements (about 6.4 seconds). After confirming the progress of the treatment on the tomogram, the operator finishes the examination and treatment, and removes the subject 1 from the
[0076]
According to the second embodiment of the present invention, a morphological and functional image (absolute value diagram of NMR signals) of a tomographic plane for observing the progress of treatment and a temperature distribution diagram (NMR) showing temperature changes associated with treatment. (Calculated from the phase diagram of the signal) can be obtained with the same measurement sequence, and the system configuration can be simplified.
[0077]
In the above embodiments, the case where temperature monitoring is performed in the process of continuously capturing morphological images has been described. However, the present invention is not limited to these embodiments, and morphological image capturing and temperature measurement are performed in any combination. It is also included in the scope of the present invention.
[0078]
【The invention's effect】
According to the present invention, as a function of the control means of the MRI apparatus, a function of arbitrarily combining temperature measurement in one imaging process is provided, and a form image and temperature information are combined and displayed as a function of the display means. By providing the function, it is possible to surely proceed the treatment while grasping the temperature of the treatment site, particularly in the interventional treatment accompanied by the heat treatment. Further, by providing not only a temperature distribution diagram but also a numerical function and a graph function as a temperature display function, temperature information that can be easily used by an operator can be provided.
[Brief description of the drawings]
FIG. 1 is a diagram showing an overall configuration of an MRI apparatus to which the present invention is applied.
FIG. 2 is a diagram showing a configuration of a display unit of the MRI apparatus.
FIG. 3 is a flowchart showing an embodiment of an inspection by the MRI apparatus of the present invention.
4 is a diagram showing a display example of a display in the inspection flow of FIG. 3;
FIG. 5 is a diagram showing an example of a high-speed imaging sequence employed in the MRI apparatus of the present invention.
FIG. 6 is a view for explaining continuous imaging and image processing employed in the MRI apparatus of the present invention.
FIG. 7 is a diagram showing an example of a temperature measurement sequence employed in the MRI apparatus of the present invention.
FIG. 8 is a flowchart showing an embodiment of temperature measurement according to the present invention.
FIG. 9 is a view showing a display example of a display by the MRI apparatus of the present invention.
FIG. 10 is a diagram showing another display example of the display by the MRI apparatus of the present invention.
FIG. 11 is a diagram showing another example of an imaging sequence employed in the MRI apparatus of the present invention.
FIG. 12 is a flowchart showing another embodiment of the inspection by the MRI apparatus of the present invention.
[Explanation of symbols]
1 …… Subject
2 …… Magnet
3 …… Gradient field coil
4 …… Gradient magnetic field power supply
5 …… High frequency coil
6 …… High frequency power amplifier
7 …… Detection coil
8 …… Receiver
9 …… Sequencer
10 …… Calculator
11 …… Storage device
12 …… First display
13 …… Second display
14 …… Console
15 …… Table
Claims (8)
前記計算・表示手段は、前記被検体の検査部位の温度変化を算出する算出手段と、算出した温度変化を等高線として前記再構成画像上に表示する手段とを備え、
前記制御手段が制御する温度計測用の核磁気共鳴信号計測は、被検体体温と同じ温度において核磁気共鳴信号の位相誤差がゼロとなる時間にエコー時間(TE)が設定されていることを特徴とする磁気共鳴イメージング装置。A static magnetic field generating means for generating a constant magnetic field intensity, a gradient magnetic field generating means for generating a magnetic field strength gradient, a means for generating a high-frequency magnetic field, a means for detecting a nuclear magnetic resonance signal from the subject, and the nucleus A calculation / display means for reconstructing a morphological image or functional image of a subject using a magnetic resonance signal and displaying the result, and a control means for controlling each of these means,
The calculation / display unit includes a calculation unit that calculates a temperature change of the examination site of the subject, and a unit that displays the calculated temperature change as a contour line on the reconstructed image,
In the nuclear magnetic resonance signal measurement for temperature measurement controlled by the control means, an echo time (TE) is set at a time when the phase error of the nuclear magnetic resonance signal becomes zero at the same temperature as the body temperature of the subject. Magnetic resonance imaging apparatus.
前記計算・表示手段は、前記被検体の検査部位の温度変化を算出する算出手段と、算出した温度変化を温度毎に色相を変化させた色分け表示として表示する手段とを備え、
前記制御手段が制御する温度計測用の核磁気共鳴信号計測は、被検体体温と同じ温度において核磁気共鳴信号の位相誤差がゼロとなる時間にエコー時間(TE)が設定されていることを特徴とする磁気共鳴イメージング装置。A static magnetic field generating means for generating a constant magnetic field intensity, a gradient magnetic field generating means for generating a magnetic field strength gradient, a means for generating a high-frequency magnetic field, a means for detecting a nuclear magnetic resonance signal from the subject, and the nucleus A calculation / display means for reconstructing a morphological image or functional image of a subject using a magnetic resonance signal and displaying the result, and a control means for controlling each of these means,
The calculation / display unit includes a calculation unit that calculates a temperature change of the examination region of the subject, and a unit that displays the calculated temperature change as a color-coded display in which the hue is changed for each temperature.
In the nuclear magnetic resonance signal measurement for temperature measurement controlled by the control means, an echo time (TE) is set at a time when the phase error of the nuclear magnetic resonance signal becomes zero at the same temperature as the body temperature of the subject. Magnetic resonance imaging apparatus.
Priority Applications (1)
| Application Number | Priority Date | Filing Date | Title |
|---|---|---|---|
| JP35736299A JP4371510B2 (en) | 1999-12-16 | 1999-12-16 | Magnetic resonance imaging system |
Applications Claiming Priority (1)
| Application Number | Priority Date | Filing Date | Title |
|---|---|---|---|
| JP35736299A JP4371510B2 (en) | 1999-12-16 | 1999-12-16 | Magnetic resonance imaging system |
Publications (3)
| Publication Number | Publication Date |
|---|---|
| JP2001170022A JP2001170022A (en) | 2001-06-26 |
| JP2001170022A5 JP2001170022A5 (en) | 2007-02-01 |
| JP4371510B2 true JP4371510B2 (en) | 2009-11-25 |
Family
ID=18453753
Family Applications (1)
| Application Number | Title | Priority Date | Filing Date |
|---|---|---|---|
| JP35736299A Expired - Fee Related JP4371510B2 (en) | 1999-12-16 | 1999-12-16 | Magnetic resonance imaging system |
Country Status (1)
| Country | Link |
|---|---|
| JP (1) | JP4371510B2 (en) |
Families Citing this family (2)
| Publication number | Priority date | Publication date | Assignee | Title |
|---|---|---|---|---|
| JP2003093369A (en) * | 2001-09-21 | 2003-04-02 | Sony Corp | Authentication processing system, authentication processing method, and computer program |
| KR101560144B1 (en) | 2013-09-12 | 2015-10-15 | 한국표준과학연구원 | Apparatus for Thermal Surveillance Camera System of the Magnetic Resonance Image and the Method for Controlling thereof |
-
1999
- 1999-12-16 JP JP35736299A patent/JP4371510B2/en not_active Expired - Fee Related
Also Published As
| Publication number | Publication date |
|---|---|
| JP2001170022A (en) | 2001-06-26 |
Similar Documents
| Publication | Publication Date | Title |
|---|---|---|
| US6566878B1 (en) | Magnetic resonance imaging device and method therefor | |
| US7542793B2 (en) | MR-guided breast tumor ablation and temperature imaging system | |
| JP3538595B2 (en) | Contrast detection and guided reconstruction in contrast-enhanced magnetic resonance angiography | |
| US6377834B1 (en) | Real time in vivo measurement of temperature changes with contrast enhanced NMR imaging | |
| US20050065429A1 (en) | Method for three plane interleaved acquisition for three dimensional temperature monitoring with MRI | |
| EP2424430B1 (en) | Interventional mr imaging with motion compensation | |
| JPH02140145A (en) | Data collecting and processing system for mri device | |
| US20040039277A1 (en) | Magnetic resonance imaging system | |
| JPH0243497B2 (en) | ||
| JP3976845B2 (en) | Magnetic resonance imaging system | |
| JPH04364829A (en) | Magnetic resonance image processing method and apparatus therefor | |
| JP5465565B2 (en) | Magnetic resonance imaging system | |
| JP4371510B2 (en) | Magnetic resonance imaging system | |
| JP4250255B2 (en) | Temperature measuring method and magnetic resonance imaging apparatus | |
| JP2004008398A (en) | Medical image diagnostic apparatus | |
| JP3501182B2 (en) | Magnetic resonance imaging device capable of calculating flow velocity images | |
| JP4177165B2 (en) | MRI equipment | |
| JP2000300536A (en) | Three-dimensional temperature-measuring method using mri apparatus | |
| JP2000316830A (en) | Magnetic resonance imaging method and magnetic resonance imaging device using the same | |
| JP4118119B2 (en) | Magnetic resonance imaging system | |
| JP2000005142A (en) | Method and device for magnetic resonance imaging | |
| JP4047457B2 (en) | Magnetic resonance imaging system | |
| JP2000237160A (en) | Magnetic resonance image diagnostic system | |
| JP4219028B2 (en) | Magnetic resonance imaging system | |
| JP4558219B2 (en) | Magnetic resonance imaging system |
Legal Events
| Date | Code | Title | Description |
|---|---|---|---|
| A521 | Written amendment |
Free format text: JAPANESE INTERMEDIATE CODE: A523 Effective date: 20061130 |
|
| A621 | Written request for application examination |
Free format text: JAPANESE INTERMEDIATE CODE: A621 Effective date: 20061130 |
|
| A977 | Report on retrieval |
Free format text: JAPANESE INTERMEDIATE CODE: A971007 Effective date: 20081208 |
|
| A131 | Notification of reasons for refusal |
Free format text: JAPANESE INTERMEDIATE CODE: A131 Effective date: 20081216 |
|
| A521 | Written amendment |
Free format text: JAPANESE INTERMEDIATE CODE: A523 Effective date: 20090204 |
|
| A131 | Notification of reasons for refusal |
Free format text: JAPANESE INTERMEDIATE CODE: A131 Effective date: 20090421 |
|
| A521 | Written amendment |
Free format text: JAPANESE INTERMEDIATE CODE: A523 Effective date: 20090519 |
|
| TRDD | Decision of grant or rejection written | ||
| A01 | Written decision to grant a patent or to grant a registration (utility model) |
Free format text: JAPANESE INTERMEDIATE CODE: A01 Effective date: 20090825 |
|
| A01 | Written decision to grant a patent or to grant a registration (utility model) |
Free format text: JAPANESE INTERMEDIATE CODE: A01 |
|
| A61 | First payment of annual fees (during grant procedure) |
Free format text: JAPANESE INTERMEDIATE CODE: A61 Effective date: 20090901 |
|
| FPAY | Renewal fee payment (event date is renewal date of database) |
Free format text: PAYMENT UNTIL: 20120911 Year of fee payment: 3 |
|
| R150 | Certificate of patent or registration of utility model |
Free format text: JAPANESE INTERMEDIATE CODE: R150 |
|
| FPAY | Renewal fee payment (event date is renewal date of database) |
Free format text: PAYMENT UNTIL: 20120911 Year of fee payment: 3 |
|
| FPAY | Renewal fee payment (event date is renewal date of database) |
Free format text: PAYMENT UNTIL: 20130911 Year of fee payment: 4 |
|
| LAPS | Cancellation because of no payment of annual fees |