JP4231943B2 - System and method for optimizing database queries in two or more dimensions - Google Patents
System and method for optimizing database queries in two or more dimensions Download PDFInfo
- Publication number
- JP4231943B2 JP4231943B2 JP53775598A JP53775598A JP4231943B2 JP 4231943 B2 JP4231943 B2 JP 4231943B2 JP 53775598 A JP53775598 A JP 53775598A JP 53775598 A JP53775598 A JP 53775598A JP 4231943 B2 JP4231943 B2 JP 4231943B2
- Authority
- JP
- Japan
- Prior art keywords
- data object
- database
- data
- objects
- spatial
- Prior art date
- Legal status (The legal status is an assumption and is not a legal conclusion. Google has not performed a legal analysis and makes no representation as to the accuracy of the status listed.)
- Expired - Lifetime
Links
Images


Classifications
-
- G—PHYSICS
- G06—COMPUTING; CALCULATING OR COUNTING
- G06F—ELECTRIC DIGITAL DATA PROCESSING
- G06F16/00—Information retrieval; Database structures therefor; File system structures therefor
- G06F16/20—Information retrieval; Database structures therefor; File system structures therefor of structured data, e.g. relational data
- G06F16/22—Indexing; Data structures therefor; Storage structures
- G06F16/2228—Indexing structures
- G06F16/2264—Multidimensional index structures
-
- G—PHYSICS
- G06—COMPUTING; CALCULATING OR COUNTING
- G06F—ELECTRIC DIGITAL DATA PROCESSING
- G06F16/00—Information retrieval; Database structures therefor; File system structures therefor
- G06F16/20—Information retrieval; Database structures therefor; File system structures therefor of structured data, e.g. relational data
- G06F16/29—Geographical information databases
-
- Y—GENERAL TAGGING OF NEW TECHNOLOGICAL DEVELOPMENTS; GENERAL TAGGING OF CROSS-SECTIONAL TECHNOLOGIES SPANNING OVER SEVERAL SECTIONS OF THE IPC; TECHNICAL SUBJECTS COVERED BY FORMER USPC CROSS-REFERENCE ART COLLECTIONS [XRACs] AND DIGESTS
- Y10—TECHNICAL SUBJECTS COVERED BY FORMER USPC
- Y10S—TECHNICAL SUBJECTS COVERED BY FORMER USPC CROSS-REFERENCE ART COLLECTIONS [XRACs] AND DIGESTS
- Y10S707/00—Data processing: database and file management or data structures
- Y10S707/99931—Database or file accessing
- Y10S707/99933—Query processing, i.e. searching
- Y10S707/99934—Query formulation, input preparation, or translation
-
- Y—GENERAL TAGGING OF NEW TECHNOLOGICAL DEVELOPMENTS; GENERAL TAGGING OF CROSS-SECTIONAL TECHNOLOGIES SPANNING OVER SEVERAL SECTIONS OF THE IPC; TECHNICAL SUBJECTS COVERED BY FORMER USPC CROSS-REFERENCE ART COLLECTIONS [XRACs] AND DIGESTS
- Y10—TECHNICAL SUBJECTS COVERED BY FORMER USPC
- Y10S—TECHNICAL SUBJECTS COVERED BY FORMER USPC CROSS-REFERENCE ART COLLECTIONS [XRACs] AND DIGESTS
- Y10S707/00—Data processing: database and file management or data structures
- Y10S707/99941—Database schema or data structure
- Y10S707/99943—Generating database or data structure, e.g. via user interface
-
- Y—GENERAL TAGGING OF NEW TECHNOLOGICAL DEVELOPMENTS; GENERAL TAGGING OF CROSS-SECTIONAL TECHNOLOGIES SPANNING OVER SEVERAL SECTIONS OF THE IPC; TECHNICAL SUBJECTS COVERED BY FORMER USPC CROSS-REFERENCE ART COLLECTIONS [XRACs] AND DIGESTS
- Y10—TECHNICAL SUBJECTS COVERED BY FORMER USPC
- Y10S—TECHNICAL SUBJECTS COVERED BY FORMER USPC CROSS-REFERENCE ART COLLECTIONS [XRACs] AND DIGESTS
- Y10S707/00—Data processing: database and file management or data structures
- Y10S707/99941—Database schema or data structure
- Y10S707/99944—Object-oriented database structure
- Y10S707/99945—Object-oriented database structure processing
-
- Y—GENERAL TAGGING OF NEW TECHNOLOGICAL DEVELOPMENTS; GENERAL TAGGING OF CROSS-SECTIONAL TECHNOLOGIES SPANNING OVER SEVERAL SECTIONS OF THE IPC; TECHNICAL SUBJECTS COVERED BY FORMER USPC CROSS-REFERENCE ART COLLECTIONS [XRACs] AND DIGESTS
- Y10—TECHNICAL SUBJECTS COVERED BY FORMER USPC
- Y10S—TECHNICAL SUBJECTS COVERED BY FORMER USPC CROSS-REFERENCE ART COLLECTIONS [XRACs] AND DIGESTS
- Y10S707/00—Data processing: database and file management or data structures
- Y10S707/99941—Database schema or data structure
- Y10S707/99948—Application of database or data structure, e.g. distributed, multimedia, or image
Landscapes
- Engineering & Computer Science (AREA)
- Theoretical Computer Science (AREA)
- Databases & Information Systems (AREA)
- Data Mining & Analysis (AREA)
- Physics & Mathematics (AREA)
- General Engineering & Computer Science (AREA)
- General Physics & Mathematics (AREA)
- Remote Sensing (AREA)
- Software Systems (AREA)
- Information Retrieval, Db Structures And Fs Structures Therefor (AREA)
- Processing Or Creating Images (AREA)
Description
発明の背景
発明の分野
本発明は、コンピュータ・データベースに関する。特に、本発明は、2次元および3次元空間におけるオブジェクトの位置、サイズ、および形状を記述する情報を含むデータベースレコードに索引を付ける方法に関する。
関連技術の説明
データ構造の目的は、大量の情報を編成してコンピュータがデータ構造の内容を選択的に処理できるようにすることである。このための動機は単純である。すなわち、いつでも、時間的要件、プロセッサ速度、メイン・メモリ、ディスク・アクセス時間の点で一度にすべて処理できる以上のデータがある。データおよびアプリケーションの性質に応じて、データ編成戦略は、同様のプロパティを備えたサブセットに内容を区分すること、または高速ランダム・アクセス用の索引付けおよびハッシングをサポートするためにデータに順序付けを行うことができる。データべースおよびデータベース管理システムでは、このような概念を拡張し、構造化データの永続的記憶およびトランザクション制御編集を行えるようにしている。
2次元マップを記述するような空間データは、効率のよい編成の必要性の点ではまったく変わりはない。マップ・データは、この点では特に要求が厳しいものである。中位のサイズの地域社会の総合的な街路マップは、数万ないし数十万個の個々の街路セグメントからなることがある。ロサンジェルスまたはニューヨークの広域マップは、数百万個のセグメントを含むことがある。各マップ・データ・オブジェクトの内容もいくらかかさばる可能性がある。たとえば、個々の街路セグメントのレコードは、その終点の座標、使用法の分類、街路名、街路住所範囲、街路の左右側、法人都市名、郵便番号を含むことができる。
しかし、その中心部の空間データは、2次元空間内でオブジェクトを編成しようと試みるので、特に厄介な問題を提起する。空間座標は、互いに独立しているがほとんどの空間照会にとって同様に重要な2つ(またはそれ以上)の値からなる。確率されたデータ構造およびデータベース方法は、多次元空間の表現ではなく、単一の値を効率よく処理するように設計されている。
このような困難については、数十万個の空間オブジェクトからなるデータベース(家屋を取り囲む都市のマップ)からマップ・データの小さいウィンドウ(たとえば、家屋を取り囲む平方マイル)を提示するアプリケーションの作成という問題を検討することによって例示することができる。これを行うための動機は実際には2つの面がある。第1に、コンピュータ・モニタの典型的な解像度が限られており、所与の量の情報しか表すことができないことである。第2に、すべてのデータがモニタ内におさまる場合でも、この大量の情報を計算するためのデータ処理時間(取出し、変換、クリッピング、描画)は、平均的なパーソナル・コンピュータにとっては長すぎるものになるだろう。
この問題を解決するためには、モニタ上に生成される「ウィンドウ」内に現れる街路セグメントをすべて検出し、現れない街路セグメントについてはできるだけ多くのセグメントを回避することが有利である。したがって、x座標(または経度)値およびy座標(または緯度)値の特定の範囲内にあるすべてのオブジェクトが収集される。この問題は、一般に、矩形ウィンドウ検索と呼ばれ、より基本的なタイプの空間照会の1つである。この方法は、以下に示す編成方法のそれぞれの有効性を評価するための方法として以下の項で使用する。
最も厳重に調査され、一般的に使用されている空間データ構造(地理データおよび幾何データを編成するために使用するデータ構造)は、タイルベースの階層ツリーという概念を頼りにしている。このコンテキストにおけるタイルとは、座標空間の矩形(またはその他の規則正しい形状または不規則な形状の)区画であり、座標系のどの単一点も複数のタイル内に存在することがないように各区画はタイル同士を分離する明瞭な線を有する。階層ツリーは、座標空間全体を表すルートから開始して、その空間をより小さいタイルに再帰的に分解することにより、座標空間を分割するための構造の1つである。このシステムにおけるタイル間の「ハード・エッジ」とは、空間内のあらゆる点が正確に階層の各レベルの1つのタイル内に存在することを意味する。いかなる点も複数のタイルに共存することはできない。
周知の階層ツリーの一例は、クワッドツリー・データ構造である。一例のクワッドツリーは、地球の表面を表すことができるだろう。クワッドツリーのルートには、地球の表面全体を表すノードが存在する。次にこのルートは、緯度空間および経度空間の各象限を表す4つの子、すなわち、グリニッジより東で赤道より北、グリニッジより東で赤道より南、グリニッジより西で赤道より北、最後に、グリニッジより西で赤道より南という子を有することになる。グリニッジ子午線および赤道上の点は、1つの象限または残りの部分に属するものとして任意に定義される。これらの子のそれぞれは、より多くの象限、すなわち、その子の子などにさらに分割され、クワッドツリーに記憶すべきデータの量および密度をサポートするのに必要な区分度に至るまで分割される。
クワッドツリー構造の主な問題は、その構造がアンバランスになっていることである。ツリー内の各ノードのデータ記憶容量は制限されているので、その制限を上回る場合、ノードは4つの子に分割しなければならず、データ内容はツリーの下の方の凹部に押し込まれる。その結果、クワッドツリーの深さは、データ密度が低ければ浅くなり、データ密度が高ければ深くなる。たとえば、地球の表面上の人口の中心を検出するために使用するクワッドツリーは、大洋中央および極地域では非常に浅くなり(たとえば、少数のノードを有する)、米国の東部および南部などの地域では非常に深くなる(たとえば、多数のノードを有する)。
クワッドツリーは本質的にアンバランスなものなので、クワッドツリーの矩形ウィンドウ検索行動は予測が難しい。ソフトウェアにとっては、必要なデータを検出するために訪れなければならない可能性のある多くのノードがどの程度の深さにあるかを予測することは困難なことである。大規模な空間データベースでは、クワッドツリー階層で他のノードに移行するための各ステップは、通常、時間のかかるディスク・シークを必要とする。さらに、必要なデータをすべて検出するためには、ツリーの複数のブランチをたどらなければならないだろう。第2に、データ構造の内容が動的なものである場合、効率のよい空間管理は問題を含むことになる。というのは、各ノードは一定量の空間と一定の地域範囲の両方を有するからである。現実のデータ方式では、この2つが対応することはめったにない。このような問題を最小限にしようと試みるために、クワッドツリーの変形がいくつか存在する。しかし、依然として効率の悪さが持続する。
これまで、各空間オブジェクトが単一組の座標を含む場合に複数の点を含むデータ構造についてのみ説明してきた。線、曲線、円、多角形は、次元を有するので、さらに複雑さを増す。したがって、タイリング方式が極めて不自然なものでない限り、これらのオブジェクトはもはやタイル・ベースのデータ構造にきちんとおさまらなくなる。ある座標領域から他の座標領域へハード・エッジのタイル境界を横切るようなオブジェクトの部分が必ず存在することになる。ただし、これは、オブジェクトの記述の単純さにかかわらず真実であることに留意されたい。たとえば、線分はその2つの終点によって記述され、円はその中心点と半径によって記述される。
この問題を取り巻く単純で一般的に使用される方法は、タイル境界を横切るオブジェクトを複数のオブジェクトに分割することである。したがって、その終点が2つの隣接タイル内に含まれる線分は2つの線分に分割され、1つのタイルから始まり、そのもう一方の端部までの間に50個のタイルを通過する線分は、それが接触する各タイルごとの1つずつ、合計52個の線分に分解される。
この手法は、読取り専用である所与のアプリケーションにとっては有効な戦略になりうる。しかし、これは、動的内容を備えたデータ構造によっては不十分な戦略である。新しいデータ・オブジェクトの追加は比較的単純であるが、データの削除および変更はより難しい。元のオブジェクトが完全な状態のままであると保証されるわけではないので、問題が発生する。線分を移動または除去する必要がある場合、データベースが予想通りに動作するようにその線分を何とかして再構成しなければならない。これには、追加のデータベースブックキーピング、より複雑なアルゴリズム、それに付随する設計の単純さおよびパフォーマンスの低下が必要になる。
多次元オブジェクトの編成に関するもう1つの一般的な問題は、これらのオブジェクトの多くがいったん分解してしまうと数学的に記述するのが難しくなることである。たとえば、1つの円が4つの隣接する矩形タイルに重なるようにする方法は多数ある。配置によっては、同じサイズの円が2つ、3つ、または4つの異形片になる可能性がある。過度に断片化された線分の場合と同様、そのオブジェクトの本来の「自然な」特徴は完全に失われる。
代替戦略は、タイル境界を横切るオブジェクトを多様に参照する迂遠的方法(indirection)を使用することである。しかし、各参照ごとにそのオブジェクトを回復するための余分なステップが必要であり、同じ照会によって同じオブジェクトを複数回検索することができるが、解決するためには追加の複雑さが必要になる。データベース内のオブジェクトの数が大きくなると、この余分な迂遠レベルは費用がかかりすぎ、実行可能なシステムを作成することができなくなる。
クワッドツリーで使用するもう1つの戦略は、タイル境界を横切るオブジェクトをそれらが最終的におさまるまでツリーのより高いレベルに押し込むことである。この戦略の難しさは、より高いノードに含まれるマップ・オブジェクトの数が増加した場合、データベース操作によって上位ノードのすべてのオブジェクトを検査しないと、有用な情報を含む可能性の高いより小さいノードに探索を向けることができないことである。この結果、データを検出するために膨大な遅れ時間が発生する。
従来のDBMSにおける照会の最適化
前述のように、空間内のオブジェクトの位置、サイズ、形状を記述するデータは一般に空間データと呼ばれる。空間データの集合は空間データベースと呼ばれる。様々なタイプの空間データベースの例としては、マップ(街路マップ、地形図、土地利用図など)、2次元および3次元の建築図面、集積回路設計図などがある。
従来のデータベース管理システム(DBMS)では、所与のフィールドに特定のデータ値を有するレコードの検索を最適化するために索引付け方法を使用している。データベース内の各レコードごとに、対応する値を含むレコードに戻るためのポインタとともに関心のあるフィールドの値をツリーまたは同様の索引付けデータ構造内のキーとして記憶する。
データベース表1は、架空の企業の元従業員に関する情報を含む単純なデータベース表の例を示している。表内の各行は単一レコードに対応する。各レコードは単一の元従業員に関する情報を含む。表内の列は、その氏名や雇用開始日および雇用終了日を含む各元従業員に関する様々な事実を記憶する各レコード内のフィールドに対応する。

照会例1
1993年中に雇用されたすべての元従業員を検出するためのSQL
たとえば、最良ソート・アルゴリズムは通常、O(N×log(N))というコストで行われ、式中、Nはソートするレコードの数である。オブジェクトを管理するために使用するデータ構造(たとえば、データベース内の索引)の場合、Order関数は管理するオブジェクトの数に基づくものになる。たとえば、最良データベース索引付け方法は通常、O(log(N))という探索コストを有し、式中、Nはデータベースに記憶されるレコードの数である。所与のアルゴリズムは、別個であるが通常はまれな最悪ケースのコストも有するが、これは他のOrder関数によって示すことができる。オブジェクトの総数とは無関係な定数関数は関数O(K)によって示される。
Bツリーおよび同様の索引順次アクセス方式(すなわちISAM)は一般に、O(log(N))というコストによって所与のキー値へのランダム・アクセスを可能にするものであり、式中、Nは表内のレコードの数であり、また、O(K)という平均コストで後続レコードへの順次アクセスを可能にし、式中、Kは索引によりレコードを読み取るという不利益を表す小さい定数である(Kを最小限にするために、索引クラスタおよびキャッシュを含む様々な戦略を使用することができる)。したがって、照会例1を実行するための全コストはO(log(N)+(M×K))になり、式中、Mは照会を満足するレコードの数である。Nが大きく、MがNに対して小さい場合、索引を使用して照会を実行するためのコストは、表全体を走査するためのO(N)というコストより実質的に小さくなる。データ・表1は、NおよびMの様々な値について何らかのOrder関数による計算値を示すことによってこの事実を示すものである。この例は、極めて単純であるが、索引を使用して照会を最適化するという広く使用され一般的に受け入れられているデータベース管理の慣行を代表するものである。
式1
索引によりデータベース表から連続レコードを検索するためのコスト
照会例2
1993年中に就業していたすべての元従業員を検出するためのSQL
式2
開始値または終了値に関する従来のデータベース索引を使用する間隔に重なるすべてのレコードを検索するためのコスト
2次元空間データの概説
空間データベースは、関連オブジェクトの数が膨大であるため、効率のよいデータベース管理を特に厳しく要求している。中位のサイズの地域社会の総合的な街路マップは、数万ないし数十万個の個々の街路ブロックからなる可能性があり、カリフォルニア州ロサンジェルスまたはニューヨーク州ニューヨークの広域マップは、百万個以上の街路ブロックを含む可能性がある。同様に、最新の集積回路の設計図も数百万個のコンポーネントを含む。
図1は、X軸とY軸を有する座標平面を示している。以下に示す例のため、平面のサイズは200×200座標単位になるように選択し、X軸とY軸の両方について最小座標値および最大座標値をそれぞれ−100および100とする。ただし、以下の例について述べる原理は、平面、円柱表面、球面の各座標系を含みかつこれに限定されない任意のサイズのいかなる有界2次元座標系についても適用可能であることに留意されたい。最小緯度値および最大緯度値が−90度および+90度であり、最小経度値および最大経度値が−180度および+180度である地球表面の緯度/経度座標系はこのような球座標系の一例である。
図2は、図1の平面上における点の分布を示している。前述のように、点は最も単純なタイプの空間データ・オブジェクトである。その空間記述は座標位置情報のみからなる。一般に点オブジェクトに関連する非空間記述の例としては、その位置にある事業所の名前とタイプ、たとえば、「レオンズ ビービーキュー」または「レストラン」を含む可能性がある。
図3は、マップを表す線形および多角形空間データ・オブジェクトの分布を示している(ただし、「Hwy 1」および「Hwy 2」というテキスト・ストリングはそれ自体は空間データ・オブジェクトではなく、むしろそれに対応するオブジェクトに近接配置されたラベルであることに留意されたい)。線形および多角形データ・オブジェクトの空間記述はより複雑なものになる。というのは、座標系におけるそれぞれの位置に加え、サイズおよび形状情報を含むからである。一般に線形マップ・オブジェクトに関連する非空間記述の例としては、その線が表す街路の名前と住所範囲、たとえば、「100-199メインストリート」を含む可能性がある。また、一般に多角形マップ・オブジェクトに関連する非空間記述の例としては、多角形オブジェクトの名前とタイプ、たとえば、「ミシガン湖」、「大きい湖」になる。
図4は、様々な線形および多角形空間データ・オブジェクトの最小境界矩形(MBR)を示している。ある空間データ・オブジェクトの最小境界矩形は、そのオブジェクトを完全に含み、座標軸に直交する最小矩形である。最小境界矩形は、通常、その空間記述に現れる最小座標値および最大座標値の単純な検査によって非常に容易に計算できるものである。空間データ記憶検索方法では、最小境界矩形を使用して、オブジェクトの近似位置およびサイズを表す場合が多い。というのは、その単純な内容(2対の座標)が非常に効率のよい処理に向いているからである。
従来のデータベース管理システムにおける2次元空間データの記憶
データベース表3は、図2の点の一部を正規のデータベース表に表す方法を示している。データベース表3の点は、図2に示す点のうち、*マーカで示した点のサブセットに対応する。照会例3は、矩形ウィンドウ内のすべての点を取り出すSQL照会を示している。矩形ウィンドウ照会は、一般に使用される幾何照会タイプのうちの最も単純なタイプである。検査によって、「エミリーズ ブックストア」がこの照会によってデータベース表3から選択される唯一のレコードであることが明らかになる。図5は、図2に示す点の上に重ねられた照会例3に対応する矩形ウィンドウを示している。
ウィンドウ内のすべての事業所を検出するためのSQL
照会を開始するのに必要な作業は対数であるが、オーバーサンプリングが行われる点オブジェクトの予想数は、式3が示すように、データベース内の点オブジェクトの数の線形関数になる。これは、データベース内のオブジェクトの数が増すにつれて、この照会のパフォーマンスが直線的に低下する傾向があることを意味する。データ・ボリュームが大きくなると、この線形行動は好ましいO(log(N))よりかなり悪くなり、このスタイルの解決がまったく無効になる。Yに基づく索引の場合も同じ問題が発生する。この問題の根本的原因は、2次元空間座標が互いに独立しているがほとんどの空間照会の場合に同じように重要な2つの値(XとY)からなることである。従来のデータベース管理技法は、2次元データの処理にはあまり適していない。
式3
ほとんど均一なXの分布を想定し、従来のデータベース索引付け方法を使用して2次元矩形ウィンドウ照会を実行するための平均コスト
従来のデータベース管理方法が空間データに関して問題を抱えているので、その結果、空間データ構造と呼ばれる様々な専用データ記憶検索方法が開発された。ハナン サメットによる空間データ構造の設計及び分析(The Design and Analysis of Spatial Data Structures)には、このような方法の多くに関する検討内容が記載されている。一般に使用される空間データ構造の多くは、タイル・ベースの階層ツリーの概念を頼りにしている。
図7は空間の矩形再帰的分解を示しているが、図8はその分解によって形成されたタイルを編成して「ツリー」(探索のために設計された階層データ構造)を形成する方法を示している。このタイプのデータ構造はクワッドツリーと呼ばれる。図9は、このクワッドツリーの「リーフノード」に分散された図2の点を示している。
図10は、照会例3の矩形ウィンドウ検索が接触するクワッドツリーのサブセットを示している。ただし、クワッドツリー内で検査しなければならない2つの下位レベル・ノードと、図6に示すように従来のデータベース索引付けを使用して検査しなければならない長いストライプとのコントラストに留意されたい。図10の2つのノードからの点のうち、すべての検査済みの点は、少なくともこの矩形の近傍にあり、図6のストライプの内側のいくつかの点は文字通り座標系の向こう側のエッジ(底部)にある。この例は単純なので検査済みの点の数の差は大きくないが、点オブジェクトの数が非常に大きい場合はパフォーマンス・コントラストが劇的なものになる。クワッドツリーは、座標系の両方の軸に沿って同時に索引を付けるので、位置ベースのデータを記憶するのに非常に適したものである。
クワッドツリーの最も基本的な実施態様では、階層内の各タイルは、そのタイルに関連する情報を含む「レコード」に対応する。そのタイルがルートまたはブランチ・レベルにある場合、対応するレコードは、各子タイルに関するレコードの座標およびそのレコードを指すポインタを含むことになる。タイルがリーフ・レベルにある場合、対応するレコードは、タイルの外周内に幾何学的に含まれる空間データ・オブジェクトのサブセット(点、線、または多角形オブジェクトおよびその属性)を含む。クワッドツリー・データベースの「レコード」は、ルートがファイルの先頭になり、幅優先または深さ優先の順序でディスク・ファイルに記憶される。また、一部の空間データ・オブジェクトを階層のより高いレベルに保持し、ほとんどまたは完全に空であるリーフおよびブランチ用のレコードは実際には作成しないような様々な変形例が存在する。たとえば、図9のリーフ133および144はどちらも空である。
クワッドツリー・データ構造の利点は、データの空間密度がかなり均一である場合にO(log(N))というコストを示し、その結果、うまくバランスの取れたツリーが得られることである。このバランスは、ブランチの量を制御する構成アルゴリズムによって推進される。クワッドツリー内のブランチの量(したがって、最大深さ)は、空間データ・オブジェクトの局所密度と、リーフ・レベル・レコードに収容可能なこのようなオブジェクトの最大数との相互作用によって推進される。具体的には、リーフ・レコード内のデータ記憶が一杯になると、そのリーフは4つの子に分割され、それに応じてその空間データ・オブジェクトは幾何学的封じ込めによって再配分される。これが行われるたびに、ツリーの局所高さは1だけ大きくなる。しかし、このアルゴリズムの行動の結果、局所データ密度が非常に高くなり、そのため、ツリーの深さが過大になったことによりクワッドツリーのパフォーマンスがO(N)というコストに向かって低下する。
また、座標系内のハード・エッジ・タイルの非階層的使用法は多種多様である。このような方法の1つでは、タイルを順序付けるために空間充填曲線を使用する。図11は、ペアノ−ヒルベルト曲線を使用して4×4のタイリングを順序付ける方法を示している。この結果得られるタイルは、一方の側に50ユニットになる。このように順序付けられたタイルは、クワッドツリー内のリーフと同様のレコードに記憶することができ、各レコードに記憶されたデータはタイルの外周内に含まれるサブセットに対応する。レコードは、タイル番号をレコード位置に変換する表によって簡単に索引を付けることができる。
また、このタイルは、タイルのメンバーシップを割り当てるための単純な計算フレームワークとして使用することができる。データベース表4は、図11からの対応タイル番号フィールドによって強化された事業所位置データベース表を示している。タイル番号は、その点を含むタイルのXおよびYの列番号および行番号の2進表現を計算し、周知のペアノ−ヒルベルト・ビットインタリーブ・アルゴリズムを適用してシーケンス内のタイル番号を計算することによって決定される。タイル番号フィールド上の索引を構築することにより、従来のデータベースにレコードを記憶する場合でも、そのレコードを幾何学的照会によって効率よく探索することができる。たとえば、タイル番号8または9によってマークされたレコードだけを検査することにより、照会例3に示す矩形ウィンドウSQL照会を満足できることを計算することは可能である。
式4
データベース表に埋め込まれたタイル番号を使用するウィンドウ検索の予想コスト
検索あたりのタイルの予想数
タイルあたりの点の予想数
すべてのタイル・ベース方式が抱える問題は、図12および図13が示すように、より高次元のオブジェクト(セグメント、ポリライン、多角形)は点のようにきちんとはその方式に適合しないことである。図12は図3からの線形および多角形データ・オブジェクトがクワッドツリー例の様々なノードに自然に分かれる様子を示している。ただし、クワッドツリーのより高いレベルにどれだけ多くのオブジェクトが存在するかに留意されたい。具体的には、下位レベルのタイル境界の1つを横切るオブジェクトはツリー内の次に高いレベルに保持されなければならない。というのは、そのタイルは、そのオブジェクトを完全にカバーする最小タイルであるからである。これは、単一エンティティとして境界を横切る可能性のあるオブジェクトを収容するためにクワッドツリー・タイル階層が有する唯一の方法である。
図13は、階層ツリーを上へ移動するデータが矩形ウィンドウ検索例に及ぼす劇的影響を示している。線形および多角形データは位置に加え、サイズを有するので、一部の実質的なサブセットは必ずタイル境界をまたぐことになる。データベース内のオブジェクトの数が増大するにつれて、クワッドツリーの上位ノード内に存在するオブジェクトの数も増大し、その結果、構造を使用するというパフォーマンス上の利点が損なわれることになる。この問題は、すべてのハード・タイル境界方法(クワッドツリー、K−Dツリー、グリッドセル他)が分担している。
タイル境界をまたぐオブジェクトを管理するという問題に打ち勝つために使用する主な方法は、1)タイル境界を横切るオブジェクトを複数の断片に分割し、それによりデータ・オブジェクトを適合させること、2)オブジェクトが接触する余分なタイルごとに1回ずつそのオブジェクトを複製すること、3)それが接触する各タイルごとに1回ずつ各オブジェクトを間接的に参照することの3通りがある。特に、断片化は、読取り専用マップ・データ・アプリケーションで最も頻繁に使用されるものである。これらの各方法はそれぞれの長所を有するが、そのすべてが分担している弱点は、特に空間データベースの内容を動的に編集しなければならないときにインプリメンテーションの複雑さが大幅に増すことである。ただし、これらの技法は違反オブジェクトのそれぞれに適用する必要があり、このオブジェクトは、図13の中間レベルおよび上位レベルのノードのオブジェクト集団が示すように、データベースの相当な部分になる可能性があることにも留意されたい。
Rツリー(またはレンジツリー)は、線形および多角形データの複雑さに対処するように特に進化したデータ構造である。クワッドツリーと同様に、Rツリーは、1つのルートと、実際の空間データを含むリーフに至る複数のブランチ・レベルからなる階層探索構造である。平面のトップダウン正規分割から構築されるクワッドツリーとは異なり、Rツリーは、空間データ・オブジェクトの不規則性に適合するようにボトムアップで構築される。リーフレベル・レコードは、同様のサイズおよび局所性を有するデータ・オブジェクトをまとめて収集することによって形成される。各レコードごとに、レコード内のセット・オブジェクトの最小座標値および最大座標値を定義する最小境界矩形が計算される。次に、同様のサイズおよび局所性を有するリーフ・レコードは小枝レベルのレコード内に収集されるが、このレコードは、それぞれの子レコードの最小境界矩形とその子レコードを指すポインタのリストと、集合全体を取り囲む追加の最小境界矩形からなる。次に、このような小枝レコードをまとめて収集して次のレベルのブランチを形成し、ツリーが単一ルート・レコードに収束するまで繰り返す。うまくバランスの取れたRツリーはO(log(N))という効率を示す。
Rツリーの難しさは、ツリーを構築するためにどのようにデータ内容がまとめて「適合する」かによってその定義が決まるので、Rツリーを構築し維持するためのアルゴリズムが複雑になり、そのデータ内容に非常に敏感になる傾向があることである。データ内容が変化しないようなRツリーの静的アプリケーションは実現するのに最も容易なものである。データが絶えず変更されるような動的アプリケーションはかなり難しいものである。これは、幾分、空間データの幾何学的記述を変更するような編集操作が包含レコードの最小境界矩形を変更する可能性を暗に有するからであり、それが親の小枝レコードの最小境界矩形に影響し、ルートに至るまで次々に影響する可能性があるからである。したがって、どの操作もツリー構造の大幅な再編成を引き起こす可能性があり、その構造はO(log(N))という効率を維持するためにうまくバランスが取れた状態を保持しなければならない。
要約すると、様々な専用データ構造は、多次元空間データ記憶の特定の要件を満足するように進化してきた。これらの技法は2次元空間データに関連する問題の一部を効果的に解決するが、連続範囲の値を表すデータを扱うときに1次元の方法が有するのと同じ固有の弱点も分担している。1次元の場合、問題データ・オブジェクト・タイプは単一変数の閉区間、たとえば、時間区間である。2次元の場合、線、円、多角形などの問題データ・オブジェクト・タイプは、2つの変数の閉区間によって記述される。
3次元およびより高次元の空間データ構造の説明
3次元表面を記述する空間データには、効率よく編成するための同様の要件がある。追加された複雑さとしては、3次元空間データが同等の重みを有する3つの独立変数(X、Y、Z)からなることである。線、表面、ボリュームの3次元の幾何学的記述も2次元の線および多角形より複雑なものになり、このため、データはいくらかかさが増すことになる。
しかし、3次元の基本データベース編成問題は基本的には2次元空間のものと同じであり、したがって、非常によく似た解決策に従うことになる。クワッドツリーと同等で、3次元空間の正規立方分割を使用する3次元技術が存在する。オラクル社では、点オブジェクトを記憶するためのその「HHCODE」技術の3次元バージョンも実現した。また、Rツリーと同等で、3次元最小境界枠を使用してリーフおよびブランチの座標範囲を定義する3次元技術も存在する。これらの技術も、連続する3次元区間を表すデータを処理するときに1次元および2次元技術と同じ制限を分担する。
また、同じ原理はより高次元のデータにも適用される。特に、オラクル社では、最高11次元までの点オブジェクトに対処するためにその「HHCODE」技術を拡張した。
前述のように、データベース内の多次元空間データを効率よく編成し、索引を付けることに関連する問題がいくつかある。このため、空間データを凝視するための改良された方法が有利になるだろう。この利点は、本発明のシステムによって提供される。
発明の概要
前述のように、情報のデータベースは数百メガバイトのデータを含むことができ、それにより、効率よく探索するのが非常に困難になる。しかし、本発明の方法およびシステムによって記憶される多次元データは、従来のシステムよりかなり少ないプロセッサ・サイクルおよびディスク・シークで検索することができる。
従来、大量の空間データを編成するための1つの方法は、まず、空間データの上に座標系を重ねることであった。空間データベース内の各オブジェクトにはX座標とY座標が割り当てられるはずである。線、多角形、その他の形状など、より大きいオブジェクトには、そのオブジェクトをその位置に保持するためのアンカーのように機能する座標系内の単一位置点が割り当てられるはずである。たとえば、線はその一方の端部に対応する位置点を有する可能性があり、そのオブジェクトの残りの部分はもう一方の端部のX座標とY座標、線の太さ、カラー、その他の特徴に関する情報を含むはずである。このようにして、空間データベース内の各オブジェクトは、そのオブジェクトがデータベース内でどのくらいの大きさであっても、単一位置点を有するはずである。
より大きい座標系を小区域に分割することにより、特定の小区域に各位置点を割り当てることができるだろう。このような小区域は、1組の空間データを含む座標系の上に重ねられた一連のタイルに似ているので、タイルと呼ばれる。したがって、各タイルは、特定の1組の空間データを保持するだろう。その結果、どのタイルが所望の情報を保持しているかを知っているユーザだけがその特定のタイルを探索すればよかった。コンピュータ・ユーザが空間データベース内の所望の領域内の空間データを識別すると、システムは、メモリからこのいくつかのタイルを読み取り、そのタイルからオブジェクトを収集するプロセスを開始した。この方法では、それにより、システムがコンピュータ・ユーザのすべての要求に対してデータベース全体のすべてのオブジェクトを分析するのを防止していた。
データ・オブジェクトにタイル番号を割り当てるというこのシステムは点のみを含むデータにはうまく機能していたが、より大きいデータ・オブジェクトが関連すると非常に遅くなった。より大きいデータ・オブジェクトは空間データベース内の線、円、多角形になる可能性がある。空間データ・オブジェクトの編成に関連する多くの問題は、オブジェクトが多くのタイルを横切る場合にこれらのオブジェクトを唯一のタイルに割り当てるという難しさを処置しなければならなかった。たとえば、3つのタイルを横切る長い線は多くの問題を提起する可能性がある。その長い線には特定のタイルが一切割り当てられていないので、その線は間違ったタイルかまたは一連のタイルに割り当てられる可能性がある。線などのオブジェクトを複数のタイルに割り当てると、このような関連付けのすべてをコンピュータ・システム内で維持しなければならないので、膨大なコンピュータ・オーバヘッドが発生する。
一実施の形態によれば、空間データベース内のすべてのタイル間に一連のオーバラップを設けることにより、このような従来の問題が低減される。このようなオーバラップ・タイルは、ここでは「シングル(shingle)」と呼ばれ、それぞれの最も近い4つの隣接物にオーバラップするタイルを表す。どのシングルについてもオーバラップの面積は、最大効率をもたらすようにあらかじめ決定することができる。たとえば、マップ・データを保持する空間データベースは、10平方マイルというシングル・サイズを有し、各シングル・オーバラップが5平方マイルを含むようにプログラミングすることが可能である。したがって、あらゆるシングルは、隣接シングルのサイズに等しい、その最も近い4つの隣接物とのオーバラップを有することになるだろう。このシングル・オーバラップにより、空間データベース内のより多くのデータ・オブジェクトを唯一のシングルに割り当てることができ、複数のハード・エッジ・タイル間で分割されない。前述のように、1つのオブジェクトを複数のタイル間で分割することは非常に不利なことである。というのは、特定のオブジェクトに割り当てられたすべてのタイルをシステムが追跡しなければならないからである。
したがって、層状シングル構造の目的は、データベースへの空間照会を適時にかつ効率よく解明するための論理フレームワークを提供することである。空間データ構造は、空間データ・セット内のオブジェクトに索引を付けるための編成を可能にする概念構造である。層状シングル構造は、有用かつ効果的になるように特定のコンピュータ・データ構造で実施する必要はない。層状シングル構造は、空間におけるそれぞれの同様の位置およびサイズに基づくサブセットに線、四角形、多角形などの1組の空間データ・オブジェクトを編成するための計算ツールの一部である。さらに、層状シングル構造は、データベースへの特定の空間照会が要求する必要かつ十分な空間データ・オブジェクトを含むデータベースのサブセットを識別するためのメカニズムを提供することができる。
本発明のシステムおよび方法は、タイトル境界を横切る小さいオブジェクトがツリーのより上位レベルへ移動するという従来システムで見られた問題を軽減する。一実施の形態では小区域の層が生成され、オーバラップする領域ができるようにタイルが計算される。したがって、タイル間にはいかなるハード・エッジも存在しないか、あるいは1つのオブジェクトが2つのタイル内に同時に存在する可能性がある。このようなオーバラップした小区域はシングルと呼ばれる。シングルは、たとえば、その最も近い近隣物の半分とオーバラップする可能性があるので、大きいシングル領域におさまるオブジェクトは、可能な限り最低のレベルにとどまることになる。本発明のもう1つの利点は、空間データベースに対して最高速アクセスを行えるように各層のシングル・オーバラップ・サイズを事前にプログラミングすることができるので、個々のデータベースの効率が改善されることである。
街路などの多数の小さいオブジェクトを伴うデータベースは、フリーウェイなどの多数の大きいオブジェクトを有するデータベースより小さいシングル・オーバラップ・サイズでプログラミングすることができる。シングルおよびオーバラップ領域のサイズを平均データ・オブジェクトのサイズに応じて調整すると、より多くのデータ・オブジェクトが本発明のデータベースアーキテクチャ内の単一の下位レベルに保持される。しかし、1つのシングル内におさまることができないデータ・オブジェクトは、次に高いレベルのシングルに記憶させることができる。
たとえば、第1のレベルのシングルは、5平方マイルのシングル・サイズを有し、マップ・データベースを10000個のシングルに分割する可能性がある。しかし、第2のレベルのシングルは、10平方マイルのシングル・サイズを有し、マップ・データベースを2500個のシングルに分割する可能性がある。これについては、図12を参照して以下により具体的に説明する。
本発明の実施の形態は、マップ・データベース内の空間データ・オブジェクトを編成する方法であり、データ・オブジェクトを領域内の位置点としてある座標系に対して基準付けする(referencing)こと、その領域を複数の小区域に分割すること、およびオブジェクトのいずれの部分も所定の量だけその小区域の外に延びていない限り、その位置点がその1つの小区域内に入っているデータ・オブジェクトをその小区域に割り当てることを含む。
本発明の他の実施の形態は、空間データ・オブジェクトをコンピュータ・メモリに記憶する方法であり、(1)座標系内の各データ・オブジェクトのサイズを決定するステップと、(2)各空間データ・オブジェクトを座標系内の位置点に割り当てるステップと、(3)座標系内の各点が少なくとも1つの小区域に割り当てられるように座標系のオーバラップ小区域の第1の層の境界を計算するステップと、(4)第1の層内の前記小区域のサイズより小さい各空間データ・オブジェクトに、各空間データ・オブジェクトの位置点に基づいて座標系の特定の小区域を参照させるステップと、(5)特定の小区域に対するその参照とともに空間データ・オブジェクトをコンピュータ・メモリに記憶するステップとを含む。
【図面の簡単な説明】
図1は、2次元空間における座標平面を示す図である。
図2は、図1の座標平面上の点空間データ・オブジェクトの分布を示すコンピュータ・データベースの図である。
図3は、図1の座標平面上のマップを表す線形および多角形空間データ・オブジェクトの分布を示すコンピュータ・データベースの図である。
図4は、コンピュータ・データベース内の線分、ポリライン、多角形に対応する最小境界矩形を示す図である。
図5は、図1の座標平面上の矩形ウィンドウ検索を示す図である。
図6は、図1の座標系を示す図であり、従来のコンピュータ・データベース索引付け方式が座標平面内の空間分布データの探索に適用されている。
図7は、図1の座標平面の正規象限ベースの分解を示す図である。
図8は、コンピュータ・データベース用のクワッドツリータイプの空間データ構造を形成するために図7の座標平面分解の象限および小象限を編成する方法を示すツリーの図である。
図9は、コンピュータ・データベースの空間データ構造におけるクワッドツリー・ノードへの点データ・オブジェクトの分散を示す図である。
図10は、コンピュータ・データベースのクワッドツリーベースのデータ構造に適用された矩形ウィンドウ検索の図であり、2次元点データを管理する場合にこのデータ構造が有効であることを示す図である。
図11は、ペアノ−ヒルベルト空間充填曲線を計算することにより、コンピュータ・データベースが正規象限ベースのタイリング方式を使用して2次元データを編成する方法を示す図である。
図12は、線形および多角形空間データ・オブジェクトがクワッドツリーとして編成されたコンピュータ・データベースの2次元データ構造におさまる様子を示す図である。
図13は、クワッドツリーとして編成され、線形および多角形データを含むコンピュータ・データベースに適用された矩形ウィンドウ検索の図である。この図は、2次元データをこのタイプのデータ構造に編成し、固有のサイズを有する空間データを管理することが無効であることを示している。
図14は、座標平面に適用された3レベルの層状シングル構造を有するコンピュータ・データベースの編成を示す図である。
図15は、本発明の層状シングル構造を使用して編成されたコンピュータ・データベースに分散された線形および多角形マップ・データ要素を示す図である。
図16は、本発明の層状シングル構造に適用されたコンピュータ・データベース用の矩形ウィンドウ検索の図であり、サイズを有する空間データを管理する場合にこのデータ構造が有効であることを示す図である。
好ましい実施の形態の詳細な説明
次に添付図面を参照するが、図面全体を通して同様の番号は同様の部分を示す。また、便宜上、以下の説明は、概要、関数の説明、データベース表内のインプリメンテーション例、経験的分析、数学的分析、結論という主な項として編成する。
1.概要
本発明は、大量のデータを編成するための方法およびシステムである。本発明の実施の形態を示すために使用する例はマップ・データを編成するためのものであるが、この技法は他のタイプのデータにも適用可能である。適用可能な他のデータ・タイプとしては、機械製図および建築図面、アニメーションおよびバーチャル・リアリティ・データベース、ラスタ・ビットマップのデータベースなどがある。
さらに、添付図面では2次元のオブジェクトを表すデータを編成するために使用可能な本発明の実施の形態を示しているが、本発明は3次元またはそれ以上の次元のオブジェクトに関するデータの編成にも適用可能である。
したがって、前述のように、層状シングル構造の目的は、コンピュータ・データベースへの空間照会を適時にかつ効率よく解明するための論理フレームワークを提供することである。層状シングル構造は、有用かつ効果的になるように特定のコンピュータ・データ構造で実施する必要はない。層状シングル構造は、空間におけるそれぞれの同様の位置およびサイズに基づくサブセットに線、四角形、多角形などの1組の空間データ・オブジェクトを編成するための計算ツールの一部である。さらに、層状シングル構造は、データベースへの特定の空間照会が要求する必要かつ十分な空間データ・オブジェクトを含むデータベースのサブセットを識別するためのメカニズムを提供する。さらに、層状シングル構造は、好ましい一実施の形態ではIntel(R)プロセッサ・ベースのコンピュータ・システムで動作することができる。しかし、Apple(R)、DEC(R)、IBM(R)が販売しているような他のコンピュータ・システムも本発明の範囲内で機能することが予想される。
図14は、それが図1に示す座標平面例に適用されるはずなので、3レベルの層状シングル構造を示す図である。この層状シングル構造は、図7に示す座標平面の正規象限ベースの分解と同様のものである。しかし、各レベルのデータ構造が別個のハードエッジ・タイルで編成されるのではなく、各レベルはオーバラップ・シングルからなる。隣接シングル間のオーバラップについては、以下に詳述するが、図14では陰影付きバンド22で示す。ただし、他の構成は可能であるが、座標軸に対して垂直の正規オーバラップ四角形または矩形によって形成されるシングル1〜18は、最も理解しやすく、実現しやすいものであることに留意されたい。
層状シングル構造の最も微細なレベル(図14のシングル1〜16)は、空間データの大多数のための索引付け媒体として機能するように設計されている。したがって、データ・オブジェクトの大多数がデータ構造のこのレベルのシングルに割り当てられることが望ましい。したがって、空間オブジェクトは、所定の量を上回る量だけ、シングルの中央部分のエッジを越えて延びる(たとえば、そのオーバラップは階層内の次に高い層に割り当てられることになる)。その最も微細なレベルの細分性(シングルのサイズおよびオーバラップの量)は、そのレベルのシングルに「おさまる」空間データ・オブジェクトの数を最小限にする場合(シングルのサイズを増大することによって実施する)と分割の程度を最大限にする場合(シングルのサイズを低減することによって実施する)の競争傾向間のバランスを取るように調整することができる。より粗大なレベルのシングル(シングル17〜20からなる図14のシングル・レベル)は、その最も近い隣接物とのシングル付きオーバラップを含み、最も微細なレベルにおさまらないオブジェクト(すなわち、空間的に大きすぎて特定のタイル内におさまらないオブジェクト)のための代替索引付け媒体として機能する。ただし、オーバラップの絶対サイズは、連続的により粗大になる各レベルのタイル・サイズが増大するにつれて増大することに留意されたい。最後に、大きすぎてデータ構造の他のタイル内におさまらないような少数のオブジェクトを割り当てるために使用する最上位レベルのシングル21(図14)が存在する。
図15は、図3に示す線形および多角形オブジェクトのそれぞれを本発明の層状シングル構造データ内に編成する方法を示す図である。以下に説明するように、各シングルは同様の位置およびサイズを有するオブジェクトのサブセットを含む。本発明のデータ構造によって提供される正規オーバラップ・タイルの利点は、図15の本発明のデータ構造編成と図12のデータ構造編成を比較することによって分かるだろう。このシングル付きオーバラップ・システムにより、従来技術のデータ構造の任意のタイル境界上に位置していた小さいデータ・オブジェクト(図12のタイル100、110、120、130、140内の集団の大部分)は層状シングル構造の最低レベル内にとどまることができる。具体的には、所与のレベルのオーバラップのサイズより小さいオブジェクトは、そのレベルまたはそのレベルより下にある何らかのシングルにおさまることが保証されている。さらに、シングル・オーバラップより大きい多くのオブジェクトは、それより下のレベル内におさまることができる。たとえば、図15のシングル1、6、9は、このようなオブジェクトでほとんど占められている。ただし、同じオブジェクトの図12における位置に留意されたい。データ・表2は、図15対図12のデータ・オブジェクト分割の数値比較を示している。
図16と図13を対照すると、層状シングル構造によってもたらされる改良された分割方式によって、従来技術に基づく同等の構造より矩形ウィンドウ照会パフォーマンスが改善される理由が分かる。データ照会中に検査する必要があるタイルの数は図13の5から図16の7にわずかに増加しているが、検査しなければならないデータ・オブジェクトの数はほぼ半分だけ(16対31)低下している。この低下は、まさに、各区画のサイズがわずかに増大したことによって、より多くのオブジェクトがより微細な区画レベルにおさまることができるためである。前述のように、空間データ照会は、その照会のパラメータを満足する各タイル内のあらゆるオブジェクトを検査しなければならない。したがって、図13の場合、最上位レベル・タイル100内の各データ・オブジェクトを検査して、それが空間データ照会のパラメータを満足するかどうかを判定しなければならない。本発明の方法によって編成されると、このように多くのデータ・オブジェクトがより小さいタイル構造内に存在できるので、空間データ照会中に検査すべきデータ・オブジェクトの数は少なくなる。このため、本発明のシステムによって編成されるコンピュータ・データベースは、従来技術のシステムより高速で探索することができる。
ただし、実際には、図12および図13に示す従来技術に基づく同等の構造はめったに実現されないことに留意されたい。これは、上位レベルに固定されたオブジェクトの数が多すぎて、妥当なパフォーマンスを可能にするには負担になるからである。むしろ、ハード境界方法は、タイル境界で個々のデータ・オブジェクトを断片化すること、オブジェクトが接触する各タイルごとに1回ずつそのオブジェクトを複製すること、オブジェクトが接触する各タイルごとに1回ずつそのオブジェクトを間接的に参照することを含む、代替戦略を頼りにしている。
本発明の好ましい実施の形態は、2通りの主なクラスの関数を提供する。第1のクラスであるシングル割当て関数は、空間データ・オブジェクトの空間記述を「シングルキー」に変換するものである。シングルキーは、層状シングル構造内の特定のシングルを一意的に表す数値である。第2のクラスである照会制御関数は、所与の共通幾何照会の照会指定を、照会を満足するために必要なデータを「含む」必要かつ十分なシングルキーのリストに変換するものである。
付録Aには、Cプログラミング言語で作成された本発明の好ましい一実施の形態が記載されている。所定の最小境界矩形の場合のシングルキーを計算する1つのシングル割当て関数KeyForBox(0507行から始まる)と、矩形ウィンドウ照会を解決するために必要なすべてのシングルキーをまとめて計算して返す1つの照会制御関数セット、すなわち、KeyRectCreate(0703行)、KeyRectRange(1030行)、KeyRectDestroy(1125行)が存在する。KeyForBox関数呼出しとKeyRectCreate関数呼出しはどちらも、それぞれに対応する空間記述パラメータが小数を伴う経度(X1およびX2)および緯度(Y1およびY2)座標で表されるものと予想する。また、これらの関数はどちらも、層状シングル構造にどちらのレベルを含めるべきかを制御するnLevelMaskと、隣接シングル間のオーバラップの量を制御するnLevelLapという2つの追加パラメータを取る。付録Aに含まれるインライン・ドキュメンテーションには、パラメータの用法が詳細に記載されている。
ただし、KeyForBoxとKeyRectCreateのどちらの場合も、倍精度の経度/緯度座標が直ちに固定小数点整数表現に変換され、360度分の経度が28ビットの整数X座標で表され、180度分の緯度が27ビットの整数Y座標で表されることに留意されたい。この表現の分解能は概略で地上の最も近い1/2フィートの精密さである。倍精度から固定小数点へのこの変換により、シングル封じ込めとペアノ−ヒルベルト・シングル順序付けの両方を計算するために非常に効率のよいモジュール2進算術演算を使用することができる。
便宜上、この項の残りの部分は、以下のようにシングル割当て関数、照会制御関数、従来のデータベース内でのインプリメンテーションという3つの項に分割する。
2.1 シングル割当て関数
シングル割当て関数によって生成されるシングルキーは、1組の空間データのメンバをサブセットに分割するために使用するが、この場合、1つのサブセットのすべてのメンバは同じシングルキーを有する。これは、1つのサブセットの各メンバを同じシングル上に「おさめる」ことができることを意味する(たとえば、そのオブジェクトを含む最小境界枠のサイズがタイルより大きくない)。さらにこれは、1つのサブセットのすべてのメンバが同様の空間サイズと位置を有することを意味する。したがって、シングルキーによって記憶メカニズム内のデータに索引を付けてクラスタ化すること(効率を改善するための共通のデータベース管理慣行)は非常に効果的である。というのは、通常、空間照会は同様の位置およびサイズを有する複数のオブジェクトを1つのグループとして選択するからである。
手順表1は、特定の空間データ・オブジェクトに対応するシングルキーを導出する1組の計算ステップを示している。この表内のステップは、付録AのKeyForBox関数の0536〜0652行に対応する。これらのステップの一部については、後続パラグラフで詳述する。
手順表1のステップ4では、候補シングルの最大点(右上隅)が計算される。この点は、現行レベルの標準シングル幅をx座標に加え、現行レベルの標準シングル高さをy座標に加えることによって、シングルの最小点から直接決定することができる。付録Aでは、この計算はKeyForBox関数の0598〜0601行で行われる。付録Aで使用する層状シングル構造はオーバラップ四角形に基づくものなので、各座標に同じ値が加えられる。
手順表1のステップ5では、シングルの最大コーナーが最小境界矩形(MBR)の最大コーナーと比較される。これは、シングルの最大x座標とMBRの最大x座標ならびにシングルの最大y座標とMBRの最大y座標との区分比較によって実施される。シングルの各座標値がMBRの対応する値より大きい場合、シングルの最大コーナーはMBRの最大コーナーより大きいと言われる。付録Aでは、この計算はKeyForBox関数の0609〜0610行で行われる。
最小境界矩形におさまるシングルが見つからずにステップ2〜5の反復ループが完了した場合のみ、手順表1のステップ6が行われる。したがって、最小境界矩形によって表される空間オブジェクトはシングル構造の下位レベル(たとえば、層)のいずれにもおさまらない。したがって、定義上、それは最上位レベルのシングル内におさまらなければならない。付録Aでは、このステップはKeyForBox関数の0651行および0652行で行われる。
手順表1に示すステップ7は、そのデータ・オブジェクトに「最良適合」であると判断されたシングル用のシングルキーを決定するものである。付録Aでは、KeyForBox関数の0623〜0625行に示すKeyGenerator関数呼出しにより、ペアノ−ヒルベルト空間充填曲線を使用してシングルキー番号を割り当てる。KeyGenerator関数は付録Aの0043〜0485行に実現されている。KeyGenerator関数に与えられるパラメータとしては、シングルの最小点の座標と、層状シングル構造内の対応するレベルとを含む。ただし、異なるレベル間におけるシングルキー番号の固有性は、付録Aの0482行のステートメントによって保証されることに留意されたい。
2.2 照会制御関数
第2のクラスの関数は、コンピュータ・データベースへの空間照会を制御するために使用する。このクラスの関数は、所与の共通幾何照会の照会指定を、照会を満足するために必要なデータを含む必要かつ十分なシングル・キーのリストに変換するものである。このシングルキーのリストは、個々のキーを網羅するリストまたはキー範囲のリスト(その範囲の最小値と最大値を含みかつこれらの値の間にあるすべてのキーが必要であることを暗示する)として表すことができる。
最も一般的なタイプの空間照会は、選択された外周によって定義される領域にオーバラップするすべてのオブジェクトを検出するものである。例としては、矩形ウィンドウ照会と多角形オーバラップ照会がある。手順表3は、このタイプの照会制御関数の一般的な用法を示している。
付録Aのソフトウェア・プログラムは、0655〜1135行で1つの照会制御関数セットを実現する。この関数セットは、所与の経度/緯度矩形にオーバラップするすべてのシングルを識別するものである。手順表4は、この関数セットのアルゴリズム用法を示している。
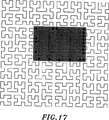
付録Aのソフトウェア・コードの0792〜1020行に実現された内部関数KeyRectGeneratorは、現行レベルの1組のシングルを計算するために使用する。上記で概説した方法と同様に、この関数は矩形の各エッジに沿ってシングルを追跡する。しかし、ペアノ−ヒルベルト空間充填曲線はシングルを順序付けるために使用し、ペアノ−ヒルベルト曲線はその性質上、連続することが保証されているので、曲線がエッジ上の各シングルで矩形内に向かうかまたは矩形から外へ向かうかに留意し、結果として得られるリストをソートして暗示された各範囲の最小および最大を見つけ、曲線に中央部を充填させるだけで十分である。図17は、ペアノ−ヒルベルト空間充填曲線が空間データベースの1つのレベル内の各タイルを連続的にうねって進む様子を示している。
汎用多角形照会を実行するために手順表4のアルゴリズムを拡張するには、どのシングルが入口点と出口点に対応するかならびに冗長なものがあればどれが冗長であるかを同時に追跡しながら、外周シリングによって多角形の経路を追跡するように配慮しなければならない。しかし、境界シングルが識別されると、同じ最小および最大範囲編成が機能することに留意されたい。一般に、この方法は、任意の閉領域にオーバラップするすべてのシングルを検出する場合に機能するだろう。
2.3 従来のデータベース内のインプリメンテーション
データベース表5は、図3からの街路セグメントの一部を表すデータ・オブジェクトを含むサンプル・データベース表を示している。シングルという列は図15からの割当て済みシングルキーを含んでいる。X1/Y1およびX2/Y2という列は、選択されたシングル内の各オブジェクト用の最小境界矩形の座標を含んでいる。
照会例4は、付録Aと同様の関数インタフェースがこの層状シングル構造についても存在していると想定し、矩形照会ウィンドウにオーバラップする最小境界矩形を備えた各データ・オブジェクトの一部を検出するためにデータベース表5に照会する方法を示している。この照会は、手順表4のステップ3〜5に対応する。このため、この照会は、矩形にオーバラップするすべてのセグメントを検出するために各キー範囲ごとに1回ずつ繰り返さなければならないだろう。
図16に示すように、照会例4のウィンドウに対応するキー範囲は、8〜9、17〜20、21〜21である。ただし、データベース表5上のこのようなキー範囲を使用してこの照会を実行した結果、シングル9に割り当てられたシングル・オーバラップ・セグメントがどのように選択されるかに留意されたい。データベース表5にリストしていない図3からの他のオブジェクトもこのウィンドウにオーバラップする。
キー範囲MinKey〜MaxKeyの場合にウィンドウ内のすべてのセグメントを検出するためのSQL
図12および図15の先行比較で識別された分割の改善は、大量の実マップ・データが与えられたときに本発明がどのように機能するかを測定することによって妥当性を検査することができる。データ・表3は、このような測定の1つの結果を示している。このような測定を行うために使用するデータは、カリフォルニア州ロサンジェルス郡の米国Census BureauのTopographically Integrated Geographic Encoding and Referencing(TIGER)データベースファイルからの街路セグメントの抜粋である。CensusのTIGERファイルは、事実上の業界標準の街路マップ・データ・ソースを含む。ロサンジェルス郡というのは、そのサイズが大きく(この抜粋では426367個のセグメント)、包含範囲が多様(密集した都市化の中心、不規則に広がる郊外、人口密度の低い山岳地域および砂漠地域)なので、代表的な選択としては良好なものである。
データ・表3では、25%のオーバラップを有する層状シングル構造と従来技術で見られるような同等のハード境界タイリングにおけるTIGER街路セグメントの自然分布を比較している。これらの統計は、付録Aに示すソフトウェア・プログラムからのKeyForBox関数に各セグメントを供給することによって生成されたものである。25%のオーバラップを有するシングルの統計を生成するため、nLevelLapパラメータに2という値を使用した(shingle_overlap=tile_size * 1/2nLevelLap)。ハード境界タイルの統計を生成するには、オーバラップ量を強制的にゼロにするために、nLevelLapパラメータに32という値を使用した。
データ・表3のレベルという列は、タイル/シングル構造のレベルを示し、0は最も微細な分割であり、14は最も粗大であり、15は最上位レベルの区画である。サイズという列は、結果として得られる象限分割のサイズ(幅と高さの両方)を緯度/経度の度数(=180/2(15-Lev))で示す。シングルのサイズは、実際にはサイズ列に示された値より25%大きい。ただし、付録Aのソフトウェア・プログラムはシングルを緯度/経度空間の四角形として実現することに留意されたい。セグメントという列は、このレベルに自然に適合する(すなわち、タイル/シングル境界を横切らず、KeyForBox関数のpnLevelパラメータによって返される)TIGER街路セグメントの総数を累積する。シングルおよタイルという列は、KeyForBox関数によって返される固有のキー値の総数を累積する。Avという列は、固有のタイル/シングルあたりのセグメントの平均数を計算する。Mxという列は、いずれか1つのタイル/シングルに関連していたセグメントの最大数を示す。
次に、データ・表3の25%のオーバラップを有するシングルの統計と対応するハードタイル境界構造とを対照させる。これは、街路セグメントデータというこの付加を受けてクワッドツリー・データ構造がどのように行動するかを示す概略モデルとして機能する(しかし、クワッドツリー・ノードあたりの記憶空間に対する構造上の依存状態のために、この対応関係は精密ではない)。より微細な各レベルで導入される新しい境界によって切断されるセグメントの断片を増大するような全体的な傾向を観察する。具体的には、レベル6〜1の場合、レベルが1段ずつ下がるごとに、セグメント数が倍増する。この倍増は、より微細な各レベルがハード・タイル境界の全長を倍増し、したがって、所与のセグメントが横切る可能性が倍増するために発生する(ただし、分割の細分性がロサンジェルス郡の空間範囲を超え始めるので、この傾向はレベル6より上では次第に消えていくことに留意されたい)。さらに、レベル4以上には10000個以上のセグメントが位置することに留意されたい。これらのセグメントがこの状態でクワッドツリーに記憶された場合、クワッドツリーの主なブランチを実質的に混乱させ、パフォーマンスを大幅に妨げることになるだろう。たとえば、記憶されるデータの量が100倍に増加した場合、これに対応して、タイル境界交差セグメントの数も100倍に増大し(レベル4で500K、レベル5で250K、レベル6で125Kなど)、上位レベルのブランチにとって完全に過負荷になるだろう。
ハードタイル境界の列の不十分な統計は、このタイプのマップ・データをこの形式で記憶する場合にクワッドツリーを使用できない理由を示している。むしろ、この種の問題にうち勝つために、これまではデータ断片化、複製、または複数間接参照などの戦略を使用してきた。データ・表4は、様々なタイル・サイズについてこれらの特殊ケースの方法の1つで処理しなければならないオブジェクトの数をまとめたものである。この表の統計は、タイルあたりのセグメントの数の最小化と特殊ケースにより管理しなければならないセグメントの数の制限との兼ね合いを明確に示している。
経験的分析で識別された統計傾向の結果、式7および式8によって分かる空間検索の対数コストが非常に予測可能なものになる。これらの式は、正規データベース表/索引が空間データ用の記憶/検索メカニズムとして使用され、索引はシングルキーに基づくという想定に基づくものである。式7は、データベース表に点を記憶するためのタイルベースの方法の行動を設定した式4から導かれる。式7における主な改良点は、複数レベルにわたるオブジェクトの広がりを反映するために合計を累積しなければならないことである。式11は、主に、オーバラップによって照会ウィンドウが接触するタイルの数が増加する傾向があるという事実を反映するためにオフセット係数を1から2に変更することによって式5から導かれる。表13は、経度0.016度×緯度0.0145度の矩形ウィンドウ(カリフォルニア州ロサンジェルスの緯度ではおよそ1マイルの四角形)の場合のALおよびBL用のプラグイン値を示している。
表13に示す値のうちの適度なサイズを巨大人口サイズと比較したものは、O(log(N))パフォーマンス行動を可能にする係数である。たとえば、ロサンジェルス郡のみではなく米国のすべての郡に関するTIGERファイルのセット全体を使用する場合、人口サイズの約100倍の増加は、式7の対数成分を2だけ増加するものでなければならない(log10(400,000)=6.6;log10(40,000,000)=8.6)。式の他のすべての成分はだいたい同じ状態を維持するだろう。さらに、矩形ウィンドウ検索サイズが劇的に変化する場合、行動はアンバランスな状態になるので、シングル・サイズを上下に調整して補正することができる。付録Aに示すソフトウェア・プログラムは、非常に詳細な街路マップ・データを処理するために調整されたものである。
ただし、式7は実際には大幅に改善可能な最悪のケースを表していることに留意されたい。具体的には、AL×log(N)という式の一部分の値ALは、付録Aに示すソフトウェア・インプリメンテーションで行われているように、コンピュータ・データベースにシングルを記憶するときにペアノ−ヒルベルト空間充填曲線を使用してシングルを順序付けることによって、実質的に低減することができる。この曲線を使用すると、多くの隣接シングルに連続して番号が付けられることが保証される。たとえば、ペアノ−ヒルベルト曲線で順序付けられたフィールド内の隣接シングルを任意に3×3でグループ化する場合、多くても4つの連続シーケンスができる可能性がある(図8および図17を参照)。
式7
データベース表内の本発明のシングル番号を使用するウィンドウ検索の予想コスト
レベル別の検索あたりのシングルの予想数
本発明は、大量のデータを編成するための効率のよい方法およびシステムを提供するものである。前述のように、情報のデータベースは、数百メガバイトのデータを含むことができ、それにより、効率よく探索するには非常に困難なものになる。しかし、本発明の方法およびシステムによって記憶された多次元データは、従来システムよりかなり少ないプロセッサ・サイクルおよびディスク・シークで検索することができる。
より大きい座標系を小区域に分割することにより、各空間オブジェクトは特定の小区域に割り当てられる。これらの小区域は、1組の空間データの上に重ねられると一連のタイルに似ているので、タイルと呼ばれる。したがって、各タイルは、特定の1組の空間データを保持するだろう。その結果、どのタイルが所望の情報を保持しているかを知っているユーザだけがその特定のタイルを探索すればよかった。コンピュータ・ユーザが空間データベース内の所望の領域内に位置する空間データを識別すると、システムは、メモリからこのいくつかのタイルを読み取り、そのタイルからオブジェクトを収集するプロセスを開始することができる。この方法では、それにより、システムがコンピュータ・ユーザのすべての要求に対してデータベース全体のすべてのオブジェクトを分析するのを防止する。
本発明では、空間データベース内のすべてのタイル間に一連のオーバラップを設ける。このようなオーバラップ・タイルは、ここでは「シングル」と呼ばれ、それぞれの最も近い隣接物にオーバラップするタイルを表す。どのシングルについてもオーバラップの面積は、最大効率をもたらすようにあらかじめ決定される。従来システムで行われていたように、このシングル・オーバラップにより、空間データベース内のより多くのデータ・オブジェクトを唯一のシングルに割り当てることができ、これらのオブジェクトは複数のハード・エッジ・タイル間で分割されなくなる。前述のように、1つのオブジェクトを複数のタイル間で分割することは非常に不利なことである。というのは、特定のオブジェクトに割り当てられたすべてのタイルをシステムが追跡しなければならないからである。
本発明のシステムおよび方法は、タイトル境界を横切る小さいオブジェクトが上位レベルへ移動するという問題を軽減する。本発明では、小区域の層が生成されるときに、オーバラップの領域ができるようにそれらが計算される。本発明では、空間データベースに対して最高速アクセスを行えるように各層のシングル・オーバラップ・サイズを事前にプログラミングすることができるので、個々のデータベースの効率が改善される。
街路などの多数の小さいオブジェクトを伴うデータベースは、フリーウェイなどの多数の大きいオブジェクトを有するデータベースより小さいシングル・サイズでプログラミングすることができる。タイルおよびシングルのサイズを平均データ・オブジェクトのサイズに応じて調整すると、より多くのデータ・オブジェクトが本発明のデータベースアーキテクチャ内の単一の下位レベルに保持される。したがって、単一のシングル内におさまることができないデータ・オブジェクトは、次に高いレベルのシングルに記憶させることができる。
付録 A
Field of Invention
The present invention relates to computer databases. In particular, the invention relates to a method for indexing database records containing information describing the position, size, and shape of objects in two-dimensional and three-dimensional spaces.
Explanation of related technology
The purpose of a data structure is to organize a large amount of information so that a computer can selectively process the contents of the data structure. The motivation for this is simple. That is, there is always more data than can be processed all at once in terms of time requirements, processor speed, main memory, and disk access time. Depending on the nature of the data and application, the data organization strategy can partition the content into subsets with similar properties, or order the data to support indexing and hashing for fast random access. Can do. Database and database management systems extend such concepts to allow persistent storage of structured data and transaction control editing.
Spatial data that describes a two-dimensional map is completely unchanged in terms of the need for efficient organization. Map data is particularly demanding in this respect. A comprehensive street map for a medium-sized community can consist of tens of thousands to hundreds of thousands of individual street segments. A Los Angeles or New York wide area map may contain millions of segments. The contents of each map data object can also be somewhat bulky. For example, a record of an individual street segment can include its end point coordinates, usage classification, street name, street address range, street left and right sides, corporate city name, and postal code.
However, the spatial data at its center poses a particularly troublesome problem because it attempts to organize objects in a two-dimensional space. Spatial coordinates consist of two (or more) values that are independent of each other but equally important for most spatial queries. Probable data structures and database methods are designed to efficiently handle single values rather than representations of multidimensional spaces.
The challenge is to create an application that presents a small window of map data (for example, a square mile surrounding a house) from a database of hundreds of thousands of spatial objects (a map of the city surrounding the house). It can be illustrated by studying. There are actually two motivations for doing this. First, the typical resolution of a computer monitor is limited and can only represent a given amount of information. Second, even if all the data fits in the monitor, the data processing time (retrieval, conversion, clipping, drawing) to calculate this large amount of information is too long for the average personal computer. It will be.
To solve this problem, it is advantageous to detect all street segments that appear in the “window” generated on the monitor and avoid as many segments as possible for street segments that do not appear. Thus, all objects within a specific range of x-coordinate (or longitude) and y-coordinate (or latitude) values are collected. This problem is commonly referred to as rectangular window search and is one of the more basic types of spatial queries. This method is used in the following section as a method for evaluating the effectiveness of each of the following knitting methods.
The most closely investigated and commonly used spatial data structures (data structures used to organize geographic and geometric data) rely on the concept of tile-based hierarchical trees. A tile in this context is a rectangular (or other regular or irregularly shaped) section of the coordinate space, and each section is such that no single point in the coordinate system exists within multiple tiles. It has a clear line separating the tiles. A hierarchical tree is one of the structures for dividing a coordinate space by starting from the root representing the entire coordinate space and recursively decomposing the space into smaller tiles. A “hard edge” between tiles in this system means that every point in space is exactly within one tile at each level of the hierarchy. No point can coexist on multiple tiles.
An example of a well-known hierarchical tree is a quadtree data structure. An example quadtree could represent the surface of the earth. At the root of the quadtree is a node that represents the entire surface of the earth. The route then has four children representing each quadrant of latitude and longitude space: east of Greenwich, north of the equator, east of Greenwich, south of the equator, west of Greenwich, north of the equator, and finally Greenwich It has a child more west and south of the equator. Greenwich meridian and points on the equator are arbitrarily defined as belonging to one quadrant or the rest. Each of these children is further divided into more quadrants, such as its children, and so on, to the degree of partitioning required to support the amount and density of data to be stored in the quadtree.
The main problem with the quadtree structure is that the structure is unbalanced. Since the data storage capacity of each node in the tree is limited, if the limit is exceeded, the node must be split into four children and the data content is pushed into the lower depressions of the tree. As a result, the depth of the quadtree is shallower when the data density is lower and deeper when the data density is higher. For example, the quadtree used to find the center of population on the Earth's surface is very shallow (eg, has a few nodes) in the central and polar oceans, and in regions such as the eastern and southern parts of the United States Become very deep (eg, have a large number of nodes).
Because quadtrees are inherently unbalanced, quadtree rectangular window search behavior is difficult to predict. For software, it is difficult to predict how deep there are many nodes that may have to visit to detect the necessary data. In a large spatial database, each step for moving to another node in a quadtree hierarchy typically requires a time consuming disk seek. In addition, you will have to follow multiple branches of the tree to find all the data you need. Second, efficient space management can be problematic if the contents of the data structure are dynamic. This is because each node has both a certain amount of space and a certain regional extent. In real data systems, these two rarely correspond. There are several quadtree variants to try to minimize these problems. However, the inefficiency continues.
So far, only the data structure including a plurality of points has been described when each spatial object includes a single set of coordinates. Lines, curves, circles, and polygons have additional dimensions and therefore add complexity. Thus, unless the tiling scheme is very unnatural, these objects no longer fit neatly into tile-based data structures. There will always be a part of the object that crosses the hard edge tile boundary from one coordinate area to another. Note, however, that this is true regardless of the simplicity of the object description. For example, a line segment is described by its two end points, and a circle is described by its center point and radius.
A simple and commonly used method surrounding this problem is to divide the object that crosses the tile boundary into multiple objects. Therefore, a line segment whose end point is contained in two adjacent tiles is divided into two line segments, and a line segment that starts from one tile and passes through 50 tiles to the other end is , It is broken down into a total of 52 line segments, one for each tile it contacts.
This approach can be an effective strategy for a given application that is read-only. However, this is an unsatisfactory strategy for data structures with dynamic content. Adding new data objects is relatively simple, but deleting and changing data is more difficult. Problems arise because the original object is not guaranteed to remain intact. If a line needs to be moved or removed, it must somehow be reconfigured so that the database works as expected. This requires additional database bookkeeping, more complex algorithms, and attendant design simplicity and performance degradation.
Another common problem with the organization of multidimensional objects is that many of these objects are difficult to describe mathematically once decomposed. For example, there are many ways to make a circle overlap four adjacent rectangular tiles. Depending on the arrangement, two, three, or four odd-shaped pieces of the same size can occur. As with over-segmented line segments, the original “natural” features of the object are completely lost.
An alternative strategy is to use an indirection that refers variously to objects that cross the tile boundary. However, each reference requires an extra step to recover that object, and the same query can be searched multiple times with the same query, but it requires additional complexity to solve. As the number of objects in the database grows, this extra roundabout level is too expensive to create a viable system.
Another strategy for use with quadtrees is to push objects that cross tile boundaries to a higher level in the tree until they eventually fall. The difficulty with this strategy is that if the number of map objects in the higher nodes increases, the database operation must be used to inspect smaller objects that are more likely to contain useful information unless all objects in the higher nodes are examined. The search cannot be directed. As a result, an enormous delay time occurs to detect data.
Query optimization in conventional DBMS
As described above, data describing the position, size, and shape of an object in space is generally called spatial data. A set of spatial data is called a spatial database. Examples of various types of spatial databases include maps (street maps, topographic maps, land use maps, etc.), 2D and 3D architectural drawings, integrated circuit design drawings, and the like.
Conventional database management systems (DBMS) use indexing methods to optimize the search for records that have a particular data value in a given field. For each record in the database, the value of the field of interest is stored as a key in a tree or similar indexing data structure with a pointer back to the record containing the corresponding value.
Database table 1 shows an example of a simple database table that contains information about former employees of a fictitious company. Each row in the table corresponds to a single record. Each record contains information about a single former employee. The columns in the table correspond to the fields in each record that store various facts about each former employee, including their name, employment start date, and employment end date.
Query example 1
SQL to detect all former employees hired during 1993
For example, the best sorting algorithm is typically performed at a cost of O (N × log (N)), where N is the number of records to sort. For a data structure used to manage objects (eg, an index in a database), the Order function is based on the number of objects managed. For example, best database indexing methods typically have a search cost of O (log (N)), where N is the number of records stored in the database. A given algorithm also has a separate but usually rare worst case cost, which can be illustrated by other Order functions. A constant function unrelated to the total number of objects is indicated by the function O (K).
B-trees and similar indexed sequential access schemes (ie, ISAMs) generally allow random access to a given key value with a cost of O (log (N)), where N is a table And allows sequential access to subsequent records with an average cost of O (K), where K is a small constant representing the penalty of reading records by index (K Various strategies can be used to minimize, including index clusters and caches). Therefore, the total cost for executing Query Example 1 is O (log (N) + (M × K)), where M is the number of records that satisfy the query. When N is large and M is small with respect to N, the cost of executing a query using an index is substantially less than the cost of O (N) for scanning the entire table. Data Table 1 illustrates this fact by showing the values calculated by some Order function for various values of N and M. This example is very simple but represents a widely used and generally accepted database management practice of using indexes to optimize queries.
The cost of retrieving consecutive records from a database table by index
Query example 2
SQL to detect all former employees who worked during 1993
The cost of retrieving all records that overlap the interval of using a traditional database index for start or end values
Overview of 2D spatial data
Spatial databases have a particularly strict requirement for efficient database management because of the large number of related objects. Comprehensive street maps for medium-sized communities can consist of tens of thousands to hundreds of thousands of individual street blocks, with over 1 million regional maps in Los Angeles, California or New York, NY May contain street blocks. Similarly, modern integrated circuit designs include millions of components.
FIG. 1 shows a coordinate plane having an X axis and a Y axis. For the example shown below, the plane size is selected to be 200 × 200 coordinate units, and the minimum and maximum coordinate values for both the X and Y axes are −100 and 100, respectively. However, it should be noted that the principles described for the following examples are applicable to any bounded two-dimensional coordinate system of any size, including but not limited to planar, cylindrical surface, and spherical coordinate systems. An example of such a spherical coordinate system is a latitude / longitude coordinate system of the earth surface whose minimum latitude value and maximum latitude value are -90 degrees and +90 degrees, and whose minimum longitude value and maximum longitude value are -180 degrees and +180 degrees. It is.
FIG. 2 shows the distribution of points on the plane of FIG. As mentioned above, a point is the simplest type of spatial data object. The spatial description consists only of coordinate position information. Examples of non-spatial descriptions that are typically associated with point objects may include the name and type of the office at that location, for example, “Leon's BBQ” or “restaurant”.
Figure 3 shows the distribution of linear and polygonal spatial data objects that represent maps (however, the text strings “
FIG. 4 shows the minimum bounding rectangle (MBR) of various linear and polygonal spatial data objects. The smallest bounding rectangle of a spatial data object is the smallest rectangle that completely contains the object and is orthogonal to the coordinate axes. A minimum bounding rectangle is usually one that can be calculated very easily by a simple examination of the minimum and maximum coordinate values that appear in its spatial description. Spatial data storage and retrieval methods often use the smallest bounding rectangle to represent the approximate position and size of an object. This is because the simple contents (two pairs of coordinates) are suitable for very efficient processing.
Storage of two-dimensional spatial data in a conventional database management system
The database table 3 shows a method of expressing a part of the points in FIG. 2 in a regular database table. The points in the database table 3 correspond to a subset of the points indicated by * markers among the points shown in FIG. Query example 3 shows an SQL query that retrieves all points in a rectangular window. Rectangular window queries are the simplest of the commonly used geometric query types. Examination reveals that “Emily's Bookstore” is the only record selected from database table 3 by this query. FIG. 5 shows a rectangular window corresponding to Query Example 3 overlaid on the points shown in FIG.
SQL to detect all offices in the window
Although the work required to initiate a query is logarithmic, the expected number of point objects oversampled is a linear function of the number of point objects in the database, as Equation 3 shows. This means that the performance of this query tends to decrease linearly as the number of objects in the database increases. As the data volume increases, this linear behavior becomes much worse than the preferred O (log (N)) and this style of solution is completely ineffective. The same problem occurs with an index based on Y. The root cause of this problem is that the two-dimensional spatial coordinates are independent of each other but consist of two values (X and Y) that are equally important for most spatial queries. Conventional database management techniques are not well suited for processing two-dimensional data.
Formula 3
Average cost to perform a 2D rectangular window query using traditional database indexing methods, assuming an almost uniform distribution of X
Conventional database management methods have problems with spatial data, and as a result, various dedicated data storage and retrieval methods called spatial data structures have been developed. By Hanan SametThe Design and Analysis of Spatial Data StructuresDescribes the details of many of these methods. Many commonly used spatial data structures rely on the concept of a tile-based hierarchical tree.
FIG. 7 shows a rectangular recursive decomposition of space, while FIG. 8 shows how the tiles formed by the decomposition are organized to form a “tree” (hierarchical data structure designed for searching). ing. This type of data structure is called a quadtree. FIG. 9 shows the points of FIG. 2 distributed over the “leaf nodes” of this quadtree.
FIG. 10 shows a subset of the quadtree that the rectangular window search of Query Example 3 touches. However, note the contrast between the two lower level nodes that must be examined in the quadtree and the long stripes that must be examined using conventional database indexing as shown in FIG. Of the points from the two nodes in FIG. 10, all tested points are at least in the vicinity of this rectangle, and some of the points inside the stripe in FIG. 6 are literally the far edges (bottom of the coordinate system). )It is in. Since this example is simple, the difference in the number of tested points is not large, but if the number of point objects is very large, the performance contrast becomes dramatic. Quadtrees are very well suited for storing position-based data because they index simultaneously along both axes of the coordinate system.
In the most basic implementation of a quadtree, each tile in the hierarchy corresponds to a “record” that contains information associated with that tile. If the tile is at the root or branch level, the corresponding record will contain the record coordinates for each child tile and a pointer to that record. If the tile is at the leaf level, the corresponding record contains a subset of spatial data objects (point, line, or polygon objects and their attributes) that are geometrically contained within the perimeter of the tile. Quadtree database “records” are stored in disk files in root-first or depth-first order, with the root at the beginning of the file. There are also various variations that keep some spatial data objects at higher levels of the hierarchy and do not actually create records for leaves and branches that are almost or completely empty. For example, both leaves 133 and 144 in FIG. 9 are empty.
The advantage of a quadtree data structure is that it exhibits a cost of O (log (N)) when the spatial density of the data is fairly uniform, resulting in a well-balanced tree. This balance is driven by a configuration algorithm that controls the amount of branches. The amount of branches in the quadtree (and hence the maximum depth) is driven by the interaction between the local density of spatial data objects and the maximum number of such objects that can be accommodated in a leaf level record. Specifically, when the data storage in a leaf record is full, the leaf is split into four children and the spatial data object is redistributed accordingly by geometric containment. Each time this is done, the local height of the tree is increased by one. However, the behavior of this algorithm results in a very high local data density, which reduces the performance of the quadtree towards the cost of O (N) due to the excessive depth of the tree.
There are also many non-hierarchical uses of hard edge tiles in the coordinate system. One such method uses a space filling curve to order the tiles. FIG. 11 illustrates a method for ordering 4 × 4 tilings using Peano-Hilbert curves. The resulting tile will be 50 units on one side. Tiles ordered in this way can be stored in records similar to leaves in the quadtree, with the data stored in each record corresponding to a subset contained within the perimeter of the tile. Records can be easily indexed by a table that converts tile numbers into record positions.
This tile can also be used as a simple computational framework for assigning tile membership. Database table 4 shows the office location database table enhanced by the corresponding tile number field from FIG. The tile number calculates the binary representation of the X and Y column and row numbers of the tile containing the point and applies the well-known Peano-Hilbert bit interleaving algorithm to calculate the tile numbers in the sequence Determined by. By building an index on the tile number field, even if a record is stored in a conventional database, the record can be efficiently searched by a geometric query. For example, it is possible to calculate that the rectangular window SQL query shown in Query Example 3 can be satisfied by examining only the records marked by
Formula 4
Expected cost of window search using tile numbers embedded in database table
Expected number of tiles per search
Expected number of points per tile
The problem with all tile-based schemes is that higher dimensional objects (segments, polylines, polygons) do not fit neatly like points, as FIGS. 12 and 13 show. FIG. 12 shows how the linear and polygon data objects from FIG. 3 naturally divide into various nodes in the example quadtree. Note, however, how many objects exist at higher levels of the quadtree. Specifically, objects that cross one of the lower level tile boundaries must be kept at the next higher level in the tree. This is because the tile is the smallest tile that completely covers the object. This is the only way a quadtree tile hierarchy has to accommodate objects that may cross a boundary as a single entity.
FIG. 13 shows the dramatic effect of data moving up a hierarchical tree on a rectangular window search example. Since linear and polygon data has size in addition to position, some substantial subset will always cross tile boundaries. As the number of objects in the database increases, the number of objects present in the upper nodes of the quadtree also increases, resulting in the loss of the performance advantage of using the structure. This problem is shared by all hard tile boundary methods (quad tree, KD tree, grid cell, etc.).
The main methods used to overcome the problem of managing objects that cross tile boundaries are: 1) splitting the object across the tile boundary into multiple pieces, thereby adapting the data object, and 2) if the object is There are three ways: duplicate the object once for each extra tile that touches, and 3) indirectly reference each object once for each tile it touches. In particular, fragmentation is most frequently used in read-only map data applications. Each of these methods has its own advantages, but the weakness that they all share is that the implementation complexity increases significantly, especially when the contents of the spatial database have to be edited dynamically. is there. However, these techniques need to be applied to each of the violating objects, which can be a significant part of the database, as shown by the object population of intermediate and higher level nodes in FIG. Please also note that.
An R-tree (or range tree) is a data structure that has been specifically evolved to deal with the complexity of linear and polygonal data. Similar to the quadtree, the R-tree is a hierarchical search structure consisting of a single root and a plurality of branch levels leading to the leaf containing the actual spatial data. Unlike quadtrees constructed from planar top-down regular partitioning, R-trees are constructed bottom-up to fit the irregularities of spatial data objects. Leaf level records are formed by gathering together data objects with similar size and locality. For each record, a minimum bounding rectangle is calculated that defines the minimum and maximum coordinate values of the set objects in the record. Next, leaf records of similar size and locality are collected in a twig level record, which contains a list of the minimum bounding rectangle of each child record, a pointer to that child record, and the entire set It consists of an additional minimum bounding rectangle that encloses. These twig records are then collected together to form the next level branch and repeated until the tree converges to a single root record. A well-balanced R-tree shows an efficiency of O (log (N)).
The difficulty of the R-tree is determined by how the data contents are gathered together to “fit” in order to build the tree, so the algorithm for building and maintaining the R-tree becomes complex and the data It tends to be very sensitive to the content. An R-tree static application whose data content does not change is the easiest to implement. Dynamic applications where data is constantly changing are quite difficult. This is because some editing operations that change the geometric description of the spatial data implicitly change the minimum bounding rectangle of the containing record, which is the minimum bounding rectangle of the parent twig record. This is because there is a possibility that it will affect one after another until it reaches the route. Thus, any operation can cause significant reorganization of the tree structure, and the structure must remain well balanced to maintain an efficiency of O (log (N)).
In summary, various dedicated data structures have evolved to meet the specific requirements of multidimensional spatial data storage. These techniques effectively solve some of the problems associated with two-dimensional spatial data, but share the same inherent weaknesses that one-dimensional methods have when dealing with data representing a range of values. Yes. In the one-dimensional case, the problem data object type is a single variable closed interval, eg, a time interval. In the two-dimensional case, problem data object types such as lines, circles and polygons are described by two variable closed intervals.
Description of 3D and higher dimensional spatial data structures
Spatial data describing a three-dimensional surface has similar requirements for efficient organization. The added complexity is that the three-dimensional spatial data consists of three independent variables (X, Y, Z) having equal weight. The three-dimensional geometric description of lines, surfaces, and volumes is also more complex than two-dimensional lines and polygons, which increases the data somewhat.
However, the three-dimensional basic database organization problem is basically the same as that in the two-dimensional space and therefore follows a very similar solution. There is a three-dimensional technique that uses a regular cubic partition of a three-dimensional space, equivalent to a quadtree. Oracle has also implemented a three-dimensional version of its “HHCODE” technology for storing point objects. There is also a three-dimensional technique that is equivalent to the R-tree and uses three-dimensional minimum boundary frames to define the leaf and branch coordinate ranges. These techniques also share the same limitations as the one-dimensional and two-dimensional techniques when processing data representing successive three-dimensional sections.
The same principle also applies to higher dimensional data. In particular, Oracle has extended its “HHCODE” technology to deal with point objects up to 11 dimensions.
As mentioned above, there are several problems associated with efficiently organizing and indexing multidimensional spatial data in a database. Thus, an improved method for staring at spatial data would be advantageous. This advantage is provided by the system of the present invention.
Summary of the Invention
As mentioned above, a database of information can contain hundreds of megabytes of data, which makes it very difficult to search efficiently. However, multidimensional data stored by the method and system of the present invention can be retrieved with significantly fewer processor cycles and disk seeks than conventional systems.
Conventionally, one method for organizing a large amount of spatial data is to first superimpose a coordinate system on the spatial data. Each object in the spatial database should be assigned an X coordinate and a Y coordinate. Larger objects such as lines, polygons, and other shapes should be assigned a single position point in the coordinate system that acts like an anchor to hold the object in place. For example, a line may have a position point corresponding to one end of the object, and the rest of the object will have the X and Y coordinates of the other end, the thickness of the line, the color, and other features Should contain information about. In this way, each object in the spatial database should have a single location point no matter how large that object is in the database.
By dividing a larger coordinate system into sub-regions, each location point could be assigned to a specific sub-region. Such subregions are called tiles because they resemble a series of tiles superimposed on a coordinate system containing a set of spatial data. Thus, each tile will hold a specific set of spatial data. As a result, only a user who knows which tile holds the desired information has to search for that particular tile. When the computer user identified the spatial data in the desired region in the spatial database, the system started the process of reading the several tiles from memory and collecting objects from the tiles. In this way, it prevented the system from analyzing all objects in the entire database for all computer user requests.
This system of assigning tile numbers to data objects worked well for data containing only points, but was much slower when larger data objects were involved. Larger data objects can be lines, circles, and polygons in the spatial database. Many problems associated with the organization of spatial data objects had to deal with the difficulty of assigning these objects to only one tile if the object crosses many tiles. For example, a long line across three tiles can pose many problems. Because the long line is not assigned any particular tile, the line may be assigned to the wrong tile or series of tiles. Assigning objects such as lines to multiple tiles creates enormous computer overhead because all of these associations must be maintained in the computer system.
According to one embodiment, such a conventional problem is reduced by providing a series of overlaps between all tiles in the spatial database. Such overlapping tiles are referred to herein as “single” and represent tiles that overlap each of their four nearest neighbors. The area of overlap for any single can be predetermined to provide maximum efficiency. For example, a spatial database holding map data can be programmed to have a single size of 10 square miles and each single overlap includes 5 square miles. Thus, every single will have an overlap with its nearest four neighbors equal to the size of the adjacent single. This single overlap allows more data objects in the spatial database to be assigned to a single single and is not divided between multiple hard edge tiles. As described above, it is very disadvantageous to divide one object among a plurality of tiles. This is because the system must track all tiles assigned to a particular object.
Therefore, the purpose of the layered single structure is to provide a logical framework for resolving spatial queries to databases in a timely and efficient manner. A spatial data structure is a conceptual structure that allows organization to index objects in a spatial data set. The layered single structure need not be implemented with a particular computer data structure to be useful and effective. A layered single structure is part of a computational tool for organizing a set of spatial data objects such as lines, squares, polygons, etc. into subsets based on their respective similar position and size in space. In addition, a layered single structure can provide a mechanism for identifying a subset of a database that contains necessary and sufficient spatial data objects required by a particular spatial query to the database.
The system and method of the present invention alleviates the problem seen in conventional systems where small objects that cross title boundaries move to higher levels in the tree. In one embodiment, sub-area layers are generated and tiles are calculated to create overlapping regions. Thus, there may be no hard edges between the tiles, or an object may exist in two tiles simultaneously. Such overlapping subregions are called singles. A single can, for example, overlap with half of its nearest neighbors, so an object that fits in a large single area will stay at the lowest level possible. Another advantage of the present invention is that each database's single overlap size can be pre-programmed for the fastest access to the spatial database, thus improving the efficiency of individual databases. is there.
A database with many small objects such as streets can be programmed with a single overlap size that is smaller than a database with many large objects such as freeways. Adjusting the size of the single and overlap regions according to the size of the average data object will keep more data objects at a single lower level within the database architecture of the present invention. However, data objects that cannot fit within one single can be stored in the next higher level single.
For example, a first level single may have a single size of 5 square miles and may divide the map database into 10,000 singles. However, the second level single has a single size of 10 square miles and may divide the map database into 2500 singles. This will be described more specifically below with reference to FIG.
Embodiments of the present invention are methods for organizing spatial data objects in a map database, referencing a data object to a coordinate system as a location point in the region, and the region Is divided into multiple subregions, and unless any part of the object extends out of the subregion by a predetermined amount, the data object whose position point is within the one subregion Including assigning to subregions.
Another embodiment of the present invention is a method of storing a spatial data object in a computer memory, comprising: (1) determining the size of each data object in the coordinate system; and (2) each spatial data Assigning an object to a position point in the coordinate system; and (3) calculating the boundary of the first layer of the overlapping subregion of the coordinate system so that each point in the coordinate system is assigned to at least one subregion. And (4) causing each spatial data object smaller than the size of the subsection in the first layer to refer to a specific subsection of the coordinate system based on the position point of each spatial data object; (5) storing a spatial data object in a computer memory with its reference to a particular subregion.
[Brief description of the drawings]
FIG. 1 is a diagram illustrating a coordinate plane in a two-dimensional space.
FIG. 2 is a diagram of a computer database showing the distribution of point space data objects on the coordinate plane of FIG.
FIG. 3 is a computer database diagram showing the distribution of linear and polygonal spatial data objects representing the map on the coordinate plane of FIG.
FIG. 4 is a diagram showing minimum boundary rectangles corresponding to line segments, polylines, and polygons in the computer database.
FIG. 5 is a diagram showing a rectangular window search on the coordinate plane of FIG.
FIG. 6 is a diagram showing the coordinate system of FIG. 1, and a conventional computer database indexing method is applied to search for spatial distribution data in a coordinate plane.
FIG. 7 is a diagram illustrating normal quadrant-based decomposition of the coordinate plane of FIG.
FIG. 8 is a tree diagram illustrating a method for organizing the quadrant and sub-quadrants of the coordinate plane decomposition of FIG. 7 to form a quad-tree type spatial data structure for a computer database.
FIG. 9 is a diagram illustrating distribution of point data objects to quadtree nodes in a computer database spatial data structure.
FIG. 10 is a diagram of a rectangular window search applied to a quadtree-based data structure of a computer database, and shows that this data structure is effective when managing two-dimensional point data.
FIG. 11 illustrates how a computer database organizes two-dimensional data using a regular quadrant-based tiling scheme by calculating a Peano-Hilbert space-filling curve.
FIG. 12 shows how linear and polygonal spatial data objects fit into a two-dimensional data structure of a computer database organized as a quadtree.
FIG. 13 is an illustration of a rectangular window search applied to a computer database organized as a quadtree and containing linear and polygon data. This figure shows that it is invalid to organize two-dimensional data into this type of data structure and manage spatial data with a unique size.
FIG. 14 is a diagram illustrating the organization of a computer database having a three-level layered single structure applied to a coordinate plane.
FIG. 15 is a diagram illustrating linear and polygonal map data elements distributed in a computer database organized using the layered single structure of the present invention.
FIG. 16 is a diagram of a rectangular window search for a computer database applied to the layered single structure of the present invention, and shows that this data structure is effective when managing spatial data having a size. .
Detailed Description of the Preferred Embodiment
Reference will now be made to the appended drawings, wherein like numerals designate like parts throughout. Also, for the sake of convenience, the following description is organized into the following main sections: overview, function description, example implementation in the database table, empirical analysis, mathematical analysis, and conclusion.
1. Overview
The present invention is a method and system for organizing large amounts of data. Although the example used to illustrate embodiments of the present invention is for organizing map data, this technique is applicable to other types of data. Other applicable data types include mechanical and architectural drawings, animation and virtual reality databases, and raster bitmap databases.
Furthermore, while the accompanying drawings illustrate embodiments of the present invention that can be used to organize data representing two-dimensional objects, the present invention is also useful for organizing data relating to three-dimensional or higher-dimensional objects. Applicable.
Thus, as mentioned above, the purpose of the layered single structure is to provide a logical framework for resolving spatial queries to computer databases in a timely and efficient manner. The layered single structure need not be implemented with a particular computer data structure to be useful and effective. A layered single structure is part of a computational tool for organizing a set of spatial data objects such as lines, squares, polygons, etc. into subsets based on their respective similar position and size in space. In addition, the layered single structure provides a mechanism for identifying a subset of the database that contains the necessary and sufficient spatial data objects required by a particular spatial query to the database. Further, the layered single structure is preferably Intel in one preferred embodiment.(R)It can operate on a processor-based computer system. However, Apple(R), DEC(R), IBM(R)It is anticipated that other computer systems such as those sold by will function within the scope of the present invention.
FIG. 14 is a diagram showing a three-level layered single structure because it should be applied to the coordinate plane example shown in FIG. This layered single structure is similar to the normal quadrant-based decomposition of the coordinate plane shown in FIG. However, instead of each level's data structure being organized in separate hard edge tiles, each level consists of overlapping singles. Although the overlap between adjacent singles will be described in detail below, it is indicated by a shaded
The finest level of layered single structure (single 1-16 in FIG. 14) is designed to serve as an indexing medium for the majority of spatial data. Therefore, it is desirable that the majority of data objects be assigned to singles at this level of the data structure. Thus, the spatial object extends beyond the edge of the single central portion by an amount greater than a predetermined amount (eg, the overlap will be assigned to the next higher layer in the hierarchy). Its finest level of granularity (single size and amount of overlap) is achieved by minimizing the number of spatial data objects that “contain” in a single at that level (by increasing the size of the single ) And maximizing the degree of splitting (implemented by reducing the size of singles) can be adjusted to balance the competitive trend. A coarser level single (single level in FIG. 14 consisting of singles 17-20) includes a single overlap with its nearest neighbors, and objects that do not fit in the finest level (ie, spatially It serves as an alternative indexing medium for objects that are too large to fit within a particular tile. However, it should be noted that the absolute size of the overlap increases as the tile size of each level, which becomes progressively coarser, increases. Finally, there is a top level single 21 (FIG. 14) that is used to allocate a small number of objects that are too large to fit within other tiles of the data structure.
FIG. 15 is a diagram showing a method of organizing each of the linear and polygonal objects shown in FIG. 3 into the layered single structure data of the present invention. As will be described below, each single includes a subset of objects having a similar position and size. The advantages of regular overlap tiles provided by the data structure of the present invention may be seen by comparing the data structure organization of the present invention of FIG. 15 with the data structure organization of FIG. This single overlapped system allows small data objects (most of the population in
16 and FIG. 13 show why the improved splitting scheme provided by the layered single structure improves rectangular window query performance over comparable structures based on the prior art. The number of tiles that need to be examined during a data query has increased slightly from 5 in FIG. 13 to 7 in FIG. 16, but the number of data objects that must be examined is only about half (16 vs. 31). It is falling. This reduction is exactly because the size of each compartment has increased slightly so that more objects can fit into the finer compartment level. As mentioned above, a spatial data query must examine every object in each tile that satisfies the query parameters. Thus, in the case of FIG. 13, each data object in the
However, it should be noted that in practice, the equivalent structure based on the prior art shown in FIGS. 12 and 13 is rarely realized. This is because there are too many objects fixed at a higher level, which is a burden to enable reasonable performance. Rather, the hard boundary method involves fragmenting individual data objects at tile boundaries, duplicating the object once for each tile that the object contacts, and once for each tile that the object contacts. Relying on alternative strategies that involve indirectly referencing the object.
The preferred embodiment of the present invention provides two main classes of functions. The first class, a single allocation function, converts a spatial description of a spatial data object into a “single key”. The single key is a numerical value that uniquely represents a specific single in the layered single structure. The second class, the query control function, transforms the query specification of a given common geometric query into a necessary and sufficient list of single keys that "contain" the data necessary to satisfy the query.
Appendix A describes a preferred embodiment of the present invention written in the C programming language. One single allocation function KeyForBox (starting at line 0507) that calculates a single key for a given minimum bounding rectangle, and one that calculates and returns all the single keys needed to resolve a rectangular window query There are query control function sets, namely KeyRectCreate (line 0703), KeyRectRange (line 1030), and KeyRectDestroy (line 1125). Both the KeyForBox function call and the KeyRectCreate function call expect the corresponding spatial description parameters to be expressed in longitude (X1 and X2) and latitude (Y1 and Y2) coordinates with decimals. Both of these functions also take two additional parameters, nLevelMask, which controls which level should be included in the layered single structure, and nLevelLap, which controls the amount of overlap between adjacent singles. The inline documentation included in Appendix A details the usage of the parameters.
However, in both KeyForBox and KeyRectCreate, double-precision longitude / latitude coordinates are immediately converted to fixed-point integer representations, 360 degrees of longitude are represented by 28-bit integer X coordinates, and 180 degrees of latitude Note that it is represented by a 27-bit integer Y coordinate. The resolution of this representation is roughly the nearest 1/2 foot of precision on the ground. This conversion from double precision to fixed point allows the use of highly efficient modular binary arithmetic operations to calculate both single containment and Peano-Hilbert single ordering.
For convenience, the remainder of this term is divided into three terms: a single assignment function, a query control function, and a conventional database implementation as follows:
2.1 Single allocation function
A single key generated by a single assignment function is used to divide a set of spatial data members into subsets, where all members of a subset have the same single key. This means that each member of a subset can be “contained” on the same single (eg, the size of the smallest bounding box containing the object is not larger than the tile). This also means that all members of a subset have similar spatial size and position. Therefore, indexing and clustering data in the storage mechanism with a single key (a common database management practice to improve efficiency) is very effective. This is because a spatial query usually selects multiple objects with similar positions and sizes as a group.
Procedure Table 1 shows a set of calculation steps for deriving a single key corresponding to a particular spatial data object. The steps in this table correspond to lines 0536-0652 of the KeyForBox function in Appendix A. Some of these steps are detailed in subsequent paragraphs.
In step 4 of the procedure table 1, the maximum point (upper right corner) of the candidate single is calculated. This point can be determined directly from the single minimum point by adding the current level standard single width to the x coordinate and the current level standard single height to the y coordinate. In Appendix A, this calculation is performed in lines 0598-0601 of the KeyForBox function. Since the layered single structure used in Appendix A is based on overlapping rectangles, the same value is added to each coordinate.
In
Step 7 shown in the procedure table 1 determines a single key for a single determined to be “best fit” to the data object. In Appendix A, a single key number is assigned using a Peano-Hilbert space-filling curve by calling the KeyGenerator function shown in lines 0623 to 0625 of the KeyForBox function. The KeyGenerator function is implemented in Appendix A, lines 0043-0485. Parameters given to the KeyGenerator function include the coordinates of the single minimum point and the corresponding level in the layered single structure. Note, however, that the uniqueness of the single key number between the different levels is ensured by the statement on line 0482 of Appendix A.
2.2 Query control function
The second class of functions is used to control spatial queries to the computer database. This class of functions transforms the query specification of a given common geometric query into a necessary and sufficient list of single keys that contain the data necessary to satisfy the query. This single-key list is a list that covers individual keys or a list of key ranges (implies that all keys are required, including the minimum and maximum values in the range) Can be expressed as
The most common type of spatial query is to find all objects that overlap in an area defined by a selected perimeter. Examples include rectangular window queries and polygon overlap queries. Procedure Table 3 shows the general usage of this type of query control function.
The software program in Appendix A implements one query control function set at lines 0655 to 1135. This set of functions identifies all singles that overlap a given longitude / latitude rectangle. Procedure Table 4 shows the algorithm usage of this function set.
The internal function KeyRectGenerator implemented in lines 0792-1020 of the software code in Appendix A is used to compute a set of singles at the current level. Similar to the method outlined above, this function tracks a single along each edge of the rectangle. However, the Peano-Hilbert space-filling curve is used to order the singles, and the Peano-Hilbert curve is guaranteed to be continuous by nature, so that each single on the edge goes into a rectangle. Or note whether going out of the rectangle, it is sufficient to sort the resulting list to find the minimum and maximum of each range implied, and let the curve fill the center. FIG. 17 shows how the Peano-Hilbert space-filling curve progresses continuously swelling through each tile in one level of the spatial database.
To extend the algorithm in Procedure 4 to perform a generic polygon query, while simultaneously tracking which single corresponds to the entry and exit points and which are redundant if any are redundant Care must be taken to track the polygonal path by perimeter shilling. However, it should be noted that the same minimum and maximum range organization works once the boundary single is identified. In general, this method will work if all singles that overlap in any closed region are detected.
2.3 Implementation in a conventional database
Database table 5 shows a sample database table that includes data objects that represent a portion of the street segment from FIG. The single column contains the assigned single key from FIG. The columns X1 / Y1 and X2 / Y2 contain the coordinates of the smallest bounding rectangle for each object in the selected single.
Query example 4 assumes that a functional interface similar to Appendix A exists for this layered single structure, and finds a portion of each data object with a minimum bounding rectangle that overlaps the rectangular query window. Therefore, a method of querying the database table 5 is shown. This inquiry corresponds to steps 3 to 5 in the procedure table 4. Thus, this query would have to be repeated once for each key range in order to find all segments that overlap the rectangle.
As illustrated in FIG. 16, the key ranges corresponding to the window of the query example 4 are 8 to 9, 17 to 20, and 21 to 21. However, note how the single overlap segment assigned to single 9 is selected as a result of performing this query using such a key range on database table 5. Other objects from FIG. 3 that are not listed in the database table 5 also overlap in this window.
SQL to detect all segments in the window for key range MinKey to MaxKey
The segmentation improvements identified in the preceding comparisons of FIGS. 12 and 15 can be validated by measuring how the invention works when given large amounts of real map data. it can. Data Table 3 shows one result of such a measurement. The data used to make such measurements is an excerpt of street segments from the Topographically Integrated Geographic Encoding and Referencing (TIGER) database file of the US Census Bureau in Los Angeles County, California. The Census TIGER file contains a de facto industry standard street map data source. Los Angeles County is large in size (in this excerpt, 426367 segments) and diverse in scope (dense urbanization center, irregular suburbs, low-population mountain and desert areas) A typical choice is good.
Data Table 3 compares the natural distribution of TIGER street segments in a layered single structure with 25% overlap and comparable hard boundary tiling as found in the prior art. These statistics were generated by supplying each segment to the KeyForBox function from the software program shown in Appendix A. To generate a single statistic with 25% overlap, a value of 2 was used for the nLevelLap parameter (shingle_overlap = tile_size * 1/2nLevelLap). To generate hard boundary tile statistics, a value of 32 was used for the nLevelLap parameter to force the overlap amount to zero.
The level column in the data table 3 indicates the level of the tile / single structure, where 0 is the finest division, 14 is the coarsest, and 15 is the top level partition. The size column shows the resulting quadrant split size (both width and height) in latitude / longitude degrees (= 180/2(15-Lev)). The size of a single is actually 25% larger than the value shown in the size column. Note, however, that the software program in Appendix A implements a single as a square in latitude / longitude space. The segment column accumulates the total number of TIGER street segments that fit naturally at this level (ie, do not cross tile / single boundaries and are returned by the pnLevel parameter of the KeyForBox function). The single and tile columns accumulate the total number of unique key values returned by the KeyForBox function. The Av column calculates the average number of segments per unique tile / single. The column Mx indicates the maximum number of segments associated with any one tile / single.
Next, we contrast the single statistic with 25% overlap in the data table 3 with the corresponding hard tile boundary structure. This serves as a rough model of how the quadtree data structure behaves in response to this addition of street segment data (but because of the structural dependence on storage space per quadtree node) However, this correspondence is not precise.) Observe the overall trend of increasing segment fragments cut by new boundaries introduced at each finer level. Specifically, in the case of
Insufficient statistics in hard tile boundary columns indicate why a quadtree cannot be used when storing this type of map data in this format. Rather, strategies such as data fragmentation, replication, or multiple indirection have been used to overcome this type of problem. Data Table 4 summarizes the number of objects that must be processed in one of these special case methods for various tile sizes. The statistics in this table clearly show the trade-off between minimizing the number of segments per tile and limiting the number of segments that must be managed by special cases.
As a result of the statistical trends identified by empirical analysis, the logarithmic cost of spatial search as seen by
A reasonable size of the values shown in Table 13 compared to a large population size is a factor that enables O (log (N)) performance behavior. For example, using the entire set of TIGER files for all counties in the United States, not just Los Angeles county, an increase of about 100 times the population size should increase the logarithmic component of Equation 7 by 2 (logTen(400,000) = 6.6; logTen(40,000,000) = 8.6). All other components of the formula will remain roughly the same. In addition, if the rectangular window search size changes dramatically, the behavior becomes unbalanced and can be corrected by adjusting the single size up and down. The software program shown in Appendix A has been tailored to process very detailed street map data.
Note, however, that Equation 7 represents the worst case that can actually be significantly improved. Specifically, ALX A value of a part of the expression log (N)LIs substantially reduced by ordering the singles using a Peano-Hilbert space-filling curve when storing the singles in a computer database, as is done in the software implementation shown in Appendix A. can do. Using this curve ensures that many adjacent singles are numbered consecutively. For example, if adjacent singles in a field ordered by a Peano-Hilbert curve are arbitrarily grouped by 3 × 3, there may be at most 4 consecutive sequences (see FIGS. 8 and 17).
Equation 7
Expected cost of window search using single number of the present invention in database table
Expected number of singles per search by level
The present invention provides an efficient method and system for organizing large amounts of data. As mentioned above, a database of information can contain hundreds of megabytes of data, which makes it very difficult to search efficiently. However, multidimensional data stored by the method and system of the present invention can be retrieved with significantly fewer processor cycles and disk seeks than conventional systems.
Each spatial object is assigned to a specific subregion by dividing the larger coordinate system into subregions. These subregions are called tiles because they resemble a series of tiles when overlaid on a set of spatial data. Thus, each tile will hold a specific set of spatial data. As a result, only a user who knows which tile holds the desired information has to search for that particular tile. When the computer user identifies spatial data located within a desired region in the spatial database, the system can begin the process of reading the several tiles from memory and collecting objects from the tiles. In this way, it prevents the system from analyzing all objects in the entire database for all computer user requests.
The present invention provides a series of overlaps between all tiles in the spatial database. Such overlapping tiles are referred to herein as “single” and represent tiles that overlap each closest neighbor. The overlap area for any single is predetermined to provide maximum efficiency. As was done in traditional systems, this single overlap allows more data objects in the spatial database to be assigned to a single single, and these objects are shared between multiple hard edge tiles. It will not be divided. As described above, it is very disadvantageous to divide one object among a plurality of tiles. This is because the system must track all tiles assigned to a particular object.
The system and method of the present invention alleviates the problem of small objects moving across the title boundary moving to a higher level. In the present invention, when sub-area layers are created, they are calculated to create overlapping regions. In the present invention, the single overlap size of each layer can be pre-programmed for fastest access to the spatial database, thus improving the efficiency of the individual databases.
A database with many small objects such as streets can be programmed with a single size smaller than a database with many large objects such as freeways. Adjusting the size of tiles and singles according to the size of the average data object keeps more data objects at a single lower level within the database architecture of the present invention. Thus, data objects that cannot fit within a single single can be stored in the next higher level single.
Appendix A
Claims (23)
領域(21)内の各データ・オブジェクトに、座標系における位置点を割り当てるステップと、
割り当てられた前記位置点を前記データベース内に記憶するステップと、
複数のシングル(17)を前記データベース内に記憶するステップであり、前記シングルの各々が、少なくとも他の前記シングルの1つに隣接し、前記シングルの各々が、該シングルに隣接している他の前記シングルと、所定面積でオーバーラップしており、階層的なシングル構造を有し、同じ層に在る前記シングルが同じ大きさであるステップと、
前記シングル(17)の各々に関して、位置点が前記シングル(17)内にある前記データ・オブジェクトを、前記データ・オブジェクトの大きさが前記シングルに完全に包含されている限り、隣接するシングルにオーバーラップしているシングルの部分を含んでいるそのシングルのみに割り当てるステップと、
割り当てられた前記データ・オブジェクトの情報及びシングルを前記データベースに記憶するステップとを含む方法。 Storing spatial data objects in a computer database, a method performed by a computer,
Assigning a position point in the coordinate system to each data object in region (21);
Storing the assigned position points in the database;
Storing a plurality of singles (17) in the database, wherein each of the singles is adjacent to at least one of the other singles, and each of the singles is adjacent to the single The single overlaps with a predetermined area, has a hierarchical single structure, and the singles in the same layer have the same size;
For each of the singles (17), the data object whose position point is within the single (17) is overwritten to an adjacent single as long as the size of the data object is completely contained in the single. Assigning only that single containing the part of the single that is wrapping;
Storing the allocated data object information and singles in the database .
複数のシングル(17)に区分された領域(21)に関するデータベースを記憶するコンピュータメモリであって、前記シングルの各々が、少なくとも他の前記シングルの1つに隣接し、前記シングルの各々が、該シングルに隣接している他の前記シングルと、所定面積でオーバーラップしており、階層的なシングル構造を有し、同じ層に在る前記シングルが同じ大きさであるコンピュータメモリと、A computer memory storing a database for a region (21) partitioned into a plurality of singles (17), wherein each of the singles is adjacent to at least one of the other singles, A computer memory that overlaps with another single adjacent to a single in a predetermined area, has a hierarchical single structure, and the single in the same layer is the same size;
プロセッサとを備え、With a processor,
前記プロセッサが、The processor is
座標系におけるデータ・オブジェクトの位置を決定するステップとDetermining the position of the data object in the coordinate system;
位置点がシングル(17)内にある前記データ・オブジェクトを、前記データ・オブジェクトの大きさが前記シングルの大きさより小さく、前記データ・オブジェクトが完全に前記シングルに包含されている限り、隣接するシングルにオーバーラップしているシングルの部分を含んでいるそのシングルに割り当てるステップと、A data object whose location point is within a single (17) is determined as long as the size of the data object is smaller than the size of the single and the data object is completely contained in the single. Assigning to a single that contains a single part that overlaps the
前記データ・オブジェクトを、それが割り当てられている前記シングルを参照して、前記コンピュータメモリ内に記憶するステップとを、Storing the data object in the computer memory with reference to the single to which it is assigned;
実行するように構成されているコンピュータシステム。A computer system that is configured to run.
前記座標系内の各点が少なくとも1つのシングルに割り当てられるように前記座標系のオーバーラップしているシングルの第2の層の境界を計算するステップと、Calculating the boundaries of the single second layer of the coordinate system overlapping such that each point in the coordinate system is assigned to at least one single;
前記第1の層内の前記シングルのサイズより大きい各空間データ・オブジェクトに、各空間データ・オブジェクトの位置点に基づいて前記第2の層の特定のシングルを割り当てるステップとを実行するように構成されている、請求項10〜18の何れか1項に記載のコンピュータシステム。Assigning each spatial data object larger than the size of the single in the first layer to a specific single of the second layer based on a position point of each spatial data object. The computer system according to claim 10, wherein the computer system is configured.
前記多次元オブジェクトのデータベースが、The database of multidimensional objects is
各オブジェクトが座標系内における1つの位置点を含む、1組の多次元オブジェクトと、A set of multidimensional objects, each object including a position point in the coordinate system;
各多次元オブジェクトを、座標系のシングルに参照付けるコードと、A code that references each multidimensional object to a single coordinate system,
を有する、請求項10〜20の何れか1項に記載のコンピュータシステム。The computer system according to claim 10, comprising:
Applications Claiming Priority (3)
| Application Number | Priority Date | Filing Date | Title |
|---|---|---|---|
| US08/807,471 US5963956A (en) | 1997-02-27 | 1997-02-27 | System and method of optimizing database queries in two or more dimensions |
| US08/807,471 | 1997-02-27 | ||
| PCT/US1998/003493 WO1998038561A2 (en) | 1997-02-27 | 1998-02-25 | A system and method of optimizing database queries in two or more dimensions |
Publications (3)
| Publication Number | Publication Date |
|---|---|
| JP2001513925A JP2001513925A (en) | 2001-09-04 |
| JP2001513925A5 JP2001513925A5 (en) | 2005-10-06 |
| JP4231943B2 true JP4231943B2 (en) | 2009-03-04 |
Family
ID=25196452
Family Applications (1)
| Application Number | Title | Priority Date | Filing Date |
|---|---|---|---|
| JP53775598A Expired - Lifetime JP4231943B2 (en) | 1997-02-27 | 1998-02-25 | System and method for optimizing database queries in two or more dimensions |
Country Status (7)
| Country | Link |
|---|---|
| US (4) | US5963956A (en) |
| EP (1) | EP0974108B1 (en) |
| JP (1) | JP4231943B2 (en) |
| AU (1) | AU733949B2 (en) |
| CA (1) | CA2282022C (en) |
| TW (1) | TW405079B (en) |
| WO (1) | WO1998038561A2 (en) |
Families Citing this family (204)
| Publication number | Priority date | Publication date | Assignee | Title |
|---|---|---|---|---|
| US6175835B1 (en) * | 1996-07-26 | 2001-01-16 | Ori Software Development, Ltd. | Layered index with a basic unbalanced partitioned index that allows a balanced structure of blocks |
| US6208993B1 (en) * | 1996-07-26 | 2001-03-27 | Ori Software Development Ltd. | Method for organizing directories |
| IL118959A (en) | 1996-07-26 | 1999-07-14 | Ori Software Dev Ltd | Database apparatus |
| US6133853A (en) | 1998-07-30 | 2000-10-17 | American Calcar, Inc. | Personal communication and positioning system |
| US6148261A (en) | 1997-06-20 | 2000-11-14 | American Calcar, Inc. | Personal communication system to send and receive voice data positioning information |
| US6675173B1 (en) | 1998-01-22 | 2004-01-06 | Ori Software Development Ltd. | Database apparatus |
| US6081624A (en) * | 1998-06-01 | 2000-06-27 | Autodesk, Inc. | Spatial index compression through spatial subdivision encoding |
| US6370551B1 (en) * | 1998-04-14 | 2002-04-09 | Fuji Xerox Co., Ltd. | Method and apparatus for displaying references to a user's document browsing history within the context of a new document |
| US6223182B1 (en) * | 1998-06-30 | 2001-04-24 | Oracle Corporation | Dynamic data organization |
| US6732120B1 (en) * | 1998-09-03 | 2004-05-04 | Geojet Information Solutions Inc. | System and method for processing and display of geographical data |
| US6772139B1 (en) * | 1998-10-05 | 2004-08-03 | Smith, Iii Julius O. | Method and apparatus for facilitating use of hypertext links on the world wide web |
| CA2347760A1 (en) | 1998-10-21 | 2000-04-27 | American Calcar Inc. | Positional camera and gps data interchange device |
| JP2002530766A (en) * | 1998-11-16 | 2002-09-17 | シコーレ アクティエボラーグ | How to manage your data |
| US6721759B1 (en) * | 1998-12-24 | 2004-04-13 | Sony Corporation | Techniques for spatial representation of data and browsing based on similarity |
| US6389375B1 (en) * | 1999-01-22 | 2002-05-14 | Interlego Ag | Virtual reality modelling |
| US6859769B1 (en) * | 1999-01-26 | 2005-02-22 | Analytical Graphics, Inc. | Method and apparatus for creating elements and systems for description of position and motion of bodies in three-dimensional space to support orbital maneuver analysis |
| US6323874B1 (en) * | 1999-02-08 | 2001-11-27 | Silicon Graphics, Inc. | System and method for rendering an image |
| US6353832B1 (en) * | 1999-05-11 | 2002-03-05 | Lucent Technologies Inc | Selectivity estimation in spatial databases |
| US6401098B1 (en) * | 1999-07-15 | 2002-06-04 | American Management Systems, Inc. | System for database creation, maintenance and access using event marking and two-dimensional partitioning |
| US6473809B1 (en) * | 1999-08-03 | 2002-10-29 | Matsushita Electric Industrial Co., Ltd. | Scheduling method and apparatus for network-attached storage devices and other systems |
| US6374242B1 (en) * | 1999-09-29 | 2002-04-16 | Lockheed Martin Corporation | Natural-language information processor with association searches limited within blocks |
| JP2003529054A (en) | 1999-10-19 | 2003-09-30 | アメリカン カルカー インコーポレイティド | Effective navigation technology based on user preferences |
| WO2001031510A1 (en) | 1999-10-27 | 2001-05-03 | American Calcar Inc. | System and method for user navigation |
| US6636849B1 (en) * | 1999-11-23 | 2003-10-21 | Genmetrics, Inc. | Data search employing metric spaces, multigrid indexes, and B-grid trees |
| US6526418B1 (en) * | 1999-12-16 | 2003-02-25 | Livevault Corporation | Systems and methods for backing up data files |
| KR20000023961A (en) * | 1999-12-22 | 2000-05-06 | 김정태 | Information modeling method and database search system |
| JP2003524259A (en) * | 2000-02-22 | 2003-08-12 | メタカルタ インコーポレイテッド | Spatial coding and display of information |
| US6324470B1 (en) | 2000-03-07 | 2001-11-27 | Navigation Technologies Corporation | Method and system for representing restricted driving maneuvers |
| US7343165B2 (en) * | 2000-04-11 | 2008-03-11 | American Calcar Inc. | GPS publication application server |
| US20020010572A1 (en) * | 2000-04-14 | 2002-01-24 | Lyman Orton | Integrated system for and method of supporting spatial decision making and land-use scenario analysis |
| US6591270B1 (en) | 2000-07-28 | 2003-07-08 | Navigation Technologies Corporation | Method for organizing map data |
| WO2002010939A1 (en) | 2000-07-28 | 2002-02-07 | American Calcar Inc. | Technique for effective organization and communication of information |
| US7027072B1 (en) * | 2000-10-13 | 2006-04-11 | Silicon Graphics, Inc. | Method and system for spatially compositing digital video images with a tile pattern library |
| US7689621B1 (en) * | 2000-11-06 | 2010-03-30 | Navteq North America, Llc | Multi-dimensional spatial index for a geographic database |
| JP4259864B2 (en) * | 2000-12-15 | 2009-04-30 | ブリティッシュ・テレコミュニケーションズ・パブリック・リミテッド・カンパニー | How to search for an entity |
| US7358974B2 (en) * | 2001-01-29 | 2008-04-15 | Silicon Graphics, Inc. | Method and system for minimizing an amount of data needed to test data against subarea boundaries in spatially composited digital video |
| US6804677B2 (en) * | 2001-02-26 | 2004-10-12 | Ori Software Development Ltd. | Encoding semi-structured data for efficient search and browsing |
| US7283987B2 (en) * | 2001-03-05 | 2007-10-16 | Sap Ag | Compression scheme for improving cache behavior in database systems |
| FR2822275B1 (en) * | 2001-03-13 | 2003-06-06 | Opteway | METHOD FOR SEARCHING AN OBJECT WITHIN A SPACE, METHOD AND SYSTEM FOR VECTOR MAPPING INCLUDING THIS SEARCH METHOD AND ELECTRONIC APPARATUS USING THIS METHOD FOR VECTOR MAPPING |
| US6732107B1 (en) * | 2001-03-26 | 2004-05-04 | Ncr Corporation | Spatial join method and apparatus |
| US7167856B2 (en) * | 2001-05-15 | 2007-01-23 | Jonathan Keir Lawder | Method of storing and retrieving multi-dimensional data using the hilbert curve |
| US20030033217A1 (en) * | 2001-05-18 | 2003-02-13 | International Business Machines Corporation | Method and system for mapping shelf space |
| US7580927B1 (en) * | 2001-05-29 | 2009-08-25 | Oracle International Corporation | Quadtree center tile/boundary tile optimization |
| US7219108B2 (en) * | 2001-06-22 | 2007-05-15 | Oracle International Corporation | Query prunning using exterior tiles in an R-tree index |
| US7080065B1 (en) * | 2001-06-22 | 2006-07-18 | Oracle International Corporation | Query pruning using interior rectangles in an R-tree index |
| US6879980B1 (en) * | 2001-06-29 | 2005-04-12 | Oracle International Corporation | Nearest neighbor query processing in a linear quadtree spatial index |
| US6985144B2 (en) * | 2001-10-30 | 2006-01-10 | Hewlett-Packard Development Company, L.P. | Layout design apparatus and method for three-dimensional graphical environments |
| US6919910B2 (en) * | 2001-10-30 | 2005-07-19 | Hewlett-Packard Development Company, L.P. | Apparatus and method for distributing representative images in partitioned areas of a three-dimensional graphical environment |
| US7287033B2 (en) * | 2002-03-06 | 2007-10-23 | Ori Software Development, Ltd. | Efficient traversals over hierarchical data and indexing semistructured data |
| US7152071B2 (en) * | 2002-05-01 | 2006-12-19 | Sun Microsystems, Inc. | Shape-based geometric database and methods and systems for construction and use thereof |
| US7383275B2 (en) | 2002-05-10 | 2008-06-03 | International Business Machines Corporation | Methods to improve indexing of multidimensional databases |
| US7143098B2 (en) * | 2002-05-10 | 2006-11-28 | International Business Machines Corporation | Systems, methods, and computer program products to reduce computer processing in grid cell size determination for indexing of multidimensional databases |
| US7373353B2 (en) * | 2002-05-10 | 2008-05-13 | International Business Machines Corporation | Reducing index size for multi-level grid indexes |
| US6891170B1 (en) * | 2002-06-17 | 2005-05-10 | Zyvex Corporation | Modular manipulation system for manipulating a sample under study with a microscope |
| US6782319B1 (en) | 2002-11-26 | 2004-08-24 | Navteq North America, Llc | Method for organizing map data |
| US7272608B2 (en) | 2002-11-27 | 2007-09-18 | Zyvex Labs, Llc | Isosurface extraction into splat hierarchy |
| US7519603B2 (en) * | 2002-11-27 | 2009-04-14 | Zyvex Labs, Llc | Efficient data structure |
| US7272607B2 (en) | 2002-11-27 | 2007-09-18 | Zyvex Labs, Llc | System and method for processing a hierarchical data tree |
| KR20040055901A (en) * | 2002-12-23 | 2004-06-30 | 한국전자통신연구원 | System and method for progressive spatial data service |
| US6993538B2 (en) * | 2003-01-28 | 2006-01-31 | Microsoft Corporation | System and process for identifying objects and/or points nearby a given object or point |
| EP1441293B1 (en) * | 2003-02-18 | 2004-08-04 | Hermann Dr.-Ing. Tropf | Database and method for organizing data elements |
| US20040181518A1 (en) * | 2003-03-14 | 2004-09-16 | Mayo Bryan Edward | System and method for an OLAP engine having dynamic disaggregation |
| US7181467B2 (en) * | 2003-03-27 | 2007-02-20 | Oracle International Corporation | Delayed distance computations for nearest-neighbor queries in an R-tree index |
| US7099882B2 (en) * | 2003-04-29 | 2006-08-29 | Navteq North America, Llc | Method and system for forming, updating, and using a geographic database |
| US7034837B2 (en) * | 2003-05-05 | 2006-04-25 | Silicon Graphics, Inc. | Method, system, and computer program product for determining a structure of a graphics compositor tree |
| US7177882B2 (en) * | 2003-09-05 | 2007-02-13 | Oracle International Corporation | Georaster physical data model for storing georeferenced raster data |
| WO2005031789A2 (en) * | 2003-09-23 | 2005-04-07 | Zyvex Corporation | Method, system and device for microscopic examination employing fib-prepared sample grasping element |
| US8972380B2 (en) * | 2003-09-29 | 2015-03-03 | International Business Machines Corporaton | System and method for monitoring events against continual range queries |
| US7835953B2 (en) * | 2003-09-29 | 2010-11-16 | International Business Machines Corporation | Method and structure for monitoring moving objects |
| US7225208B2 (en) * | 2003-09-30 | 2007-05-29 | Iron Mountain Incorporated | Systems and methods for backing up data files |
| US7813873B2 (en) * | 2003-12-19 | 2010-10-12 | Decarta Inc. | Geocoding locations near a specified city |
| US7668845B1 (en) * | 2004-02-18 | 2010-02-23 | Microsoft Corporation | C-tree for multi-attribute indexing |
| TW200531420A (en) | 2004-02-20 | 2005-09-16 | Zyvex Corp | Positioning device for microscopic motion |
| JP2005251745A (en) | 2004-02-23 | 2005-09-15 | Zyvex Corp | Probe operation of charged particle beam device |
| US20050198008A1 (en) * | 2004-03-02 | 2005-09-08 | Adler David W. | Index exploitation for spatial data |
| US7326293B2 (en) | 2004-03-26 | 2008-02-05 | Zyvex Labs, Llc | Patterned atomic layer epitaxy |
| US7313568B2 (en) * | 2004-03-31 | 2007-12-25 | International Business Machines Corporation | Generating and analyzing business process-aware modules |
| US7457813B2 (en) * | 2004-10-06 | 2008-11-25 | Burnside Acquisition, Llc | Storage system for randomly named blocks of data |
| US7400784B2 (en) * | 2004-10-19 | 2008-07-15 | Institut National De L'audiovisuel-Ina | Search of similar features representing objects in a large reference database |
| WO2006046669A1 (en) * | 2004-10-28 | 2006-05-04 | University Of Fukui | Database management device, method and program |
| US7389283B2 (en) * | 2004-12-07 | 2008-06-17 | International Business Machines Corporation | Method for determining an optimal grid index specification for multidimensional data |
| US7877405B2 (en) * | 2005-01-07 | 2011-01-25 | Oracle International Corporation | Pruning of spatial queries using index root MBRS on partitioned indexes |
| US20060227135A1 (en) * | 2005-03-31 | 2006-10-12 | Johnson Peter W | System and method for N-dimensional parametric analysis |
| US7353034B2 (en) | 2005-04-04 | 2008-04-01 | X One, Inc. | Location sharing and tracking using mobile phones or other wireless devices |
| US20060235742A1 (en) * | 2005-04-18 | 2006-10-19 | Castellanos Maria G | System and method for process evaluation |
| US7991779B1 (en) * | 2005-04-25 | 2011-08-02 | Hewlett Packard Development Company, L.P. | Method and apparatus for populating an index table |
| US20060242169A1 (en) * | 2005-04-25 | 2006-10-26 | Microsoft Corporation | Storing and indexing hierarchical data spatially |
| US20060265352A1 (en) * | 2005-05-20 | 2006-11-23 | International Business Machines Corporation | Methods and apparatus for information integration in accordance with web services |
| AU2006263703A1 (en) | 2005-06-28 | 2007-01-04 | Nokia Corporation | User interface for geographic search |
| AU2005239672B2 (en) * | 2005-11-30 | 2009-06-11 | Canon Kabushiki Kaisha | Sortable collection browser |
| US7903125B1 (en) | 2006-02-07 | 2011-03-08 | Adobe Systems Incorporated | Compact clustered 2-D layout |
| US20070192215A1 (en) * | 2006-02-10 | 2007-08-16 | Taylor Thomas B | Computer-implemented registration for providing inventory fulfillment services to merchants |
| JP2009526327A (en) | 2006-02-10 | 2009-07-16 | メタカータ・インコーポレーテッド | System and method for spatial thumbnails and companion maps for media objects |
| TW200731760A (en) * | 2006-02-13 | 2007-08-16 | Benq Corp | Image capturing method and image-capturing device thereof |
| US7912296B1 (en) | 2006-05-02 | 2011-03-22 | Google Inc. | Coverage mask generation for large images |
| US7965902B1 (en) | 2006-05-19 | 2011-06-21 | Google Inc. | Large-scale image processing using mass parallelization techniques |
| US20080010273A1 (en) * | 2006-06-12 | 2008-01-10 | Metacarta, Inc. | Systems and methods for hierarchical organization and presentation of geographic search results |
| US8762493B1 (en) * | 2006-06-22 | 2014-06-24 | Google Inc. | Hierarchical spatial data structure and 3D index data versioning for generating packet data |
| US20080065685A1 (en) * | 2006-08-04 | 2008-03-13 | Metacarta, Inc. | Systems and methods for presenting results of geographic text searches |
| US9721157B2 (en) | 2006-08-04 | 2017-08-01 | Nokia Technologies Oy | Systems and methods for obtaining and using information from map images |
| WO2008019348A2 (en) * | 2006-08-04 | 2008-02-14 | Metacarta, Inc. | Systems and methods for presenting results of geographic text searches |
| US20080097954A1 (en) * | 2006-10-20 | 2008-04-24 | Microsoft Corporation | Ranged lookups |
| WO2008055234A2 (en) * | 2006-10-31 | 2008-05-08 | Metacarta, Inc. | Systems and methods for predictive models using geographic text search |
| US9146948B2 (en) * | 2006-12-12 | 2015-09-29 | International Business Machines Corporation | Hilbert ordering of multidimensional tuples within computing systems |
| WO2009075689A2 (en) | 2006-12-21 | 2009-06-18 | Metacarta, Inc. | Methods of systems of using geographic meta-metadata in information retrieval and document displays |
| US20080222080A1 (en) * | 2007-03-06 | 2008-09-11 | Nitrosecurity, Inc. | Inferred index of circular tables in a database |
| US8244772B2 (en) * | 2007-03-29 | 2012-08-14 | Franz, Inc. | Method for creating a scalable graph database using coordinate data elements |
| US7853480B2 (en) * | 2007-05-21 | 2010-12-14 | Amazon Technologies, Inc. | System and method for providing export services to merchants |
| EP2015275B1 (en) * | 2007-07-11 | 2017-12-13 | Alcatel Lucent | Method for tracking moving entities |
| US8943038B2 (en) * | 2007-10-04 | 2015-01-27 | Gefemer Research Acquisitions, Llc | Method and apparatus for integrated cross platform multimedia broadband search and selection user interface communication |
| KR100907283B1 (en) * | 2007-10-31 | 2009-07-13 | 연세대학교 산학협력단 | Method and apparatus for finding cluster over data streams |
| US20090132469A1 (en) * | 2007-11-16 | 2009-05-21 | Urban Mapping, Inc. | Geocoding based on neighborhoods and other uniquely defined informal spaces or geographical regions |
| JP4921335B2 (en) * | 2007-12-10 | 2012-04-25 | キヤノン株式会社 | Document processing apparatus and search method |
| US8429133B2 (en) * | 2007-12-13 | 2013-04-23 | Oracle International Corporation | Partial key indexes |
| US8001139B2 (en) * | 2007-12-20 | 2011-08-16 | Yahoo! Inc. | Using a bipartite graph to model and derive image and text associations |
| US7734714B2 (en) * | 2008-01-11 | 2010-06-08 | Spacecurve, Inc. | Spatial Sieve Tree |
| US8185568B2 (en) * | 2008-03-24 | 2012-05-22 | Shlomo Selim Rakib | Method of providing space filling patterns |
| AU2009231001A1 (en) | 2008-04-01 | 2009-10-08 | Decarta Inc. | Point of interest search along a route |
| US8489324B2 (en) * | 2008-04-01 | 2013-07-16 | Decarta Inc. | Retrieval of vehicular traffic information optimized for wireless mobile environments |
| EP2274576B1 (en) | 2008-04-01 | 2020-04-01 | Uber Technologies, Inc. | Transmission of routes between client and server using route ids |
| US8510310B2 (en) * | 2008-12-23 | 2013-08-13 | Zhijing George Mou | Method and system for multi-dimensional and geographic search |
| US20100185672A1 (en) * | 2009-01-21 | 2010-07-22 | Rising Iii Hawley K | Techniques for spatial representation of data and browsing based on similarity |
| AU2009343389B2 (en) | 2009-04-01 | 2015-10-29 | Uber Technologies, Inc. | Point of interest search along a route with return |
| EP2241983B1 (en) * | 2009-04-17 | 2012-12-19 | Fraunhofer-Gesellschaft zur Förderung der angewandten Forschung e.V. | Method for searching objects in a database |
| US8255418B2 (en) * | 2009-05-05 | 2012-08-28 | Real Estate Portal Usa, Llc | Networked computer system providing an integrated suite of web services and a geographic information system (GIS) for real property and land parcels |
| US8532925B2 (en) * | 2009-05-08 | 2013-09-10 | Alpine Electronics, Inc. | Spatial indexing method and apparatus for navigation system for indexing and retrieval of XML map data |
| US20130066881A1 (en) * | 2009-05-15 | 2013-03-14 | Hyundai Motor Company | Indexing system of spatial information for combined soi object and content |
| US8290952B2 (en) * | 2009-06-24 | 2012-10-16 | Nokia Corporation | Method and apparatus for retrieving nearby data |
| EP2483804B1 (en) | 2009-10-02 | 2016-05-18 | VRVIS Zentrum Für Virtual Reality Und Visualisierung Forschungs-GmbH | Visual queries in data exploration |
| US20110087425A1 (en) * | 2009-10-08 | 2011-04-14 | Telenav, Inc. | Navigation system with map compression and method of operation thereof |
| KR101405460B1 (en) * | 2009-12-04 | 2014-06-11 | 한국전자통신연구원 | System and method for rapid wave propagation analysis using 3d spatial indexing and 3d culling techniques |
| GB2477307A (en) * | 2010-01-28 | 2011-08-03 | Adsensa Ltd | Embedding authentication data into an electronic document image |
| US20110196602A1 (en) * | 2010-02-08 | 2011-08-11 | Navteq North America, Llc | Destination search in a navigation system using a spatial index structure |
| WO2011110903A1 (en) * | 2010-03-07 | 2011-09-15 | Onn Haran | System and method for improving communications in ad-hoc vehicular networks |
| TWI398828B (en) * | 2010-04-06 | 2013-06-11 | Univ Nat Sun Yat Sen | A Method of Seeking Range Query in Hilbert Curve |
| US8788543B2 (en) * | 2010-05-13 | 2014-07-22 | International Business Machines Corporation | Scalable, concurrent resizing of hash tables |
| US8352480B2 (en) | 2010-12-20 | 2013-01-08 | Nokia Corporation | Methods, apparatuses and computer program products for converting a geographical database into a map tile database |
| JP5678790B2 (en) * | 2011-05-02 | 2015-03-04 | 富士通株式会社 | Index management method, index management program, and index management apparatus |
| US20120311474A1 (en) * | 2011-06-02 | 2012-12-06 | Microsoft Corporation | Map-based methods of visualizing relational databases |
| US8659600B2 (en) * | 2011-07-13 | 2014-02-25 | Pixar | Generating vector displacement maps using parameterized sculpted meshes |
| WO2013046669A1 (en) * | 2011-09-27 | 2013-04-04 | 日本電気株式会社 | Space-filling curve processing system, space-filling curve processing method, and program |
| US9069707B1 (en) | 2011-11-03 | 2015-06-30 | Permabit Technology Corp. | Indexing deduplicated data |
| JP5867145B2 (en) * | 2012-02-20 | 2016-02-24 | 富士通株式会社 | File management apparatus, file management system, file management method, and file management program |
| US9148699B2 (en) * | 2012-06-01 | 2015-09-29 | Texas Instruments Incorporated | Optimized algorithm for construction of composite video from a set of discrete video sources |
| US8650220B2 (en) * | 2012-06-05 | 2014-02-11 | Google Inc. | System and method for storing and retrieving geospatial data |
| WO2014024142A2 (en) * | 2012-08-07 | 2014-02-13 | Koninklijke Philips N.V. | Population classification of genetic data set using tree based spatial data structure |
| US8812488B2 (en) * | 2012-08-16 | 2014-08-19 | Oracle International Corporation | Constructing multidimensional histograms for complex spatial geometry objects |
| US8751526B1 (en) | 2012-08-29 | 2014-06-10 | Bentley Systems, Incorporated | Efficient range unions in SQL |
| US9053191B2 (en) | 2012-08-30 | 2015-06-09 | Facebook, Inc. | Retroactive search of objects using k-d tree |
| US9058347B2 (en) * | 2012-08-30 | 2015-06-16 | Facebook, Inc. | Prospective search of objects using K-D forest |
| US8965900B2 (en) | 2012-09-14 | 2015-02-24 | Bentley Systems, Incorporated | Efficiently finding spatially scored best entities |
| US9157751B2 (en) * | 2012-11-09 | 2015-10-13 | Here Global B.V. | Navigation system and method |
| CN103116610A (en) * | 2013-01-23 | 2013-05-22 | 浙江大学 | Vector space big data storage method based on HBase |
| CN103106276B (en) * | 2013-02-17 | 2016-03-30 | 南京师范大学 | A kind of vector data grid index method of encoding based on little angle |
| US9367938B2 (en) * | 2013-02-28 | 2016-06-14 | Nokia Technologies Oy | Method and apparatus for automated real-time detection of overlapping painted markup elements |
| US9953042B1 (en) | 2013-03-01 | 2018-04-24 | Red Hat, Inc. | Managing a deduplicated data index |
| US9501526B2 (en) * | 2013-04-17 | 2016-11-22 | Excalibur Ip, Llc | Efficient database searching |
| US9922062B2 (en) * | 2013-07-16 | 2018-03-20 | Clearag, Inc. | High-performance gridded data storage, arrangement and extraction |
| US9317529B2 (en) | 2013-08-14 | 2016-04-19 | Oracle International Corporation | Memory-efficient spatial histogram construction |
| US9836519B2 (en) | 2013-09-20 | 2017-12-05 | Oracle International Corporation | Densely grouping dimensional data |
| US9990398B2 (en) | 2013-09-20 | 2018-06-05 | Oracle International Corporation | Inferring dimensional metadata from content of a query |
| US9740718B2 (en) | 2013-09-20 | 2017-08-22 | Oracle International Corporation | Aggregating dimensional data using dense containers |
| US10210197B2 (en) | 2013-10-18 | 2019-02-19 | New York Air Brake Corporation | Dynamically scalable distributed heterogenous platform relational database |
| WO2015057243A1 (en) * | 2013-10-18 | 2015-04-23 | New York Air Brake Corporation | Dynamically scalable distributed heterogenous platform relational database |
| US20150113379A1 (en) * | 2013-10-23 | 2015-04-23 | Schlumberger Technology Corporation | Representation of unstructured grids |
| EP3129112B1 (en) * | 2014-04-15 | 2023-06-07 | King.com Limited | Device, game and methods therefore |
| US9613055B2 (en) * | 2014-05-09 | 2017-04-04 | Sap Se | Querying spatial data in column stores using tree-order scans |
| US9720931B2 (en) | 2014-05-09 | 2017-08-01 | Sap Se | Querying spatial data in column stores using grid-order scans |
| CN106796589B (en) * | 2014-05-30 | 2021-01-15 | 湖北第二师范学院 | Indexing method and system for spatial data object |
| GB2528669B (en) * | 2014-07-25 | 2017-05-24 | Toshiba Res Europe Ltd | Image Analysis Method |
| JP6220323B2 (en) | 2014-09-05 | 2017-10-25 | 株式会社東芝 | Object search device and search method thereof |
| US9916671B2 (en) * | 2014-09-09 | 2018-03-13 | Adobe Systems Incorporated | Spatial visualization of metrics |
| US10162860B2 (en) | 2014-10-20 | 2018-12-25 | International Business Machines Corporation | Selectivity estimation for query execution planning in a database |
| US10007677B1 (en) | 2014-12-04 | 2018-06-26 | Google Llc | System and method for geospatial indexing |
| US9786071B2 (en) * | 2015-03-25 | 2017-10-10 | International Business Machines Corporation | Geometric shape hierarchy determination to provide visualization context |
| US20160334233A1 (en) * | 2015-05-15 | 2016-11-17 | Richard Gary John BAVERSTOCK | Elevation query systems for vehicular route optimization and methods thereof |
| GB201515950D0 (en) * | 2015-09-09 | 2015-10-21 | Ibm | Method for processing large data tables |
| US10678792B2 (en) | 2015-10-23 | 2020-06-09 | Oracle International Corporation | Parallel execution of queries with a recursive clause |
| US10783142B2 (en) | 2015-10-23 | 2020-09-22 | Oracle International Corporation | Efficient data retrieval in staged use of in-memory cursor duration temporary tables |
| US10642831B2 (en) | 2015-10-23 | 2020-05-05 | Oracle International Corporation | Static data caching for queries with a clause that requires multiple iterations to execute |
| US10156841B2 (en) | 2015-12-31 | 2018-12-18 | General Electric Company | Identity management and device enrollment in a cloud service |
| US10839569B2 (en) * | 2016-02-03 | 2020-11-17 | NorthStar Memorial Group LLC | System for geospatial mapping of cemetery properties |
| CN105828292A (en) * | 2016-05-09 | 2016-08-03 | 青岛海信移动通信技术股份有限公司 | Position detecting method and device based on geo-fencing |
| JP6630825B2 (en) * | 2016-06-06 | 2020-01-15 | Kddi株式会社 | Map information transmitting device, map display device, program, and method for transmitting an object to be superimposed on a map |
| US10650012B1 (en) * | 2016-07-13 | 2020-05-12 | United States Of America As Represented By Secretary Of The Navy | Multi-dimensional range-index searching using search box approximation and splitting |
| RU2759697C2 (en) | 2016-08-25 | 2021-11-16 | Конинклейке Филипс Н.В. | Saving and extracting spatial data to/from database |
| US10558659B2 (en) | 2016-09-16 | 2020-02-11 | Oracle International Corporation | Techniques for dictionary based join and aggregation |
| US11741137B2 (en) * | 2016-09-26 | 2023-08-29 | Sanjiv Kapoor | Biased string search structures with embedded range search structures |
| US20180199549A1 (en) * | 2017-01-15 | 2018-07-19 | Thomas A. Brake | Hygienic nesting Cavity for Birds |
| US10678842B2 (en) | 2017-03-21 | 2020-06-09 | EarthX, Inc. | Geostory method and apparatus |
| US11086876B2 (en) | 2017-09-29 | 2021-08-10 | Oracle International Corporation | Storing derived summaries on persistent memory of a storage device |
| US11048679B2 (en) | 2017-10-31 | 2021-06-29 | Oracle International Corporation | Adaptive resolution histogram on complex datatypes |
| US10747783B2 (en) | 2017-12-14 | 2020-08-18 | Ebay Inc. | Database access using a z-curve |
| US11475003B1 (en) * | 2018-10-31 | 2022-10-18 | Anaplan, Inc. | Method and system for servicing query requests using dataspaces |
| US11281683B1 (en) | 2018-10-31 | 2022-03-22 | Anaplan, Inc. | Distributed computation system for servicing queries using revisions maps |
| US11580105B2 (en) | 2018-10-31 | 2023-02-14 | Anaplan, Inc. | Method and system for implementing subscription barriers in a distributed computation system |
| US11481378B1 (en) | 2018-10-31 | 2022-10-25 | Anaplan, Inc. | Method and system for servicing query requests using document-based metadata |
| US11354324B1 (en) | 2018-10-31 | 2022-06-07 | Anaplan, Inc. | Method and system for servicing query requests using revisions maps |
| US11573927B1 (en) | 2018-10-31 | 2023-02-07 | Anaplan, Inc. | Method and system for implementing hidden subscriptions in a distributed computation system |
| US11222018B2 (en) | 2019-09-09 | 2022-01-11 | Oracle International Corporation | Cache conscious techniques for generation of quasi-dense grouping codes of compressed columnar data in relational database systems |
| US11507590B2 (en) | 2019-09-13 | 2022-11-22 | Oracle International Corporation | Techniques for in-memory spatial object filtering |
| CN113220928A (en) * | 2020-01-21 | 2021-08-06 | 北京达佳互联信息技术有限公司 | Image searching method and device, electronic equipment and storage medium |
| CN113179313B (en) * | 2021-04-25 | 2023-04-07 | 湖南视觉伟业智能科技有限公司 | Distributed space-time query method and system |
| KR102508100B1 (en) * | 2022-07-22 | 2023-03-10 | 헬리오센 주식회사 | High speed searching system that raises reliability of mapping data of non-spatial information and 3D space information and method therefor |
Family Cites Families (6)
| Publication number | Priority date | Publication date | Assignee | Title |
|---|---|---|---|---|
| CA2027253C (en) * | 1989-12-29 | 1997-12-16 | Steven C. Bagley | Editing text in an image |
| US5353391A (en) * | 1991-05-06 | 1994-10-04 | Apple Computer, Inc. | Method apparatus for transitioning between sequences of images |
| US5359712A (en) * | 1991-05-06 | 1994-10-25 | Apple Computer, Inc. | Method and apparatus for transitioning between sequences of digital information |
| US5546572A (en) * | 1991-08-28 | 1996-08-13 | Hitachi, Ltd. | Method for retrieving database of image information |
| US5566349A (en) * | 1994-05-16 | 1996-10-15 | Trout; Ray C. | Complementary concurrent cooperative multi-processing multi-tasking processing system using shared memories with a minimum of four complementary processors |
| US5568200A (en) * | 1995-06-07 | 1996-10-22 | Hitachi America, Ltd. | Method and apparatus for improved video display of progressively refreshed coded video |
-
1997
- 1997-02-27 US US08/807,471 patent/US5963956A/en not_active Expired - Lifetime
-
1998
- 1998-02-25 JP JP53775598A patent/JP4231943B2/en not_active Expired - Lifetime
- 1998-02-25 EP EP98907591A patent/EP0974108B1/en not_active Expired - Lifetime
- 1998-02-25 CA CA002282022A patent/CA2282022C/en not_active Expired - Lifetime
- 1998-02-25 WO PCT/US1998/003493 patent/WO1998038561A2/en active IP Right Grant
- 1998-02-25 AU AU63357/98A patent/AU733949B2/en not_active Expired
- 1998-02-26 TW TW087102772A patent/TW405079B/en not_active IP Right Cessation
-
1999
- 1999-01-14 US US09/231,515 patent/US6470287B1/en not_active Expired - Lifetime
-
2002
- 2002-10-22 US US10/278,126 patent/US7035869B2/en not_active Expired - Fee Related
-
2006
- 2006-03-20 US US11/385,625 patent/US7725425B2/en not_active Expired - Fee Related
Also Published As
| Publication number | Publication date |
|---|---|
| US6470287B1 (en) | 2002-10-22 |
| US20060184519A1 (en) | 2006-08-17 |
| US20030187867A1 (en) | 2003-10-02 |
| TW405079B (en) | 2000-09-11 |
| CA2282022C (en) | 2006-02-14 |
| WO1998038561A2 (en) | 1998-09-03 |
| US7725425B2 (en) | 2010-05-25 |
| EP0974108A2 (en) | 2000-01-26 |
| EP0974108B1 (en) | 2013-01-16 |
| AU6335798A (en) | 1998-09-18 |
| US7035869B2 (en) | 2006-04-25 |
| US5963956A (en) | 1999-10-05 |
| WO1998038561A3 (en) | 1998-12-03 |
| AU733949B2 (en) | 2001-05-31 |
| EP0974108A4 (en) | 2005-05-18 |
| JP2001513925A (en) | 2001-09-04 |
| CA2282022A1 (en) | 1998-09-03 |
Similar Documents
| Publication | Publication Date | Title |
|---|---|---|
| JP4231943B2 (en) | System and method for optimizing database queries in two or more dimensions | |
| Procopiuc et al. | Bkd-tree: A dynamic scalable kd-tree | |
| Gaede et al. | Multidimensional access methods | |
| Hoel et al. | Benchmarking spatial join operations with spatial output | |
| Henrich | A Distance Scan Algorithm for Spatial Access Structures. | |
| Nievergelt et al. | Spatial data structures: Concepts and design choices | |
| Hjaltason et al. | Ranking in spatial databases | |
| US7080065B1 (en) | Query pruning using interior rectangles in an R-tree index | |
| Hoel et al. | A qualitative comparison study of data structures for large line segment databases | |
| Gunther et al. | Tree-based access methods for spatial databases: Implementation and performance evaluation | |
| US7181467B2 (en) | Delayed distance computations for nearest-neighbor queries in an R-tree index | |
| Ooi et al. | Indexing in spatial databases | |
| Ooi | Spatial kd-tree: A data structure for geographic database | |
| Gavrila | R-tree index optimization | |
| Aref et al. | Efficient window block retrieval in quadtree-based spatial databases | |
| Roumelis et al. | An efficient algorithm for bulk-loading xBR+-trees | |
| Song et al. | Spatial indexing for massively update intensive applications | |
| Ooi et al. | Spatial indexing in binary decomposition and spatial bounding | |
| Al-Badarneh et al. | A new enhancement to the R-tree node splitting | |
| Belussi et al. | Using spatial data access structures for filtering nearest neighbor queries | |
| Kim et al. | Sibling clustering of tree-based spatial indexes for efficient spatial query processing | |
| Koudas | Indexing support for spatial joins | |
| Van Oosterom et al. | Testing current DBMS products with real spatial data | |
| Kuo et al. | A data structure for fast region searches | |
| Egenhofer | Managing storage structures for spatial data in databases |
Legal Events
| Date | Code | Title | Description |
|---|---|---|---|
| A521 | Request for written amendment filed |
Free format text: JAPANESE INTERMEDIATE CODE: A523 Effective date: 20050221 |
|
| A621 | Written request for application examination |
Free format text: JAPANESE INTERMEDIATE CODE: A621 Effective date: 20050221 |
|
| A131 | Notification of reasons for refusal |
Free format text: JAPANESE INTERMEDIATE CODE: A131 Effective date: 20080408 |
|
| A601 | Written request for extension of time |
Free format text: JAPANESE INTERMEDIATE CODE: A601 Effective date: 20080704 |
|
| A602 | Written permission of extension of time |
Free format text: JAPANESE INTERMEDIATE CODE: A602 Effective date: 20080811 |
|
| A521 | Request for written amendment filed |
Free format text: JAPANESE INTERMEDIATE CODE: A523 Effective date: 20080806 |
|
| TRDD | Decision of grant or rejection written | ||
| A01 | Written decision to grant a patent or to grant a registration (utility model) |
Free format text: JAPANESE INTERMEDIATE CODE: A01 Effective date: 20081021 |
|
| A01 | Written decision to grant a patent or to grant a registration (utility model) |
Free format text: JAPANESE INTERMEDIATE CODE: A01 |
|
| A61 | First payment of annual fees (during grant procedure) |
Free format text: JAPANESE INTERMEDIATE CODE: A61 Effective date: 20081119 |
|
| A72 | Notification of change in name of applicant |
Free format text: JAPANESE INTERMEDIATE CODE: A721 Effective date: 20081119 |
|
| FPAY | Renewal fee payment (event date is renewal date of database) |
Free format text: PAYMENT UNTIL: 20111219 Year of fee payment: 3 |
|
| R150 | Certificate of patent or registration of utility model |
Free format text: JAPANESE INTERMEDIATE CODE: R150 |
|
| FPAY | Renewal fee payment (event date is renewal date of database) |
Free format text: PAYMENT UNTIL: 20121219 Year of fee payment: 4 |
|
| FPAY | Renewal fee payment (event date is renewal date of database) |
Free format text: PAYMENT UNTIL: 20121219 Year of fee payment: 4 |
|
| FPAY | Renewal fee payment (event date is renewal date of database) |
Free format text: PAYMENT UNTIL: 20131219 Year of fee payment: 5 |
|
| R250 | Receipt of annual fees |
Free format text: JAPANESE INTERMEDIATE CODE: R250 |
|
| R250 | Receipt of annual fees |
Free format text: JAPANESE INTERMEDIATE CODE: R250 |
|
| R250 | Receipt of annual fees |
Free format text: JAPANESE INTERMEDIATE CODE: R250 |
|
| R250 | Receipt of annual fees |
Free format text: JAPANESE INTERMEDIATE CODE: R250 |
|
| S111 | Request for change of ownership or part of ownership |
Free format text: JAPANESE INTERMEDIATE CODE: R313113 |
|
| S531 | Written request for registration of change of domicile |
Free format text: JAPANESE INTERMEDIATE CODE: R313531 |
|
| S533 | Written request for registration of change of name |
Free format text: JAPANESE INTERMEDIATE CODE: R313533 |
|
| R350 | Written notification of registration of transfer |
Free format text: JAPANESE INTERMEDIATE CODE: R350 |
|
| R250 | Receipt of annual fees |
Free format text: JAPANESE INTERMEDIATE CODE: R250 |
|
| EXPY | Cancellation because of completion of term |