JP4044659B2 - Method and apparatus for converting analytical information and computer readable storage medium for use in converting spectral information - Google Patents
Method and apparatus for converting analytical information and computer readable storage medium for use in converting spectral information Download PDFInfo
- Publication number
- JP4044659B2 JP4044659B2 JP35374897A JP35374897A JP4044659B2 JP 4044659 B2 JP4044659 B2 JP 4044659B2 JP 35374897 A JP35374897 A JP 35374897A JP 35374897 A JP35374897 A JP 35374897A JP 4044659 B2 JP4044659 B2 JP 4044659B2
- Authority
- JP
- Japan
- Prior art keywords
- spectral
- information
- function
- converting
- standard function
- Prior art date
- Legal status (The legal status is an assumption and is not a legal conclusion. Google has not performed a legal analysis and makes no representation as to the accuracy of the status listed.)
- Expired - Fee Related
Links
- 230000003595 spectral effect Effects 0.000 title claims description 155
- 238000000034 method Methods 0.000 title claims description 27
- 238000004458 analytical method Methods 0.000 claims description 49
- 238000006243 chemical reaction Methods 0.000 claims description 29
- 238000001228 spectrum Methods 0.000 claims description 20
- 238000005259 measurement Methods 0.000 claims description 18
- 238000004364 calculation method Methods 0.000 claims description 11
- 230000001419 dependent effect Effects 0.000 claims description 10
- 238000005033 Fourier transform infrared spectroscopy Methods 0.000 claims description 6
- 230000001131 transforming effect Effects 0.000 claims description 5
- 230000006870 function Effects 0.000 description 54
- 239000000523 sample Substances 0.000 description 44
- 239000007788 liquid Substances 0.000 description 14
- 230000003287 optical effect Effects 0.000 description 14
- 239000007789 gas Substances 0.000 description 12
- 239000012159 carrier gas Substances 0.000 description 8
- 239000011159 matrix material Substances 0.000 description 8
- 239000000835 fiber Substances 0.000 description 7
- 238000010586 diagram Methods 0.000 description 6
- 239000000463 material Substances 0.000 description 5
- 238000012545 processing Methods 0.000 description 5
- 238000012360 testing method Methods 0.000 description 5
- 239000000203 mixture Substances 0.000 description 4
- 238000010521 absorption reaction Methods 0.000 description 3
- 230000008859 change Effects 0.000 description 3
- 239000006185 dispersion Substances 0.000 description 3
- 230000014509 gene expression Effects 0.000 description 3
- TVMXDCGIABBOFY-UHFFFAOYSA-N octane Chemical compound CCCCCCCC TVMXDCGIABBOFY-UHFFFAOYSA-N 0.000 description 3
- 230000008901 benefit Effects 0.000 description 2
- 238000010828 elution Methods 0.000 description 2
- 239000013307 optical fiber Substances 0.000 description 2
- 230000008569 process Effects 0.000 description 2
- 239000013598 vector Substances 0.000 description 2
- NCGICGYLBXGBGN-UHFFFAOYSA-N 3-morpholin-4-yl-1-oxa-3-azonia-2-azanidacyclopent-3-en-5-imine;hydrochloride Chemical compound Cl.[N-]1OC(=N)C=[N+]1N1CCOCC1 NCGICGYLBXGBGN-UHFFFAOYSA-N 0.000 description 1
- 230000005526 G1 to G0 transition Effects 0.000 description 1
- 238000001069 Raman spectroscopy Methods 0.000 description 1
- 238000000862 absorption spectrum Methods 0.000 description 1
- 239000003463 adsorbent Substances 0.000 description 1
- 238000012937 correction Methods 0.000 description 1
- 238000013461 design Methods 0.000 description 1
- 238000001514 detection method Methods 0.000 description 1
- 230000000694 effects Effects 0.000 description 1
- 230000005284 excitation Effects 0.000 description 1
- 230000006698 induction Effects 0.000 description 1
- 230000003993 interaction Effects 0.000 description 1
- 230000031700 light absorption Effects 0.000 description 1
- 238000004519 manufacturing process Methods 0.000 description 1
- 238000007620 mathematical function Methods 0.000 description 1
- 238000012986 modification Methods 0.000 description 1
- 230000004048 modification Effects 0.000 description 1
- 238000010606 normalization Methods 0.000 description 1
- 230000000704 physical effect Effects 0.000 description 1
- 238000000053 physical method Methods 0.000 description 1
- 238000004451 qualitative analysis Methods 0.000 description 1
- 230000035945 sensitivity Effects 0.000 description 1
- 238000000926 separation method Methods 0.000 description 1
- 238000004611 spectroscopical analysis Methods 0.000 description 1
- 239000000126 substance Substances 0.000 description 1
- 230000036962 time dependent Effects 0.000 description 1
- 238000012546 transfer Methods 0.000 description 1
- 230000009466 transformation Effects 0.000 description 1
- 230000003442 weekly effect Effects 0.000 description 1
Images


Classifications
-
- G—PHYSICS
- G01—MEASURING; TESTING
- G01J—MEASUREMENT OF INTENSITY, VELOCITY, SPECTRAL CONTENT, POLARISATION, PHASE OR PULSE CHARACTERISTICS OF INFRARED, VISIBLE OR ULTRAVIOLET LIGHT; COLORIMETRY; RADIATION PYROMETRY
- G01J3/00—Spectrometry; Spectrophotometry; Monochromators; Measuring colours
- G01J3/28—Investigating the spectrum
-
- G—PHYSICS
- G01—MEASURING; TESTING
- G01N—INVESTIGATING OR ANALYSING MATERIALS BY DETERMINING THEIR CHEMICAL OR PHYSICAL PROPERTIES
- G01N21/00—Investigating or analysing materials by the use of optical means, i.e. using sub-millimetre waves, infrared, visible or ultraviolet light
- G01N21/17—Systems in which incident light is modified in accordance with the properties of the material investigated
- G01N21/25—Colour; Spectral properties, i.e. comparison of effect of material on the light at two or more different wavelengths or wavelength bands
- G01N21/27—Colour; Spectral properties, i.e. comparison of effect of material on the light at two or more different wavelengths or wavelength bands using photo-electric detection ; circuits for computing concentration
- G01N21/274—Calibration, base line adjustment, drift correction
-
- G—PHYSICS
- G01—MEASURING; TESTING
- G01N—INVESTIGATING OR ANALYSING MATERIALS BY DETERMINING THEIR CHEMICAL OR PHYSICAL PROPERTIES
- G01N30/00—Investigating or analysing materials by separation into components using adsorption, absorption or similar phenomena or using ion-exchange, e.g. chromatography or field flow fractionation
- G01N30/02—Column chromatography
- G01N30/62—Detectors specially adapted therefor
- G01N2030/626—Detectors specially adapted therefor calibration, baseline
-
- G—PHYSICS
- G01—MEASURING; TESTING
- G01N—INVESTIGATING OR ANALYSING MATERIALS BY DETERMINING THEIR CHEMICAL OR PHYSICAL PROPERTIES
- G01N30/00—Investigating or analysing materials by separation into components using adsorption, absorption or similar phenomena or using ion-exchange, e.g. chromatography or field flow fractionation
- G01N30/02—Column chromatography
- G01N30/62—Detectors specially adapted therefor
- G01N30/74—Optical detectors
- G01N2030/743—FTIR
Description
【0001】
本発明は、分光測定装置のような分析装置および分析情報を変換するための方法および装置ならびにそのような分光測定装置間でのスペクトル情報の変換において利用するためのコンピュータ読み取り可能な記憶媒体に関する。
【0002】
【従来の技術】
分析装置は、材料の分析に一般的に関連する種々の用途に使用される。1つのクラスのこのような装置は分光測定装置から成り、分光測定装置においてスペクトルが、試料に特徴的であり光検出器に入射するスペクトルビームを生成するために、試料材料との相互作用において生成される。最近の装置は、材料に相応するスペクトル情報を生成及び比較するために検出器からのスペクトルデータを受取るコンピュータを含む。1つのタイプの分光測定装置においてはスペクトルはプリズム又はホログラフィ格子等の分散素子により生成され、分散素子は、試料を通過したか又は放射された光、又は試料材料を含むプラズマ又はその他の励起源から受光した光をスペクトル分散する。別のタイプは、時間変化する光学干渉システムを内蔵し、このシステムにおいて光の干渉パターンが生成され、光はパターンを変形する試料材料を通過する。フーリエ変換コンピュータ計算が、変形された光パターンをスペクトルデータに変換するために検出器信号に適用される。フーリエ変換装置は、赤外線領域内で一般的に操作され、”FTIR”装置として知られている。
【0003】
光学装置、検出器及びコンピュータ化における改善と共に、非常に正確な測定を行うための能力が発展した。例は、吸収スペクトロメータ、ポリクロメータ又はガソリンにおけるオクタン価を測定するために化学測定材料分析を使用するFTIR装置である。オクタン価における差は、近赤外線(IR)吸収スペクトルにおける微妙な差に対応する。スペクトル特性における非常に小さい変化を、実際の上で人員により直接的に検出することは不可能であり、コンピュータ化された自動化が必要である。このようなスペクトル測定が、通常は吸収分光光度計により連続的にオンラインで実現されることが望ましく、これに対してFTIR装置はしばしば実験室装置と見なされる。このようにして、分析化学のためと、より特定的には1つのタイプの装置からの情報と別のタイプの装置からの情報との正確な比較のためとに進歩した分光測定法を利用することに対する関心が存在する。
【0004】
比較の1つの態様は、装置が、スペクトルプロフィルに関連する固有特性を有することにある。このような特性はそれぞれの装置に固有であり、時間と共に変換することもある。装置の固有特性はデータを歪ませ、比較を不正確にする。分散格子を有するポリクロメータのような装置において固有特性は、非常に狭幅であり鮮鋭なスペクトル線を表すスペクトルデータのプロフィルを典型的に有する。このようなプロフィルは、装置の中の光学装置及び(より低い程度で)電子装置における基本的光学デザイン及び回折効果及びその他の不完全性に起因して固有形状と、実際の線に比してより広い線幅とを有する。実際の固有プロフィルは対称ではないこともある。ポリクロメータ及び類似の装置において狭幅線源からの装置プロフィルはガウスプロフィルに類似である。FTIRのようなその他の装置において干渉計分解能のリミットにおける固有プロフィルはより矩形状である。
【0005】
本譲受人所有の米国特許第5303165号明細書(Ganz等)は、選択されたスペクトルレンジ内の仮定的に細いスペクトル線のためのスペクトル線形状の特徴的固有プロフィルを有する分光測定装置を標準化するための方法及び装置を開示している。標準化されたデータは、任意の類似の装置により同一の試料材料から得られたデータ及びある時間にわたり同一の装置により繰返し得られたデータと実質的に同一である。
【0006】
従来のFTIR装置はP.R.Griffiths及びJ.A.de Haseth著”フーリエ変換赤外線分光測定法”等の教科書に教示されている。これらの装置においては光の干渉パターンは、白色光を2つのビームに分割する部分リフレクタであるビームスプリッタを含むマイケルソン又は類似の干渉計により生成される。これらのビームは反射されて戻されてビームスプリッタで再結合される。ビームのうちの1つのビームの光路長は、時間変化される干渉パターンを生成するために時間と共に変化される。この光パターンは、パターンを変形する試料材料を通過してガイドされる。フーリエ変換コンピュータ計算は、変形されたパターンを、強度対波数を表すスペクトルデータに変換する。
【0007】
別のクラスの分析装置はクロマトグラフのためのものであり、クロマトグラフには2つの通常のクラスが存在する、すなわちガスクロマトグラフ(GC)と液体クロマトグラフ(LC)である。例えば米国特許第5545252号明細書及び米国仮特許出願第60/006017号明細書に説明されているようなガスクロマトグラフは本質的に分離の物理的方法であり、この場合、キャリアガスの中のテスト試料の成分がコラムの中の定常相材料により吸着及び脱着される。試料のパルスがキャリアガスの定常流の中に噴射される。コラムの端で個々の成分が時間により種々の程度で分離される。熱伝導性等のガス特性の検出は、時間スケール化されたパターンを提供し、このパターンは、校正及び既知の試料との比較によりテスト試料の成分を質的及び量的に示す。このようなシステムの主構成要素はコラム、試料をキャリアガスの中に導入するための混合室を有するインジェクタ、コラムの外側端部におけるガス特性検出器、ガス制御器、検出器の出力を処理及び表示するコンピュータである。異なるタイプのコラム又は異なるタイプの操作条件を有するGC装置の間の比較が重要である。
【0008】
液体クロマトグラフは例えば米国特許第4886356号明細書(Paradis)及び特許第5173742号明細書(Young)に説明されているものに類似である。試料のパルスは、キャリア液体の定常流の中に噴射され、キャリア液体はコラムを通過し、次いでウィンドウを有する1つのセル(又は2つのセル)を通過する。光ビームはそれぞれのセルを通過して光検出器に達し、光検出器は、コンピュータへ供給される出力信号を生成する。この信号は試料成分に従って時間と共に変化する。ガスクロマトグラフの場合のようにコンピュータ処理及び校正又は既知試料との比較によりテスト試料の成分を示すことが可能である。異なるタイプのコラム又は異なる操作条件を有するLC装置の間の比較が重要である。
【0009】
【発明の概要】
前述及びその他の目的は、第2の分光測定装置のスペクトル情報との比較のために第1の分光測定装置のスペクトル情報を変換する方法及び代替的に装置により少なくとも部分的に達成される。いずれの場合にも第1の標準関数が、第1の分光測定装置のためのスペクトル線形状のために選択され、スペクトル線形状のための第2の標準関数が第2の分光測定装置のために選択される。有利にはそれぞれの標準関数は、仮定的に細いスペクトル線源のための相応する固有の装置プロフィルを一般的に表すものとして選択される。変換係数は、第1の標準関数を第2の標準関数に変換するためにコンピュータ計算される。
【0010】
通常の操作において第1のスペクトル情報は、第1の試料のための第1の分光測定装置により得られ、第2のスペクトル情報は、(第1の試料と同一であるか又は類似であることもある)第2の試料のための第2の分光測定装置により得られる。変換係数が、変換された情報を生成するために第1のスペクトル情報に適用され、変換された情報が第2のスペクトル情報と比較される。
【0011】
1つの有利な態様では第1の分光測定装置は干渉FTIR装置から成り、第2の分光測定装置は分散形分光測定装置から成る。このような状態では第1の標準関数は、変形された矩形関数でなければならず、第2の標準関数はガウス関数でなければならず、それぞれのこのような関数は、仮定的に細いスペクトル線源のための相応する固有の装置プロフィルを一般的に表す。FTIRのような装置において第1の標準関数は波数に依存することもあり、この場合、変換係数は、スペクトルレンジにわたり選択された増分における一連のサブ係数から成るべきであり、サブ係数は波数に依存している。
【0012】
目的はより広くは、第2の分析装置の分析情報との比較のために第1の分析装置の分析情報を変換する方法又は装置により達成される。このような装置は(前述のように)分光測定装置、(ガス又は液体)クロマトグラフ装置、又は分析プロフィルを生成するその他のこのような装置であることもある。分析プロフィルの第1の標準関数が第1の装置のために選択され、分析プロフィルの第2の標準関数が第2の装置のために選択され、変換係数が、第1の標準関数を第2の標準関数に変換するためにコンピュータ計算される。第1の分析情報は第1の試料のための第1の分光測定装置により得られ、第2の分析情報は第2の試料のための第2の分光測定装置により得られる。変換係数が、変換された情報を生成するために第1の分析情報に適用され、変換された情報は第2の分析情報と比較される。
【0013】
目的は、本明細書に説明されている変換を実現するために既存装置のコンピュータにおいての使用のための適切なデータコード及びプログラムコードを有する(例えばディスク等の)コンピュータ読取り可能な記憶媒体によっても達成される。
【0014】
【実施の形態】
1つの実施の形態では本発明は、同一の選択されたスペクトルレンジ内で操作される2つの分光測定装置のスペクトル出力情報の比較に関する。1つのこのような分光測定装置(図1)は例えば、引用により本明細書に参照されている米国特許第5303165号明細書の中に開示されているタイプの分散形分光測定装置である。このような分光測定装置10は光検出器11を有し、光検出器11のために標準化及び波長校正が行われる。このような分光測定装置は例えば、ガソリンのオクタン価を測定するために近赤外線における高い感度及び安定性を必要とするオンラインケモメトリックスペクトログラフィックポリクロメータであることもある。安定しているがその他の点では通常の白熱光源12は光13を放射し、光13はリレーレンズ14を通過する。リレーレンズ14は、光ファイバー16の入力端にフォーカシングされている。ファイバーは光をプローブアセンブリ18へガイドし、プローブアセンブリ18は、テストされるガソリン等の液体の中に浸漬されている。ストレートスループローブとして示されているけれども、このプローブの代りに、光を戻りファイバーに戻すために反射素子を有する折返し光学装置を用いることも可能である。
【0015】
プローブの中に液体のための試料空間20が設けられ、これにより光22は液体を通過し、この個所で光の一部は選択的にフィルタリングされる。フィルタリングされた光は第2の光ファイバー24に入射される。オプチカルスイッチ28を有するバイパスファイバー26が設けられ、バイパスファイバー26は、ファイバーを通過する光に液体をバイパスさせ、これによりフィルタリングされた光を比較する標準が形成される。第2のファイバー24は、凹ホログラフィ格子33を利用してスペクトロメータ32に光をガイドし、凹ホログラフィ格子33は光35を検出器11に分散する。スペクトルを表す検出器からの信号はコンピュータ37に供給されて、ディスク又はその他のメモリに記憶され、処理される。
【0016】
コリメーションゾーン44が、いくつかの開口を有するディスク43を挿入するために複数のファイバーのうちの1つのファイバーの中に設けられている。対応する対のレンズ45(1つが図示)は、コリメートされた光を、ファイバー端部とファイバー端部との間の選択された開口を通過させる。1つの開口47は、試料又はバックグラウンドを測定するために分光測定装置の通常の操作のためにフィルタリングされない光を通過させるために空のままにされている。その他の開口は、校正及び標準化に使用される光学フィルタ素子46,48,50を収容する。ディスクは、選択された開口又はフィルタに対して線53を介して(例えば再校正のための選択されたインターバルで)手動で又はコンピュータ34により自動的にモータ52により位置決め可能である。
【0017】
本発明で利用される他方の分光測定装置は通常は第1の分光測定装置とは異なるタイプである。1つの有利な実施の形態(図2)では第2の分光測定装置は従来の干渉FTIRである。この分光測定装置110においてオプチカルトレーン112により干渉縞パターンが従来のマイケルソン干渉計114により生成される。マイケルソン干渉計114は、干渉ビームと干渉ビームとの間の光路差を振動することにより時間と共に縞パターンを変化する。縞パターンビーム116はレンズ及びアパーチュア122を通過し、次いで、試料118を通過することによりビーム120に変形されて検出器に到達し、検出器は、対応するスペクトルデータを生成する。フーリエ変換コンピュータ計算がコンピュータ128によりデータに適用され、これにより、強度対波数を表すスペクトル情報が生成され、スペクトル情報は試料を表す。(FTIRにおいて通常使用される波数は波長の逆数であり周波数に比例する。)
前述の分光測定装置のそれぞれにおいて使用されるコンピュータは例えばDigital model DEC PC 590等の従来のコンピュータでよく、通常はそのメーカにより分光測定装置の中に組込まれる。例えばFTIRのコンピュータ128等のコンピュータは通常は、線126で検出器124から信号を受取るA/D変換器132を有する中央演算装置(CPU)130を含む。コンピュータメモリ134のセクションは通常は内部ハードディスクと、例えばフロッピーディスク、CD−ROM、及び/又は適切なコードが埋込まれているテープとを含む。キーボード136が通常はオペレータ入力のために設けられている。スペクトル情報は、モニター133に表示される及び/又はプリントされる。コンピュータは、干渉計114を制御するためにD/A変換器138を介して信号を供給することもある。1つ以上の付加的な専用チップ処理ユニットがある特定のステップのために利用されることもある。例えばFTIRにおいて1つの別個のチップがフーリエ変換コンピュータ計算のために使用され、別の1つのチップはアライメント等の制御のために使用される。本発明は有利には、本発明を実施するためのステップ及び手段を表すデータ及びプログラムコードを利用して、少なくとも第1の分光測定装置に対応する1つのコンピュータ又は双方の分光測定装置と共働するコンピュータの主CPUにより実施される。このようなコードは有利には、例えばコンピュータのハードディスク又はその他の点では従来の分光測定装置のコンピュータにおいて利用することが可能であるフロッピーディスク等のコンピュータ読取り可能な記憶媒体の中に格納されている。
【0018】
プログラミングは、通常は従来の操作のためにコンピュータ又は分光測定装置のメーカによりコンピュータの中に組込まれれている”C++”等の従来のものである。本明細書のフローチャートからのプログラミング及び記述は従来のものであり、当業者により容易に実行できる。このようなプログラミングの詳細は本発明に重要でない。コンピュータ計算は大量のデータを処理し、従って長時間かかるので、少なくとも100MHzのIntel PentiumTM等の高性能プロセスが推奨されるが、しかし486プロセッサで充分である。
【0019】
前述の分光測定装置のそれぞれは、不完全であるスペクトル情報を生成する。非常に狭幅の線を生成するスペクトル源においてスペクトル情報は、有限幅を有するプロフィルに広げられた線である。分散素子の場合にはプロフィルは、分光測定装置分解能を表す半値全幅(FWHM:full width at half the maximum peak height)を有するガウス関数に近似できる。
【0020】
FTIR分光測定装置の場合には狭幅線源からのスペクトル情報を、分解能を表す幅δσを有する変形された矩形に近似させることが可能である。矩形幅を例えば次式1により理論的に(従来のように)近似させることにより求められる。
【0021】
δσ=β2σ/8 式1
ただしβ=sin-1(d/f)であり、dは干渉計と試料との間にあるアパーチュアの直径であり、fは、アパーチュア122を試料に結像するレンズ123の焦点距離である(例えばd=4.2mm及びf=120mm)。
【0022】
矩形の変形は、アポダイゼーション係数のフーリエ変換に関連する。干渉計からの干渉ビームにおける任意の1つの波長に対応する強度は、変化する光路長を表す時間に依存する正弦波の形を有する。正弦波の端部は、干渉計の中の光路変化のリミットすなわちリフレクタ回転によりカットされる。コンピュータ処理は波形を無限長として扱うので歪が端部カットにより導入される。良好に解釈できるようにするために、現在のFTIR分光測定装置におけるデータは、データベクトルに、”アポダイゼーション”係数Aとして知られるマトリクス補正係数を乗算している。この係数は、数学的関数として理論的考慮により予選択され、干渉計鏡のサイクルリミットから既知である、正弦波の端部のカットオフに対応する計算された幅を有する。波数空間において、変形され矩形関数Tは次式により表される。
【0023】
T=R*A 式2
ただしRは、幅δσ(式2)を有する矩形関数であり、矩形関数は例えばsinc関数A=sin(2πσLm)/(2πσLm)等のアポダイゼーション係数と乗算され、ただしLmは干渉計における分割された干渉ビームの光路長における最大差である。この変形された関数は、消失した正弦状尾部を有する中央ピークの形を有する。
【0024】
(本明細書及び請求の範囲の中で使用されるようにマトリクス演算における”乗算”の表現及びそれに対応する記号”*”は、直接的な乗算を意味するか、又は畳込み等の関連するプロシージャを意味する。同様にマトリクス演算における”除算”、”比”との表現及びそれらの対応する記号”/”は、直接的な除算を意味するか、又は例えば逆畳込み等の関連するプロシージャを意味する。)
狭幅線源の有限幅に加えて、それぞれの分光測定装置のためのスペクトル情報において固有の歪が存在する。歪は、仮定的に細いスペクトル線源のためのスペクトル線形状の特徴的な固有プロフィルの中に表されている。前述の米国特許第5303165号明細書に開示されているように分光測定装置又はそのデータを、仮定的に鮮鋭なスペクトル線のために選択されたターゲットプロフィルの選択によりこの歪から標準化することが可能である。分光測定装置は、固有歪を表すプロフィルデータを生成するために狭幅線源で操作される。変換フィルタが、プロフィルデータをターゲットプロフィルに変換するためにコンピュータ計算される。次いで分光測定装置は、試料スペクトルを表す試料データを生成するために試料源で通常に操作され、変換フィルタは、スペクトル情報を生成するために試料データに適用され、スペクトル情報はこれにより、同一のタイプの任意の分光測定装置からの類似の標準化された情報との比較のために標準化される。
【0025】
FTIRにおいても固有歪が存在する。そのスペクトル情報は、例えば本譲受人所有の(弁理士事件整理番号ID−4440)同時係属米国特許出願明細書に開示されているような標準化により変形することが可能である。しかしこのスペクトル情報のこのような標準化は、本発明に鑑みて不要であり、情報をフーリエ変換から直接的に利用することが可能である。
【0026】
図3は、前述の分光測定装置において本発明を適用するための方法及び手段を示す。テスト試料204での第1の分光測定装置の通常の操作202(例えばFTIR)は、測定されたスペクトルデータDm1の集合206を生成する。同様に、同一の又は別の(通常は類似の)テスト試料210での第2の分光測定装置の通常の操作(例えば分散)は、スペクトルデータDm2の別の集合211を生成する。有利には第2の分光測定装置のデータDm2は、要約して前述したように前述の米国特許第5303165号明細書に記載のように、スペクトル情報Pmの集合212に標準化される214。第1の分光測定装置のための対応するデータ206を標準化することが可能であるが、しかし(図示のように)必要不可欠ではない。
【0027】
通常は分光測定装置のこれらの操作の前に第1の標準関数Tが、第1の分光測定装置のためのスペクトル線形状のために選択される216。これは例えばFTIRのための前述の変形された矩形関数等の理想化されたプロフィルでなければならない。プロフィルは、一般的に、仮定的に細いスペクトル線源のための相応する固有プロフィルを表す。(本明細書の中での”一般的に表す”との表現は、関数は有利には数学的に適切な関数を使用して固有のプロフィルに近似するだけでよいことを意味する。)第1の分光測定装置のデータが標準化されている場合には標準化の理想関数又はターゲットプロフィルが有利には選択される。データが標準化されていない場合には式2の関数が、FTIRが第1の分光測定装置である本ケースの場合には適切である。
【0028】
第2の標準関数Gも、第2の分光測定装置のためのスペクトル線形状のために選択される218。これも、例えば分散形分光測定装置のためのガウス関数等の理想化されたプロフィルでなければならない。これも有利には、一般的に、仮定的に細いスペクトル線源のための相応する固有歪プロフィルを表す。有利には標準関数Gは、第2の分光測定スペクトル情報Pmの標準化214において利用されるターゲットプロフィルのために選択される標準関数と同一である。
【0029】
変換係数Fが、次式3を使用して第1の標準関数を第2の標準関数に変換するためにコンピュータ計算される220。
【0030】
G=T*F 式3
ただしFは、コンピュータ計算された変換係数であり、Tは第1の標準関数(例えば変形された矩形)であり、Gは第2の標準関数(例えばガウス関数)である。コンピュータ演算のために標準関数及びスペクトル情報は、選択されたスペクトルレンジにわたり選択されたインターバルに対して記憶されたデータにより定まるベクトルとして表される。このようにして変換係数Fは1つのマトリクス(又は以下に説明されるように一連のマトリクス)の形を有し、マトリクスのデータは、スペクトル情報での常套的使用のためにディスクに恒久的に記憶される222。
【0031】
単位の変換が、変換Fを定められる式において必要であるので含まれなければならない。このようにして係数Fは有利には、第2の分光測定装置の単位への変換を含む。例えば、FTIRデータは通常は波数(cm-1)であり、分散形分光測定装置データは波長である場合には波数は波長に変換されなければならない。標準関数もそれぞれ、単位領域に対して正規化されなければならない。本明細書及び請求の範囲に記載のように、式3により表される式はこのような変形を単位変換及び正規化として含む。
【0032】
測定されたスペクトル情報Dm1が第1の分光測定装置(例えばFTIR)のために得られ、測定され標準化された第2のスペクトル情報Pmが第2の分光測定装置(例えば分散形分光測定装置)のために得られる。次式4から変換された情報Pcをコンピュータ計算するために、変換係数Fが第1のスペクトル情報Dm1に乗算される224。
【0033】
Pc=Dm1*F 式4
変換された情報Pcは格納され226、測定されたスペクトル情報Pmと比較される228。このような比較は、可視的に又は例えばそれぞれの波長増分に対して差Pm−Pcを計算し表示する230コンピュータにより行うことが可能である。
【0034】
式1に示されているようにFTIRの特徴は、アパーチュアに帰することが可能である分解能δσのリミット(最小線幅)がスペクトル波数の関数であり、特に、より大きい波数においてより広い線幅を有する波数に比例する。これにより第1の標準関数Fは波数に依存する。(第2の標準関数、すなわちガウス関数は波数に依存することもあるが、しかし必要不可欠ではない。)このような依存性は、スペクトルレンジにわたりそれぞれの選択された波数増分iにおいて標準サブ関数Tiを選択することにより扱われる。増分は、第2の分光測定装置のために使用される増分に相応するように選択される。例えば800〜1100nmの波長レンジ内では0.5nmインターバルで601ポイントが存在する。関数レンジは、実際のレンジに対するコンピュータ計算を取扱うために例えばそれぞれの端部において5nmだけ延長されなければならない。図4は一連のサブ関数Tiを示し、それぞれのサブ関数Tiは波長増分に対する波数の関数である。このようにして第1の標準関数Tの選択は、一連のサブ関数Tiの選択を含む。
【0035】
係数Fのコンピュータ計算を実現するためにサブ係数Fiが、(この実施の形態では波長と無関係である)第2の関数Gを使用して式3からのG=Ti*Fiによりそれぞれのサブ関数Tiに対して計算され、これにより、変換係数を定める一連のサブ係数Fiが得られる。サブ係数の集合が図5に示されている。(順次の波長のための波数軸線は、グラフの中のサブ係数をより明瞭に示すためにシフトされている。実際には、順次のサブ係数は図4のサブ関数に比してより大きくオフセットされている。)この一連のコンピュータ計算は長時間かかり、例えばGatewayTM486−50コンピュータで2.5時間かかる。しかしこれはただ一度行うだけでよく、それぞれの対の分光測定装置タイプに対して記憶される。この記憶されたデータは個々の分光測定装置にセンシティブでなく、従って汎用的に利用できる。波数増分は、例えば望ましくは1つの分解能あたり2つのポイント、例えば1.0cm-1の分解能に対して0.5cm-1である分散形分光測定装置のための選択された増分に対応しなければならない。
【0036】
サブ係数マトリクスFiが、変換されたスペクトル情報を生成するために第1の(FTIR)分光測定装置の通常の操作から得られる通常のスペクトル情報に適用される。これを行うためにそれぞれのマトリクスFiが、相応する波数iの回りのスペクトルデータと乗算される。サブ係数はそれぞれの波数増分の回りのいくつかのポイント、例えばそれぞれの波数増分の回りの+/−5ポイント(全部で11ポイント)に適用されなければならない。サブ係数は比較的簡単であり、変換畳込みコンピュータ計算は迅速に例えば1〜2秒で通常の疎行列法によりGatewayTM486−50を使用して行うことが可能である。
【0037】
第1の(FTIR)分光測定装置の正確な波数校正が、第2の分光測定装置の標準化されたスペクトル情報との精度比較のために実現されなければならない。これは通常は標準試料により行われ、使用中の分光測定装置において定期的に(例えば毎週又は毎月)行われなければならない。
【0038】
前述の説明は特に、分散形スペクトロメータの標準化されたスペクトル情報との比較のための干渉FTIR形スペクトロメータの変換する未標準化スペクトル情報に関して行われた。一般的にこれらの分光測定装置の使用は、低い分解能データとの比較のための高い分解能データの変換を行うことであり、標準化されていない分光測定装置から標準化された分光測定装置への変換を行うことである。これらのタイプの変換は双方共に有利である。
【0039】
FTIRは、生産において使用されるオンライン分散形スペクトロメータと比較される実験室装置として使用可能である。この対の分光測定装置の選択は特に、本発明の適用に有利である。しかし本発明の適用においてこのような制限は存在しない。例えば前述のようにFTIRスペクトル情報は標準化可能であるか、又はいずれの分光測定装置も標準化を有しないものでもよい。本例のスペクトロメータは赤外線領域内で動作するが、しかし可視光線及び紫外線のその他のスペクトルレンジも適用可能である。本発明を利用することが可能であるその他のスペクトロメータは、例えば誘導プラズマタイプ等の原子放射分光光度計、原子吸光スペクトロメータ、蛍光装置、ラーマン装置及び光学フィルタ装置を含む。これらのうちの任意の装置又はその他の所望の分光測定装置が本発明により使用され、対として用いることが可能である。本例ではFTIR分光測定装置のための分解能及び変換は波数に依存する。しかしより一般的に分光測定装置のうちの一方又は双方が波数に依存することも、双方共に依存しないこともある。
【0040】
本発明は、第1のタイプ及び第2のタイプの分光測定装置が実質的に同一である、例えば双方共にFTIRであるか双方共に格子タイプである環境の中で変換するために利用されることもある。これの1つの利点は、第1の分光測定装置が実際にはそれぞれ異なる装置であり、従って選択された関数がその都度異なる場合に第2の分光測定装置を標準として選択することにある。別の利点は、FTIR(又はその他の)分光測定装置に固有であり、すなわち、分解能が波長と共に変化し(例えば波長に比例し)、従って変換されたデータが、波長に依存する分解能を有することが可能であることにある。別の1つの態様では第2の分光測定装置は仮定的であり、いかなる特定の分光測定装置にも特に関連しないか、又はいずれの任意のタイプの分光測定装置にさえも関連しない。この場合には1つ以上のタイプの第1の分光測定装置が、一般的比較のための共通のデータタイプに変換される。
【0041】
別の1つの実施の形態では、例えばフロッピーディスク、CD−ROM又はテープ等のコンピュータ読取り可能記憶媒体により図3に示されているように前述の変換を実現するために分光測定装置ユーザのための手段を提供するために有益である。記憶媒体はデータコード及びプログラムコードを格納し、従ってコンピュータ計算手段により読取り可能である。データコードは、予選択されたタイプの分光測定装置の第1の標準関数216及び第2の標準関数218から予コンピュータ計算された変換係数222を含む。プログラムコードは、比較のための変換された情報226を生成するために変換係数を第1のスペクトル情報206に適用する224手段を含む。プログラムコードにより単に、比較のための変換された情報が表示されることもあり、又はプログラムコードは更に、変換された情報226を第2のスペクトル情報212と比較する218手段を含むこともある。この実施の形態のより詳細な態様は前述の通りである。
【0042】
異なるタイプの分光測定装置のスペクトルデータの比較のために以上説明したにもかかわらず本発明は、例えば分散形タイプか又はFTIR形タイプ等の同一のタイプの分光測定装置のスペクトルデータを比較するために適用可能であり、この場合、分光測定装置は、操作条件において異なるか又は異なるモデルにより異なる。例えばFTIRでは1つの分光測定装置は4つの波数分解能又は8つの波数分解能を有することもある。
【0043】
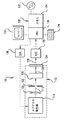
本発明は例えばガスクロマトグラフ(GC)等のその他のクラスの分析装置にも適用可能であり、この場合、これらの装置はスタイル、コラム特性及び/又は操作条件において異なる。異なるスタイルの装置の例は前述の米国特許第5545252号明細書及び仮特許出願第60/006017号明細書(Hinshaw)に開示され、これらの装置はキャリアガス流制御及び試料トランスファ方法において異なり、このような装置及びそれらの操作の説明は引用文献を参照することとし、本明細書での詳細な説明は省略する。”ジェネリック”GCが図6に概略的に示されている。キャリアガスはその源302からインジェクタ304に供給され、このガスの一部及び大部分は(図示されていない選択された背圧により)インジェクタのポート306から排出される。試料308は瞬時にインジェクタの中に導入され、そこで試料308はキャリアガスの中に混入される。結果の混合ガスの少なくとも一部はインジェクタから流出してコラム310を貫流し、コラム310は異なるレートで試料の成分を吸着及び溶離する。コラムから流出するキャリアガス混合気は検出器312を通過する。検出器312は例えば熱伝導率等のガスの物理特性における時間変化を測定する。検出器信号は分析情報の出力パターンの解析のために線314を介してCPU318及びプログラム320並びにメモリ322を有するコンピュータ316に供給される。分析情報の出力パターンをモニター324に表示することも可能である。
【0044】
(2つのHinshaw特許に開示されているような又は異なるコラム又は操作条件を有する)2つの異なるGC装置からの分析情報が、図3に関連して説明したように比較される。GCの場合には、標準関数T及びGへ導く線形状又はプロフィルが溶離プロフィルである。有利にはこれらの関数のそれぞれが通常は、(スペクトロメータのための仮定的に細いスペクトル線に類似に)試料の仮定的な瞬時の簡潔な導入のための相応する固有の装置溶離プロフィルを表す。このようなプロフィルは、D.H.Burns,J.B.Callis及びG.D.Christian著の論文”2次元(クロマトグラフィック/スペクトル)データ集合の定性分析のためのロバストな方法”(Anal.Chem.誌58,1475−1420(1986))に開示されているような指数関数的に変形されたガウス関数により定められる。スペクトロメータに関しては、適切なデータ及びプログラムコードを、存在するクロマトグラフ装置のコンピュータにおいての使用のためのディスク又はその他のコンピュータ読取り可能な媒体に記憶することが可能である。
【0045】
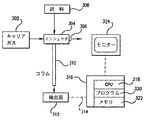
本発明は同様に、異なる液体クロマトグラフ装置の間の比較のために適用され、これらの装置は、異なるコラム又は操作条件を有する同一の装置であり、このような装置は例えば、前述の米国特許第4886356号明細書(Paradis)及び特許第5173742号明細書(Young)に開示され、これらの明細書は本明細書に引用により取込まれている。コラム特性はこの場合にも、次元及び吸着剤を含み、操作条件はキャリアガスのタイプ及び流速、及び入口圧力及び出口圧力を含む。”ジェネリック”LCが図7に概略的に示されている。液体キャリアがポンプ326からコラム328へ供給される。試料はインジェクタ330から、ポンプとコラムとの間のパイプの中に瞬時に導入され、この個所で試料は液体キャリアの中に混入される。結果の混合液はコラムを通過し、コラムは、異なるレートで試料の成分を吸着及び溶離する。コラムから流出する混合液は、ウィンドウ334を有するセル332を通過する。光源338からの光ビーム336はレンズ340又はその他の適切な光学装置によりコリメートされ、セルの中の液体341を通過して検出器340に達する。検出器340は、光吸収において現れる時間変化を測定する。検出器信号は線342を介して、CPU346及び記憶されているプログラム348及びメモリ350を有するコンピュータ344に出力パターンへの解析のため供給される。出力パターンは、モニター352に表示可能である。GCの場合と同様に比較は、標準関数に対して指数関数的に変形されたガウス関数を使用して図3に関連して説明されたように行うことも可能である。
【0046】
本発明に適切なその他のクラスの装置は質量スペクトロメータ、X線分析装置、及び物質の分析において分析的プロフィルを生成するその他の分析装置である。
【0047】
本明細書及び請求の範囲において使用されるように”分析プロフィル”との用語は、スペクトル線形状と、クロマトグラフ又は、波長及び時間等の関数のようなプロフィルを生成するその他の分析装置により生ずるプロフィルを含む。同様に”分析情報”はスペクトル情報と、クロマトグラフ及びこのようなその他の分析装置に関連する類似の情報とを含む。
【0048】
本発明を特定の実施の形態を参照して詳細に説明したが、本発明の精神及び添付の請求の範囲を逸脱することなく種々の変化及び変更は当業者には自明である。従って本発明は添付請求の範囲及びそれらの等価のみにより制限される。
【図面の簡単な説明】
【図1】本発明において利用される1つのタイプの分光測定装置の1つの例としての分散形スペクトロメータの概略図である。
【図2】本発明において利用される別の1つのタイプの分光測定装置の1つの例としてのFTIR形スペクトロメータの概略図である。
【図3】図1及び2の装置のような2つの装置に関連して本発明の適用を示すフローチャートである。
【図4】図3のフローチャートを参照してコンピュータ計算された一連のサブ関数を示す略線図である。
【図5】図4のサブ関数からコンピュータ計算された一連のサブ係数を示す略線図である。
【図6】本発明において利用される1つのタイプの分析装置の1つの例としてのガスクロマトグラフの概略図である。
【図7】本発明において利用される別の1つのタイプの分析装置の1つの例としての液体クロマトグラフの概略図である。[0001]
The present invention relates to an analytical device, such as a spectrometer, a method and apparatus for converting analytical information, and a computer readable storage medium for use in converting spectral information between such spectrometers.
[0002]
[Prior art]
Analytical devices are used in a variety of applications that are commonly associated with the analysis of materials. One class of such devices consists of spectroscopic instruments, in which the spectrum is generated in interaction with the sample material to produce a spectral beam characteristic of the sample and incident on the photodetector. Is done. Modern devices include a computer that receives spectral data from a detector to generate and compare spectral information corresponding to the material. In one type of spectroscopic device, the spectrum is generated by a dispersive element such as a prism or holographic grating, which disperses light from the sample that is passed or emitted, or from a plasma or other excitation source that contains the sample material The received light is spectrally dispersed. Another type incorporates a time-varying optical interference system in which a light interference pattern is generated, and light passes through a sample material that deforms the pattern. A Fourier transform computer calculation is applied to the detector signal to convert the deformed light pattern into spectral data. Fourier transform devices are commonly operated in the infrared region and are known as "FTIR" devices.
[0003]
With improvements in optics, detectors and computerization, the ability to make very accurate measurements has developed. Examples are FTIR instruments that use chemical measurement material analysis to measure the octane number in an absorption spectrometer, polychromator or gasoline. The difference in octane number corresponds to a subtle difference in the near infrared (IR) absorption spectrum. Very small changes in spectral characteristics cannot be detected directly by humans in practice, and computerized automation is required. It is desirable for such spectral measurements to be realized continuously on-line, usually with an absorption spectrophotometer, whereas FTIR instruments are often considered laboratory instruments. In this way, advanced spectroscopic methods are utilized for analytical chemistry, and more particularly for accurate comparison of information from one type of device with information from another type of device. There is an interest in that.
[0004]
One aspect of the comparison is that the device has inherent properties associated with the spectral profile. Such characteristics are unique to each device and may change over time. The inherent characteristics of the device distort the data and make the comparison inaccurate. In devices such as polychromators having a dispersive grating, the intrinsic properties typically have a profile of spectral data representing very narrow and sharp spectral lines. Such a profile is due to the basic optical design and diffraction effects and other imperfections in the optical and electronic devices in the device (to a lesser extent) compared to the actual shape and the actual line. With a wider line width. The actual intrinsic profile may not be symmetric. In polychromators and similar devices, the device profile from a narrow line source is similar to a Gaussian profile. In other devices such as FTIR, the intrinsic profile at the limit of interferometer resolution is more rectangular.
[0005]
U.S. Pat. No. 5,303,165 (Ganz et al.) Owned by the assignee standardizes a spectroscopic instrument having a characteristic intrinsic profile of spectral line shapes for hypothetically narrow spectral lines within a selected spectral range. A method and apparatus are disclosed. Normalized data is substantially identical to data obtained from the same sample material by any similar device and repeated by the same device over time.
[0006]
The conventional FTIR apparatus is P.I. R. Griffiths and J.A. A. It is taught in textbooks such as “Fourier transform infrared spectroscopy” by de Haseth. In these devices, the light interference pattern is generated by a Michelson or similar interferometer that includes a beam splitter that is a partial reflector that splits white light into two beams. These beams are reflected back and recombined with a beam splitter. The optical path length of one of the beams is changed over time to produce a time-varying interference pattern. This light pattern is guided through the sample material that deforms the pattern. The Fourier transform computer calculation converts the deformed pattern into spectral data representing intensity versus wave number.
[0007]
Another class of analyzers is for chromatographs, and there are two common classes of chromatographs: gas chromatographs (GC) and liquid chromatographs (LC). For example, gas chromatographs as described in US Pat. No. 5,545,252 and US Provisional Patent Application No. 60/006017 are essentially physical methods of separation, in which case the test in a carrier gas Sample components are adsorbed and desorbed by the stationary phase material in the column. A pulse of sample is injected into a steady flow of carrier gas. At the end of the column, the individual components are separated to varying degrees by time. Detection of gas properties such as thermal conductivity provides a time-scaled pattern that qualitatively and quantitatively indicates the components of the test sample by calibration and comparison with known samples. The main components of such a system are the column, the injector with the mixing chamber for introducing the sample into the carrier gas, the gas characteristic detector at the outer end of the column, the gas controller, the output of the detector and The computer to display. Comparison between GC devices with different types of columns or different types of operating conditions is important.
[0008]
Liquid chromatographs are similar to those described, for example, in US Pat. No. 4,886,356 (Paradis) and US Pat. No. 5,173,742 (Young). The sample pulse is injected into a steady stream of carrier liquid, which passes through the column and then through one cell (or two cells) with a window. The light beam passes through each cell to the photodetector, which generates an output signal that is supplied to the computer. This signal varies with time according to the sample components. As in the case of gas chromatographs, the components of the test sample can be shown by computer processing and calibration or comparison with known samples. A comparison between different types of columns or LC devices with different operating conditions is important.
[0009]
SUMMARY OF THE INVENTION
The foregoing and other objects are achieved at least in part by a method and, alternatively, an apparatus for converting spectral information of a first spectrometer for comparison with spectral information of a second spectrometer. In either case, a first standard function is selected for the spectral line shape for the first spectrometer, and a second standard function for the spectral line shape is for the second spectrometer. Selected. Each standard function is preferably chosen as a general representation of the corresponding inherent device profile for a hypothetical thin spectral source. The conversion factor is calculated by a computer to convert the first standard function to the second standard function.
[0010]
In normal operation, the first spectral information is obtained by a first spectrometer for the first sample, and the second spectral information is the same as or similar to the first sample. There is also a second spectroscopic instrument for the second sample. A transform coefficient is applied to the first spectral information to generate transformed information, and the transformed information is compared with the second spectral information.
[0011]
In one advantageous embodiment, the first spectrometer comprises an interferometric FTIR device and the second spectrometer comprises a dispersive spectrometer. In such a state, the first standard function must be a modified rectangular function, the second standard function must be a Gaussian function, and each such function is assumed to have a narrow spectrum. The corresponding inherent device profile for the source is generally represented. In a device such as FTIR, the first standard function may depend on the wavenumber, in which case the transform coefficient should consist of a series of sub-coefficients in increments selected over the spectral range, where the sub-coefficient is It depends.
[0012]
The object is more broadly achieved by a method or device for converting the analysis information of the first analyzer for comparison with the analysis information of the second analyzer. Such a device may be a spectroscopic device (as described above), a (gas or liquid) chromatographic device, or any other such device that produces an analytical profile. A first standard function of the analysis profile is selected for the first device, a second standard function of the analysis profile is selected for the second device, and the conversion factor is the second of the first standard function. Computerized to convert to a standard function. The first analysis information is obtained by a first spectrometer for the first sample, and the second analysis information is obtained by a second spectrometer for the second sample. A transform coefficient is applied to the first analysis information to generate transformed information, and the transformed information is compared with the second analysis information.
[0013]
The object is also achieved by a computer readable storage medium (such as a disk) having suitable data codes and program codes for use in a computer of an existing device to implement the conversion described herein. Achieved.
[0014]
Embodiment
In one embodiment, the present invention relates to the comparison of spectral output information of two spectrometers operated within the same selected spectral range. One such spectrometer (FIG. 1) is, for example, a dispersive spectrometer of the type disclosed in US Pat. No. 5,303,165, which is hereby incorporated by reference. Such a
[0015]
A
[0016]
A
[0017]
The other spectrometer used in the present invention is usually of a different type from the first spectrometer. In one advantageous embodiment (FIG. 2), the second spectrometer is a conventional interference FTIR. In this
The computer used in each of the aforementioned spectrometers may be a conventional computer such as, for example, Digital model DEC PC 590, and is usually incorporated into the spectrometer by the manufacturer. A computer, such as the
[0018]
Programming is conventional, such as “C ++” that is usually incorporated into a computer by the manufacturer of the computer or spectrometer for conventional operation. Programming and description from the flowcharts herein is conventional and can be easily performed by those skilled in the art. Such programming details are not critical to the present invention. Computer computations process large amounts of data and therefore take a long time, so at least 100 MHz Intel Pentium TM High performance processes such as are recommended, but a 486 processor is sufficient.
[0019]
Each of the aforementioned spectrometers generates spectral information that is incomplete. In a spectral source that produces a very narrow line, the spectral information is a line spread into a profile having a finite width. In the case of a dispersive element, the profile can be approximated to a Gaussian function having a full width at half the maximum peak height (FWHM) representing the resolution of the spectrometer.
[0020]
In the case of an FTIR spectrometer, the spectral information from the narrow line source can be approximated to a modified rectangle having a width δσ representing the resolution. The rectangular width is obtained by, for example, approximating the width theoretically (conventional) by the
[0021]
δσ = β 2 σ / 8
However, β = sin -1 (D / f), d is the diameter of the aperture between the interferometer and the sample, and f is the focal length of the
[0022]
The rectangular deformation is related to the Fourier transform of the apodization coefficient. The intensity corresponding to any one wavelength in the interferometer beam from the interferometer has a time-dependent sinusoidal shape representing the changing optical path length. The end of the sine wave is cut by the limit of the optical path change in the interferometer, ie the reflector rotation. Since computer processing treats the waveform as infinite length, distortion is introduced by the end cut. In order to be able to interpret well, the data in current FTIR spectrometers is a data vector multiplied by a matrix correction factor known as the “apodization” factor A. This coefficient is preselected by theoretical consideration as a mathematical function and has a calculated width corresponding to the cutoff of the end of the sine wave, known from the cycle limit of the interferometer mirror. In the wave number space, the transformed rectangular function T is expressed by the following equation.
[0023]
T = R * A Formula 2
Here, R is a rectangular function having a width δσ (formula 2), and the rectangular function is, for example, a sinc function A = sin (2πσL m ) / (2πσL m ) And other apodization factors, where L m Is the maximum difference in the optical path length of the split interference beam in the interferometer. This modified function has the shape of a central peak with a missing sinusoidal tail.
[0024]
(As used in this specification and claims, the expression “multiplication” in matrix operations and the corresponding symbol “*” means direct multiplication or related such as convolution. Similarly, the expressions “division”, “ratio” and their corresponding symbols “/” in matrix operations mean direct division or related procedures such as deconvolution. Means.)
In addition to the finite width of the narrow line source, there is inherent distortion in the spectral information for each spectrometer. Distortion is represented in the characteristic intrinsic profile of the spectral line shape for a hypothetical thin spectral source. The spectroscopic instrument or its data can be standardized from this distortion by selecting a target profile selected for a hypothetical sharp spectral line as disclosed in the aforementioned US Pat. No. 5,303,165 It is. The spectrometer is operated with a narrow line source to generate profile data representing the inherent distortion. A conversion filter is computed to convert the profile data to the target profile. The spectroscopic instrument is then normally operated at the sample source to generate sample data representing the sample spectrum, and the transform filter is applied to the sample data to generate spectral information, whereby the spectral information is thereby identical. Standardized for comparison with similar standardized information from any spectroscopic instrument of type.
[0025]
Intrinsic distortion exists also in FTIR. The spectral information can be transformed by standardization as disclosed, for example, in the assignee's (patent attorney case number ID-4440) co-pending US patent application. However, such standardization of the spectral information is unnecessary in view of the present invention, and the information can be used directly from the Fourier transform.
[0026]
FIG. 3 shows a method and means for applying the present invention in the aforementioned spectrometer. Normal operation 202 (e.g., FTIR) of the first spectroscopic instrument with the
[0027]
Usually, prior to these operations of the spectrometer, a first standard function T is selected 216 for the spectral line shape for the first spectrometer. This must be an idealized profile, such as the modified rectangular function described above for FTIR. The profile generally represents a corresponding intrinsic profile for a hypothetically thin spectral source. (The expression “generally represented” in the present specification means that the function only has to be approximated to the intrinsic profile, preferably using a mathematically appropriate function.) If the data of one spectrometer is standardized, a standardized ideal function or target profile is advantageously selected. If the data is not standardized, the function of Equation 2 is appropriate for this case where FTIR is the first spectrometer.
[0028]
A second standard function G is also selected 218 for the spectral line shape for the second spectrometer. This must also be an idealized profile, for example a Gaussian function for a dispersive spectrometer. This also advantageously represents a corresponding intrinsic distortion profile for a hypothetically thin spectral source in general. The standard function G is preferably the second spectroscopic spectral information P m Is the same standard function selected for the target profile utilized in the
[0029]
A conversion factor F is computed 220 to convert the first standard function to the second standard function using Equation 3 below.
[0030]
G = T * F Equation 3
Where F is a computer-calculated transformation coefficient, T is a first standard function (eg, a modified rectangle), and G is a second standard function (eg, a Gaussian function). For computer calculations, standard functions and spectral information are represented as vectors determined by data stored for a selected interval over a selected spectral range. In this way, the transform coefficients F have the form of a matrix (or a series of matrices as described below), and the matrix data is permanently stored on the disk for routine use with spectral information. Stored 222.
[0031]
Unit conversions must be included because the conversion F is required in the formula to be defined. In this way, the factor F advantageously comprises a conversion into units of the second spectroscopic device. For example, FTIR data is usually wavenumber (cm -1 If the dispersion spectrometer data is a wavelength, the wave number must be converted to a wavelength. Each standard function must also be normalized to the unit domain. As described in the specification and claims, the equation represented by Equation 3 includes such variations as unit conversion and normalization.
[0032]
Measured spectral information D m1 Is obtained for a first spectrometer (eg FTIR), measured and standardized second spectral information P m Is obtained for a second spectrometer (eg a dispersive spectrometer). Information P converted from the following equation 4 c To calculate the first spectral information D m1 Is multiplied by 224.
[0033]
P c = D m1 * F Formula 4
Converted information P c Is stored 226 and the measured spectral information P m Compared to 228. Such a comparison can be made visually or for example with a difference P for each wavelength increment. m -P c Can be performed by a 230 computer that calculates and displays.
[0034]
As shown in
[0035]
Sub-coefficient F to realize computer calculation of coefficient F i Using the second function G (which in this embodiment is independent of wavelength) G = T from Equation 3 i * F i Each subfunction T i A series of sub-coefficients F that define the transform coefficients i Is obtained. A set of sub-coefficients is shown in FIG. (The wavenumber axis for sequential wavelengths has been shifted to show the sub-coefficients in the graph more clearly. In practice, the sequential sub-coefficients are offset by a larger amount than the sub-function of FIG. This series of computer calculations takes a long time, eg Gateway TM It takes 2.5 hours on a 486-50 computer. However, this only needs to be done once and is stored for each pair of spectrometer types. This stored data is not sensitive to individual spectroscopic instruments and can therefore be used universally. The wave number increment is preferably two points per resolution, for example 1.0 cm -1 0.5 cm for resolution of -1 Must correspond to the selected increment for the dispersive spectrometer.
[0036]
Sub-coefficient matrix F i Are applied to normal spectral information obtained from normal operation of the first (FTIR) spectrometer to produce transformed spectral information. To do this each matrix F i Are multiplied by the corresponding spectral data around the wave number i. The sub-factors must be applied to several points around each wave number increment, for example +/- 5 points around each wave number increment (11 points in total). Sub-coefficients are relatively simple, and transform convolution computer computations can be quickly performed using the normal sparse matrix method in, for example, 1-2 seconds. TM 486-50 can be used.
[0037]
Accurate wavenumber calibration of the first (FTIR) spectrometer must be realized for accuracy comparison with the standardized spectral information of the second spectrometer. This is usually done with a standard sample and must be done regularly (eg weekly or monthly) in the spectrometer in use.
[0038]
The above description has been made in particular with respect to transforming unstandardized spectral information of an interferometric FTIR spectrometer for comparison with standardized spectral information of a distributed spectrometer. In general, the use of these spectrometers is to convert high-resolution data for comparison with low-resolution data, converting non-standardized spectrometers to standardized spectrometers. Is to do. Both of these types of conversion are advantageous.
[0039]
The FTIR can be used as a laboratory device compared to an on-line distributed spectrometer used in production. The selection of this pair of spectrometers is particularly advantageous for the application of the present invention. However, there is no such limitation in the application of the present invention. For example, as described above, the FTIR spectral information can be standardized, or any spectroscopic instrument may not have standardization. The spectrometer of this example operates in the infrared region, but other spectral ranges of visible light and ultraviolet light are applicable. Other spectrometers that can utilize the present invention include atomic emission spectrophotometers such as an induction plasma type, atomic absorption spectrometers, fluorescent devices, Raman devices, and optical filter devices, for example. Any of these or other desired spectroscopic instruments can be used in accordance with the present invention and used in pairs. In this example, the resolution and conversion for the FTIR spectrometer is dependent on the wavenumber. More generally, however, one or both of the spectrometers may or may not depend on the wave number.
[0040]
The present invention is used to convert in an environment where the first type and second type spectrometers are substantially the same, eg both FTIR or both grating type. There is also. One advantage of this is that the first spectroscopic device is actually a different device, and therefore the second spectroscopic device is selected as the standard when the selected function is different each time. Another advantage is inherent in FTIR (or other) spectroscopic instruments, i.e., the resolution varies with wavelength (e.g. proportional to the wavelength) and thus the converted data has a wavelength dependent resolution. Is that it is possible. In another aspect, the second spectroscopic device is hypothetical and is not specifically related to any particular spectroscopic device, or even to any arbitrary type of spectroscopic device. In this case, one or more types of first spectrometers are converted to a common data type for general comparison.
[0041]
In another embodiment, for a spectrometer user to implement the aforementioned conversion as shown in FIG. 3 by a computer readable storage medium such as a floppy disk, CD-ROM or tape, for example. Useful for providing a means. The storage medium stores data codes and program codes and can therefore be read by computer computing means. The data code includes a
[0042]
Despite being described above for comparison of spectral data of different types of spectrometers, the present invention is for comparing spectral data of identical types of spectrometers, such as, for example, a dispersion type or an FTIR type In this case, the spectroscopic device is different in operating conditions or different by different models. For example, in FTIR, one spectrometer may have 4 wave number resolutions or 8 wave number resolutions.
[0043]
The present invention is also applicable to other classes of analyzers such as gas chromatographs (GC), where these devices differ in style, column characteristics and / or operating conditions. Examples of different style devices are disclosed in the aforementioned US Pat. No. 5,545,252 and provisional patent application No. 60/006017 (Hinshaw), which differ in carrier gas flow control and sample transfer methods. The description of such devices and their operation will be referred to the cited references, and the detailed description in this specification will be omitted. A “generic” GC is shown schematically in FIG. Carrier gas is supplied from its
[0044]
Analytical information from two different GC devices (as disclosed in the two Hinshaw patents or with different columns or operating conditions) are compared as described in connection with FIG. In the case of GC, the line shape or profile leading to the standard functions T and G is the elution profile. Advantageously, each of these functions usually represents a corresponding inherent device elution profile for a hypothetical instantaneous brief introduction of the sample (similar to a hypothetical thin spectral line for the spectrometer). . Such a profile is described in D.C. H. Burns, J. et al. B. Callis and G.M. D. Exponential as disclosed in Christian's paper "Robust Method for Qualitative Analysis of Two-Dimensional (Chromatographic / Spectral) Data Sets" (Anal. Chem. 58, 1475-1420 (1986)). It is determined by a Gaussian function transformed into With respect to the spectrometer, the appropriate data and program code can be stored on a disk or other computer readable medium for use in existing chromatographic computer.
[0045]
The present invention is also applied for comparison between different liquid chromatographic devices, which are identical devices with different columns or operating conditions, such devices are described, for example, in the aforementioned US patents. No. 4,886,356 (Paradis) and Patent No. 5,173,742 (Young), which are incorporated herein by reference. Column characteristics again include dimension and adsorbent, and operating conditions include carrier gas type and flow rate, and inlet and outlet pressures. A “generic” LC is shown schematically in FIG. Liquid carrier is supplied from
[0046]
Other classes of devices suitable for the present invention are mass spectrometers, X-ray analyzers, and other analyzers that generate analytical profiles in the analysis of materials.
[0047]
As used herein and in the claims, the term “analytical profile” is caused by spectral line shape and other analytical devices that produce chromatographs or profiles such as functions such as wavelength and time. Includes profile. Similarly, “analysis information” includes spectral information and similar information related to chromatographs and other such analytical devices.
[0048]
Although the invention has been described in detail with reference to specific embodiments, various changes and modifications will be apparent to those skilled in the art without departing from the spirit of the invention and the scope of the appended claims. Accordingly, the invention is limited only by the following claims and their equivalents.
[Brief description of the drawings]
FIG. 1 is a schematic diagram of a dispersive spectrometer as one example of one type of spectrometer that is utilized in the present invention.
FIG. 2 is a schematic diagram of an FTIR spectrometer as one example of another type of spectrometer used in the present invention.
FIG. 3 is a flowchart illustrating the application of the present invention in connection with two devices, such as the devices of FIGS.
FIG. 4 is a schematic diagram showing a series of sub-functions calculated with reference to the flowchart of FIG. 3;
FIG. 5 is a schematic diagram showing a series of sub-coefficients calculated from the sub-function of FIG. 4;
FIG. 6 is a schematic diagram of a gas chromatograph as one example of one type of analyzer utilized in the present invention.
FIG. 7 is a schematic diagram of a liquid chromatograph as one example of another type of analyzer utilized in the present invention.
Claims (31)
前記第1の分光測定装置のための分析プロフィルの第1の標準関数を選択するステップと、前記第2の分光測定装置のための分析プロフィルの第2の標準関数を選択するステップと、前記第1の標準関数を第2の標準関数に変換する変換係数をコンピュータ計算するステップと、第1の試料のための第1の分光測定装置により第1の分析情報を得るステップと、第2の試料のための第2の分光測定装置により第2の分析情報を得るステップと、変換された情報を生成するために前記第1の分析情報に前記変換係数を適用するステップと、前記変換された情報を前記第2の分析情報と比較するステップとを有し、
ここで、前記第1の標準関数は或るスペクトル線源に対する第1の分光装置固有のプロフィルを表すスペクトル情報を近似する矩形関数であり、前記第2の標準関数は前記スペクトル線源に対する第2の分光装置固有のプロフィルを表すスペクトル情報を近似するガウス関数である、
ことを特徴とする分析情報を変換するための方法。In a method for converting analysis information of a first spectrometer for comparison with analysis information of a second spectrometer,
Selecting a first standard function of an analysis profile for the first spectrometer, selecting a second standard function of an analysis profile for the second spectrometer, and Calculating a conversion coefficient for converting one standard function into a second standard function, obtaining first analysis information by a first spectrometer for the first sample, and a second sample Obtaining second analysis information by a second spectroscopic measurement device for applying, applying the conversion coefficient to the first analysis information to generate converted information, and the converted information Comparing with the second analysis information,
Here, the first standard function is a rectangular function that approximates spectral information representing a profile unique to the first spectroscopic apparatus for a certain spectrum source, and the second standard function is a second function for the spectrum source. Gaussian function der approximating the spectral information representative of the specific spectral device profile Ru,
A method for converting analytical information characterized by:
前記第1の分光測定装置のためのスペクトル線形状のための第1の標準関数を選択するステップと、前記第2の分光測定装置のためのスペクトル線形状のための第2の標準関数を選択するステップと、前記第1の標準関数を前記第2の標準関数に変換する変換係数をコンピュータ計算するステップと、第1の試料のための前記第1の分光測定装置により第1のスペクトル情報を得るステップと、第2の試料のための前記第2の分光測定装置により第2のスペクトル情報を得るステップと、変換された情報を生成するために前記第1のスペクトル情報に前記変換係数を適用するステップと、前記変換された情報を前記第2のスペクトル情報と比較するステップとを有し、
ここで、前記第1の標準関数は或るスペクトル線源に対する第1の分光装置固有のプロフィルを表すスペクトル情報を近似する矩形関数であり、前記第2の標準関数は前記スペクトル線源に対する第2の分光装置固有のプロフィルを表すスペクトル情報を近似するガウス関数である、
ことを特徴とする分析情報を変換するための方法。In a method for converting analytical information of a first spectrometer for comparison with spectral information of a second spectrometer within a selected spectral range,
Selecting a first standard function for a spectral line shape for the first spectrometer, and selecting a second standard function for the spectral line shape for the second spectrometer Calculating a conversion coefficient for converting the first standard function into the second standard function, and first spectral information by the first spectrometer for the first sample. Obtaining the second spectral information by the second spectroscopic instrument for the second sample, and applying the conversion factor to the first spectral information to generate transformed information And comparing the converted information with the second spectral information,
Here, the first standard function is a rectangular function that approximates spectral information representing a profile unique to the first spectroscopic apparatus for a certain spectrum source, and the second standard function is a second function for the spectrum source. Gaussian function der approximating the spectral information representative of the specific spectral device profile Ru,
A method for converting analytical information characterized by:
分析情報を変換するための方法が更に、プロフィルデータが前記固有プロフィルを表すように前記狭幅スペクトル線のためのプロフィルデータを生成するために前記線源で前記第2の分光測定装置を最初に操作するステップと前記プロフィルデータを第2の標準関数に変換するための変換フィルタをコンピュータ計算するステップとにより標準化された第2のスペクトル情報を生じさせることを含み、
第2のスペクトル情報を得るステップが、試料スペクトルを表す試料データを生成するために試料で前記第2の分光測定装置を通常に操作することと、前記第2のスペクトル情報を生成するために前記試料データに前記変換フィルタを適用することとを含むことを特徴とする請求項8に記載の分析情報を変換するための方法。Each standard function is selected to represent a corresponding unique device profile for the spectral line source, and the second spectrometric device determines a characteristic characteristic profile of the spectral line shape having a characteristic width for the spectral line. The second spectroscopic measurement device has a source of narrow spectral lines having an associated line width narrower than the natural width;
A method for converting analytical information further comprises first causing the second spectroscopic device at the source to generate profile data for the narrow spectral line such that profile data represents the intrinsic profile. Generating standardized second spectral information by manipulating and computing a transform filter for transforming the profile data into a second standard function,
Obtaining second spectral information comprises: normally operating the second spectrometer with a sample to generate sample data representing a sample spectrum; and generating the second spectral information. 9. The method for converting analysis information according to claim 8, comprising applying the conversion filter to sample data.
分析プロフィルのための選択された第1の標準関数を有する第1の分光測定装置と、分析プロフィルのための選択された第2の標準関数を有する第2の分光測定装置と、第1の標準関数を前記第2の標準関数に変換する変換係数をコンピュータ計算する手段と、第1の試料のための第1の分光測定装置により第1の分析情報を得る手段と、第2の試料のための第2の分光測定装置により第2の分析情報を得る手段と、変換された情報を生成するために前記第1の分析情報に前記変換係数を適用する手段と、前記変換された情報を前記第2の分析情報と比較する手段とを有し、
ここで、前記第1の標準関数は或るスペクトル線源に対する第1の分光装置固有のプロフィルを表すスペクトル情報を近似する矩形関数であり、前記第2の標準関数は前記スペクトル線源に対する第2の分光装置固有のプロフィルを表すスペクトル情報を近似するガウス関数である、
ことを特徴とする分析情報を変換するための装置。In an apparatus for converting analysis information for comparison,
A first spectrometer having a selected first standard function for an analytical profile, a second spectrometer having a selected second standard function for an analytical profile, and a first standard Means for computing a conversion coefficient for converting a function into the second standard function, means for obtaining first analysis information by a first spectroscopic device for the first sample, and for the second sample Means for obtaining second analysis information by the second spectrometer, means for applying the conversion coefficient to the first analysis information to generate converted information, and converting the converted information to the first analysis information. Means for comparing with the second analysis information,
Here, the first standard function is a rectangular function that approximates spectral information representing a profile unique to the first spectroscopic apparatus for a certain spectrum source, and the second standard function is a second function for the spectrum source. Gaussian function der approximating the spectral information representative of the specific spectral device profile Ru,
A device for converting analysis information characterized by that.
スペクトル線形状のための選択された第1の標準関数を有する第1の分光測定装置と、スペクトル線形状のための選択された第2の標準関数を有する第2の分光測定装置と、前記第1の標準関数を前記第2の標準関数に変換する変換係数をコンピュータ計算する手段と、第1の試料のための前記第1の分光測定装置により第1のスペクトル情報を得る手段と、第2の試料のための前記第2の分光測定装置により第2のスペクトル情報を得る手段と、変換された情報を生成するために前記第1のスペクトル情報に前記変換係数を適用する手段と、前記変換された情報を前記第2のスペクトル情報と比較する手段とを有し、
ここで、前記第1の標準関数は或るスペクトル線源に対する第1の分光装置固有のプロフィルを表すスペクトル情報を近似する矩形関数であり、前記第2の標準関数は前記スペクトル線源に対する第2の分光装置固有のプロフィルを表すスペクトル情報を近似するガウス関数である、
ことを特徴とする分析情報を変換するための装置。In an apparatus for converting analytical information for comparison within a selected spectral range,
A first spectrometer having a selected first standard function for a spectral line shape; a second spectrometer having a selected second standard function for a spectral line shape; Means for computing a conversion coefficient for converting one standard function to the second standard function, means for obtaining first spectral information by the first spectrometer for the first sample, second means Means for obtaining second spectral information by the second spectroscopic measurement device for a sample of the first, means for applying the conversion coefficient to the first spectral information to generate transformed information, and the conversion Means for comparing the obtained information with the second spectral information,
Here, the first standard function is a rectangular function that approximates spectral information representing a profile unique to the first spectroscopic apparatus for a certain spectrum source, and the second standard function is a second function for the spectrum source. Gaussian function der approximating the spectral information representative of the specific spectral device profile Ru,
A device for converting analysis information characterized by that.
分析情報を変換するための装置が更に、標準化された第2のスペクトル情報を生成する手段を有し、前記生成手段が、プロフィルデータが前記固有プロフィルを表すように前記狭幅スペクトル線のためのプロフィルデータを生成するために前記線源で前記第2の分光測定装置を最初に操作する手段と、前記プロフィルデータを前記第2の標準関数に変換する変換フィルタをコンピュータ計算する手段とを有し、
第2のスペクトル情報を得る手段が、試料スペクトルを表す試料データを生成するために試料で前記第2の分光測定装置を通常に操作する手段と、前記第2のスペクトル情報を生成するために前記試料データに前記変換フィルタを適用する手段とを有することを特徴とする請求項19に記載の分析情報を変換するための装置。Each standard function represents a corresponding unique device profile for the spectral line source, and the second spectroscopic measurement device has a characteristic characteristic profile of the spectral line shape with a characteristic width for the spectral line; A second spectroscopic instrument has a source of narrow spectral lines having an associated line width that is narrower than the intrinsic width;
The apparatus for converting analysis information further comprises means for generating standardized second spectral information, the generating means for the narrow spectral line such that profile data represents the intrinsic profile. Means for initially operating the second spectrometer at the source to generate profile data; and means for computing a conversion filter for converting the profile data to the second standard function. ,
Means for obtaining second spectral information means for normally operating the second spectroscopic instrument with a sample to generate sample data representing a sample spectrum; and for generating the second spectral information 20. The apparatus for converting analysis information according to claim 19, further comprising means for applying the conversion filter to sample data.
前記記憶媒体が、変換を実現するコンピュータ計算手段において利用可能であり、前記記憶媒体は、前記コンピュータ計算手段により読取り可能なようにデータコード及びプログラムコードを格納して有し、前記データコードは、前記第1の標準関数を前記第2の標準関数に変換する変換係数から成り、前記プログラムコードは、比較のために変換された情報を生成するために第1の分析情報に前記変換係数を適用する手段を有し、
ここで、前記第1の標準関数は或るスペクトル線源に対する第1の分光装置固有のプロフィルを表すスペクトル情報を近似する矩形関数であり、前記第2の標準関数は前記スペクトル線源に対する第2の分光装置固有のプロフィルを表すスペクトル情報を近似するガウス関数である、
ことを特徴とするスペクトル情報の変換において利用するためのコンピュータ読取り可能な記憶媒体。First spectral information obtained by a first spectrometer having a first standard function selected for an analysis profile and a second having a second standard function selected for the analysis profile In a computer readable storage medium for use in converting spectral information for comparison with second analytical information obtained by a spectrometer
The storage medium can be used in a computer calculation means for realizing conversion, and the storage medium stores a data code and a program code so as to be readable by the computer calculation means. A conversion coefficient for converting the first standard function into the second standard function, wherein the program code applies the conversion coefficient to the first analysis information to generate converted information for comparison; Means to
Here, the first standard function is a rectangular function that approximates spectral information representing a profile unique to the first spectroscopic apparatus for a certain spectrum source, and the second standard function is a second function for the spectrum source. Gaussian function der approximating the spectral information representative of the specific spectral device profile Ru,
A computer readable storage medium for use in the conversion of spectral information.
前記比較を、スペクトル線形状のための選択された第1の標準関数を有する第1の分光測定装置により得られた第1のスペクトル情報と、スペクトル線形状のための選択された第2の標準関数を有する第2の分光測定装置により得られた第2のスペクトル情報との間で行い、前記記憶媒体は、前記変換を実現するコンピュータ手段において利用可能であり、前記記憶媒体は、コンピュータ計算手段により読取り可能なようにデータコード及びプログラムコードを格納しており、前記データコードは、前記第1の標準関数を前記第2の標準関数に変換する変換係数を有し、前記プログラムコードは、比較のために変換された情報を生成するために前記第1の情報に前記変換係数を適用する手段を有し、
ここで、前記第1の標準関数は或るスペクトル線源に対する第1の分光装置固有のプロフィルを表すスペクトル情報を近似する矩形関数であり、前記第2の標準関数は前記スペクトル線源に対する第2の分光装置固有のプロフィルを表すスペクトル情報を近似するガウス関数である、
ことを特徴とするスペクトル情報の変換において利用するためのコンピュータ読取り可能な記憶媒体。In a computer readable storage medium for use in converting spectral information for comparison within a selected spectral range,
The comparison may be performed using first spectral information obtained by a first spectrometer having a selected first standard function for spectral line shape and a selected second standard for spectral line shape. The storage medium can be used in computer means for realizing the conversion, and the storage medium is computer calculation means. A data code and a program code are stored so as to be readable by the data code, and the data code has a conversion coefficient for converting the first standard function into the second standard function. Means for applying the transform coefficient to the first information to generate information transformed for
Here, the first standard function is a rectangular function that approximates spectral information representing a profile unique to the first spectroscopic apparatus for a certain spectrum source, and the second standard function is a second function for the spectrum source. Gaussian function der approximating the spectral information representative of the specific spectral device profile Ru,
A computer readable storage medium for use in the conversion of spectral information.
Applications Claiming Priority (2)
| Application Number | Priority Date | Filing Date | Title |
|---|---|---|---|
| US3372696P | 1996-12-20 | 1996-12-20 | |
| US60/033726 | 1996-12-20 |
Publications (2)
| Publication Number | Publication Date |
|---|---|
| JPH10206236A JPH10206236A (en) | 1998-08-07 |
| JP4044659B2 true JP4044659B2 (en) | 2008-02-06 |
Family
ID=21872095
Family Applications (1)
| Application Number | Title | Priority Date | Filing Date |
|---|---|---|---|
| JP35374897A Expired - Fee Related JP4044659B2 (en) | 1996-12-20 | 1997-12-22 | Method and apparatus for converting analytical information and computer readable storage medium for use in converting spectral information |
Country Status (4)
| Country | Link |
|---|---|
| US (1) | US6138082A (en) |
| EP (1) | EP0851219B1 (en) |
| JP (1) | JP4044659B2 (en) |
| DE (1) | DE69739296D1 (en) |
Families Citing this family (18)
| Publication number | Priority date | Publication date | Assignee | Title |
|---|---|---|---|---|
| NL1010540C2 (en) * | 1998-11-12 | 2000-05-15 | Maasland Nv | Method for determining the presence of certain substances in milk and device for applying this method. |
| US6647343B1 (en) * | 1999-04-29 | 2003-11-11 | Agilent Technologies, Inc. | Temporal profile analysis of mass data in a mass sensor system |
| US6687000B1 (en) * | 2000-06-26 | 2004-02-03 | Wisconsin Alumni Research Foundation | Photon-sorting spectroscopic microscope system |
| US6560546B1 (en) * | 2000-08-07 | 2003-05-06 | Infrasoft Llc | Remote analysis system |
| US6406153B1 (en) * | 2000-11-10 | 2002-06-18 | Paul R. Stremple | Spectral dispersion device |
| JP3855153B2 (en) * | 2001-07-05 | 2006-12-06 | 株式会社日立製作所 | Security system |
| US7272510B2 (en) | 2002-01-10 | 2007-09-18 | Foss Analytical A/S | Method and means for correcting measuring instruments |
| JP3992188B2 (en) * | 2002-10-15 | 2007-10-17 | 株式会社キャンパスクリエイト | Property prediction method |
| JP4686450B2 (en) * | 2003-04-28 | 2011-05-25 | セルノ・バイオサイエンス・エルエルシー | Mass spectral analysis calculation method and system |
| US6983213B2 (en) * | 2003-10-20 | 2006-01-03 | Cerno Bioscience Llc | Methods for operating mass spectrometry (MS) instrument systems |
| US7529629B2 (en) * | 2003-04-28 | 2009-05-05 | Cerno Bioscience Llc | Computational methods and systems for multidimensional analysis |
| US7459713B2 (en) | 2003-08-14 | 2008-12-02 | Microptix Technologies, Llc | Integrated sensing system approach for handheld spectral measurements having a disposable sample handling apparatus |
| US7099015B2 (en) * | 2003-08-25 | 2006-08-29 | Ivan Melnyk | Fiber optic sensing device for measuring a physical parameter |
| EP1827657B1 (en) * | 2004-10-28 | 2015-04-22 | Cerno Bioscience LLC | Qualitative and quantitative mass spectral analysis |
| US8597190B2 (en) | 2007-05-18 | 2013-12-03 | Optiscan Biomedical Corporation | Monitoring systems and methods with fast initialization |
| EP2040050B1 (en) * | 2007-09-24 | 2012-03-07 | Universität Potsdam | Measuring assembly for an optical spectrometer |
| US9194744B2 (en) | 2008-05-16 | 2015-11-24 | University Of Washington | Transmission quantification of open path FTIR spectra with temperature compensation |
| AU2021336888A1 (en) * | 2020-09-01 | 2023-03-23 | The General Hospital Corporation | Systems and methods for monitoring an analyte or parameter for a patient |
Family Cites Families (5)
| Publication number | Priority date | Publication date | Assignee | Title |
|---|---|---|---|---|
| US4866644A (en) * | 1986-08-29 | 1989-09-12 | Shenk John S | Optical instrument calibration system |
| US5303165A (en) * | 1992-02-12 | 1994-04-12 | The Perkin-Elmer Corporation | Standardizing and calibrating a spectrometric instrument |
| ES2089574T3 (en) * | 1992-10-07 | 1996-10-01 | Ashland Oil Inc | CALIBRATION OF SPECTROSCOPIC INSTRUMENT. |
| US5545895A (en) * | 1995-03-20 | 1996-08-13 | The Dow Chemical Company | Method of standardizing data obtained through mass spectrometry |
| US5710713A (en) * | 1995-03-20 | 1998-01-20 | The Dow Chemical Company | Method of creating standardized spectral libraries for enhanced library searching |
-
1997
- 1997-12-18 US US08/993,483 patent/US6138082A/en not_active Expired - Lifetime
- 1997-12-19 DE DE69739296T patent/DE69739296D1/en not_active Expired - Lifetime
- 1997-12-19 EP EP97122551A patent/EP0851219B1/en not_active Expired - Lifetime
- 1997-12-22 JP JP35374897A patent/JP4044659B2/en not_active Expired - Fee Related
Also Published As
| Publication number | Publication date |
|---|---|
| EP0851219A2 (en) | 1998-07-01 |
| EP0851219A3 (en) | 1999-01-27 |
| EP0851219B1 (en) | 2009-03-11 |
| DE69739296D1 (en) | 2009-04-23 |
| US6138082A (en) | 2000-10-24 |
| JPH10206236A (en) | 1998-08-07 |
Similar Documents
| Publication | Publication Date | Title |
|---|---|---|
| JP4044659B2 (en) | Method and apparatus for converting analytical information and computer readable storage medium for use in converting spectral information | |
| White | Chromatography/Fourier transform infrared spectroscopy and its applications | |
| US6049762A (en) | Standardizing a spectrometric instrument | |
| US5610836A (en) | Process to use multivariate signal responses to analyze a sample | |
| CA2286093C (en) | Method for standardizing raman spectrometers to obtain stable and transferable calibrations | |
| JP4216317B2 (en) | SPECTRUM DATA ANALYSIS DEVICE, SPECTRUM DATA ANALYSIS METHOD, AND COMPUTER-READABLE RECORDING MEDIUM RECORDING PROGRAM FOR PERFORMING SPECTRUM DATA ANALYSIS | |
| Griffiths et al. | Rapid scan infrared Fourier transform spectroscopy | |
| Mann et al. | Spectrophotometric analysis by cross-correlation | |
| Raj et al. | Toward standardization of Raman spectroscopy: Accurate wavenumber and intensity calibration using rotational Raman spectra of H2, HD, D2, and vibration–rotation spectrum of O2 | |
| US8922769B2 (en) | High resolution MEMS-based Hadamard spectroscopy | |
| Liebergesell et al. | A milliliter-scale setup for the efficient characterization of isothermal vapor-liquid equilibria using Raman spectroscopy | |
| Sharpe | Stray light in UV-VIS spectrophotometers | |
| Pickett et al. | Absolute absorption of ozone in the midinfrared | |
| Liu et al. | Cavity ring-down spectroscopy of 17O-enriched water vapor between 12,055 and 12,260 cm− 1 | |
| JP4041199B2 (en) | Method and apparatus for standardizing spectral information and computer readable storage medium for utilizing standardized spectral information | |
| Bak et al. | Signal-to-noise ratio of FT-IR CO gas spectra | |
| Gustafsson et al. | Extension of the dynamic range of the wavelength-modulated diode laser absorption spectrometry technique | |
| Goldovsky et al. | Correlational gas analyzer | |
| JP3128163U (en) | Spectrophotometer | |
| Stacey et al. | A method for finding the instrumental profile of a Fabry-Perot etalon | |
| Filippas et al. | A system for monitoring the refractivities of fluids in the DELPHI RICH detectors in the VUV region | |
| Analytical Methods Committee | Evaluation of analytical instrumentation. Part XI Instrumentation for molecular fluorescence spectrometry. Report by the Analytical Methods Committee | |
| Vickers et al. | On-line monitoring by Raman spectroscopy: instrument control and calibration | |
| Buijs | Infrared spectroscopy | |
| Analytical Methods Committee | Report by the Analytical Methods CommitteeEvaluation of analytical instrumentation. Part II. Revised 1998. Atomic absorption spectrophotometers, primarily for use with ETA furnaces |
Legal Events
| Date | Code | Title | Description |
|---|---|---|---|
| A621 | Written request for application examination |
Free format text: JAPANESE INTERMEDIATE CODE: A621 Effective date: 20040906 |
|
| A977 | Report on retrieval |
Free format text: JAPANESE INTERMEDIATE CODE: A971007 Effective date: 20060628 |
|
| A131 | Notification of reasons for refusal |
Free format text: JAPANESE INTERMEDIATE CODE: A131 Effective date: 20060712 |
|
| A601 | Written request for extension of time |
Free format text: JAPANESE INTERMEDIATE CODE: A601 Effective date: 20061011 |
|
| A602 | Written permission of extension of time |
Free format text: JAPANESE INTERMEDIATE CODE: A602 Effective date: 20061016 |
|
| A521 | Written amendment |
Free format text: JAPANESE INTERMEDIATE CODE: A523 Effective date: 20070105 |
|
| A02 | Decision of refusal |
Free format text: JAPANESE INTERMEDIATE CODE: A02 Effective date: 20070307 |
|
| A521 | Written amendment |
Free format text: JAPANESE INTERMEDIATE CODE: A523 Effective date: 20070531 |
|
| A911 | Transfer to examiner for re-examination before appeal (zenchi) |
Free format text: JAPANESE INTERMEDIATE CODE: A911 Effective date: 20070711 |
|
| A131 | Notification of reasons for refusal |
Free format text: JAPANESE INTERMEDIATE CODE: A131 Effective date: 20070928 |
|
| A521 | Written amendment |
Free format text: JAPANESE INTERMEDIATE CODE: A523 Effective date: 20071005 |
|
| TRDD | Decision of grant or rejection written | ||
| A01 | Written decision to grant a patent or to grant a registration (utility model) |
Free format text: JAPANESE INTERMEDIATE CODE: A01 Effective date: 20071102 |
|
| A61 | First payment of annual fees (during grant procedure) |
Free format text: JAPANESE INTERMEDIATE CODE: A61 Effective date: 20071116 |
|
| R150 | Certificate of patent or registration of utility model |
Free format text: JAPANESE INTERMEDIATE CODE: R150 |
|
| FPAY | Renewal fee payment (event date is renewal date of database) |
Free format text: PAYMENT UNTIL: 20101122 Year of fee payment: 3 |
|
| FPAY | Renewal fee payment (event date is renewal date of database) |
Free format text: PAYMENT UNTIL: 20111122 Year of fee payment: 4 |
|
| FPAY | Renewal fee payment (event date is renewal date of database) |
Free format text: PAYMENT UNTIL: 20121122 Year of fee payment: 5 |
|
| FPAY | Renewal fee payment (event date is renewal date of database) |
Free format text: PAYMENT UNTIL: 20131122 Year of fee payment: 6 |
|
| R250 | Receipt of annual fees |
Free format text: JAPANESE INTERMEDIATE CODE: R250 |
|
| R250 | Receipt of annual fees |
Free format text: JAPANESE INTERMEDIATE CODE: R250 |
|
| LAPS | Cancellation because of no payment of annual fees |