JP4040722B2 - Gravure printing method and gravure printed matter - Google Patents
Gravure printing method and gravure printed matter Download PDFInfo
- Publication number
- JP4040722B2 JP4040722B2 JP19183897A JP19183897A JP4040722B2 JP 4040722 B2 JP4040722 B2 JP 4040722B2 JP 19183897 A JP19183897 A JP 19183897A JP 19183897 A JP19183897 A JP 19183897A JP 4040722 B2 JP4040722 B2 JP 4040722B2
- Authority
- JP
- Japan
- Prior art keywords
- image
- pixel
- gravure
- noise
- value
- Prior art date
- Legal status (The legal status is an assumption and is not a legal conclusion. Google has not performed a legal analysis and makes no representation as to the accuracy of the status listed.)
- Expired - Fee Related
Links
Images


Landscapes
- Manufacture Or Reproduction Of Printing Formes (AREA)
- Printing Methods (AREA)
Description
【0001】
【発明の属する技術分野】
本発明はグラビア印刷方法およびグラビア印刷物に関し、特に、電気信号に基づいて彫刻針(ダイヤモンド針)もしくはレーザを駆動させ、版胴面に多数のセルを彫刻するいわゆる電子彫刻方式の手法を利用して凹版を形成し、この凹版を用いて印刷を行いグラビア印刷物を製造する技術に関する。
【0002】
【従来の技術】
グラビア印刷は、凹版を用いた印刷手法であり、主に写真画像を含んだ高品質の印刷物を作成する用途に利用されている。グラビア印刷に用いる版には、多数の凹状のセルが形成され、このセル内に充填されたインキが紙面へと転写されることになる。したがって、グラビア印刷物では、多数のセル状のインキ(網点)によって画像が形成されることになる。別言すれば、グラビア印刷によって紙面上に形成される画像は、所定のピッチで縦横に配列された多数の網点から構成され、個々の網点のインキ量によって濃淡表現がなされることになる。
【0003】
グラビア印刷を行う場合、多数の画素から構成される原画像を用意し、この原画像上の画素の画素値(濃度値)をセルの大きさに変換することにより、1つの画素を1つのセルで表現した凹版を作成することになる。大きな画素値を有する画素は大きなセルに変換され、小さな画素値を有する画素は小さなセルに変換される。このセルの大小は、紙面上でのインキの量に反映され、原画像の濃度分布に応じた濃淡パターンが紙面上に再現されることになる。
【0004】
グラビア印刷用の凹版を形成するための方法としては、物理的な彫刻方式と化学的な腐食方式とが一般に知られている。物理的な彫刻方式は、物理的な方法によってセルを形成する方式であり、通常は電気信号に基づいて彫刻針(ダイヤモンド針)もしくはレーザを駆動させることによりセルの彫刻が行われるため、電子彫刻方式とも呼ばれている。物理的な彫刻方式として最も一般的な方法は、機械彫刻方式と呼ばれている彫刻針を用いた方式である。機械彫刻方式は、個々のセルをダイヤモンド針で1つ1つ物理的に彫刻してゆく方法を採るもので、通常、版面を複数のダイヤモンド針で走査しながら、打刻を行ってゆくことになる。打刻時におけるダイヤモンド針と版面との距離を制御することにより、打刻により形成されるセルの大きさを調節することができる。原画像上の各画素の画素配列および画素値に基づいて、セル彫刻装置による走査処理および打刻処理を制御することにより、原画像に応じた版を作成することができる。
【0005】
一方、化学的な腐食方式は、一般に「網グラビア方式」とも呼ばれており、腐食液を用いた化学処理により、版面上に多数のセルを一括して形成するものである。通常は、原画像上の各画素の情報に基づいて、網点フィルム上にセル配列のイメージを出力し、この網点フィルムを用いたフォトリソグラフィ工程により版が作成される。すなわち、版面に形成されたレジスト層に対して、網点フィルム上のイメージを焼き付け、現像工程およびエッチング工程を経て、セル内部の領域を腐食除去して凹部を形成することになる。
【0006】
【発明が解決しようとする課題】
上述したように、グラビア印刷用の凹版を形成するための方法として、2とおりの方式が知られているが、最近では、機械彫刻方式を代表とする物理的な方式が主流になりつつある。腐食方式は、化学処理を伴うため、エッチング液の温度や疲労具合によって腐食の状態が変動し、再現性を確保することが困難であるという問題を抱えている。また、同一の版面上においても、エッチング液の流れの具合によって部分部分で腐食速度に差が生じ、形成されるセルの大きさが部分ごとに不均一になるおそれもある。したがって、腐食方式で版を作成するためには、熟練した技術者が、独自のノウハウを駆使しながら作業を進める必要がある。これに対し、機械彫刻方式は、電子式セル彫刻装置の性能が向上し、比較的容易に再現性を確保できるようになってきており、近年、普及度が急伸している。しかも、腐食方式は化学処理による環境汚染の問題も指摘されてきており、特に、欧州各国においては、ほとんどのグラビア印刷が、機械彫刻方式で行われている。
【0007】
しかしながら、デザイナーや写真家の中には、いまだに腐食方式のグラビア印刷物の画質を支持する者が少なくない。もちろん、機械彫刻方式によるグラビア印刷物の画質と、腐食方式によるグラビア印刷物の画質とを、客観的な尺度で比較評価することは適切ではない。両者の相違は、あくまでも主観的な嗜好の問題であり、その評価は観者の感性に負うところが多い。ただ、このような主観的な評価によると、腐食方式のグラビア印刷物は、機械彫刻方式のグラビア印刷物に比べて、「立体感に富む」、「人間の肌の表現力に優れる」、「不快な筋が観察されにくい」といった利点を有すると言われている。また、機械彫刻方式によるグラビア印刷物では、画素値が所定のしきい値を越えると、隣接するセル間のインキが結合し、急激に濃度値が高くなるトーンジャンプという現象が生じ、画質を劣化させることも知られている。
【0008】
そこで本発明は、機械彫刻方式に代表される物理的な彫刻方式を採りつつ、疑似的に化学的な腐食方式のグラビア印刷物に近い画質をもったグラビア印刷物を実現することを目的とする。
【0009】
【課題を解決するための手段】
(1) 本発明の第1の態様は、所定のピッチで配列された複数のセルを彫刻することにより凹版を作成し、この凹版を用いて印刷を行うグラビア印刷方法において、
それぞれ所定の画素値を有する画素の配列によって構成される原画像を用意する段階と、
原画像を構成する個々の画素の画素値にノイズ成分を付加することにより修正画像を作成する段階と、
修正画像を構成する個々の画素の画素値に応じた大きさのセルを彫刻することにより凹版を作成する段階と、
この凹版を用いて印刷を行う段階と、
を行い、修正画像を作成する段階では、
原画像の画素配列に対応した画素配列を有し、個々の画素にランダムなノイズ値が定義されたホワイトノイズ画像を用意し、
このホワイトノイズ画像に対して、所定の空間フィルタを用いたフィルタリング処理を行うことにより、個々の画素に所定の空間周波数をもったノイズ値が定義された修正用ノイズ画像を生成し、
原画像の個々の画素がもつ画素値を、修正用ノイズ画像の対応する画素がもつ画素値によって修正することにより、修正画像を作成するようにしたものである。
【0012】
(2) 本発明の第2の態様は、上述の第1の態様に係るグラビア印刷方法において、
画素ピッチの2〜5倍の周期をもったノイズ成分を含む修正用ノイズ画像を生成するようにしたものである。
【0016】
(3) 本発明の第3の態様は、上述の第1または第2の態様に係るグラビア印刷方法を用いてグラビア印刷物を製造するようにしたものである。
【0017】
(4) 本発明の第4の態様は、所定のピッチで配列された複数の網点によって画像が表現されたグラビア印刷物において、
個々の網点の大きさの空間的分布に、網点のピッチの2〜5倍の周期をもったノイズ成分を付加するようにしたものである。
【0018】
(5) 本発明の第5の態様は、上述の第4の態様に係るグラビア印刷物において、
所定の微小領域内において、平均的な大きさを有する標準網点を定義したときに、標準網点よりも大きな網点と標準網点よりも小さな網点とが、空間的にほぼ交互に配置されるようにしたものである。
【0025】
【発明の実施の形態】
§1. 機械彫刻方式と腐食方式とにおけるセルの相違
以下、本発明を図示する実施形態に基づいて説明する。はじめに、一般的な機械彫刻方式のグラビア印刷物と腐食方式(網グラビア方式)のグラビア印刷物とのセル構成の相違を述べておく。図1は、機械彫刻方式の工程で作成されたグラビア印刷版の部分拡大図、図2は、腐食方式の工程で作成されたグラビア印刷版の部分拡大図である。いずれも元になる画像データは、網点密度60%の平網に相当する画像データであり、セル(図にハッチングを施した領域)の面積は、全体のほぼ60%となっている。図示の横幅は900μm程度であり、通常、肉眼で観察した場合には、個々のセルの存在は認識できない。しかしながら、これを拡大して観察すると、両方式で作成された版では、セルの形状や分布に大きな差があることがわかる。
【0026】
図1に示すように、機械彫刻方式で作成された版上には、同一の形状および大きさを有するセルが、同一ピッチで規則正しく配置されている。これは、既に述べたように、版面を複数のダイヤモンド針で走査しながら、規則正しく打刻を行ってゆくためである。したがって、ここに示す例のように、平網画像の場合、同一形状かつ同一面積のセルが規則正しく配置されることになる。前述したトーンジャンプという現象は、このようなセルの規則的配置に起因して生じる現象である。すなわち、網点密度の値があるしきい値を越えると、個々のセルの面積が臨界値を越え、印刷物上で隣接する網点間のインキが相互に結合し、網点の境界線が失われ、濃度値が急激に増加することになる。
【0027】
これに対し、図2に示すように、腐食方式で作成された版上には、原画像が平網であるにもかかわらず、形状および大きさがそれぞれ異なったセルが配置されている。個々のセルは、形状が様々であり、大きさも微小なものから、かなり大きなものまで千差万別のように見える。しかしながら、これは通常のセルパターンに、いわゆる「白線パターン」と呼ばれるパターンを合成した合成パターンに基づき、腐食を行っているためである。図2に示されているパターンを注意深く観察すると、所定ピッチで配置されたセルパターン(ハッチングを施して示すパターン)に白線パターン(セルを分割するような格子状のパターン)が重複している様子が認識できる。一般に、セルを配置するピッチに比べて、白線パターンを構成する格子のピッチは小さく設定され、個々のセルは、白線パターンにより種々の態様で分割されることになる。図2に示す例でも、ところどころに四分割、三分割あるいは二分割されたセルの痕跡が認識できる。この白線パターンによる分割態様が様々であるため、分割後の個々のセルは、形状も大きさも様々なものになる。
【0028】
結局、腐食方式で版を作成する場合、網点フィルム上に用意されるもともとの画像パターン自体が、所定ピッチで配置されたセルのパターンと白線パターンとの合成パターンになっており、形状も大きさも異なった多数のセルから構成されていることになる。それに加えて、実際の腐食工程では、腐食液の温度、疲労度、流速などが部分ごとに変動するため、版上に形成される個々のセルの形状および大きさには、部分ごとに揺らぎの要素が加わることになる。結局、腐食方式で作成された版上の個々のセルは、白線パターンによる分割態様に基づく揺らぎの要素と、腐食工程時の条件に基づく揺らぎの要素との相乗効果により、形状も大きさも様々なものになる。
【0029】
このように、腐食方式で作成された版には、形状も大きさも様々なセルが形成されるため、この版を用いたグラビア印刷物上には、トーンジャンプという現象は生じない。図1および図2には、原画像が平網画像の例を示したが、原画像が階調画像の場合にも、同様の理由により画質の差が生じていると考えてよい。すなわち、一般に、「立体感に富む」、「人間の肌の表現力に優れる」、「不快な筋が観察されにくい」といった言葉で表現される腐食方式の利点は、セルの形状や大きさに揺らぎの要素(白線パターンによる分割の揺らぎと腐食条件の揺らぎ)が付加されているためと考えることができる。
【0030】
§2. 本発明の基本概念
本発明の目的は、作業が容易で環境汚染の問題もない物理的な彫刻方式を採りつつ、疑似的に化学的な腐食方式のグラビア印刷物に近い画質をもった印刷物を実現することにある。そのためには、上述した揺らぎの要素を疑似的に付加してやればよい。本発明の基本概念は、所定の画素値を有する画素の配列によって構成される原画像を用意し、この原画像を構成する各画素のもつ画素値に、ノイズ成分を付加することにより揺らぎの要素を含んだ修正画像を作成し、この修正画像を構成する個々の画素の画素値に応じた大きさのセルを機械的に彫刻してグラビア印刷用の版を作成することにより、機械彫刻方式を採りつつ、腐食方式のグラビア印刷物に近い画質をもった印刷物を疑似的に作成することにある。
【0031】
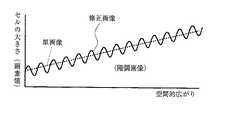
いま、図1に示す機械彫刻方式で作成された版と、図2に示す腐食方式で作成された版とについて、セルの大きさ分布を比較するために、図3に示すようなグラフを考えてみる。このグラフは、横軸に空間的広がりをとり、縦軸にセルの大きさをとったものである。ここで、グラフの破線は、機械彫刻方式で作成された平網画像の版についてのセルの大きさ分布を示しており、グラフの実線は、腐食方式で作成された平網画像の版についてのセルの大きさ分布を示している。図示のとおり、機械彫刻方式の場合、セルの大きさが空間的に一定であるのに対し、腐食方式の場合、セルの大きさは空間的にランダムに変動している。
【0032】
ダイヤモンド針により打刻される個々のセルの大きさは、対応する画素の画素値に応じて決定される。そこで、原画像を構成する各画素のもつ画素値に、ノイズ成分を付加して修正画像を作成すれば、この修正画像に基づいて作成される版上では、セルの大きさは空間的に変動を生じたものになる。たとえば、図4に示すグラフは、平網画像からなる原画像と、これにノイズ成分を付加した修正画像と、についての画素値の空間分布を示している。ここで、画素値はセルの大きさに対応した量であり、この修正画像に基づいて作成された版上のセルも、空間的に大きさが変動したものになる。原画像が階調画像であった場合は、図5のグラフ(この例は単調なグラデーション画像についてのグラフ)に示すように、もともとの原画像における画素値も空間的に変動することになるが、ノイズ成分を付加した修正画像の画素値は、より細かな変動を示すことになる。
【0033】
図6は、本発明に係るグラビア印刷方法を実施するためのシステム構成例を示すブロック図である。まず、グラビア印刷用画像データ生成装置10において、所定の画素値を有する画素の配列によって構成される原画像を用意する。この例では、グラビア印刷用画像データ生成装置10を用いて、C版,M版,Y版,K版の4版についての原画像データC,M,Y,Kをそれぞれ用意している。これらの画像データに含まれる個々の画素は、グラビア印刷用の個々のセルに対応したものとなる。
【0034】
続いて、ノイズ成分付加装置20において、各原画像データC,M,Y,Kに、ノイズ成分を付加する処理が行われる。すなわち、各画像データを構成する画素のもつ画素値に、ノイズ成分となる所定の値を増減する処理が行われる。このノイズ成分の付加処理の具体的な方法については、後にいくつかの例を述べる。こうして、ノイズ成分付加装置20からは、ノイズ成分を含んだ修正画像データC*,M*,Y*,K*が出力されることになる。
【0035】
最後に、セル彫刻装置30によって、グラビア印刷版であるC版31,M版32,Y版33,K版34が作成される。たとえば、C版31は、修正画像データC*を構成する各画素位置に、それぞれの画素値に応じた大きさのセルを打刻して形成することにより作成されることになる。
【0036】
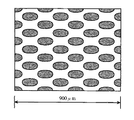
図7は、このようにして作成されたグラビア印刷版の一例を示す部分拡大図である。この例においても、元になる画像データは、網点密度60%の平網に相当する画像データである。従来の機械彫刻方式で作成された図1に示す版と比べると明らかなように、本発明の機械彫刻方式で作成された図7に示す版では、個々のセルの大きさが空間的に変動している。ここでは説明の便宜上、平網画像についての例を示したが、階調画像を用いた場合にも、個々のセルの大きさが空間的に変動するという同様の効果が得られることになる。本願発明者が行った階調画像についての実験によれば、本発明の方法を適用することにより、「立体感に富む」、「人間の肌の表現力に優れる」、「不快な筋が観察されにくい」といった腐食方式の特徴を再現することができ、機械彫刻方式で作成したグラビア印刷物であるにもかかわらず、腐食方式で作成したグラビア印刷物に近い画質を得ることができた。
【0037】
§3. ノイズ成分の付加処理
続いて、本発明の要点となるノイズ成分の付加処理の具体的な方法をいくつか述べておく。
【0038】
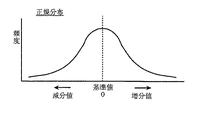
ノイズ成分を付加する最も単純な方法は、所定の分散範囲内の増分値および減分値をランダムに発生させ、個々の画素の画素値に対して、発生させた増分値を加えるかもしくは発生させた減分値を減じる修正を行う方法である。たとえば、図8に示すような所定の分散をもった正規分布を用いて、平均を示す中央位置に基準値0を定義し、この基準値より右側に増分値、左側に減分値をそれぞれ定義する。そして、コンピュータで乱数を発生させて、この正規分布に従った頻度で、増分値あるいは減分値をランダムに発生させ、個々の画素の画素値を増減させるのである。このような方法でノイズ成分を付加した修正画像に基づいて、セルの形成を行えば、セルの大きさの空間的な分布にランダムなノイズ成分が付加されることになる。
【0039】
しかしながら、上述のように、全くランダムに画素値を増減させる方法では、必ずしも十分な効果が期待できるとは限らない。たとえば、ある領域内の画素については、たまたま増分値による修正が集中して行われ、別な領域内の画素については、たまたま減分値による修正が集中して行われたような場合、領域ごとに濃度ムラが生じてしまうことになる。このような弊害を避けるためには、所定の空間周波数で増減するノイズ成分を用意して修正を行うようにするのが好ましい。たとえば、図9のグラフに示されているノイズ成分を考える。ここで、グラフの横軸は空間的広がりを示し、縦軸はノイズ成分の増分値あるいは減分値を示している。この例では、ノイズ成分は空間的に周期Lをもって増減している。別言すれば、ある領域では増分値を示していたら、その隣の領域では減分値を示すようになっている。このように、所定の空間周波数で増減を繰り返すノイズ成分を用いると、全くランダムに増減するノイズ成分を用いた場合に比べて、より十分な効果が期待できる。
【0040】
本願発明者は、特に、セルのピッチとほぼ同じ周期をもったノイズ成分を用いると、非常に効果的であることを見出だした。たとえば、図9に示すノイズ成分の周期Lが、セルのピッチとほぼ同じ程度であるとすると、1つのセルは基準値より大きくなり、これに隣接するセルは基準値より小さくなる。このように、交互に大小を繰り返すようなセル構成は、本発明の効果を得るために非常に有効である。本願発明者が行った実験によれば、付加するノイズ成分の空間周波数が低くなると、印刷物に再現される画像にいわゆるザラザラ感が見られるようになる。すなわち、用いるノイズ成分の空間周波数は、できるだけセル配置の空間周波数に近付けるようにするのが好ましく、これより空間周波数の低いノイズ成分を用いるほど、画質にザラザラ感が生じるようになる。これは、通常のグラビア印刷では、セルのピッチがたとえば(1/175)mmというように、肉眼で個々のセルを観察することが困難な値に設定されていることに関係していると考えられる。すなわち、ノイズ成分の空間周波数をセルの空間周波数と同程度にすると、ノイズ成分が肉眼では認識されることがなくなり、自然な画像を再現することができるが、ノイズ成分の空間周波数を低くすると、ノイズ成分が肉眼で認識されることになり、ザラザラ感が生じてくるものと思われる。
【0041】
§4. より効率的なノイズ成分の付加処理(その1)
本願発明者は、セルの空間周波数とほぼ同程度の空間周波数をもったノイズ成分を付加するための非常に効率的な手法を案出した。この手法を用いれば、乱数を用いることなく、しかも非常に単純な算術演算を用いてノイズ成分の付加処理が可能になる。以下、この手法の基本的なアルゴリズムを説明する。
【0042】
この手法の基本原理は、nビットで表現される画素値をもった画素の集合により原画像を用意し、個々の画素値を(n−k)ビットに間引く処理を行い、(n−k)ビットで表現される画素値をもった画素の集合により修正画像を作成する点にある。ここでは、8ビットで表現される画素値をもった画素の集合により原画像を用意し、個々の画素値を5ビットに間引く処理を行い、5ビットで表現される画素値をもった画素の集合により修正画像を作成する例を示そう。8ビットの原画像における画素値のレンジは、0〜255までの256段階である。これに対して、5ビットの修正画像における画素値のレンジは、0〜31までの32段階である。ここで、レンジを0〜255に共通化したとすると、8ビットの原画像の画素は、0〜255までの全レンジにわたった256とおりの値をとることができるのに対し、5ビットの修正画像の画素は、同じ0〜255までのレンジにわたった値であっても、0,8,16,24,32,40,48,56,64,72,80,88,…といった8つおきのとびとびの値しかとることはできない。
【0043】
これをより具体的に示すと図10のようになる。図10の上段には、8ビットで表現された画素値をもった原画像の画素の配列が示されており、下段には、5ビットで表現された画素値をもった修正画像の画素の配列が示されている。上段に示す原画像に対して間引き処理を施すと、下段に示す修正画像が得られることになる。原画像の画素の画素値は、5ビットで表現されるとびとびの画素値の中で、最も近い画素値に置換されることになる。たとえば、図10の一番左の画素のもつ画素値「41」は画素値「40」に置換されている。この置換処理は、もとの画素値「41」に減分値「1」なるノイズ成分を付加する処理とも考えることができる。このように、ビット数を減らす間引き処理は、個々の画素値をデジタルデータとして取り扱うコンピュータによっては、非常に効率的に実行可能な処理であり、膨大な数の画素についても比較的軽い演算負担で実行が可能である。しかも、乱数を用いていないにもかかわらず、比較的ランダムな増分値と減分値とが得られるというメリットがある。
【0044】
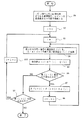
ここでは、修正画像を構成する画素値の平均が、原画像を構成する画素値の平均にほぼ等しくなるような工夫を、上述の基本手法に加えた実例を以下に示すことにする。図11は、この手法に基づくノイズ成分の付加処理の手順を示す流れ図である。まず、ステップS1において、j行i列の二次元画素配列からなる原画像を、nビットの画素値をもつ画素の集合として用意する。続いて、ステップS2において、パラメータjを初期値1にセットし、ステップS3において、パラメータiを初期値1にセットする。そして、ステップS4において、第j行目の第i番目の画素値P(i)を、(n−k)ビットの最も近い画素値Q(i)に変換する。これは上述した画素値の間引き処理に相当する。続くステップS5では、この間引き処理の前後における画素値の差を示す差分値d(i)が、d(i)=P(i)−Q(i)として演算される。
【0045】
次に、ステップS6において、第(i+1)番目の画素が存在するかが判断され、存在する場合には、ステップS7において、第(i+1)番目の画素の画素値P(i+1)が、P(i+1)+d(i)に更新される。これは、第i番目の画素に対する間引き処理で生じた差分値を、隣接する第(i+1)番目の画素に加えて補償し、間引き処理を行っても、全体的な画素値の平均値が変化しないようにするための措置である。
【0046】
以上の処理を、ステップS8を経て、パラメータiを更新しながら第j行目にある画素列について順次実行してゆく。こうして、ステップS6において、否定的な判断がなされると、その行についての処理は完了し、ステップS9からステップS10を経て、行を示すパラメータjが更新され、次の行についても同様の処理が繰り返し行われる。こうして、ステップS9において、第(j+1)行目が存在しないと判断されると、全行についての処理が完了したことになる。最終的に、画素値Q(i)をもつ画像が修正画像ということになる。
【0047】
図12は、上述の手順を具体的な画素値を用い、n=8,k=3として実行した例を示す図である。図12(a) は、原画像を構成する画素配列の第j行目の各画素値(8ビットで表現されている)を示している。この例では、平網画像を想定しており、図示の第j行目の画素列はいずれも画素値「61」を有している。いま、パラメータi=1として、第1番目の画素値「61」に着目する。図11のステップS4では、この画素値「61」が、5ビットの最も近い画素値「64」に変換され、ステップS5では、差分値d(1)=61−64=−3が求まる。そして、ステップS7において、第2番目の画素値が、61−3=58なる演算で求まった新たな画素値「58」に更新される。図12(b) は、この時点での各画素の画素値を示すものであり、二重枠内の画素値は、すでに間引き処理が完了した5ビットで表現された画素値を示している。
【0048】
次に、パラメータi=2として、第2番目の画素値「58」に着目する。ステップS4では、この画素値「58」が、5ビットの最も近い画素値「56」に変換され、ステップS5では、差分値d(2)=58−56=+2が求まる。そして、ステップS7において、第3番目の画素値が、61+2=63なる演算で求まった新たな画素値「63」に更新される。図12(c) は、この時点での各画素の画素値を示すものである。
【0049】
続いて、パラメータi=3として、第3番目の画素値「63」に着目する。ステップS4では、この画素値「63」が、5ビットの最も近い画素値「64」に変換され、ステップS5では、差分値d(3)=63−64=−1が求まる。そして、ステップS7において、第4番目の画素値が、61−1=60なる演算で求まった新たな画素値「60」に更新される。図12(d) は、この時点での各画素の画素値を示すものである。
【0050】
更に、パラメータi=4として、第4番目の画素値「60」に着目する。ステップS4では、この画素値「60」が、5ビットの最も近い画素値「56」に変換され(画素値「64」でもよい)、ステップS5では、差分値d(4)=60−56=+4が求まる。そして、ステップS7において、第5番目の画素値が、61+4=65なる演算で求まった新たな画素値「65」に更新される。図12(e) は、この時点での各画素の画素値を示すものである。
【0051】
このような処理を繰り返してゆけば、原画像を構成していた8ビットの画素値は、すべて5ビットの画素値に間引かれることになるが差分値が隣接画素へと繰り越されてゆくため、画素値の平均はほぼ同じになる。そして、前述したように、個々の画素についての差分値が、ノイズ成分と同じ機能を果たすことになる。実際、図12に示す例では、もとの原画像が図12(a) に示すような平網画像であるにもかかわらず、図12(e) に示すように、修正画像としては、画素値「64」と「56」とが交互に出現する結果となっており、画素ピッチ(セルピッチ)と同じ空間周波数をもったノイズ成分が付加された画像が得られている。すなわち、印刷物上には、個々のセルの大きさの空間的分布に、セルのピッチと同程度の空間周波数を有するノイズ成分が付加された画像が表現されることになる。一般の階調画像について、この手法を適用した場合にも、本質的には同じ効果が得られ、この階調画像の印刷物上の所定の微小領域内を観察すると、平均的な大きさを有する標準セルを基準として、この標準セルよりも大きなセルとこの標準セルよりも小さなセルとが、空間的にほぼ交互に配置されている状態が実現できる。
【0052】
この間引き処理を利用してノイズ成分を付加する手法では、最終的に印刷物上に得られるセルの大きさは32段階に凝縮され、セルの大きさはとびとびになり、いわゆる量子化が進むことになる。このようなセルの大きさの量子化は、一見したところ「腐食方式の画質に近付ける」という本発明の目的に逆行する処理のようにも考えられるが、本願発明者が実際に実験を行ったところ、本発明の所期の目的を達成する上で十分な効果が見られた。これは、おそらく、肉眼で観察不能な微小なセルについては、256段階の画素値に基づいて256通りの大きさをもったセルを使い分けたところで、視覚的には無意味であるという理由によるものと考えられる。すなわち、画素値「61」に対応する大きさのセルと、画素値「62」に対応する大きさのセルとの相違は、肉眼では何ら識別することはできないが、画素値「56」に対応する大きさのセルと画素値「64」に対応する大きさのセルとを交互に配置した場合には、視覚的に画質に関連した何らかの認識が行われるものと考えられる。
【0053】
以上、nビットで表現される画素値を(n−k)ビットに間引く処理を行うことによりノイズ成分を付加する手法を説明したが、この原理に基づくノイズ成分の付加処理は、必ずしもビット数を間引く方法に限定されるものではない。一般論としては、n階調で表現される画素値を(n−k)階調に間引く処理を行うことができれば、ノイズ成分を付加することが可能である。ビットを間引く方法では、処理後の画素値は、たとえば、32,64,96,…といった2のべき乗の倍数値に限定されることになるが、n階調で表現される画素値を(n−k)階調に間引く一般的な方法を採れば、より自由度の高い画素値を得ることが可能になる
§5. より効率的なノイズ成分の付加処理(その2)
ここでは、原画像に対してノイズ成分を付加するための別な手法を提案する。いま、図13(a) に示されているように、M行N列の画素配列として原画像Pが用意されている場合を考える。この原画像Pを構成する個々の画素には所定の画素値が定義されている。ここでは、この原画像P上のm行n列目の画素の画素値をP(m,n)と表すことにする。このような原画像Pに対して、図13(b) に示すような修正用ノイズ画像Aを用意する。この修正用ノイズ画像Aは、原画像Pと同様に、M行N列の画素配列からなり、たとえば、m行n列目の画素には、画素値A(m,n)が定義されている。このような修正用ノイズ画像Aを用意することができれば、原画像P上の個々の画素のもつ画素値を、修正用ノイズ画像A上の対応位置にある画素のもつ画素値によって修正することにより、図13(c) に示すように、M行N列の画素配列からなる修正画像P*を得ることができる。この修正画像P*上のm行n列目の画素の画素値をP*(m,n)と表すことにすれば、この画素値P*(m,n)は、たとえば、
P*(m,n)=P(m,n)+A(m,n)
なる式で求めることができる。もちろん、画素値P*(m,n)を定義するための式は、上式に限定されるものではなく、関数fを用いて、
P*(m,n)=f(P(m,n),A(m,n))
なる形式で表現される任意の一般式を用いればよい。
【0054】
このような手法により得られる修正画像P*の特性は、どのような修正用ノイズ画像Aを用いたかによって大きく左右される。本願発明者は、当初、この修正用ノイズ画像Aとして、最も典型的なホワイトノイズ画像を用いることを考えた。たとえば、図14に示すように、M行N列の画素配列を定義し、各画素の画素値として全くランダムな値を定義すれば(たとえば、各画素ごとに発生させた乱数を、そのまま画素値として採用すればよい)、ホワイトノイズ画像Wが得られる。このホワイトノイズ画像Wでは、m行n列目の画素の画素値W(m,n)は、他の画素の画素値とは全く無関係に定義されたノイズ値となる。このようなホワイトノイズ画像Wの画素値の空間的分布には、あらゆる空間周波数成分が含まれている。たとえば、図14において、第m行目に並んだ複数の画素のもつ画素値を一次元分布としてとらえ、画素値の空間的変動を示すグラフをフーリエ変換すると、画素の解像度に基づいて定まる理論的に可能な空間周波数の全範囲にわたって、ほぼ均一な空間周波数分布が得られる。
【0055】
しかしながら、このようなホワイトノイズ画像Wを、そのまま修正用ノイズ画像Aとして用いた場合、最終的に得られるグラビア印刷物には、いわゆるザラザラ感が見られ、必ずしも好ましい結果にはならない。既に述べたように、本発明で付加するノイズ成分の空間周波数は、できるだけセル配置の空間周波数に近付けるのが好ましい。本願発明者は、ホワイトノイズ画像Wに対して、所定の空間フィルタを用いたフィルタリング処理を行うことにより、セルの空間周波数に近い周波数成分をもったノイズ画像を生成できることに着目し、フィルタリング処理後のノイズ画像を修正用ノイズ画像Aとして用いることにより、本発明として好ましい結果が得られることを見出だした。
【0056】
たとえば、図14に示すM行N列の画素配列からなるホワイトノイズ画像Wに適用するために、図15に示すような3行3列の空間フィルタFを定義する。ここでは、この空間フィルタFの行をα=−1,0,1と表し、列をβ=−1,0,1と表すことにし、α行β列の位置に定義されたフィルタ値をφ(α,β)と表すことにする。このような空間フィルタFを、図16に示すように、ホワイトノイズ画像W上のm行n列目の画素に適用し、
A(m,n)=Σ(φ(α,β)・W(m+α,n+β))
(但し、Σはα=−1,0,1、β=−1,0,1についての総和)
なる演算で新たな画素値A(m,n)を求めるようにし、この新たな画素値A(m,n)をもった修正用ノイズ画像を、図13(b) に示す修正用ノイズ画像Aとして用いればよい。このようなフィルタリング処理後に得られる修正用ノイズ画像Aは、セルの空間周波数に近い周波数成分をもったノイズ画像になるため、この修正用ノイズ画像Aを用いて、原画像Pを修正画像P*に変換すれば、ザラザラ感のない自然な画質をもったグラビア印刷物を得ることができる。
【0057】
図17は、本願発明者が実際に用いた空間フィルタFのフィルタ値の具体例を示す図である。このような空間フィルタFを用いた場合、m行n列目の画素値A(m,n)は、

【0058】
なお、上述の演算を行う際、通常は、ホワイトノイズ画像Wを格納するための第1の画素配列と、修正用ノイズ画像Aを格納するための第2の画素配列とを用意し、第1の画素配列内の画素値W(i,j)を読出して参照しながら、上式の右辺の演算を行い、その結果として得られた画素値A(i,j)を第2の画素配列内へ書き込むという処理が行われる。
【0059】
§6. 本発明に係るグラビア印刷物
以上、本発明に係るグラビア印刷方法を述べてきたが、ここでは、このような印刷方法によって得られるグラビア印刷物の特徴を述べておく。図18および図19は、いずれも機械彫刻方式でセル形成が行われたグラビア印刷版を用意し、このグラビア印刷版を用いて印刷を行うことにより得られた印刷物の印刷面の部分拡大図である。いずれの図も、いわゆる平網部分(階調のない単一濃度の領域として表現された部分)を拡大したものであるが、図18は、従来の手法によって得られたグラビア印刷物を示し、図19は、本発明の手法によって得られたグラビア印刷物を示す。別言すれば、図18に示すグラビア印刷物は、図1に示すグラビア印刷版による印刷結果を示し、図19に示すグラビア印刷物は、図7に示すグラビア印刷版による印刷結果を示している。
【0060】
グラビア印刷版上の各セルの形状と比べて、グラビア印刷物上の各網点の形状は若干異なっているが、これは凹状のセル内に蓄積されたインキが紙面上に転写されて網点を形成する際のインキの物理的ふるまいに基づくものである。このように、個々のセルと個々の網点とは、形状は若干異なるものの、位置および大きさに関しては、互いに対応した関係にある。図18と図19とを比べると、網点のピッチは両者で同じであるが、個々の網点の大きさに関しては大きな相違がみられる。すなわち、図18に示す従来のグラビア印刷物では、個々の網点の大きさ(面積)がほぼ一定であるのに対し、図19に示す本発明のグラビア印刷物では、個々の網点の大きさの空間的分布に、網点のピッチの2〜3倍程度の周期をもったノイズ成分が付加されている。たとえば、一次元の空間的分布を調べるために、図19に示すように、任意の座標軸Zを定義し、この座標軸Z上に配置された網点の大きさの分布に着目すると、網点の配置ピッチの2〜3倍程度の周期で、網点の大きさが大きくなったり小さくなったり変化していることがわかる。すなわち、網点の大きさにランダム性が付加されていることになる。
【0061】
本願発明者は、セルのピッチの2〜5倍の周期をもったノイズ成分を用いると、効果的であることを見出だした。とくに、セルのピッチの2〜3倍の周期をもったノイズ成分を付加すると非常に効果的である。たとえば、図9に示すノイズ成分の周期Lが、セルのピッチの2倍程度であるとすると、1つのセルは基準値より大きくなり、これに隣接するセルは基準値より小さくなる。
【0062】
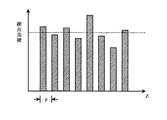
図20は、任意の座標軸Zを横軸にとったとき、この座標軸Z上に配置された網点の面積を示すグラフである。このグラフにおいて、Z軸上の距離pは、網点の配置ピッチを示しており、個々の棒グラフが個々の網点の面積を示している。いま、平均的な大きさを有する標準網点を定義し、この標準網点の面積を図の破線で示した値とすれば、図示のグラフのように、標準網点よりも大きな網点と標準網点よりも小さな網点とが、空間的にほぼ交互に配置されていることがわかる(厳密に交互になるとは限らないが、標準網点よりも大きい網点が現れたら、近々小さな網点が現れる、というように、ほぼ網点の配置ピッチに等しい周期で大きくなったり小さくなったりしている)。
【0063】
もともと平網部分は、階調表現を行う必要のない領域であるため、原理的には同一の大きさの網点を配置すれば十分であり、わざわざ網点の大きさにランダム性を付加する必要はない、と考えられていた。したがって、原画像上の平網部分は、いずれも同一の画素値をもった画素の集合によって構成されている。しかしながら、本願発明者は、このような平網部分においても、網点の大きさにランダム性をもたせることにより、機械彫刻方式を採りつつ、疑似的に腐食方式のグラビア印刷物に近い画質をもった印刷物を実現することができることに気が付いたのである。上述した本発明に係る手法により、ノイズ成分の付加を行えば、原画像上では同一の画素値をもった画素の集合によって構成されていた平網部分も、修正画像上では、個々の画素ごとに画素値にランダム性が付加されることになる。したがって、グラビア印刷物上では、平網部分であるにもかかわらず、ランダムな大きさの網点が形成されることになる。このように、平網部分の網点の大きさがランダム性を有するというグラビア印刷物は、機械彫刻方式の版を用いて印刷されたグラビア印刷物に関する限り、現時点で公知ではない。
【0064】
もっとも、網点の大きさがランダム性を有するという本発明の特徴は、平網画像だけでなく、一般の階調画像においても意味を有する。景色や人物など、一般的なカラー写真に基づく原画像では、個々の画素の画素値は、当然ながら部分部分によって異なっている。しかしながら、機械彫刻方式の版を用いて印刷された従来のグラビア印刷物では、階調画像に関しても、所定の微小領域内を観察する限り、ほぼ等しい画素値をもった画素の集合によって構成されている。たとえば、図18に示す例のように、横幅900μmほどの微小領域内を拡大鏡で観察すると、平網画像であっても、階調画像であっても、隣接配置された網点の大きさはほぼ同じであることがわかる。景色や人物などのモチーフを示す階調画像であっても、グラビア印刷物上に表現する以上、「肉眼で観察したときに当該モチーフが認識できる」という前提が必要になる。このため、階調画像であっても、図18に示すような微小領域を観察する限り、網点の大きさはほぼ等しくなる。もちろん、階調画像の場合、画像全体をマクロ的に観察すれば、ある部分は大きな網点が集まっており、別なある部分は小さな網点が集まっている。ただ、このグラビア印刷物を通常の態様で観察した際に、肉眼ではモチーフの一部を構成する領域としては識別することができない微小領域を考え、このような微小領域内においてミクロ的に観察すれば、網点の大きさはほぼ一定になっている。
【0065】
これに対し、本発明に係るグラビア印刷物では、たとえば、図19に示す例のように、横幅900μmほどの微小領域内を拡大鏡で観察すると、平網画像であっても、階調画像であっても、隣接配置された網点の大きさに相違が生じている。この図19に示す例では、横幅900μmほどの微小領域内において、平均的な大きさを有する標準網点を定義したとすれば、標準網点よりも大きな網点と標準網点よりも小さな網点とが、空間的にほぼ交互に配置されていることがわかる。別言すれば、通常の態様で観察した際に肉眼では識別することができない微小領域内において、網点の大きさがランダム性を有していることになり、互いに隣接する任意の2つの網点に着目したときに、この2つの着目網点の大きさが相違しており、かつ、着目する網点ごとに、相違の態様がランダムになっている。もちろん、このランダム性によっては、肉眼では、画像としての濃淡分布を認識することはできない。すなわち、グラビア印刷物上に、図19に示すようなランダムな大きさをもった網点の集合が形成されていたとしても、このグラビア印刷物を通常の態様でマクロ的に観察した場合、この網点の大小分布は、そのまま画像の濃淡分布として認識されるわけではない。
【0066】
このように、本発明に係るグラビア印刷方法で得られる印刷物上には、平網画像であれ、階調画像であれ、ミクロ的な意味で、網点の大きさにランダム性が見られることになる。グラビア印刷物上の画像を構成する網点の大きさに、このようなミクロ的なランダム性を付加すると、画像から認識されるモチーフ自体は変わらないものの、その画質には影響が現れる。すなわち、ミクロ的なランダム性を付加することによって、「立体感に富む」、「人間の肌の表現力に優れる」といった腐食方式によるグラビア印刷物の画質を、機械彫刻方式によるグラビア印刷物において疑似的に表現することが可能になる。このように、肉眼では1つの領域としては識別することができない微小領域内において、網点の大きさがランダム性を有するグラビア印刷物は、機械的に彫刻してなる凹版を用いたグラビア印刷物としてはこれまでに存在しないものであり、そのような物理的構造を有するグラビア印刷物自体が新規なものである。
【0067】
最後に、網点の大きさがミクロ的な意味でランダム性を有するグラビア印刷物なるものが、グラビア印刷物としてはこれまでに存在し得なかった理由について考察しておく。既に述べたように、平網画像は、階調変化のない平網部分から構成される画像であり、当然ながら、ほぼ同一の大きさをもった網点の集合によって表現されるものであり、従来の機械彫刻方式によるグラビア印刷物では、網点の大きさにランダム性が生じる余地はない。一方、階調画像については、画像をグラビア印刷システムに取り込む場合、通常、景色や人物などの写真を、スキャナ装置などを利用して光学的に読み込むことにより、原画像となるデジタルデータを用意する処理が行われる。ところが、この光学的な読み込み段階では、もとの写真画像の高い空間周波数成分を除外する処理が行われる。
【0068】
図21は、この高い空間周波数成分の除外処理の概念を説明するための空間周波数特性を示すグラフである。このグラフの横軸は、画像の空間周波数fを示し、縦軸は、各周波数成分の振幅(0〜1の範囲に規格化)を示している。ここで、特性Aは、もとの写真画像の空間周波数特性を示し、特性Bは、スキャナ装置で入力した後のデジタルデータとしての原画像の空間周波数特性を示している。図示のとおり、特性Aに含まれていた周波数f=π以上の高周波成分(図にハッチングで示す部分)が、特性Bではカットされていることがわかる。ここで、周波数軸は画像のサンプリング周波数に基づいて正規化されており、f=2πがサンプリング周波数に対応する。別言すれば、特性Bでは、サンプリング定理を満たすように、画像のサンプリング周波数の1/2に相当する高周波部分がカットされていることになる。
【0069】
このように、スキャナ装置による画像の取り込み時において、図21にハッチングで示す高周波部分をカットするのは、印刷時に、モアレ縞が発生するのを抑えるためである。通常、このような高周波部分のカットは、スキャナ装置の光学系の設定によって行われる。すなわち、光学系のアパーチャー開口度の設定により、カットオフ周波数の値が定められる。実際には、モアレ縞などを抑えるため、サンプリング定理を満たすように、原画像の解像度を考慮してアパーチャー開口度が設定されることになる。結局、デジタルデータとして取り込まれた原画像の空間周波数特性は、図21の特性Bのようなものとなり、f>πなる高周波成分fは一切カットされていることになる。しかも、この特性Bはベッセル関数で近似されるように、なだらかな減衰特性を呈するため、f<πなる周波数成分fであっても、πに近い高い周波数成分の振幅は非常に小さくなる。
【0070】
このような理由から、従来の一般的な機械彫刻式のグラビア印刷方法で印刷されたグラビア印刷物には、f>πなる高周波成分fは含まれておらず、また、f<πなる周波数成分fであっても、πに近い高い周波数成分もわずかしか含まれていない。したがって、従来のグラビア印刷物には、平網画像の部分はもちろん、階調画像の部分においても、網点の配置ピッチ程度のミクロ的な観点では、網点の大きさにランダム性が見られることはない。
【0071】
本発明に係るグラビア印刷方法は、スキャナ装置によって光学的な取り込みを行う際に除外(カットもしくは低減)された高い空間周波数f(ただし、f≦π)を有するノイズ成分を、デジタルデータの段階で付加することを目的とするものであり、原画像から修正画像を得る処理は、図21の特性Bで示される空間周波数特性を有する原画像を、特性Aで示される空間周波数特性をもった画像に近付ける処理と言うことができる。このような高い空間周波数を有するノイズ成分は、肉眼ではモチーフとして直接認識することはできないが、「立体感に富む」、「人間の肌の表現力に優れる」といった腐食方式によるグラビア印刷に近い画質を与える効果を有している。このように、光学的な取り込み時に失われた高い空間周波数成分をもったグラビア印刷物は、機械彫刻方式のグラビア印刷物としては、これまでに存在しない新規な印刷物である。
【0072】
以上、本発明を図示する実施形態に基づいて説明したが、本発明はこの他にも種々の形態で実施可能である。特に、ノイズ成分を付加する手法は、上述の実施形態で述べた手法に限定されるものではなく、この他にも種々の方法を採ることが可能である。
【0073】
また、上述した実施形態では、彫刻針(ダイヤモンド針)を用いた打刻により版胴面に多数のセルを形成して凹版を作成する機械彫刻方式を例にとった説明を行ってきたが、本発明に係るグラビア印刷方法は、必ずしも機械彫刻方式による凹版作成を前提とするものではない。本発明の基本的な技術思想は、物理的方法によりセル形成を行うグラビア印刷であるにもかかわらず、化学的方法によりセル形成を行うグラビア印刷に近い画質を得る点にある。したがって、本発明におけるセルの形成方法は、機械彫刻方式に限定されるものではなく、物理的な方法によりセルを形成することができれば、どのような方法を採ってもかまわない。本発明は、たとえば、レーザを用いてセルを彫刻するグラビア印刷方法にも適用可能であり、いわゆる電子彫刻方式によってセルを形成するグラビア印刷方法に広く適用可能である。
【0074】
【発明の効果】
以上のとおり本発明に係るグラビア印刷方法によれば、原画像にノイズ成分を付加してセル形成を行うようにしたため、物理的な彫刻方式を採りつつ、疑似的に化学的な腐食方式のグラビア印刷物に近い画質をもった印刷物を得ることが可能になる。
【図面の簡単な説明】
【図1】機械彫刻方式の工程で作成されたグラビア印刷版の部分拡大図である。
【図2】腐食方式の工程で作成されたグラビア印刷版の部分拡大図である。
【図3】機械彫刻方式で作成された版と、腐食方式で作成された版とについて、セルの大きさ分布を比較するためのグラフである。
【図4】平網画像からなる原画像と、これにノイズ成分を付加した修正画像と、についての画素値の空間分布を示すグラフである。
【図5】階調画像からなる原画像と、これにノイズ成分を付加した修正画像と、についての画素値の空間分布を示すグラフである。
【図6】本発明に係るグラビア印刷方法を実施するためのシステム構成例を示すブロック図である。
【図7】本発明に係るグラビア印刷方法で作成されたグラビア印刷版の一例を示す部分拡大図である。
【図8】本発明に係るグラビア印刷方法に用いられる正規分布のノイズ成分を示すグラフである。
【図9】本発明に係るグラビア印刷方法に用いられる所定の空間周波数をもったノイズ成分を示すグラフである。
【図10】本発明に係るグラビア印刷方法で利用される画素値の間引き処理の概念を説明するための図である。
【図11】本発明の一手法に基づくノイズ成分の付加処理の手順を示す流れ図である。
【図12】図11に示す手順を具体的な画素列について実施した場合の画素値の変遷を示す図である。
【図13】本発明の別な手法に基づくノイズ成分の付加処理の基本原理を示す図である。
【図14】図13(b) に示す修正用ノイズ画像Aを生成するために用いるホワイトノイズ画像Wを示す図である。
【図15】図14に示すホワイトノイズ画像Wに適用するための空間フィルタFの一例を示す図である。
【図16】図14に示すホワイトノイズ画像Wに、図15に示す空間フィルタFを適用した状態を示す図である。
【図17】図15に示す空間フィルタFに対して、具体的な数値を定義した例を示す図である。
【図18】図1に示す従来の機械彫刻方式のグラビア印刷版を用いて印刷されたグラビア印刷物の部分拡大図である。
【図19】図7に示す本発明に係る機械彫刻方式のグラビア印刷版を用いて印刷されたグラビア印刷物の部分拡大図である。
【図20】本発明に係るグラビア印刷物における網点面積の分布を示すグラフである。
【図21】スキャナ装置による光学的な画像取り込み時に、画像のもつ空間周波数成分がカットされる状態を説明するグラフである。
【符号の説明】
10…グラビア印刷用画像データ生成装置
20…ノイズ成分付加装置
30…セル彫刻装置
31〜34…グラビア印刷版
A…修正用ノイズ画像
A(m,n)…修正用ノイズ画像を構成する画素の画素値
C,M,Y,K…原画像データ
C*,M*,Y*,K*…修正画像データ
F…空間フィルタ
L…ノイズ成分の周期
P…原画像
P(m,n)…原画像を構成する画素の画素値
P*…修正画像
P*(m,n)…修正画像を構成する画素の画素値
W…ホワイトノイズ画像
W(m,n)…ホワイトノイズ画像を構成する画素の画素値[0001]
BACKGROUND OF THE INVENTION
The present invention relates to a gravure printing method and a gravure print, and in particular, using a so-called electronic engraving method for engraving a large number of cells on a plate cylinder surface by driving an engraving needle (diamond needle) or a laser based on an electric signal. The present invention relates to a technique for producing a gravure print by forming an intaglio and printing using the intaglio.
[0002]
[Prior art]
Gravure printing is a printing technique using an intaglio and is mainly used for producing high-quality printed materials including photographic images. A large number of concave cells are formed on the plate used for gravure printing, and the ink filled in the cells is transferred to the paper surface. Therefore, in the gravure printed material, an image is formed by a large number of cellular inks (halftone dots). In other words, an image formed on the paper surface by gravure printing is composed of a large number of halftone dots arranged vertically and horizontally at a predetermined pitch, and light and shade are expressed by the ink amount of each halftone dot. .
[0003]
When performing gravure printing, an original image composed of a large number of pixels is prepared, and pixel values (density values) of pixels on the original image are converted into cell sizes, thereby converting one pixel into one cell. The intaglio expressed in is created. Pixels with large pixel values are converted into large cells, and pixels with small pixel values are converted into small cells. The size of the cell is reflected in the amount of ink on the paper surface, and a light and shade pattern corresponding to the density distribution of the original image is reproduced on the paper surface.
[0004]
As a method for forming an intaglio for gravure printing, a physical engraving method and a chemical corrosion method are generally known. The physical engraving method is a method of forming a cell by a physical method, and usually the cell is engraved by driving an engraving needle (diamond needle) or laser based on an electric signal. It is also called a method. The most common method for physical engraving is a method using an engraving needle called a mechanical engraving method. The mechanical engraving method is a method in which each cell is physically engraved one by one with diamond needles. Usually, the plate surface is scanned with a plurality of diamond needles while being engraved. Become. By controlling the distance between the diamond needle and the printing plate at the time of stamping, the size of the cell formed by stamping can be adjusted. A plate corresponding to the original image can be created by controlling the scanning process and the stamping process by the cell engraving device based on the pixel arrangement and the pixel value of each pixel on the original image.
[0005]
On the other hand, the chemical corrosion method is generally called “net gravure method”, and a large number of cells are collectively formed on the plate surface by chemical treatment using a corrosive solution. Usually, based on the information of each pixel on the original image, a cell array image is output on a halftone dot film, and a plate is created by a photolithography process using this halftone dot film. That is, the image on the halftone dot film is baked on the resist layer formed on the plate surface, and through the development process and the etching process, the area inside the cell is removed by corrosion to form a recess.
[0006]
[Problems to be solved by the invention]
As described above, as a method for forming an intaglio for gravure printing, two methods are known, but recently, a physical method represented by a mechanical engraving method is becoming mainstream. Since the corrosion method involves chemical treatment, the corrosion state varies depending on the temperature of the etching solution and the degree of fatigue, and it is difficult to ensure reproducibility. In addition, even on the same plate surface, there is a possibility that a difference in corrosion rate occurs in the portions due to the flow of the etching solution, and the size of the formed cells may be uneven for each portion. Therefore, in order to create a plate by the corrosion method, it is necessary for a skilled engineer to proceed with work while making full use of original know-how. On the other hand, the mechanical engraving method has improved the performance of the electronic cell engraving apparatus, and has been able to ensure reproducibility relatively easily. Moreover, the corrosion method has also been pointed out as a problem of environmental pollution due to chemical treatment, and in particular, in most European countries, most gravure printing is performed by a mechanical engraving method.
[0007]
However, many designers and photographers still support the image quality of corrosive gravure prints. Of course, it is not appropriate to compare and evaluate the image quality of the gravure print by the mechanical engraving method and the image quality of the gravure print by the corrosion method on an objective scale. The difference between the two is merely a matter of subjective preference, and the evaluation often depends on the sensitivity of the viewer. However, according to such subjective evaluations, corrosion-type gravure prints are more “three-dimensional”, “excellent in human skin expression”, and “uncomfortable” than machine-gravure prints. It is said that it has the advantage that “muscles are difficult to observe”. Also, in a gravure print by a mechanical engraving method, when the pixel value exceeds a predetermined threshold value, ink between adjacent cells is combined, and a phenomenon called tone jump in which the density value suddenly increases occurs, degrading the image quality. It is also known.
[0008]
Accordingly, an object of the present invention is to realize a gravure printed material having an image quality close to that of a gravure printed material of a pseudo-chemical corrosion method while adopting a physical engraving method represented by a mechanical engraving method.
[0009]
[Means for Solving the Problems]
(1) A first aspect of the present invention is a gravure printing method in which an intaglio is created by engraving a plurality of cells arranged at a predetermined pitch, and printing is performed using the intaglio.
Preparing an original image composed of an array of pixels each having a predetermined pixel value;
Creating a modified image by adding a noise component to the pixel values of the individual pixels constituting the original image;
Creating an intaglio by engraving a cell having a size corresponding to the pixel value of each pixel constituting the corrected image;
Printing with this intaglio,
To create a modified image,
A white noise image having a pixel array corresponding to the pixel array of the original image, in which a random noise value is defined for each pixel,
By performing a filtering process using a predetermined spatial filter on the white noise image, a correction noise image in which a noise value having a predetermined spatial frequency is defined for each pixel is generated.
A corrected image is created by correcting the pixel value of each pixel of the original image with the pixel value of the corresponding pixel of the noise image for correction.
[0012]
(2) Of the present inventionSecondAspects of the aboveFirstIn the gravure printing method according to the aspect of
Pixel pitchNoise component with a period of 2-5 timesA noise image for correction includingIt is what I did.
[0016]
(3) Of the present inventionThirdAspects of the above1st or 2ndThe gravure printed matter is manufactured using the gravure printing method according to the embodiment.
[0017]
(Four) Of the present invention4thIn the gravure printed matter in which the image is represented by a plurality of halftone dots arranged at a predetermined pitch,
A noise component having a period of 2 to 5 times the halftone dot pitch is added to the spatial distribution of the size of each halftone dot.
[0018]
(Five) Of the present invention5thAspects of the above4thIn the gravure printed matter according to the aspect of
When a standard halftone dot having an average size is defined within a predetermined minute area, halftone dots larger than the standard halftone dot and halftone dots smaller than the standard halftone dot are arranged almost alternately in space. It is made to be done.
[0025]
DETAILED DESCRIPTION OF THE INVENTION
§1. Cell difference between mechanical engraving and corrosion
Hereinafter, the present invention will be described based on the illustrated embodiments. First, the difference in cell configuration between a general mechanical engraving type gravure print and a corrosion type (net gravure type) gravure print will be described. FIG. 1 is a partially enlarged view of a gravure printing plate produced by a mechanical engraving process, and FIG. 2 is a partially enlarged view of a gravure printing plate produced by a corrosion process. In both cases, the original image data is image data corresponding to a flat net having a dot density of 60%, and the area of a cell (a hatched area in the figure) is approximately 60% of the whole. The illustrated horizontal width is about 900 μm, and the presence of individual cells cannot usually be recognized when observed with the naked eye. However, when this is observed in an enlarged manner, it can be seen that there is a large difference in the shape and distribution of the cells in the plates created by both methods.
[0026]
As shown in FIG. 1, cells having the same shape and size are regularly arranged at the same pitch on a plate created by a mechanical engraving method. This is because the printing is regularly performed while scanning the plate surface with a plurality of diamond needles as described above. Therefore, as in the example shown here, in the case of a flat mesh image, cells having the same shape and the same area are regularly arranged. The phenomenon of tone jump described above is a phenomenon caused by such a regular arrangement of cells. In other words, when the dot density value exceeds a certain threshold, the area of each cell exceeds the critical value, and the ink between adjacent dots on the printed matter is connected to each other, and the dot boundary line is lost. As a result, the concentration value increases rapidly.
[0027]
On the other hand, as shown in FIG. 2, cells having different shapes and sizes are arranged on the plate made by the corrosion method, even though the original image is a flat mesh. Each cell has a variety of shapes, and the size is very small to very large. However, this is because corrosion is performed based on a synthetic pattern obtained by synthesizing a so-called “white line pattern” with a normal cell pattern. When the pattern shown in FIG. 2 is carefully observed, a white line pattern (a grid-like pattern that divides cells) overlaps with a cell pattern (pattern shown by hatching) arranged at a predetermined pitch. Can be recognized. In general, the pitch of the lattice forming the white line pattern is set smaller than the pitch at which the cells are arranged, and each cell is divided in various ways by the white line pattern. Even in the example shown in FIG. 2, traces of cells divided into four, three or two can be recognized in some places. Since the division mode by the white line pattern is various, the individual cells after the division have various shapes and sizes.
[0028]
After all, when creating a plate by the corrosion method, the original image pattern itself prepared on the halftone dot film is a composite pattern of the cell pattern and white line pattern arranged at a predetermined pitch, and the shape is also large. It is also composed of a number of different cells. In addition, in the actual corrosion process, the temperature, fatigue level, flow rate, etc. of the corrosive liquid vary from part to part, so the shape and size of the individual cells formed on the plate are subject to fluctuations from part to part. An element will be added. After all, the individual cells on the plate made by the corrosion method have various shapes and sizes due to the synergistic effect of the fluctuation element based on the division pattern by the white line pattern and the fluctuation element based on the conditions during the corrosion process. Become a thing.
[0029]
In this way, since a plate made by the corrosion method has cells of various shapes and sizes, the phenomenon of tone jump does not occur on the gravure printed material using this plate. FIGS. 1 and 2 show an example in which the original image is a flat screen image. However, when the original image is a gradation image, it may be considered that a difference in image quality occurs for the same reason. In other words, the advantage of the corrosion method expressed in terms of “rich in 3D”, “excellent human skin expression”, and “uncomfortable muscles are difficult to observe” is the shape and size of the cell. It can be considered that the fluctuation elements (the fluctuation of the division by the white line pattern and the fluctuation of the corrosion condition) are added.
[0030]
§2. Basic concept of the present invention
An object of the present invention is to realize a printed material having an image quality close to that of a gravure printed material of a pseudo chemical corrosion method while adopting a physical engraving method that is easy to work and has no problem of environmental pollution. For this purpose, the above-described fluctuation element may be added in a pseudo manner. The basic concept of the present invention is to prepare an original image composed of an array of pixels having a predetermined pixel value, and add a noise component to the pixel value of each pixel constituting the original image, thereby causing fluctuation elements. The machine engraving method is created by creating a gravure printing plate by mechanically engraving cells with a size corresponding to the pixel value of each pixel constituting the corrected image. The purpose is to create a pseudo printed material having an image quality close to that of a corrosion-type gravure printed material.
[0031]
Now, in order to compare the cell size distribution between the plate made by the mechanical engraving method shown in FIG. 1 and the plate made by the corrosion method shown in FIG. 2, a graph as shown in FIG. 3 is considered. Try. In this graph, the horizontal axis represents the spatial spread, and the vertical axis represents the cell size. Here, the broken line in the graph shows the cell size distribution for the plate of the flat screen image created by the mechanical engraving method, and the solid line of the graph shows the plate size of the plate image created by the corrosion method. The cell size distribution is shown. As shown in the figure, in the case of the mechanical engraving method, the cell size is spatially constant, whereas in the case of the corrosion method, the cell size fluctuates randomly in space.
[0032]
The size of each cell imprinted by the diamond needle is determined according to the pixel value of the corresponding pixel. Therefore, if a corrected image is created by adding a noise component to the pixel values of each pixel constituting the original image, the size of the cell varies spatially on the plate created based on the corrected image. Will result. For example, the graph shown in FIG. 4 shows the spatial distribution of pixel values for an original image composed of a flat mesh image and a modified image with a noise component added thereto. Here, the pixel value is an amount corresponding to the size of the cell, and the size of the cell on the plate created based on the corrected image is also spatially varied. When the original image is a gradation image, the pixel values in the original original image also vary spatially as shown in the graph of FIG. 5 (this example is a graph of a monotone gradation image). The pixel value of the corrected image to which the noise component has been added shows a finer variation.
[0033]
FIG. 6 is a block diagram showing a system configuration example for carrying out the gravure printing method according to the present invention. First, the gravure image
[0034]
Subsequently, the noise
[0035]
Finally, the
[0036]
FIG. 7 is a partially enlarged view showing an example of the gravure printing plate prepared as described above. Also in this example, the original image data is image data corresponding to a flat screen having a dot density of 60%. As is clear from the plate shown in FIG. 1 made by the conventional machine engraving method, the size of each cell varies spatially in the plate shown in FIG. 7 made by the machine engraving method of the present invention. is doing. Here, for convenience of explanation, an example of a flat mesh image is shown, but the same effect that the size of each cell fluctuates spatially can be obtained even when a gradation image is used. According to the experiment on the gradation image performed by the inventor of the present application, by applying the method of the present invention, “highly three-dimensional”, “excellent human skin expression”, “unpleasant muscles are observed It was able to reproduce the characteristics of the corrosion method such as “hard to be done”, and even though it was a gravure print made by a mechanical engraving method, it was possible to obtain an image quality close to that of a gravure print made by a corrosion method.
[0037]
§3. Noise component addition processing
Subsequently, some specific methods of noise component addition processing, which are the main points of the present invention, will be described.
[0038]
The simplest way to add a noise component is to randomly generate increment and decrement values within a given dispersion range, and add or generate the generated increment values to the pixel values of individual pixels. This is a method of correcting to decrease the decrement value. For example, using a normal distribution having a predetermined variance as shown in FIG. 8, a
[0039]
However, as described above, it is not always possible to expect a sufficient effect in the method of increasing or decreasing the pixel value at random. For example, if a pixel in one region happens to be intensively corrected by an increment value, and a pixel in another region happens to be intensively corrected by a decrement value, As a result, density unevenness occurs. In order to avoid such adverse effects, it is preferable to prepare and correct noise components that increase or decrease at a predetermined spatial frequency. For example, consider the noise component shown in the graph of FIG. Here, the horizontal axis of the graph indicates the spatial spread, and the vertical axis indicates the increment value or decrement value of the noise component. In this example, the noise component increases or decreases spatially with a period L. In other words, if an area shows an increment value, an adjacent area shows a decrement value. As described above, when a noise component that repeatedly increases and decreases at a predetermined spatial frequency is used, a more sufficient effect can be expected than when a noise component that increases and decreases at random is used.
[0040]
The inventor of the present application has found that it is very effective particularly when a noise component having substantially the same period as the cell pitch is used. For example, if the period L of the noise component shown in FIG. 9 is approximately the same as the cell pitch, one cell is larger than the reference value, and a cell adjacent thereto is smaller than the reference value. Thus, a cell configuration in which the size is alternately repeated is very effective for obtaining the effects of the present invention. According to the experiment conducted by the present inventor, when the spatial frequency of the noise component to be added is lowered, a so-called rough feeling can be seen in the image reproduced on the printed matter. That is, it is preferable that the spatial frequency of the noise component to be used is as close as possible to the spatial frequency of the cell arrangement, and the more the noise component having a lower spatial frequency is used, the more rough the image quality becomes. This is considered to be related to the fact that in normal gravure printing, the cell pitch is set to a value that makes it difficult to observe individual cells with the naked eye, for example, (1/175) mm. It is done. That is, if the spatial frequency of the noise component is set to the same level as the spatial frequency of the cell, the noise component will not be recognized by the naked eye and a natural image can be reproduced, but if the spatial frequency of the noise component is lowered, The noise component will be recognized with the naked eye, and it seems that a rough feeling is produced.
[0041]
§4. More efficient noise component addition (part 1)
The inventor of the present application has devised a very efficient technique for adding a noise component having a spatial frequency substantially equal to the spatial frequency of the cell. If this method is used, it becomes possible to add a noise component without using a random number and using a very simple arithmetic operation. Hereinafter, a basic algorithm of this method will be described.
[0042]
The basic principle of this method is that an original image is prepared by a set of pixels having pixel values represented by n bits, and each pixel value is thinned out to (n−k) bits, and (n−k) The modified image is created by a set of pixels having pixel values represented by bits. Here, an original image is prepared by a set of pixels having pixel values represented by 8 bits, and individual pixel values are thinned out to 5 bits, and pixels having pixel values represented by 5 bits are processed. Let's show an example of creating a modified image by a set. The range of pixel values in an 8-bit original image is 256 levels from 0 to 255. On the other hand, the range of pixel values in a 5-bit modified image is 32 levels from 0 to 31. Here, if the range is shared between 0 and 255, the 8-bit original image pixel can take 256 values over the entire range from 0 to 255, whereas the 5-bit pixel has 5 bits. Even if the pixels of the corrected image have values in the same range from 0 to 255, there are eight pixels such as 0, 8, 16, 24, 32, 40, 48, 56, 64, 72, 80, 88,. You can only take the value of every jump.
[0043]
This is shown more specifically in FIG. The upper part of FIG. 10 shows an array of pixels of the original image having pixel values expressed in 8 bits, and the lower part shows the pixels of the corrected image having pixel values expressed in 5 bits. The sequence is shown. When the thinning process is performed on the original image shown in the upper stage, the corrected image shown in the lower stage is obtained. The pixel value of the pixel of the original image is replaced with the closest pixel value among the discrete pixel values expressed by 5 bits. For example, the pixel value “41” of the leftmost pixel in FIG. 10 is replaced with the pixel value “40”. This replacement process can also be considered as a process of adding a noise component having a decrement value “1” to the original pixel value “41”. As described above, the thinning process for reducing the number of bits is a process that can be executed very efficiently depending on a computer that handles individual pixel values as digital data. Execution is possible. Moreover, there is an advantage that a relatively random increment value and decrement value can be obtained even though no random number is used.
[0044]
Here, an example in which an idea that the average of the pixel values constituting the corrected image is approximately equal to the average of the pixel values constituting the original image is added to the above-described basic method will be shown below. FIG. 11 is a flowchart showing the procedure of noise component addition processing based on this method. First, in step S1, an original image composed of a two-dimensional pixel array of j rows and i columns is prepared as a set of pixels having n-bit pixel values. Subsequently, in step S2, the parameter j is set to the
[0045]
Next, in step S6, it is determined whether or not the (i + 1) th pixel exists, and if it exists, in step S7, the pixel value P (i + 1) of the (i + 1) th pixel is set to P ( i + 1) + d (i). This is because the difference value generated by the thinning process for the i-th pixel is compensated in addition to the adjacent (i + 1) -th pixel, and the average value of the overall pixel values changes even if the thinning process is performed. It is a measure to prevent it.
[0046]
The above processing is sequentially executed for the pixel column in the j-th row while updating the parameter i through step S8. Thus, if a negative determination is made in step S6, the process for that line is completed, the parameter j indicating the line is updated through steps S9 to S10, and the same process is performed for the next line. Repeatedly. Thus, if it is determined in step S9 that the (j + 1) th row does not exist, the processing for all the rows is completed. Eventually, an image having a pixel value Q (i) is a corrected image.
[0047]
FIG. 12 is a diagram illustrating an example in which the above procedure is executed using specific pixel values and n = 8 and k = 3. FIG. 12A shows each pixel value (represented by 8 bits) in the jth row of the pixel array constituting the original image. In this example, a flat mesh image is assumed, and the pixel column in the j-th row shown in the figure has a pixel value “61”. Now, paying attention to the first pixel value “61” with the parameter i = 1. In step S4 of FIG. 11, this pixel value “61” is converted to the nearest 5-bit pixel value “64”, and in step S5, a difference value d (1) = 61−64 = −3 is obtained. In step S7, the second pixel value is updated to a new pixel value “58” obtained by the
[0048]
Next, attention is focused on the second pixel value “58” with the parameter i = 2. In step S4, this pixel value “58” is converted to the nearest 5-bit pixel value “56”, and in step S5, a difference value d (2) = 58−56 = + 2 is obtained. In step S7, the third pixel value is updated to a new pixel value “63” obtained by the calculation of 61 + 2 = 63. FIG. 12C shows the pixel value of each pixel at this point.
[0049]
Subsequently, focusing on the third pixel value “63” with the parameter i = 3. In step S4, the pixel value “63” is converted to the nearest 5-bit pixel value “64”, and in step S5, the difference value d (3) = 63−64 = −1 is obtained. In step S7, the fourth pixel value is updated to a new pixel value “60” obtained by the calculation of 61-1 = 60. FIG. 12 (d) shows the pixel value of each pixel at this point.
[0050]
Further, attention is paid to the fourth pixel value “60” with the parameter i = 4. In step S4, this pixel value “60” is converted to the nearest 5-bit pixel value “56” (may be a pixel value “64”). In step S5, the difference value d (4) = 60−56 = +4 is obtained. In step S7, the fifth pixel value is updated to a new pixel value “65” obtained by the calculation of 61 + 4 = 65. FIG. 12 (e) shows the pixel value of each pixel at this point.
[0051]
If such processing is repeated, all the 8-bit pixel values constituting the original image are thinned out to 5-bit pixel values, but the difference values are carried forward to adjacent pixels. The average of the pixel values is almost the same. As described above, the difference value for each pixel performs the same function as the noise component. Actually, in the example shown in FIG. 12, although the original original image is a flat mesh image as shown in FIG. 12 (a), as shown in FIG. The values “64” and “56” appear alternately, and an image to which a noise component having the same spatial frequency as the pixel pitch (cell pitch) is added is obtained. That is, an image in which a noise component having a spatial frequency comparable to the cell pitch is added to the spatial distribution of the size of each cell is represented on the printed matter. Even when this method is applied to a general gradation image, essentially the same effect can be obtained, and when the inside of a predetermined minute area on the printed matter of the gradation image is observed, it has an average size. With reference to the standard cell, it is possible to realize a state in which cells larger than the standard cell and cells smaller than the standard cell are arranged almost alternately in space.
[0052]
In the method of adding a noise component using this thinning process, the cell size finally obtained on the printed matter is condensed into 32 stages, the cell size becomes discrete, and so-called quantization proceeds. Become. Such quantization of the cell size may seem to be a process that goes against the object of the present invention, “approaching the image quality of the corrosion method” at first glance, but the present inventor actually conducted an experiment. However, a sufficient effect was achieved in achieving the intended object of the present invention. This is probably because, for minute cells that cannot be observed with the naked eye, cells that have 256 different sizes based on 256 levels of pixel values are visually insignificant. it is conceivable that. That is, the difference between the cell having the size corresponding to the pixel value “61” and the cell having the size corresponding to the pixel value “62” cannot be identified with the naked eye, but corresponds to the pixel value “56”. When cells having a size corresponding to the pixel value and cells having a size corresponding to the pixel value “64” are alternately arranged, it is considered that some recognition relating to the image quality is visually performed.
[0053]
As described above, the method of adding the noise component by performing the process of thinning the pixel value represented by n bits into (n−k) bits has been described. However, the noise component adding process based on this principle does not necessarily require the number of bits. It is not limited to the thinning method. As a general theory, it is possible to add a noise component if a process of thinning out pixel values expressed by n gradations to (n−k) gradations can be performed. In the method of thinning out bits, the pixel value after processing is limited to a power of 2 such as 32, 64, 96,..., But the pixel value expressed by n gradations is (n -K) If a general method of thinning out gradations is adopted, it becomes possible to obtain a pixel value with a higher degree of freedom.
§5. More efficient noise component addition processing (part 2)
Here, another method for adding a noise component to the original image is proposed. Consider the case where the original image P is prepared as a pixel array of M rows and N columns as shown in FIG. A predetermined pixel value is defined for each pixel constituting the original image P. Here, the pixel value of the pixel in the m-th row and the n-th column on the original image P is represented as P (m, n). For such an original image P, a correction noise image A as shown in FIG. 13B is prepared. Like the original image P, the noise image for correction A has a pixel array of M rows and N columns. For example, a pixel value A (m, n) is defined for a pixel in the m row and the n column. . If such a correction noise image A can be prepared, the pixel value of each pixel on the original image P is corrected by the pixel value of the pixel at the corresponding position on the correction noise image A. As shown in FIG. 13 (c), a modified image P having a pixel array of M rows and N columns.*Can be obtained. This modified image P*The pixel value of the pixel in the upper m row and n column is P*If expressed as (m, n), this pixel value P*(M, n) is, for example,
P*(M, n) = P (m, n) + A (m, n)
It can be calculated by the following formula. Of course, the pixel value P*The formula for defining (m, n) is not limited to the above formula, but using the function f,
P*(M, n) = f (P (m, n), A (m, n))
Any general formula expressed in the form may be used.
[0054]
Modified image P obtained by such a method*This characteristic greatly depends on what correction noise image A is used. The inventor of the present application initially considered using the most typical white noise image as the noise image A for correction. For example, as shown in FIG. 14, if a pixel array of M rows and N columns is defined, and a completely random value is defined as the pixel value of each pixel (for example, a random number generated for each pixel is used as it is as a pixel value. White noise image W is obtained. In the white noise image W, the pixel value W (m, n) of the pixel in the m-th row and the n-th column is a noise value defined completely independent of the pixel values of other pixels. Such a spatial distribution of the pixel values of the white noise image W includes all spatial frequency components. For example, in FIG. 14, when the pixel values of a plurality of pixels arranged in the m-th row are regarded as a one-dimensional distribution and a graph showing the spatial variation of the pixel values is subjected to Fourier transform, the theoretical value determined based on the pixel resolution. An almost uniform spatial frequency distribution is obtained over the entire range of possible spatial frequencies.
[0055]
However, when such a white noise image W is used as it is as the noise image A for correction, the gravure printed material finally obtained has a so-called rough feeling and is not necessarily a preferable result. As already described, it is preferable that the spatial frequency of the noise component added in the present invention is as close as possible to the spatial frequency of the cell arrangement. The inventor of the present application pays attention to the fact that a noise image having a frequency component close to the spatial frequency of the cell can be generated by performing a filtering process using a predetermined spatial filter on the white noise image W. It was found that a favorable result can be obtained as the present invention by using the above noise image as the noise image A for correction.
[0056]
For example, in order to apply to the white noise image W having the pixel arrangement of M rows and N columns shown in FIG. 14, a spatial filter F of 3 rows and 3 columns as shown in FIG. 15 is defined. Here, the row of this spatial filter F is represented as α = -1, 0, 1, the column is represented as β = -1, 0, 1, and the filter value defined at the position of α row β column is represented by φ. It will be expressed as (α, β). Such a spatial filter F is applied to the pixel in the m-th row and the n-th column on the white noise image W as shown in FIG.
A (m, n) = Σ (φ (α, β) · W (m + α, n + β))
(Where Σ is the sum of α = -1, 0, 1, β = -1, 0, 1)
A new pixel value A (m, n) is obtained by the following calculation, and a correction noise image having the new pixel value A (m, n) is obtained as a correction noise image A shown in FIG. May be used. Since the correction noise image A obtained after such filtering processing is a noise image having a frequency component close to the spatial frequency of the cell, the original image P is converted into the correction image P using the correction noise image A.*If converted to, a gravure printed material having a natural image quality without a rough feeling can be obtained.
[0057]
FIG. 17 is a diagram showing a specific example of the filter value of the spatial filter F actually used by the inventor of the present application. When such a spatial filter F is used, the pixel value A (m, n) in the m-th row and the n-th column is
[0058]
When performing the above-described calculation, a first pixel array for storing the white noise image W and a second pixel array for storing the correction noise image A are usually prepared. The pixel value W (i, j) in the pixel array is read and referenced, and the calculation of the right side of the above equation is performed, and the resulting pixel value A (i, j) is stored in the second pixel array. The process of writing to is performed.
[0059]
§6. Gravure print according to the present invention
The gravure printing method according to the present invention has been described above. Here, the characteristics of the gravure printed matter obtained by such a printing method will be described. FIG. 18 and FIG. 19 are partial enlarged views of the printing surface of a printed matter obtained by preparing a gravure printing plate in which cells are formed by a mechanical engraving method and performing printing using this gravure printing plate. is there. Each figure is an enlarged view of a so-called flat mesh portion (portion expressed as a single density region having no gradation). FIG. 18 shows a gravure print obtained by a conventional method. 19 shows a gravure print obtained by the method of the present invention. In other words, the gravure printed material shown in FIG. 18 shows the printing result by the gravure printing plate shown in FIG. 1, and the gravure printed material shown in FIG. 19 shows the printing result by the gravure printing plate shown in FIG.
[0060]
Compared to the shape of each cell on the gravure printing plate, the shape of each halftone dot on the gravure print is slightly different, but this is because the ink accumulated in the concave cell is transferred onto the paper surface to remove the halftone dot. This is based on the physical behavior of the ink when it is formed. As described above, although the individual cells and the individual halftone dots have slightly different shapes, the positions and sizes are in a corresponding relationship with each other. Comparing FIG. 18 and FIG. 19, the pitch of halftone dots is the same in both cases, but there is a great difference regarding the size of each halftone dot. That is, in the conventional gravure print shown in FIG. 18, the size (area) of each halftone dot is substantially constant, whereas in the gravure print of the present invention shown in FIG. A noise component having a period of about 2 to 3 times the halftone dot pitch is added to the spatial distribution. For example, in order to examine a one-dimensional spatial distribution, as shown in FIG. 19, an arbitrary coordinate axis Z is defined, and attention is paid to the distribution of the size of halftone dots arranged on the coordinate axis Z. It can be seen that the size of the halftone dots increases or decreases with a period of about 2 to 3 times the arrangement pitch. That is, randomness is added to the size of the halftone dots.
[0061]
The inventor of the present application has found that it is effective to use a noise component having a period of 2 to 5 times the cell pitch. In particular, it is very effective to add a noise component having a period of 2 to 3 times the cell pitch. For example, if the period L of the noise component shown in FIG. 9 is about twice the cell pitch, one cell is larger than the reference value, and the adjacent cell is smaller than the reference value.
[0062]
FIG. 20 is a graph showing the area of halftone dots arranged on the coordinate axis Z when an arbitrary coordinate axis Z is taken on the horizontal axis. In this graph, the distance p on the Z axis indicates the arrangement pitch of halftone dots, and each bar graph indicates the area of each halftone dot. If a standard halftone dot having an average size is defined and the area of the standard halftone dot is a value indicated by a broken line in the figure, a halftone dot larger than the standard halftone dot is obtained as shown in the graph. It can be seen that the halftone dots smaller than the standard halftone dot are almost alternately arranged spatially (not necessarily exactly, but if a halftone dot larger than the standard halftone dot appears, it will soon be smaller. (The dots appear to increase or decrease with a period substantially equal to the arrangement pitch of the halftone dots, such as dots appearing).
[0063]
Originally, the flat halftone area is an area that does not require gradation expression, so in principle it is sufficient to arrange halftone dots of the same size, and it adds randomness to the size of halftone dots. It was thought that there was no need. Accordingly, the flat portion on the original image is composed of a set of pixels having the same pixel value. However, the present inventor has an image quality close to that of a pseudo-corrosion gravure print while adopting a mechanical engraving method by giving randomness to the size of halftone dots even in such a flat mesh portion. I realized that I could realize the printed matter. If a noise component is added by the above-described method according to the present invention, a flat mesh portion constituted by a set of pixels having the same pixel value on the original image is also displayed for each individual pixel on the corrected image. Thus, randomness is added to the pixel value. Therefore, on the gravure printed matter, halftone dots having a random size are formed even though it is a flat halftone portion. As described above, the gravure printed material in which the size of the halftone dots in the flat mesh portion is random is not known at this time as far as it relates to the gravure printed material printed using the mechanical engraving type plate.
[0064]
However, the feature of the present invention that the size of halftone dots has randomness is significant not only in flat halftone images but also in general gradation images. In an original image based on a general color photograph such as a landscape or a person, the pixel value of each pixel naturally differs depending on a partial portion. However, in a conventional gravure print printed using a mechanical engraving plate, a gradation image is also composed of a set of pixels having substantially the same pixel value as long as the inside of a predetermined minute region is observed. . For example, as in the example shown in FIG. 18, when a microscopic area having a width of about 900 μm is observed with a magnifying glass, the size of halftone dots arranged adjacent to each other regardless of whether it is a flat halftone image or a gradation image. Are almost the same. Even if it is a gradation image showing a motif such as a landscape or a person, it is necessary to assume that the motif can be recognized when observed with the naked eye as long as it is expressed on a gravure print. For this reason, even in the case of a gradation image, as long as a minute region as shown in FIG. Of course, in the case of a gradation image, if the entire image is observed macroscopically, a large halftone dot is gathered in one part and a small halftone dot is gathered in another part. However, when this gravure printed material is observed in a normal manner, a minute region that cannot be identified as a region constituting a part of the motif with the naked eye is considered, and if such a minute region is observed microscopically, The size of the halftone dot is almost constant.
[0065]
On the other hand, in the gravure printed material according to the present invention, for example, as shown in FIG. 19, when a minute region having a width of about 900 μm is observed with a magnifying glass, even a flat screen image is a grayscale image. However, there is a difference in the size of halftone dots arranged adjacent to each other. In the example shown in FIG. 19, if a standard halftone dot having an average size is defined in a minute region having a width of about 900 μm, a halftone dot larger than the standard halftone dot and a halftone dot smaller than the standard halftone dot are defined. It can be seen that the dots are arranged almost alternately in space. In other words, in a minute region that cannot be identified with the naked eye when observed in a normal manner, the size of the halftone dots has randomness, and any two adjacent meshes are adjacent to each other. When attention is paid to the points, the sizes of the two focused halftone dots are different, and the mode of difference is random for each focused halftone dot. Of course, depending on the randomness, it is impossible for the naked eye to recognize the light and shade distribution as an image. That is, even if a set of halftone dots having random sizes as shown in FIG. 19 is formed on the gravure printed material, when the gravure printed material is macroscopically observed in a normal mode, The size distribution of is not directly recognized as the light and shade distribution of the image.
[0066]
Thus, on the printed matter obtained by the gravure printing method according to the present invention, randomness is seen in the size of halftone dots in a microscopic sense, whether it is a flat halftone image or a gradation image. Become. When such micro randomness is added to the size of the halftone dots constituting the image on the gravure printed matter, the motif recognized from the image is not changed, but the image quality is affected. In other words, by adding microscopic randomness, the image quality of gravure prints by corrosion methods such as “rich in three-dimensionality” and “excellent in the expressiveness of human skin” can be simulated in gravure prints by mechanical engraving method. It becomes possible to express. In this way, a gravure printed material having halftone dot randomness within a minute region that cannot be identified as one region with the naked eye is a gravure printed material that uses a mechanically engraved intaglio. A gravure printed material having such a physical structure, which has never existed before, is novel.
[0067]
Finally, the reason why a gravure print having a random dot size in a microscopic sense has never existed as a gravure print until now will be considered. As already described, a flat halftone image is an image composed of a flat halftone portion having no gradation change, and is naturally represented by a set of halftone dots having almost the same size. In a gravure print by a conventional mechanical engraving method, there is no room for randomness in the size of halftone dots. On the other hand, for a gradation image, when capturing an image into a gravure printing system, usually, digital data as an original image is prepared by optically reading a photograph such as a landscape or a person using a scanner device or the like. Processing is performed. However, in this optical reading stage, processing for excluding high spatial frequency components of the original photographic image is performed.
[0068]
FIG. 21 is a graph showing the spatial frequency characteristics for explaining the concept of this high spatial frequency component exclusion process. The horizontal axis of this graph represents the spatial frequency f of the image, and the vertical axis represents the amplitude of each frequency component (normalized to a range of 0 to 1). Here, the characteristic A indicates the spatial frequency characteristic of the original photographic image, and the characteristic B indicates the spatial frequency characteristic of the original image as digital data after being input by the scanner device. As shown in the figure, it can be seen that a high frequency component (a portion indicated by hatching in the figure) having a frequency f = π or more included in the characteristic A is cut in the characteristic B. Here, the frequency axis is normalized based on the sampling frequency of the image, and f = 2π corresponds to the sampling frequency. In other words, in the characteristic B, a high frequency portion corresponding to 1/2 of the sampling frequency of the image is cut so as to satisfy the sampling theorem.
[0069]
As described above, when the image is captured by the scanner device, the high-frequency portion indicated by hatching in FIG. 21 is cut in order to suppress the occurrence of moire fringes during printing. Usually, such cutting of the high-frequency portion is performed by setting the optical system of the scanner device. That is, the value of the cut-off frequency is determined by setting the aperture opening degree of the optical system. Actually, in order to suppress moire fringes and the like, the aperture opening degree is set in consideration of the resolution of the original image so as to satisfy the sampling theorem. Eventually, the spatial frequency characteristic of the original image captured as digital data is as shown by characteristic B in FIG. 21, and the high-frequency component f satisfying f> π is completely cut off. In addition, since the characteristic B exhibits a gentle attenuation characteristic as approximated by a Bessel function, even if the frequency component f is f <π, the amplitude of a high frequency component close to π is very small.
[0070]
For this reason, the gravure printed matter printed by the conventional general mechanical engraving gravure printing method does not include the high frequency component f satisfying f> π, and the frequency component f satisfying f <π. Even so, only a few high frequency components close to π are included. Therefore, in conventional gravure prints, randomness is seen in the size of halftone dots, not only in flat halftone image portions but also in gradation image portions, from a microscopic viewpoint such as the arrangement pitch of halftone dots. There is no.
[0071]
In the gravure printing method according to the present invention, a noise component having a high spatial frequency f (where f ≦ π) that is excluded (cut or reduced) when performing optical capture by a scanner device is obtained at the stage of digital data. The processing for obtaining a corrected image from the original image is to add the original image having the spatial frequency characteristic indicated by the characteristic B in FIG. 21 to the image having the spatial frequency characteristic indicated by the characteristic A. It can be said that it is a process approaching. Such noise components with a high spatial frequency cannot be directly recognized as a motif by the naked eye, but the image quality is close to gravure printing by a corrosion method such as “rich in three-dimensionality” and “excellent in expressing human skin”. Has the effect of giving As described above, the gravure printed material having a high spatial frequency component lost at the time of optical capture is a novel printed material that has not existed as a gravure printed material of the mechanical engraving method.
[0072]
As mentioned above, although this invention was demonstrated based on embodiment shown in figure, this invention can be implemented with a various form besides this. In particular, the method of adding a noise component is not limited to the method described in the above embodiment, and various other methods can be employed.
[0073]
In the above-described embodiment, the mechanical engraving method has been described as an example in which a large number of cells are formed on the plate cylinder surface by engraving using an engraving needle (diamond needle) to create an intaglio. The gravure printing method according to the present invention is not necessarily based on intaglio making by a mechanical engraving method. The basic technical idea of the present invention is to obtain an image quality close to that of gravure printing in which a cell is formed by a chemical method, even though it is gravure printing in which a cell is formed by a physical method. Therefore, the cell formation method in the present invention is not limited to the mechanical engraving method, and any method may be adopted as long as the cell can be formed by a physical method. The present invention can be applied to, for example, a gravure printing method for engraving a cell using a laser, and can be widely applied to a gravure printing method for forming a cell by a so-called electronic engraving method.
[0074]
【The invention's effect】
As described above, according to the gravure printing method according to the present invention, since a cell is formed by adding a noise component to the original image, a pseudo chemical corrosion gravure is adopted while adopting a physical engraving method. It becomes possible to obtain a printed material having an image quality close to that of the printed material.
[Brief description of the drawings]
FIG. 1 is a partially enlarged view of a gravure printing plate created by a mechanical engraving process.
FIG. 2 is a partially enlarged view of a gravure printing plate created by a corrosion method process.
FIG. 3 is a graph for comparing cell size distributions for a plate created by a mechanical engraving method and a plate created by a corrosion method.
FIG. 4 is a graph showing the spatial distribution of pixel values for an original image composed of a flat mesh image and a modified image with a noise component added thereto.
FIG. 5 is a graph showing a spatial distribution of pixel values for an original image composed of gradation images and a modified image with a noise component added thereto.
FIG. 6 is a block diagram showing a system configuration example for carrying out a gravure printing method according to the present invention.
FIG. 7 is a partially enlarged view showing an example of a gravure printing plate created by the gravure printing method according to the present invention.
FIG. 8 is a graph showing a noise component of a normal distribution used in the gravure printing method according to the present invention.
FIG. 9 is a graph showing noise components having a predetermined spatial frequency used in the gravure printing method according to the present invention.
FIG. 10 is a diagram for explaining the concept of pixel value thinning processing used in the gravure printing method according to the present invention;
FIG. 11 is a flowchart showing a procedure of noise component addition processing based on one method of the present invention;
12 is a diagram showing transition of pixel values when the procedure shown in FIG. 11 is performed for a specific pixel column. FIG.
FIG. 13 is a diagram showing the basic principle of noise component addition processing based on another method of the present invention.
14 is a diagram showing a white noise image W used to generate the correction noise image A shown in FIG. 13 (b).
FIG. 15 is a diagram illustrating an example of a spatial filter F for application to the white noise image W illustrated in FIG.
16 is a diagram showing a state in which the spatial filter F shown in FIG. 15 is applied to the white noise image W shown in FIG.
17 is a diagram showing an example in which specific numerical values are defined for the spatial filter F shown in FIG.
FIG. 18 is a partially enlarged view of a gravure printed matter printed using the conventional mechanical engraving gravure printing plate shown in FIG. 1;
19 is a partially enlarged view of a gravure printed matter printed using the machine engraving-type gravure printing plate according to the present invention shown in FIG.
FIG. 20 is a graph showing a distribution of halftone dot areas in a gravure print according to the present invention.
FIG. 21 is a graph illustrating a state in which a spatial frequency component of an image is cut when an optical image is captured by the scanner device.
[Explanation of symbols]
10. Image data generation device for gravure printing
20 ... Noise component adding device
30. Cell engraving device
31-34 ... Gravure printing plate
A ... Noise image for correction
A (m, n): Pixel values of pixels constituting the noise image for correction
C, M, Y, K ... Original image data
C*, M*, Y*, K*... corrected image data
F ... Spatial filter
L: Period of noise component
P ... Original image
P (m, n): Pixel values of pixels constituting the original image
P*... modified image
P*(M, n) ... Pixel values of pixels constituting the corrected image
W ... White noise image
W (m, n): Pixel values of pixels constituting the white noise image
Claims (5)
それぞれ所定の画素値を有する画素の配列によって構成される原画像を用意する段階と、
前記原画像を構成する個々の画素の画素値にノイズ成分を付加することにより修正画像を作成する段階と、
前記修正画像を構成する個々の画素の画素値に応じた大きさのセルを彫刻することにより凹版を作成する段階と、
この凹版を用いて印刷を行う段階と、
を有し、
前記修正画像を作成する段階において、
前記原画像の画素配列に対応した画素配列を有し、個々の画素にランダムなノイズ値が定義されたホワイトノイズ画像を用意し、
このホワイトノイズ画像に対して、所定の空間フィルタを用いたフィルタリング処理を行うことにより、個々の画素に所定の空間周波数をもったノイズ値が定義された修正用ノイズ画像を生成し、
前記原画像の個々の画素がもつ画素値を、前記修正用ノイズ画像の対応する画素がもつ画素値によって修正することにより、修正画像を作成することを特徴とするグラビア印刷方法。A gravure printing method for creating an intaglio by engraving a plurality of cells arranged at a predetermined pitch, and performing printing using the intaglio,
Preparing an original image composed of an array of pixels each having a predetermined pixel value;
Creating a modified image by adding a noise component to the pixel value of each pixel constituting the original image;
Creating an intaglio by engraving a cell having a size corresponding to the pixel value of each pixel constituting the modified image;
Printing with this intaglio,
Have
In the step of creating the modified image,
A white noise image having a pixel array corresponding to the pixel array of the original image, in which a random noise value is defined for each pixel, is prepared,
By performing a filtering process using a predetermined spatial filter on the white noise image, a correction noise image in which a noise value having a predetermined spatial frequency is defined for each pixel is generated.
A gravure printing method , wherein a corrected image is created by correcting pixel values of individual pixels of the original image with pixel values of corresponding pixels of the correction noise image .
画素ピッチの2〜5倍の周期をもったノイズ成分を含む修正用ノイズ画像を生成することを特徴とするグラビア印刷方法。 A gravure printing method, wherein a correction noise image including a noise component having a period of 2 to 5 times a pixel pitch is generated.
個々の網点の大きさの空間的分布に、網点のピッチの2〜5倍の周期をもったノイズ成分が付加されていることを特徴とするグラビア印刷物。 A gravure print, wherein a noise component having a period of 2 to 5 times the halftone dot pitch is added to the spatial distribution of the size of each halftone dot.
所定の微小領域内において、平均的な大きさを有する標準網点を定義したときに、前記標準網点よりも大きな網点と前記標準網点よりも小さな網点とが、空間的にほぼ交互に配置されていることを特徴とするグラビア印刷物。 When a standard halftone dot having an average size is defined in a predetermined minute area, a halftone dot larger than the standard halftone dot and a halftone dot smaller than the standard halftone dot are substantially alternately spatially. Gravure printed matter characterized by being arranged in.
Priority Applications (1)
| Application Number | Priority Date | Filing Date | Title |
|---|---|---|---|
| JP19183897A JP4040722B2 (en) | 1997-01-24 | 1997-07-02 | Gravure printing method and gravure printed matter |
Applications Claiming Priority (3)
| Application Number | Priority Date | Filing Date | Title |
|---|---|---|---|
| JP2586697 | 1997-01-24 | ||
| JP9-25866 | 1997-01-24 | ||
| JP19183897A JP4040722B2 (en) | 1997-01-24 | 1997-07-02 | Gravure printing method and gravure printed matter |
Publications (2)
| Publication Number | Publication Date |
|---|---|
| JPH10264350A JPH10264350A (en) | 1998-10-06 |
| JP4040722B2 true JP4040722B2 (en) | 2008-01-30 |
Family
ID=26363555
Family Applications (1)
| Application Number | Title | Priority Date | Filing Date |
|---|---|---|---|
| JP19183897A Expired - Fee Related JP4040722B2 (en) | 1997-01-24 | 1997-07-02 | Gravure printing method and gravure printed matter |
Country Status (1)
| Country | Link |
|---|---|
| JP (1) | JP4040722B2 (en) |
Families Citing this family (3)
| Publication number | Priority date | Publication date | Assignee | Title |
|---|---|---|---|---|
| JP4676595B2 (en) * | 2000-08-25 | 2011-04-27 | 大日本印刷株式会社 | Gravure plate engraving method and gravure printing plate |
| CN103395277A (en) * | 2013-07-31 | 2013-11-20 | 汕头市精工东捷制版有限公司 | Manufacturing method of high-definition laser direct carving gravure plate |
| CN104760403A (en) * | 2014-01-02 | 2015-07-08 | 黄山精工凹印制版有限公司 | Making method of printed circuit board roller |
-
1997
- 1997-07-02 JP JP19183897A patent/JP4040722B2/en not_active Expired - Fee Related
Also Published As
| Publication number | Publication date |
|---|---|
| JPH10264350A (en) | 1998-10-06 |
Similar Documents
| Publication | Publication Date | Title |
|---|---|---|
| DE602005005525T2 (en) | Relief plates, original plates of these relief plates and methods for producing these original plates and relief plates | |
| JP2003046777A (en) | Mask creation method, image processing apparatus, software program, and mask data | |
| US5489991A (en) | Method for generating digital halftone images | |
| US6335989B1 (en) | Halftone printing using donut filters | |
| US6025930A (en) | Multicell clustered mask with blue noise adjustments | |
| JP2003204433A (en) | Mesh point threshold value data forming method, mesh point image forming equipment and recording medium | |
| JP4720490B2 (en) | Dither matrix generation | |
| JP4040722B2 (en) | Gravure printing method and gravure printed matter | |
| JPH0785272A (en) | Frequency modulation halftone image and method of making | |
| JP3996240B2 (en) | Gravure printing method and gravure printed matter | |
| Jones | Evolution of halftoning technology in the United States patent literature | |
| JP4290681B2 (en) | Image processing apparatus, image processing method, image processing program, machine-readable recording medium recording image processing program, and printed matter | |
| JP3996241B2 (en) | Gravure printing method and gravure printed matter | |
| JP4040721B2 (en) | Gravure printing method and gravure printed matter | |
| JP2007116432A (en) | High quality halftone processing | |
| JP2004304543A (en) | Halftoning processing method and halftoning processing system | |
| JP2015115957A (en) | Binary periodic to multibit aperiodic halftone and resolution conversion | |
| JP4144040B2 (en) | Image processing device for gravure printing | |
| KR20110048473A (en) | How to create a random pattern | |
| JP2004320374A (en) | Image processing apparatus, image processing method, printing apparatus, printing method, and program | |
| EP0712235B1 (en) | Pixel pair grid halftoning for a hyperacuity printer | |
| JP2001290016A (en) | Diffraction grating pattern and manufacturing method thereof | |
| JP6651776B2 (en) | Image processing apparatus, image processing method, and program | |
| JP6006126B2 (en) | Image evaluation method and image evaluation apparatus | |
| Trager et al. | A GPU based implementation of Direct Multi-bit Search (DMS) screen algorithm |
Legal Events
| Date | Code | Title | Description |
|---|---|---|---|
| A621 | Written request for application examination |
Free format text: JAPANESE INTERMEDIATE CODE: A621 Effective date: 20040521 |
|
| A131 | Notification of reasons for refusal |
Free format text: JAPANESE INTERMEDIATE CODE: A131 Effective date: 20070731 |
|
| A521 | Request for written amendment filed |
Free format text: JAPANESE INTERMEDIATE CODE: A523 Effective date: 20071001 |
|
| TRDD | Decision of grant or rejection written | ||
| A01 | Written decision to grant a patent or to grant a registration (utility model) |
Free format text: JAPANESE INTERMEDIATE CODE: A01 Effective date: 20071106 |
|
| A61 | First payment of annual fees (during grant procedure) |
Free format text: JAPANESE INTERMEDIATE CODE: A61 Effective date: 20071108 |
|
| FPAY | Renewal fee payment (event date is renewal date of database) |
Free format text: PAYMENT UNTIL: 20101116 Year of fee payment: 3 |
|
| R150 | Certificate of patent or registration of utility model |
Free format text: JAPANESE INTERMEDIATE CODE: R150 |
|
| FPAY | Renewal fee payment (event date is renewal date of database) |
Free format text: PAYMENT UNTIL: 20101116 Year of fee payment: 3 |
|
| FPAY | Renewal fee payment (event date is renewal date of database) |
Free format text: PAYMENT UNTIL: 20111116 Year of fee payment: 4 |
|
| FPAY | Renewal fee payment (event date is renewal date of database) |
Free format text: PAYMENT UNTIL: 20121116 Year of fee payment: 5 |
|
| FPAY | Renewal fee payment (event date is renewal date of database) |
Free format text: PAYMENT UNTIL: 20131116 Year of fee payment: 6 |
|
| LAPS | Cancellation because of no payment of annual fees |