JP3746089B2 - Compressor performance deterioration diagnosis device - Google Patents
Compressor performance deterioration diagnosis device Download PDFInfo
- Publication number
- JP3746089B2 JP3746089B2 JP05431195A JP5431195A JP3746089B2 JP 3746089 B2 JP3746089 B2 JP 3746089B2 JP 05431195 A JP05431195 A JP 05431195A JP 5431195 A JP5431195 A JP 5431195A JP 3746089 B2 JP3746089 B2 JP 3746089B2
- Authority
- JP
- Japan
- Prior art keywords
- waveform
- vibration
- compressor
- dispersion
- processor
- Prior art date
- Legal status (The legal status is an assumption and is not a legal conclusion. Google has not performed a legal analysis and makes no representation as to the accuracy of the status listed.)
- Expired - Fee Related
Links
- 230000006866 deterioration Effects 0.000 title claims description 23
- 238000003745 diagnosis Methods 0.000 title claims description 13
- 239000006185 dispersion Substances 0.000 claims description 50
- 238000007906 compression Methods 0.000 claims description 43
- 238000012545 processing Methods 0.000 claims description 26
- 239000003507 refrigerant Substances 0.000 claims description 25
- 238000000034 method Methods 0.000 claims description 22
- 230000010354 integration Effects 0.000 claims description 18
- 239000012530 fluid Substances 0.000 claims description 15
- 238000012935 Averaging Methods 0.000 claims description 11
- 230000015556 catabolic process Effects 0.000 claims description 7
- 238000006731 degradation reaction Methods 0.000 claims description 7
- 238000009499 grossing Methods 0.000 claims description 6
- 238000011002 quantification Methods 0.000 claims description 4
- 230000006835 compression Effects 0.000 description 39
- 238000005057 refrigeration Methods 0.000 description 9
- 230000005856 abnormality Effects 0.000 description 7
- 238000010586 diagram Methods 0.000 description 7
- 238000004364 calculation method Methods 0.000 description 6
- 230000035939 shock Effects 0.000 description 6
- 239000011295 pitch Substances 0.000 description 5
- 238000001514 detection method Methods 0.000 description 4
- 238000010219 correlation analysis Methods 0.000 description 3
- 230000000737 periodic effect Effects 0.000 description 3
- 238000006243 chemical reaction Methods 0.000 description 2
- 238000001816 cooling Methods 0.000 description 2
- 230000005284 excitation Effects 0.000 description 2
- 238000007710 freezing Methods 0.000 description 2
- 230000008014 freezing Effects 0.000 description 2
- 239000002184 metal Substances 0.000 description 2
- 229910052751 metal Inorganic materials 0.000 description 2
- 230000002093 peripheral effect Effects 0.000 description 2
- 238000003825 pressing Methods 0.000 description 2
- 238000005352 clarification Methods 0.000 description 1
- 230000006378 damage Effects 0.000 description 1
- 230000007547 defect Effects 0.000 description 1
- 238000007599 discharging Methods 0.000 description 1
- 239000000428 dust Substances 0.000 description 1
- 230000000694 effects Effects 0.000 description 1
- 238000001914 filtration Methods 0.000 description 1
- 230000006870 function Effects 0.000 description 1
- 238000009413 insulation Methods 0.000 description 1
- 239000010687 lubricating oil Substances 0.000 description 1
- 238000005259 measurement Methods 0.000 description 1
- 150000002739 metals Chemical class 0.000 description 1
- 239000003921 oil Substances 0.000 description 1
- 238000005192 partition Methods 0.000 description 1
- 238000005070 sampling Methods 0.000 description 1
- 238000003466 welding Methods 0.000 description 1
Images


Landscapes
- Investigating Or Analyzing Materials By The Use Of Ultrasonic Waves (AREA)
- Applications Or Details Of Rotary Compressors (AREA)
Description
【0001】
【産業上の利用分野】
本発明は圧縮機の非破壊異常診断に係わり、特に圧縮機の圧縮性能の異常を振動により診断する方法及び、装置に関するものである。
【0002】
【従来の技術】
圧縮機として、例えば冷凍冷蔵装置に用いられるような冷媒を圧縮するものがある。この圧縮機は通常、冷凍システムにつながっており、低温低圧の冷媒ガスを吸い込み、圧縮機内で断熱圧縮され、高温高圧の冷媒ガスを排出することが基本的な機能である。
【0003】
しかしながら、圧縮機の圧縮要素部は金属で構成されており、金属同士の摺動部が多数存在している。このため、その摺動部は例えばゴミなどの異物が混入した場合、この異物が原因となり摺動部に傷が付き圧縮中の冷媒漏れから圧縮性能(例えば冷凍能力)の低下を引き起こしたり、この摺動部の傷が原因となり、摺動部品が摩耗し圧縮不良を引き起こしたりする。
【0004】
また、圧縮機の組立時のミスによりクリアランスが大きく組み立てられ、圧縮中の冷媒漏れから規定の圧縮性能が出力されないことがあった。
【0005】
このことからこれらの冷媒漏れによる圧縮性能の低下や圧縮不良を判断するため、圧縮機を冷凍システムから分離しカロリー計測装置で評価していた。
【0006】
しかし、これでは費用と時間がかかり、数をこなすことは現実的に不可能であった。また、冷凍冷蔵室内の温度を検知することが考えられるが、圧縮機の性能だけでなく冷媒ガス、熱交換器、断熱性能、温度検知方法等により原因がいろいろ考えられ、圧縮機の性能劣化を正しく診断できるものではなかった。
【0007】
このため、圧縮機の性能劣化度合を効率的に精度良く診断する方法が望まれていた。
【0008】
これらの要望に答えるため、例えば電流またはガス圧力等の電流値及び、圧力値を検出することにより、圧縮機が異常な運転をしていないかを判断する方法がある。
【0009】
また、圧縮機の内部の異常を早期に発見するため、圧縮機の外郭に伝達する振動、音、AE信号を検出して診断する方法が考案されている。
【0010】
例えば特開昭62−75095号公報、特開平2−205728号公報などが提案されており、特開昭62−75095号公報は圧縮機のシリンダ傷、ゴミかみ等の異常を検出するため、圧縮機から発生する騒音あるいは振動を検出し、波長方向に分割した区間毎の信号の積算変動量の最大値と最小値との比率から基準値と比較し異常の判定を行う方法がある。
【0011】
また、特開平2ー205728号公報は摺動部の傷、摩耗等の不良を検出するため、圧縮機から発生するAE信号を検出し、このAE信号を包絡線検波した信号に対し、1周期あたりに発生するあるしきい値をこえたAE信号の発生数や、回転同調成分の強度から基準値と比較し異常の判定を行う方法が考案されていた。
【0012】
【発明が解決しようとする課題】
しかしながら上記のような構成では、電流検知は圧縮機が圧縮不良を起こすぐらいの比較的強度の劣化を起こさないと判断できず、圧縮中のガス漏れ等による圧縮性能の微妙な変化を検出することはできない。
【0013】
また、ガス圧力検知も同様である。さらに、特開昭62−75095号公報の方法では圧縮機内に異物が混入する等の聴感でも異常が分かるものでしか判断できず、基本的に機械振動の変動を抽出しているため、圧縮機の圧縮性能については判断できないものである。
【0014】
また、特開平2−205728号公報のAE信号を用いた診断でも摺動部の損傷によるAE信号の特徴を定量化しているものであり、圧縮機の圧縮性能を診断することはできないという問題があった。
【0015】
本発明は上記問題点に鑑み、圧縮機の圧縮性能の劣化度合を効率的に精度良く診断できる圧縮機の性能劣化診断装置を提供することを目的としている。
【0016】
【課題を解決するための手段】
上記目的を達成するために本発明の圧縮機の性能劣化診断装置は、圧縮機において冷媒を圧縮する過程で発生する流体振動により加振され発生する振動波形を検出するセンサと、この振動波形を増幅する増幅器と、この増幅器から出力される信号を記録する波形記録装置と、この波形記録装置または増幅器から出力される信号のノイズ成分を除去するフィルタと、このフィルタから出力される信号をA/D変換するためのA/D変換器と、このA/D変換器から出力される信号の特徴を波形処理し、この波形処理値から性能劣化度合を判定する波形処理器と、これらの結果を表示する表示器と、これらの結果を記録する記録装置とで構成されており、波形処理器において圧縮機の圧縮過程で発生する流体振動の非定常成分を定量化することで性能劣化度合を判定するとともに、波形処理器で行われる流体振動の非定常成分の定量化処理において、入力された振動波形を周期毎に分割する手段と、この周期毎に分割した波形を加算平均処理する手段と、分割された波形とこの加算平均処理した波形との差の波形を算出する手段と、この差の自乗を算出する手段と、この各自乗した波形を加算平均処理し分散波形を求める手段と、この分散波形を積分し分散パワーを求める手段と、振動波形の自乗平均を行い振動パワーを求める手段と、この分散パワーとこの振動パワーとの比を算出し比分散値を求める手段とで、性能劣化度合を判定するものである。
【0018】
さらに、波形処理器に入力された振動波形を周期毎に分割する手段として、自己相関分析処理を用いて振動波形を周期毎に分割するものである。
【0019】
また、波形処理器における分散波形を積分する手段において、分散波形の平滑化処理を行った後、積分するものである。
【0020】
さらに、波形処理器で行われる分散波形を積分する手段において、圧縮機のバルブが開放している間を積分するものである。
【0021】
また、分散波形の積分範囲の決定手段において、圧縮機のバルブが開放している間の積分範囲を分散波形にしきい値を設け、その交点から求めるものである。
【0022】
【作用】
本発明は上記した構成によって、圧縮機の外殻に伝達する流体振動を加振源とする超音波領域までの振動波形がセンサにより検出され、この検出された信号は微少な信号のため、増幅器でこの信号が増幅される。次に、この信号を後でも処理できるように波形記録装置に記録される。フィルタでは、この波形記録装置または増幅器から出力される信号の圧縮機以外から発生しているノイズ成分を除去するため、低域の周波数成分と高域の周波数成分が除去される。このフィルタリングされた信号は、A/D変換器によりアナログ信号がデジタル信号に変換され、DSPを備えた波形処理器へ出力される。この波形処理器では入力された信号の流体振動の影響により発生した非定常振動が定量化される。さらに、この定量化数値に対応する圧縮性能(例えば冷凍能力)を表すデータベースから圧縮機の圧縮性能が判定される。これらの結果は表示器により画面上などに出力され性能劣化度合を確認することができる。また、この結果をハードディスク等の記録装置に保存されデータの蓄積が行われる。
【0023】
また、波形処理器において、入力された振動波形を周期毎に分割され、その分割された振動波形は加算平均処理される。次にこの平均波形に対し、各周期毎に分割された波形との差が求められ、次に各々の周期毎分割された波形毎に差の自乗した波形が算出される。さらに算出された波形は加算平均処理され、1周期の平均波形に対する各分割波形の分散波形の平均が算出される。続いてこの波形に対し積分が行われ、分散パワーが算出される。一方、入力された振動波形に対し、自乗平均が行われ振動パワーが求められる。最後にこの算出された振動パワーと分散パワーとの比が算出され、比分散値が求められる。これにより、圧縮機の圧縮性能と対応する流体振動の非定常成分の定量化が図られ、圧縮性能を精度良く判定することができる。
【0024】
さらに、この波形処理器に入力された振動波形を周期毎に分割するための周期ピッチを決定するため、自己相関分析計算が行われる。その結果、回転周期が相関分析波形のピークとなって現れ、ピークとピークの間が1周期のピッチを表しており、このピッチをもとに、振動波形は周期毎に分割される。これにより、分割による各波形の誤差がなくなり、正確な波形の分割を行うことができる。
【0025】
また、分散波形から分散パワーを算出する間で、分散波形が一端平滑化処理され、その後、積分し分散パワーが算出される。これにより、積分範囲の明確化とデータが簡略化され、計算スピードの向上とデータの取り扱いを容易にすることができる。
【0026】
さらに、分散波形を積分する際に、圧縮機のバルブが開放している間で積分されることにより、圧縮性能に対応する流体振動に関わる分散パワーが精度良く抽出でき、圧縮性能の劣化を精度良く診断できる。
【0027】
また、圧縮機のバルブが開放する範囲の決定において、しきい値と分散波形との交点からバルブの開放する範囲が決定される。これにより、バルブの開放する範囲が精度良く検出できる。
【0028】
【実施例】
ここで、冷蔵庫等に用いられる圧縮機を例にとり詳細に説明する。
【0029】
(実施例1)
以下本発明の一実施例の圧縮機の性能劣化診断装置について図面を参照しながら説明する。
【0030】
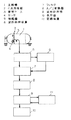
図1において、1はフロンガス等を圧縮する圧縮機で、2は圧縮要素を外殻である密閉ケース3に固定している4点溶接部である。4は振動波形を検出するセンサで、圧縮機の基本波から100KHzぐらいまでの振動成分を検出できるものである。センサ4は圧縮機1内部からの信号を最も強く伝達してくる箇所である4点溶接部2の1点に設置されている。5はセンサ4が検出した信号を増幅するものであり、6はこの信号を記録する波形記録装置である。7は波形記録装置6及び、増幅器5からの信号のノイズを除去するためのフィルタである。8はフィルタ7から出力される信号をA/D変換するA/D変換器である。9はA/D変換された信号から圧縮機1の圧縮過程における流体振動に起因する非定常成分を定量化するための波形処理と、この定量化数値と対応する性能劣化のデータベースから性能劣化度合を判定するDSP等を備えた波形処理器である。10はこの結果を画面上またはプリンター等へ出力表示させる表示器であり、これらの結果はハードディスク等の記録装置11に記録される。また、データベースもこの記録装置11に記録されている。
【0031】
ここで、圧縮機の構造と振動波形について説明する。
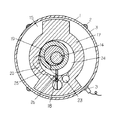
図2、3は圧縮機1の構造を表しており、密閉ケース3の内部に電動機12と圧縮要素13が配置されている。圧縮要素13は主に電動機12の回転運動を伝達するクランクシャフト14、クランクシャフト14を支持する主軸受15、副軸受16、シリンダ17、ローラ18、ベーン19、副軸受16の内部に収納されたバルブ20とから構成されている。圧縮要素13の各部品間の摺動には潤滑油21を潤滑させ摺動させている。22は吸入管で23は吐出管である。
【0032】
冷媒は、冷却システム(図示せず)から吸入管22を通り、シリンダ17の吸入ポート23からシリンダ17内の吸入室24に吸い込まれる。次にクランクシャフト14の回転運動によりローラ19がシリンダ17内で旋回運動を行うことにより、容積が縮小されて冷媒は断熱圧縮され高温高圧冷媒となる。
【0033】
ここで、ローラ19が旋回するときにベーン18がローラ19に追従し往復運動を行うため、シリンダ17内でベーン18が仕切となり吸入室24と圧縮室25が形成され、冷媒は効率良く圧縮される。
【0034】
高温高圧となった冷媒ガスはバルブ20を押し上げ吐出切り欠き26からマフラー27内に導かれる。その後、マフラー27の吐出穴(図示せず)から密閉ケース3の吐出空間28に放出され、吐出管23から冷却システムに導かれる。
【0035】
図4はセンサ4で計測された1回転の振動波形とシリンダ17内の圧縮要素13の1回転におけるメカ部品の挙動との関係について表している。メカ部品の挙動はア〜エの状態を1回転とし、冷媒の圧縮を繰り返している。
【0036】
アの状態は圧縮開始点の状態を表し、ベーン18がシリンダ17に最も引っ込んでいる状態である。この状態では低温低圧の冷媒が吸入室24に吸い込まれた状態である。
【0037】
この状態を回転角度0度とし、特に上死点と呼ぶ。この上死点の時に振動波形ではベーン18と他部品との衝突により大きな衝撃波が発生する。
【0038】
イの状態は180度回転が進んだ状態で、ベーン18がシリンダ17に最も突出した状態であり、下死点と呼ぶ。この状態になると吸入室24は容積が縮小されて、圧縮室25となり、新たに吸入室24’が形成される。また、振動波形ではベーン18が不安定な支持となり小さな衝撃波が発生する。
【0039】
ウの状態は回転が270度進んだ状態であり、圧縮室25のガス圧荷重がバルブ20の押さえつけ力よりもまして、バルブ20を押し上げて圧縮冷媒がシリンダ17外へ吐出される状態である。
【0040】
エの状態は1回転し圧縮が完了した状態を表している。振動波形ではこの270度を起点に上死点まで衝撃波が発生しており、ガス圧荷重が周辺の部品を支持側の部品に押さえつけられながら摺動していることから発生していると考えられる。また、冷媒は理論的には部品間のオイルシールによりシリンダ17内に密閉されている状態だが、1回転中に冷媒漏れが多少あることが現状である。
【0041】
特に、回転角度270度から上死点にかけて冷媒は高温高圧となるため、冷媒はバルブの開放に伴いシリンダ外へ放出されると共に冷媒の漏れは特に著しく圧縮室25外へ漏れていく。
【0042】
このため、振動波形の衝撃波の生成に大きく寄与している冷媒のガス圧荷重にこのガスの放出とガス漏れは大きく影響している。さらに、振動波形の衝撃波はマクロ的には周期的に見えるがミクロ部分ではこのガス圧荷重の変動により、回転毎に非定常な振動を繰り返している。
【0043】
また、この非定常成分は圧縮機の冷凍能力が大きいと大きく、冷凍能力が小さいと小さくなる傾向である。
【0044】
以上のように構成された一実施例における動作を説明する。
圧縮機1内部から発生した振動成分は機械部品内を伝達し、4点溶接部2に伝達する。4点溶接部2の1点に設置されたセンサ4によりこの伝達された振動は検出され、電圧信号等に変換される。
【0045】
この信号は増幅器5により増幅され、出力された信号は一端、波形記録装置6に記録され再生してフィルタ7に出力されるか、直接フィルタ7に出力される。
【0046】
フィルタ7に入力された信号は圧縮機1の振動を計測した条件等により外部から主に低域の周波数のノイズが混入することと、高域の周波数でA/D変換するときの折り返しノイズの発生が心配される。
【0047】
このことからフィルタ7ではこれらのノイズ成分の除去が行われ、A/D変換器8に出力される。
【0048】
例えば今回の場合、下限周波数300Hzと上限周波数100KHzに設定し、フィルタリングを行った。A/D変換器8では入力されたアナログ信号がデジタル信号に変換され波形処理器9に出力される。
【0049】
例えば今回の場合、300KHzのサンプリング周波数で行った。波形処理器9では上述した振動波形の非定常成分を定量化する等の波形処理演算がDSP等を用いて行われ、次にこれらの算出結果と圧縮性能の対応を表すデータベース(例えば今回の場合冷凍能力と波形処理値とのデータベース)から圧縮性能が判定される。判定された結果は表示部10に出力され確認することができる。
【0050】
また、記録装置11においてこれらの結果が保存され圧縮機毎のデータベースが構築される。以上のことから、圧縮機の性能劣化度合を振動で効率良く判定できる。
【0051】
(実施例2)
以下本発明の第2の実施例について図面を参照しながら説明する。
【0052】
実施例1に対し、圧縮機の性能劣化度合を精度良く判定するため、波形処理器9で行われる振動波形の非定常成分の定量化に関する波形処理手段について規定するものである。
【0053】
図5において、27で波形処理器9に振動波形が入力される。例えば今回の場合、20周期分の振動波形を入力した。入力された振動波形は28で1周期毎に分割され、29で20周期分の振動波形の加算平均波形が算出される。次に30で加算平均された振動波形に対し、28で分割された各振動波形との差がそれぞれの波形で求められ、31で振動波形毎にその差が自乗される。
【0054】
さらに32で各自乗波形に対し加算平均処理が行なわれ分散波形が算出される。33ではこの分散波形が積分され、振動波形の非定常成分を表す分散パワーが算出される。一方、34で27で入力された振動波形の自乗平均が行われ、振動パワーが算出される。最後に35で分散パワーと振動パワーとの比が算出され、比分散値が求められる。36からはその計算結果が出力される。
【0055】
図6は冷凍能力大品と冷凍能力小品の振動波形37、38と分散波形39、40を表しており、分散波形39、40の斜線部の面積の大きさが分散パワーを表しており、冷凍能力が大きい方がこの面積が大きいことが分かる。つまり、分散パワーが大きいほど冷凍能力が大きいことを表している。
【0056】
また、振動パワーとの比を算出しているのは圧縮機にかかる負荷または機種による分散パワーの変動を除外するためである。以上のことから、この波形処理手段で比分散値を算出することにより、圧縮性能である冷凍能力を効率良く判定することができる。
【0057】
(実施例3)
以下本発明の第3の実施例について図面を参照しながら説明する。
【0058】
実施例2に対して、入力された20周期分の波形を1周期毎に分割するための1周期のピッチ数を求める手段について規定するものである。
【0059】
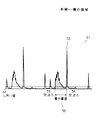
図7はサンプルデータ数に対する自己相関分析値の関係41を表している。波形処理器9に入力された20周期分の波形同士の一方の時間波形の時間軸をずらしながら相関分析計算が行われる。
【0060】
このため、時間軸のずれが1周期のN倍毎に相関分析値のピークが現れる。このピークは20周期分の平均周期を表している。これにより、図7に示すように初期状態から最初のピーク42までのサンプル数をカウントすることにより、1周期のピッチ数を効率的に正確に得ることができる。今回の場合約5,130ポイントであった。
【0061】
(実施例4)
以下本発明の第4の実施例について図面を参照しながら説明する。
【0062】
実施例2において波形処理器9で行われる分散波形32から積分して分散パワー33を算出する手段について規定するものである。
【0063】
分散波形32は非常にサンンプル数が大きく、このまま積分すると数値が見かけ上莫大な数値となり且つ積分範囲が不明確となり誤差要因となるため、分散波形32に対し平滑化処理を行い分散パワー33を算出した。今回の場合60ポイント、時間にすると0.2msecの間隔で平滑化処理を行った。
【0064】
図8は平滑化処理前の分散波形43と平滑化処理した後の分散波形44を示しており、処理後は処理前と比べ非常に頻雑としていた分散波形の形状が明確になっていることが分かる。これにより、積分範囲が明確となり、精度良く分散パワーを算出することができる。また、数値の巨大化によるオーバーフローがなくなると共に、処理速度が向上する。
【0065】
(実施例5)
以下本発明の第5の実施例について図面を参照しながら説明する。
【0066】
実施例2の波形処理器9で行われる分散波形32から分散パワー33を算出するために行われる積分処理について、その積分範囲を規定するものである。
【0067】
図9は振動波形45と分散波形46を示したものである。振動波形45の回転角270度近辺のバルブが開放し、閉鎖する間は、冷媒ガスの放出とガス漏れの影響により加振源である流体振動が周期毎に変動し、振動波形45の非定常成分が特に大きく発生する部分である。
【0068】
また、上死点の大きな衝撃波は機械振動に起因するところが大きく、且つ鋭いピークであるため波形処理の際に誤差要因となるところが大きい。このため、非定常成分を大きく発生しているバルブ開点48からバルブ閉点49の間の積分範囲50で積分することにより、圧縮性能により対応した精度良い分散パワー33を求めることができる。
【0069】
(実施例6)
以下本発明の第6の実施例について図面を参照しながら説明する。
【0070】
実施例5の波形処理の積分範囲の規定において、積分範囲の認識手段について規定するものである。
【0071】
図10の分散波形51において、しきい値52をトリガーレベルとし上死点ピーク53から逆回転方向に探索していき交点A54を求め、さらに回転角270度近辺から探索し交点B55を求めることにより積分範囲56を効率よく、正確に求めることができる。
【0072】
【発明の効果】
以上のように本発明は、
圧縮機において冷媒を圧縮する過程で発生する流体振動により加振され発生する振動波形を検出するセンサと、この振動波形を増幅する増幅器と、この増幅器から出力される信号を記録する波形記録装置と、この波形記録装置または増幅器から出力される信号のノイズ成分を除去するフィルタと、このフィルタから出力される信号をA/D変換するためのA/D変換器と、このA/D変換器から出力される信号の特徴を波形処理し、この波形処理値から性能劣化度合を判定する波形処理器と、これらの結果を表示する表示器と、これらの結果を記録する記録装置とで構成されており、波形処理器において圧縮機の圧縮過程で発生する流体振動の非定常成分を定量化することで性能劣化度合を判定することができる圧縮機の性能劣化診断装置であって、前記波形処理器で行われる流体振動の非定常成分の定量化処理において、入力された振動波形を周期毎に分割する手段と、この周期毎に分割した波形を加算平均処理する手段と、分割された波形とこの加算平均処理した波形との差の波形を算出する手段と、この差の自乗を算出する手段と、この各自乗した波形を加算平均処理し分散波形を求める手段と、この分散波形を積分し分散パワーを求める手段と、振動波形の自乗平均を行い振動パワーを求める手段と、この分散パワーとこの振動パワーとの比を算出する手段とで、比分散値を求める手段とで振動波形処理を行うことで効率良く、かつ精度良く性能劣化度合を判定することができる。
【0074】
さらに、波形処理器に入力された振動波形を周期毎に分割する手段として、自己相関分析処理を用いて振動波形を周期毎に分割することで、振動波形を精度良く周期毎に分割することができる。
【0075】
また、波形処理器における分散波形を積分する手段において、分散波形の平滑化処理を行った後、積分することで、分散パワーをエラーなく高速で正確に求めることができる。
【0076】
さらに、波形処理器で行われる分散波形を積分する手段において、圧縮機のバルブが開放している間を積分することで、より圧縮性能に対応する振動の非周期成分の分散パワーを算出することができる。
【0077】
また、分散波形の積分範囲の決定手段において、圧縮機のバルブが開放している間の積分範囲を分散波形にしきい値を設けその交点から求めることで、積分範囲を効率良く、正確に求めることができる。
これにより、圧縮機の圧縮性能をいちいちカロリー計測装置で計測することなしに効率的に精度良く診断することができる圧縮機の性能劣化診断装置を提供することができる。
【図面の簡単な説明】
【図1】本発明の第1の実施例を示す圧縮機の性能劣化診断装置のブロック図
【図2】本発明の診断対象となる圧縮機の横断面図
【図3】本発明の診断対象となる圧縮機のA−A’断面図
【図4】本発明の診断対象となメカ挙動と振動波形図
【図5】本発明の第2の実施例を示す波形処理フロ−チャート
【図6】本発明の第2の実施例を示すための振動波形と分散波形図
【図7】本発明の第3の実施例を示すための自己相関分析図
【図8】本発明の第4の実施例を示すための平滑化処理前と平滑化処理後の分散波形図
【図9】本発明の第5の実施例を示すための振動波形と分散波形図
【図10】本発明の第6の実施例を示すための分散波形図
【符号の説明】
1 圧縮機
2 4点溶接部
3 密閉ケース
4 センサ
5 増幅器
6 波形記録装置
7 フィルタ
8 A/D変換器
9 波形処理器
10 表示器
11 記録装置[0001]
[Industrial application fields]
The present invention relates to a nondestructive abnormality diagnosis of a compressor, and more particularly to a method and an apparatus for diagnosing an abnormality in compression performance of a compressor by vibration.
[0002]
[Prior art]
As a compressor, there is a compressor that compresses a refrigerant such as used in a freezing and refrigeration apparatus. This compressor is usually connected to a refrigeration system, and has a basic function of sucking low-temperature and low-pressure refrigerant gas, adiabatically compressing in the compressor, and discharging high-temperature and high-pressure refrigerant gas.
[0003]
However, the compression element portion of the compressor is made of metal, and there are many sliding portions between the metals. For this reason, for example, when foreign matters such as dust are mixed in the sliding portion, the foreign matter causes the sliding portion to be scratched and cause a decrease in compression performance (for example, freezing capacity) due to refrigerant leakage during compression. Due to scratches on the sliding parts, the sliding parts wear and cause compression failure.
[0004]
In addition, a clearance may be largely assembled due to a mistake in assembling the compressor, and a prescribed compression performance may not be output due to refrigerant leakage during compression.
[0005]
For this reason, in order to determine a decrease in compression performance or a compression failure due to these refrigerant leaks, the compressor was separated from the refrigeration system and evaluated with a calorie measuring device.
[0006]
However, this was expensive and time consuming, and it was practically impossible to manage the numbers. In addition, it is conceivable to detect the temperature in the freezer compartment, but not only the performance of the compressor, but also various causes, such as refrigerant gas, heat exchanger, heat insulation performance, temperature detection method, etc. It was not something that could be diagnosed correctly.
[0007]
For this reason, a method for efficiently and accurately diagnosing the degree of performance deterioration of the compressor has been desired.
[0008]
In order to meet these demands, there is a method of determining whether the compressor is operating abnormally by detecting a current value such as current or gas pressure and a pressure value.
[0009]
In addition, in order to detect abnormalities inside the compressor at an early stage, a method for detecting and diagnosing vibration, sound, and AE signals transmitted to the outer shell of the compressor has been devised.
[0010]
For example, Japanese Patent Laid-Open Nos. 62-75095 and 2-205728 have been proposed, and Japanese Patent Laid-Open No. 62-75095 discloses compression for detecting abnormalities such as cylinder flaws and garbage in the compressor. There is a method in which noise or vibration generated from a machine is detected, and an abnormality is determined by comparing with a reference value based on a ratio between a maximum value and a minimum value of an integrated fluctuation amount of a signal for each section divided in a wavelength direction.
[0011]
Japanese Patent Laid-Open No. 2-205728 discloses an AE signal generated from a compressor in order to detect defects such as scratches and wear on a sliding portion, and one cycle is obtained from a signal obtained by detecting the AE signal by envelope detection. A method has been devised in which an abnormality is determined by comparing with a reference value based on the number of AE signals generated exceeding a certain threshold value and the intensity of the rotational tuning component.
[0012]
[Problems to be solved by the invention]
However, in the configuration as described above, the current detection cannot determine that the compressor does not cause a relatively strong deterioration that causes compression failure, and detects a subtle change in compression performance due to gas leakage during compression. I can't.
[0013]
The same applies to gas pressure detection. Furthermore, in the method disclosed in Japanese Patent Laid-Open No. 62-75095, it can be judged only that the abnormality can be recognized even by a sense of hearing such as foreign matter mixed in the compressor, and basically the fluctuation of the mechanical vibration is extracted. The compression performance cannot be determined.
[0014]
Further, even in the diagnosis using the AE signal in Japanese Patent Laid-Open No. 2-205728, the feature of the AE signal due to the damage of the sliding portion is quantified, and there is a problem that the compression performance of the compressor cannot be diagnosed. there were.
[0015]
The present invention has been made in view of the above problems, and an object of the present invention is to provide a compressor performance deterioration diagnosis apparatus capable of efficiently and accurately diagnosing the degree of compression performance deterioration of a compressor.
[0016]
[Means for Solving the Problems]
In order to achieve the above object, a compressor performance deterioration diagnosis device according to the present invention includes a sensor for detecting a vibration waveform generated by fluid vibration generated in the process of compressing refrigerant in a compressor, and a vibration waveform. An amplifier for amplifying, a waveform recording apparatus for recording a signal output from the amplifier, a filter for removing noise components of a signal output from the waveform recording apparatus or the amplifier, and a signal output from the filter as A / An A / D converter for D conversion, a waveform processor for processing the characteristics of a signal output from the A / D converter, and determining a performance deterioration degree from the waveform processing value, and these results It consists of a display to display and a recording device to record these results, and by quantifying the unsteady component of fluid vibration generated in the compression process of the compressor in the waveform processor With judges ability deterioration degree, the quantification process of non-stationary component of the fluid vibration is performed by the waveform processor, means for dividing an input vibration waveform for each cycle, averaging the divided waveform for each this period Means for processing; means for calculating a difference waveform between the divided waveform and the waveform obtained by the averaging process; means for calculating a square of the difference; and averaging the squared waveform to obtain a distributed waveform. Means for obtaining, means for obtaining the dispersion power by integrating the dispersion waveform, means for obtaining the vibration power by taking the root mean square of the vibration waveform, and means for obtaining the relative dispersion value by calculating the ratio of the dispersion power and the vibration power Thus, the degree of performance deterioration is determined.
[0018]
Further, as means for dividing the vibration waveform input to the waveform processor for each period, the vibration waveform is divided for each period using autocorrelation analysis processing.
[0019]
Further, in the means for integrating the dispersed waveform in the waveform processor, the dispersion waveform is smoothed and then integrated.
[0020]
Further, in the means for integrating the distributed waveform performed by the waveform processor, the integration is performed while the valve of the compressor is open.
[0021]
In addition, in the means for determining the integration range of the dispersion waveform, the integration range while the valve of the compressor is open is provided with a threshold value for the dispersion waveform and obtained from the intersection.
[0022]
[Action]
In the present invention, the sensor detects the vibration waveform up to the ultrasonic region using the vibration of the fluid transmitted to the outer shell of the compressor as the excitation source, and the detected signal is a minute signal. This signal is amplified. This signal is then recorded in a waveform recorder so that it can be processed later. The filter removes a low frequency component and a high frequency component in order to remove noise components generated from other than the compressor of the signal output from the waveform recording device or the amplifier. The filtered signal is converted from an analog signal to a digital signal by an A / D converter and output to a waveform processor having a DSP. In this waveform processor, unsteady vibration generated due to the influence of fluid vibration of the input signal is quantified. Furthermore, the compression performance of the compressor is determined from a database representing the compression performance (for example, refrigeration capacity) corresponding to the quantified numerical value. These results are output on a screen or the like by a display, and the degree of performance deterioration can be confirmed. Further, the result is stored in a recording device such as a hard disk, and data is accumulated.
[0023]
Further, in the waveform processor, the input vibration waveform is divided for each period, and the divided vibration waveform is subjected to an averaging process. Next, the difference between the average waveform and the waveform divided for each period is obtained, and then the square of the difference is calculated for each waveform divided for each period. Further, the calculated waveform is subjected to addition averaging processing, and the average of the dispersed waveforms of the respective divided waveforms with respect to the average waveform of one period is calculated. Subsequently, integration is performed on this waveform, and the dispersion power is calculated. On the other hand, root mean square is performed on the input vibration waveform to obtain the vibration power. Finally, a ratio between the calculated vibration power and dispersion power is calculated, and a relative dispersion value is obtained. Thereby, the unsteady component of the fluid vibration corresponding to the compression performance of the compressor can be quantified, and the compression performance can be accurately determined.
[0024]
Further, an autocorrelation analysis calculation is performed in order to determine a periodic pitch for dividing the vibration waveform input to the waveform processor for each period. As a result, the rotation cycle appears as a peak of the correlation analysis waveform, and the interval between the peaks represents a pitch of one cycle. Based on this pitch, the vibration waveform is divided for each cycle. Thereby, there is no error in each waveform due to division, and accurate waveform division can be performed.
[0025]
Further, during the calculation of the dispersion power from the dispersion waveform, the dispersion waveform is once smoothed, and then integrated to calculate the dispersion power. Thereby, the clarification of the integration range and the data are simplified, and the calculation speed can be improved and the data can be easily handled.
[0026]
Furthermore, when integrating the dispersion waveform, it is integrated while the compressor valve is open, so that the dispersion power related to the fluid vibration corresponding to the compression performance can be extracted accurately, and the deterioration of the compression performance can be accurately detected. Diagnose well.
[0027]
Further, in determining the range in which the valve of the compressor is opened, the range in which the valve is opened is determined from the intersection of the threshold value and the dispersion waveform. Thereby, the opening range of the valve can be detected with high accuracy.
[0028]
【Example】
Here, it demonstrates in detail taking the compressor used for a refrigerator etc. as an example.
[0029]
Example 1
A compressor performance deterioration diagnosis apparatus according to an embodiment of the present invention will be described below with reference to the drawings.
[0030]
In FIG. 1, 1 is a compressor which compresses CFCs and the like, and 2 is a four-point weld that fixes a compression element to a sealed
[0031]
Here, the structure and vibration waveform of the compressor will be described.
2 and 3 show the structure of the
[0032]
The refrigerant passes through the
[0033]
Here, since the
[0034]
The refrigerant gas that has become high temperature and high pressure pushes up the
[0035]
FIG. 4 shows the relationship between the vibration waveform of one rotation measured by the sensor 4 and the behavior of the mechanical component in one rotation of the
[0036]
The state of (a) represents the state of the compression start point, and the
[0037]
This state is defined as a rotation angle of 0 degree, and is particularly called top dead center. At the top dead center, a large shock wave is generated in the vibration waveform due to the collision between the
[0038]
The state of (a) is a state in which the rotation is advanced by 180 degrees, and the
[0039]
The state C is a state in which the rotation is advanced by 270 degrees. The gas pressure load in the
[0040]
The state of (d) represents a state where the compression is completed after one rotation. In the vibration waveform, a shock wave is generated from this 270 degree to the top dead center, and it is considered that the gas pressure load is generated because the peripheral part slides while pressing the peripheral part against the supporting part. . Further, the refrigerant is theoretically sealed in the
[0041]
In particular, since the refrigerant becomes high temperature and high pressure from the rotation angle of 270 degrees to the top dead center, the refrigerant is discharged to the outside of the cylinder as the valve is opened, and the leakage of the refrigerant particularly leaks to the outside of the
[0042]
For this reason, this gas release and gas leakage have a great influence on the gas pressure load of the refrigerant that greatly contributes to the generation of the shock wave having the vibration waveform. Furthermore, although the shock wave of the vibration waveform looks periodic macroscopically, in the micro portion, the fluctuation of the gas pressure load causes the unsteady vibration to be repeated every rotation.
[0043]
Moreover, this unsteady component tends to be large when the refrigeration capacity of the compressor is large and small when the refrigeration capacity is small.
[0044]
The operation of the embodiment configured as described above will be described.
The vibration component generated from the inside of the
[0045]
This signal is amplified by the
[0046]
The signal input to the filter 7 is mainly mixed with low-frequency noise from the outside depending on the conditions under which the vibration of the
[0047]
Therefore, the filter 7 removes these noise components and outputs them to the A / D converter 8.
[0048]
For example, in this case, filtering was performed by setting the lower limit frequency to 300 Hz and the upper limit frequency to 100 KHz. In the A / D converter 8, the input analog signal is converted into a digital signal and output to the waveform processor 9.
[0049]
For example, in this case, the sampling frequency is 300 KHz. In the waveform processor 9, waveform processing operations such as quantifying the unsteady component of the vibration waveform described above are performed using a DSP or the like, and then a database (for example, in this case) showing correspondence between these calculation results and compression performance The compression performance is determined from a database of refrigeration capacity and waveform processing values. The determined result is output to the
[0050]
Further, these results are stored in the recording device 11 and a database for each compressor is constructed. From the above, the performance deterioration degree of the compressor can be efficiently determined by vibration.
[0051]
(Example 2)
A second embodiment of the present invention will be described below with reference to the drawings.
[0052]
In contrast to the first embodiment, in order to accurately determine the performance deterioration degree of the compressor, the waveform processing means relating to the quantification of the unsteady component of the vibration waveform performed by the waveform processor 9 is defined.
[0053]
In FIG. 5, the vibration waveform is input to the waveform processor 9 at 27. For example, in this case, vibration waveforms for 20 cycles were input. The input vibration waveform is divided every cycle at 28, and an addition average waveform of vibration waveforms for 20 cycles is calculated at 29. Next, the difference between each of the vibration waveforms divided at 28 with respect to the vibration waveform obtained by averaging at 30 is obtained for each waveform, and at 31, the difference is squared for each vibration waveform.
[0054]
Further, at 32, an averaging process is performed on each squared waveform to calculate a dispersed waveform. In 33, the dispersion waveform is integrated, and the dispersion power representing the unsteady component of the vibration waveform is calculated. On the other hand, the root mean square of the vibration waveforms input at 27 at 34 is performed, and the vibration power is calculated. Finally, at 35, the ratio between the dispersion power and the vibration power is calculated, and the relative dispersion value is obtained. From 36, the calculation result is output.
[0055]
FIG. 6 shows
[0056]
The ratio with the vibration power is calculated in order to exclude fluctuations in the distributed power due to the load on the compressor or the model. From the above, by calculating the relative dispersion value with this waveform processing means, it is possible to efficiently determine the refrigeration capacity as the compression performance.
[0057]
Example 3
A third embodiment of the present invention will be described below with reference to the drawings.
[0058]
With respect to the second embodiment, a means for obtaining the number of pitches in one cycle for dividing the input waveform of 20 cycles into one cycle is defined.
[0059]
FIG. 7 shows a
[0060]
For this reason, a peak of the correlation analysis value appears every N times the time axis shift. This peak represents an average period of 20 periods. Thereby, as shown in FIG. 7, by counting the number of samples from the initial state to the
[0061]
(Example 4)
A fourth embodiment of the present invention will be described below with reference to the drawings.
[0062]
In the second embodiment, a means for calculating the
[0063]
The distributed
[0064]
FIG. 8 shows the distributed
[0065]
(Example 5)
A fifth embodiment of the present invention will be described below with reference to the drawings.
[0066]
The integration range is defined for the integration processing performed to calculate the
[0067]
FIG. 9 shows the
[0068]
In addition, a shock wave with a large top dead center is largely caused by mechanical vibrations, and since it has a sharp peak, it is a significant cause of error during waveform processing. For this reason, by integrating in the
[0069]
(Example 6)
A sixth embodiment of the present invention will be described below with reference to the drawings.
[0070]
In the definition of the integration range of the waveform processing of the fifth embodiment, the recognition means for the integration range is specified.
[0071]
In the distributed
[0072]
【The invention's effect】
As described above, the present invention
A sensor for detecting a vibration waveform generated by fluid vibration generated in the process of compressing a refrigerant in a compressor, an amplifier for amplifying the vibration waveform, and a waveform recording device for recording a signal output from the amplifier A filter for removing a noise component of a signal output from the waveform recording device or the amplifier, an A / D converter for A / D converting the signal output from the filter, and the A / D converter It consists of a waveform processor that performs waveform processing on the characteristics of the output signal and determines the degree of performance degradation from this waveform processing value, a display that displays these results, and a recording device that records these results. cage, in the performance deterioration diagnosis device of a compressor of the non-stationary component it is possible to determine the performance degradation degree by quantifying the fluid vibration generated in the compression process of the compressor in the waveform processor Thus, in the quantification processing of the unsteady component of the fluid vibration performed by the waveform processor, means for dividing the input vibration waveform for each period, and means for adding and averaging the waveforms divided for each period Means for calculating a difference waveform between the divided waveform and the waveform obtained by the averaging process, a means for calculating a square of the difference, a means for calculating a square of the squared waveform, and calculating a dispersion waveform, Means for obtaining a relative dispersion value by means for integrating the dispersion waveform to obtain the dispersion power, means for obtaining the vibration power by taking the root mean square of the vibration waveform, and means for calculating the ratio of the dispersion power and the vibration power. By performing the vibration waveform processing, it is possible to efficiently and accurately determine the performance deterioration degree.
[0074]
Furthermore, as means for dividing the vibration waveform input to the waveform processor for each period, the vibration waveform can be divided for each period with high accuracy by dividing the vibration waveform for each period using autocorrelation analysis processing. it can.
[0075]
Further, the means for integrating the dispersed waveform in the waveform processor performs smoothing processing of the dispersed waveform and then integrates, whereby the dispersed power can be accurately obtained at high speed without error.
[0076]
Furthermore, in the means for integrating the dispersion waveform performed by the waveform processor, the dispersion power of the non-periodic component of the vibration corresponding to the compression performance is calculated by integrating while the valve of the compressor is open. Can do.
[0077]
Also, in the means for determining the integration range of the dispersion waveform, the integration range during the opening of the compressor valve is determined from the intersection of the dispersion waveform with a threshold value, so that the integration range can be obtained efficiently and accurately. Can do.
Accordingly, it is possible to provide a compressor performance deterioration diagnosis device capable of efficiently and accurately diagnosing the compression performance of the compressor with the calorie measurement device.
[Brief description of the drawings]
FIG. 1 is a block diagram of a compressor performance deterioration diagnosis apparatus according to a first embodiment of the present invention. FIG. 2 is a cross-sectional view of a compressor to be diagnosed according to the present invention. FIG. 4 is a cross-sectional view of the compressor taken along the line AA ′. FIG. 4 is a mechanical behavior and vibration waveform diagram to be diagnosed by the present invention. FIG. 7 is an autocorrelation analysis diagram for illustrating the third embodiment of the present invention. FIG. 8 is a diagram illustrating an autocorrelation analysis for illustrating the third embodiment of the present invention. Dispersion waveform diagram before and after smoothing processing for illustrating an example. FIG. 9 is a vibration waveform and dispersion waveform diagram for illustrating a fifth embodiment of the present invention. Dispersion waveform diagram to show an example [Explanation of symbols]
DESCRIPTION OF
Claims (5)
Priority Applications (1)
| Application Number | Priority Date | Filing Date | Title |
|---|---|---|---|
| JP05431195A JP3746089B2 (en) | 1995-03-14 | 1995-03-14 | Compressor performance deterioration diagnosis device |
Applications Claiming Priority (1)
| Application Number | Priority Date | Filing Date | Title |
|---|---|---|---|
| JP05431195A JP3746089B2 (en) | 1995-03-14 | 1995-03-14 | Compressor performance deterioration diagnosis device |
Publications (2)
| Publication Number | Publication Date |
|---|---|
| JPH08247076A JPH08247076A (en) | 1996-09-24 |
| JP3746089B2 true JP3746089B2 (en) | 2006-02-15 |
Family
ID=12967041
Family Applications (1)
| Application Number | Title | Priority Date | Filing Date |
|---|---|---|---|
| JP05431195A Expired - Fee Related JP3746089B2 (en) | 1995-03-14 | 1995-03-14 | Compressor performance deterioration diagnosis device |
Country Status (1)
| Country | Link |
|---|---|
| JP (1) | JP3746089B2 (en) |
Families Citing this family (27)
| Publication number | Priority date | Publication date | Assignee | Title |
|---|---|---|---|---|
| US7085610B2 (en) | 1996-03-28 | 2006-08-01 | Fisher-Rosemount Systems, Inc. | Root cause diagnostics |
| US7254518B2 (en) | 1996-03-28 | 2007-08-07 | Rosemount Inc. | Pressure transmitter with diagnostics |
| US6907383B2 (en) | 1996-03-28 | 2005-06-14 | Rosemount Inc. | Flow diagnostic system |
| US7623932B2 (en) | 1996-03-28 | 2009-11-24 | Fisher-Rosemount Systems, Inc. | Rule set for root cause diagnostics |
| US7630861B2 (en) | 1996-03-28 | 2009-12-08 | Rosemount Inc. | Dedicated process diagnostic device |
| US6601005B1 (en) * | 1996-11-07 | 2003-07-29 | Rosemount Inc. | Process device diagnostics using process variable sensor signal |
| US7010459B2 (en) * | 1999-06-25 | 2006-03-07 | Rosemount Inc. | Process device diagnostics using process variable sensor signal |
| JP2002041143A (en) * | 2000-07-31 | 2002-02-08 | Chiyoda Corp | Method for diagnosing abnormalities in operation section and method for diagnosing valve abnormalities in compressor |
| US6970003B2 (en) | 2001-03-05 | 2005-11-29 | Rosemount Inc. | Electronics board life prediction of microprocessor-based transmitters |
| US6859755B2 (en) | 2001-05-14 | 2005-02-22 | Rosemount Inc. | Diagnostics for industrial process control and measurement systems |
| RU2324171C2 (en) | 2003-07-18 | 2008-05-10 | Роузмаунт Инк. | Process diagnostic |
| US7018800B2 (en) | 2003-08-07 | 2006-03-28 | Rosemount Inc. | Process device with quiescent current diagnostics |
| US7627441B2 (en) | 2003-09-30 | 2009-12-01 | Rosemount Inc. | Process device with vibration based diagnostics |
| US7523667B2 (en) | 2003-12-23 | 2009-04-28 | Rosemount Inc. | Diagnostics of impulse piping in an industrial process |
| US6920799B1 (en) | 2004-04-15 | 2005-07-26 | Rosemount Inc. | Magnetic flow meter with reference electrode |
| US7046180B2 (en) | 2004-04-21 | 2006-05-16 | Rosemount Inc. | Analog-to-digital converter with range error detection |
| CN100535816C (en) | 2005-02-28 | 2009-09-02 | 罗斯蒙德公司 | Process connection for process diagnostics |
| WO2007012074A1 (en) | 2005-07-20 | 2007-01-25 | Rosemount Inc. | Field device with power over ethernet |
| DE112006003844T5 (en) | 2006-04-18 | 2009-02-12 | Mitsubishi Heavy Industries, Ltd. | Performance monitoring device and system for fluid machinery |
| US7321846B1 (en) | 2006-10-05 | 2008-01-22 | Rosemount Inc. | Two-wire process control loop diagnostics |
| US8898036B2 (en) | 2007-08-06 | 2014-11-25 | Rosemount Inc. | Process variable transmitter with acceleration sensor |
| US7590511B2 (en) | 2007-09-25 | 2009-09-15 | Rosemount Inc. | Field device for digital process control loop diagnostics |
| US8250924B2 (en) | 2008-04-22 | 2012-08-28 | Rosemount Inc. | Industrial process device utilizing piezoelectric transducer |
| CN102072144A (en) * | 2011-03-11 | 2011-05-25 | 大连大学 | Vibration and noise online monitoring and fault diagnosis system of scroll compressor |
| US9207670B2 (en) | 2011-03-21 | 2015-12-08 | Rosemount Inc. | Degrading sensor detection implemented within a transmitter |
| US9052240B2 (en) | 2012-06-29 | 2015-06-09 | Rosemount Inc. | Industrial process temperature transmitter with sensor stress diagnostics |
| US9602122B2 (en) | 2012-09-28 | 2017-03-21 | Rosemount Inc. | Process variable measurement noise diagnostic |
-
1995
- 1995-03-14 JP JP05431195A patent/JP3746089B2/en not_active Expired - Fee Related
Also Published As
| Publication number | Publication date |
|---|---|
| JPH08247076A (en) | 1996-09-24 |
Similar Documents
| Publication | Publication Date | Title |
|---|---|---|
| JP3746089B2 (en) | Compressor performance deterioration diagnosis device | |
| US9588015B2 (en) | Diagnostic method and diagnostic device for a slide bearing | |
| JP4232162B2 (en) | Compressor inspection device | |
| CN101432611B (en) | State detection device, state detection method, state detection program, and information recording medium | |
| US6332362B1 (en) | Device and method for detecting anomaly of air conditioner by using acoustic emission method | |
| JP2003528292A (en) | State-based monitoring of bearings by vibration analysis | |
| WO2003106960A1 (en) | Method and apparatus for diagnosing residual life of rolling element bearing | |
| JPWO2006025404A1 (en) | Status detection device, status detection method, status detection program and information recording medium, status display device, status display method, status display program and information recording medium | |
| KR20180040106A (en) | Reciprocating compressor flow sensing | |
| Thanagasundram et al. | A fault detection tool using analysis from an autoregressive model pole trajectory | |
| JP3543026B2 (en) | Diagnosis device for mechanical sliding parts | |
| JPH0692913B2 (en) | Abnormality diagnosis system for sliding motion part | |
| JPH07253081A (en) | Reciprocating compressor | |
| JP7572981B2 (en) | Anomaly Prediction Diagnostics System | |
| WO2021024383A1 (en) | Diagnostic system | |
| JPH0216420A (en) | Abnormality diagnosis device for mechanical sliding parts using AE | |
| JP4511886B2 (en) | Abnormality diagnosis device and abnormality diagnosis system for screw compressor | |
| JP4209793B2 (en) | Abnormality diagnosis method based on acoustic signal and program used for executing the method | |
| KR100389386B1 (en) | Method for sensing abnormal air conditioner using acoustic emmision | |
| KR100389387B1 (en) | Apparatus for sensing abnormal air conditioner using acoustic emmision | |
| JP2006189333A (en) | Bearing abnormality diagnosis device | |
| JPH066955B2 (en) | Operation inspection device for rotary compressor | |
| JPH08122304A (en) | Image sticking state measuring method, image sticking state measuring device, and rotary machine equipped with the image sticking state measuring device | |
| JP2667530B2 (en) | Valve leak diagnostic device | |
| JP2026020653A (en) | Diagnostic Systems |
Legal Events
| Date | Code | Title | Description |
|---|---|---|---|
| A977 | Report on retrieval |
Free format text: JAPANESE INTERMEDIATE CODE: A971007 Effective date: 20041006 |
|
| A131 | Notification of reasons for refusal |
Free format text: JAPANESE INTERMEDIATE CODE: A131 Effective date: 20041102 |
|
| A521 | Written amendment |
Free format text: JAPANESE INTERMEDIATE CODE: A523 Effective date: 20041216 |
|
| RD01 | Notification of change of attorney |
Free format text: JAPANESE INTERMEDIATE CODE: A7421 Effective date: 20050622 |
|
| TRDD | Decision of grant or rejection written | ||
| A01 | Written decision to grant a patent or to grant a registration (utility model) |
Free format text: JAPANESE INTERMEDIATE CODE: A01 Effective date: 20051101 |
|
| A61 | First payment of annual fees (during grant procedure) |
Free format text: JAPANESE INTERMEDIATE CODE: A61 Effective date: 20051121 |
|
| R150 | Certificate of patent or registration of utility model |
Free format text: JAPANESE INTERMEDIATE CODE: R150 |
|
| LAPS | Cancellation because of no payment of annual fees |