JP2024166300A - Information processing device, control method for information processing device, and program - Google Patents
Information processing device, control method for information processing device, and program Download PDFInfo
- Publication number
- JP2024166300A JP2024166300A JP2024155132A JP2024155132A JP2024166300A JP 2024166300 A JP2024166300 A JP 2024166300A JP 2024155132 A JP2024155132 A JP 2024155132A JP 2024155132 A JP2024155132 A JP 2024155132A JP 2024166300 A JP2024166300 A JP 2024166300A
- Authority
- JP
- Japan
- Prior art keywords
- deformation
- image
- progress
- information processing
- processing device
- Prior art date
- Legal status (The legal status is an assumption and is not a legal conclusion. Google has not performed a legal analysis and makes no representation as to the accuracy of the status listed.)
- Pending
Links
Images
Classifications
-
- G—PHYSICS
- G06—COMPUTING OR CALCULATING; COUNTING
- G06T—IMAGE DATA PROCESSING OR GENERATION, IN GENERAL
- G06T7/00—Image analysis
- G06T7/0002—Inspection of images, e.g. flaw detection
- G06T7/0004—Industrial image inspection
- G06T7/001—Industrial image inspection using an image reference approach
-
- G—PHYSICS
- G01—MEASURING; TESTING
- G01N—INVESTIGATING OR ANALYSING MATERIALS BY DETERMINING THEIR CHEMICAL OR PHYSICAL PROPERTIES
- G01N21/00—Investigating or analysing materials by the use of optical means, i.e. using sub-millimetre waves, infrared, visible or ultraviolet light
- G01N21/84—Systems specially adapted for particular applications
- G01N21/88—Investigating the presence of flaws or contamination
- G01N21/8851—Scan or image signal processing specially adapted therefor, e.g. for scan signal adjustment, for detecting different kinds of defects, for compensating for structures, markings, edges
- G01N2021/8854—Grading and classifying of flaws
- G01N2021/8867—Grading and classifying of flaws using sequentially two or more inspection runs, e.g. coarse and fine, or detecting then analysing
- G01N2021/887—Grading and classifying of flaws using sequentially two or more inspection runs, e.g. coarse and fine, or detecting then analysing the measurements made in two or more directions, angles, positions
-
- G—PHYSICS
- G01—MEASURING; TESTING
- G01N—INVESTIGATING OR ANALYSING MATERIALS BY DETERMINING THEIR CHEMICAL OR PHYSICAL PROPERTIES
- G01N21/00—Investigating or analysing materials by the use of optical means, i.e. using sub-millimetre waves, infrared, visible or ultraviolet light
- G01N21/84—Systems specially adapted for particular applications
- G01N21/88—Investigating the presence of flaws or contamination
- G01N21/8851—Scan or image signal processing specially adapted therefor, e.g. for scan signal adjustment, for detecting different kinds of defects, for compensating for structures, markings, edges
- G01N2021/8854—Grading and classifying of flaws
- G01N2021/888—Marking defects
-
- G—PHYSICS
- G01—MEASURING; TESTING
- G01N—INVESTIGATING OR ANALYSING MATERIALS BY DETERMINING THEIR CHEMICAL OR PHYSICAL PROPERTIES
- G01N21/00—Investigating or analysing materials by the use of optical means, i.e. using sub-millimetre waves, infrared, visible or ultraviolet light
- G01N21/84—Systems specially adapted for particular applications
- G01N21/88—Investigating the presence of flaws or contamination
- G01N21/8851—Scan or image signal processing specially adapted therefor, e.g. for scan signal adjustment, for detecting different kinds of defects, for compensating for structures, markings, edges
- G01N2021/8887—Scan or image signal processing specially adapted therefor, e.g. for scan signal adjustment, for detecting different kinds of defects, for compensating for structures, markings, edges based on image processing techniques
-
- G—PHYSICS
- G06—COMPUTING OR CALCULATING; COUNTING
- G06T—IMAGE DATA PROCESSING OR GENERATION, IN GENERAL
- G06T2207/00—Indexing scheme for image analysis or image enhancement
- G06T2207/30—Subject of image; Context of image processing
- G06T2207/30181—Earth observation
- G06T2207/30184—Infrastructure
Landscapes
- Engineering & Computer Science (AREA)
- Computer Vision & Pattern Recognition (AREA)
- General Physics & Mathematics (AREA)
- Physics & Mathematics (AREA)
- Biochemistry (AREA)
- Immunology (AREA)
- Chemical & Material Sciences (AREA)
- Analytical Chemistry (AREA)
- Health & Medical Sciences (AREA)
- General Health & Medical Sciences (AREA)
- Signal Processing (AREA)
- Life Sciences & Earth Sciences (AREA)
- Pathology (AREA)
- Quality & Reliability (AREA)
- Theoretical Computer Science (AREA)
- Management, Administration, Business Operations System, And Electronic Commerce (AREA)
- Investigating Materials By The Use Of Optical Means Adapted For Particular Applications (AREA)
- Image Analysis (AREA)
- Bridges Or Land Bridges (AREA)
Abstract
Description
本発明は、構造物の変状変化の判定技術に関するものである。 The present invention relates to technology for determining changes in the condition of structures.
橋梁やトンネル等の構造物点検において、構造物の部材の健全性を示す健全度を判断するために、構造物壁面に生じるひび割れや鉄筋露出等の変状がどれだけ進行(経年変化)したかを把握することが求められている。特に、健全度の判断において、太いひび割れや広範囲に広がる鉄筋露出など、構造物の機能への影響が大きな変状の進行状況は重視される。 When inspecting structures such as bridges and tunnels, it is necessary to understand the extent to which defects such as cracks and exposed rebar on the structure's walls have progressed (changes over time) in order to determine the soundness of the structure's components. In particular, when judging the soundness, emphasis is placed on the progress of defects that have a significant impact on the function of the structure, such as thick cracks and widespread exposed rebar.
画像を用いたインフラ構造物の点検では、異なる時期に構造物の壁面を撮影した画像から変状を検出し、検出した変状同士の差分を求めることにより、個々の変状の進行の度合い(進行度)を算出する。特許文献1には、異なる時刻に撮影された画像間で特徴量が近似するひび割れを同一のひび割れとし、その進行度を求めることが記載されている。
In infrastructure inspections using images, abnormalities are detected from images of the structure's wall surface taken at different times, and the degree of progression of each abnormality (progression level) is calculated by finding the differences between the detected abnormalities.
撮影のたびに撮影位置や天候など撮影条件が変化するため、同一構造物の同一壁面を撮影した画像であっても、画像間の各画素には位置ずれを含む。そのため、変状の経年変化の状態を求めるためには、このずれを考慮しながら変状同士の対応関係を求める必要がある。しかしながら、年数が経過した構造物の壁面には、非常に多くの変状が生じる。そのため、異なる時期の画像から検出したすべての変状同士の対応関係を、画像間のずれを考慮しながら求めるためには多くの時間を必要とする。 Because shooting conditions such as the shooting position and weather change each time an image is taken, there is a positional shift in each pixel between images, even when images are taken of the same wall surface of the same structure. Therefore, in order to determine the state of aging in a defect, it is necessary to determine the correspondence between the defects while taking this shift into account. However, a great number of defects occur on the walls of a structure that have aged over the years. Therefore, it takes a lot of time to determine the correspondence between all the defects detected from images taken at different times while taking into account the shift between images.
本発明はかかる問題に鑑み成されたものであり、変状の経年変化の状態を効率的に求める技術を提供しようとするものである。 The present invention was developed in consideration of these problems, and aims to provide a technology that can efficiently determine the state of deterioration over time.
この課題を解決するため、例えば本発明の情報処理装置は以下の構成を備える。すなわち、
第1の時期における構造物の画像である第1の画像の部分領域を決定するとともに、前記第1の時期の後の第2の時期における前記構造物の画像である第2の画像において、前記第1の画像の前記部分領域に対応する部分領域を決定する決定手段と、
前記第1の画像の前記部分領域に含まれる第1の変状と前記第2の画像の前記部分領域に含まれる第2の変状とに基づいて、前記第1の変状から前記第2の変状についての進行度を表示するための表示データを生成する生成手段と、を備える。
In order to solve this problem, for example, an information processing device of the present invention has the following arrangement.
a determination means for determining a partial area of a first image, which is an image of a structure at a first time, and determining a partial area in a second image, which is an image of the structure at a second time after the first time, that corresponds to the partial area of the first image;
The image forming apparatus further includes a generating means for generating display data for displaying a degree of progress from the first deformation to the second deformation based on a first deformation included in the partial area of the first image and a second deformation included in the partial area of the second image.
本発明によれば、構造物に多数の変状が存在する場合であっても、変状の経年変化の状態を効率的に求めることができる。 According to the present invention, even if a structure has many abnormalities, it is possible to efficiently determine the state of changes in the abnormalities over time.
以下、添付図面を参照して実施形態を詳しく説明する。尚、以下の実施形態は特許請求の範囲に係る発明を限定するものでない。実施形態には複数の特徴が記載されているが、これらの複数の特徴の全てが発明に必須のものとは限らず、また、複数の特徴は任意に組み合わせられてもよい。さらに、添付図面においては、同一若しくは同様の構成に同一の参照番号を付し、重複した説明は省略する。 The following embodiments are described in detail with reference to the attached drawings. Note that the following embodiments do not limit the invention according to the claims. Although the embodiments describe multiple features, not all of these multiple features are necessarily essential to the invention, and multiple features may be combined in any manner. Furthermore, in the attached drawings, the same reference numbers are used for the same or similar configurations, and duplicate explanations are omitted.
[第1の実施形態]
第1の実施形態として、異なる時期に撮影された2つの画像を用いて、検査対象の変状の進行度を算出する方法の例を説明する。特に本実施形態においては、橋梁等の構造物の健全度を判定するようないわゆるインフラ点検を行うための情報処理装置を例に説明する。本実施形態の説明において利用される用語を、以下のように定義する。
[First embodiment]
As a first embodiment, an example of a method for calculating the degree of progression of a deformation of an inspection target using two images taken at different times will be described. In particular, in this embodiment, an information processing device for performing so-called infrastructure inspection, such as judging the soundness of a structure such as a bridge, will be described as an example. Terms used in the description of this embodiment are defined as follows.
「検査対象」とは、インフラ点検を行う情報処理システムを説明する場合には、コンクリート構造物等を指す。本実施形態で説明する情報処理システムのユーザは、検査対象を撮像した画像を基に、表面にひび割れなどの変状がないかを検査することを目的としている。「変状」とは、例えば、コンクリート構造物の場合、コンクリートのひび割れや浮き、剥落を指す。他にも、エフロレッセンスや、鉄筋露出、錆、漏水、水垂れ、腐食、損傷(欠損)、コールドジョイント、析出物、ジャンカなどを指す。 When describing an information processing system for infrastructure inspections, the term "inspection target" refers to a concrete structure or the like. The user of the information processing system described in this embodiment aims to inspect the inspection target for abnormalities such as cracks on its surface based on images captured. For example, in the case of a concrete structure, "defects" refer to cracks, lifting, and spalling of the concrete. Other examples include efflorescence, exposed rebar, rust, water leakage, dripping, corrosion, damage (missing parts), cold joints, deposits, and junk.
「第1の画像」および「第2の画像」とは、同一構造物の同一壁面を異なる時期に撮影した画像である。本実施形態において、第1の画像の撮影時期は、第2の画像を撮影した時期から年数が経過した後の時期を指すものとする。 The "first image" and the "second image" are images of the same wall surface of the same structure taken at different times. In this embodiment, the time when the first image was taken refers to a time several years after the time when the second image was taken.
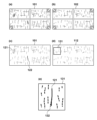
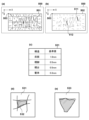
本実施形態の概要について、ひび割れの経年変化の状態を示す進行度を算出する例を用いて説明する。図1(a)、(b)に、インフラ構造物の例として、橋梁の壁面を異なる時期に撮影した画像101,102を示す。画像101は、画像102よりも年数が経過した後に撮影した画像である。インフラ構造物の壁面には、経年変化により多数のひび割れが発生する。そのため、撮影画像101、102には多数のひび割れが存在している。図1(c)は画像101に対応するひび割れデータ111を、図1(d)は画像102に対応するひび割れデータ112を示す。ひび割れデータ111,112の破線と実線は、ひび割れ幅の異なる微細なひび割れと太いひび割れを示している。ひび割れデータは、例えば、調査技術者が、画像をもとにひび割れや鉄筋露出などの変状の位置や形状等を入力し、画像と対応付けて記録したデータである。ひび割れデータを取得する他の方法として、例えば、機械学習によりあらかじめ学習させたモデルを用いて、画像からひび割れを検出することにより取得することもできる。なお、画像101,102、及び、ひび割れデータ111,112には、紙面に表現していない多数のひび割れを含むものとする。
The outline of this embodiment will be described using an example of calculating the degree of progress indicating the state of crack aging. Figures 1(a) and (b) show
部材の健全度を判断するにあたり、部材表面に存在しているひび割れの進行度を確認する。ひび割れの進行度を算出するためには、異なる時期のひび割れ同士を1本ずつ比較して、ひび割れ長やひび割れ幅等の差分を求める必要がある。この時、異なる時期のひび割れの間には、撮影条件の違い等に起因する位置ずれや形状ずれを含む。さらに、経年変化によるひび割れ自体の進行による差分も含む。ひび割れの進行度を算出するためには、これらのずれや差分を考慮しながらひび割れの対応関係を求める必要がある。 When determining the soundness of a component, the progression of cracks present on the component surface is confirmed. In order to calculate the progression of a crack, it is necessary to compare cracks from different times one by one and determine the differences in crack length, crack width, etc. At this time, there will be positional and shape deviations between cracks from different times due to differences in shooting conditions, etc. Furthermore, there will also be differences due to the progression of the crack itself due to changes over time. In order to calculate the progression of a crack, it is necessary to determine the correspondence between the cracks while taking these deviations and differences into account.
この対応関係を求める処理を、ひび割れデータ111が示す全てのひび割れに対して行うと非常に時間がかかってしまう。そこで、健全度の判断で重視すべきひび割れに限定して対応関係を求める。例えば、ひび割れデータ111の中から、部材の機能に対して影響を及ぼす可能性が高い太いひび割れ121、122を選択する。そして、選択したひび割れ121,122に対応するひび割れを、ひび割れデータ112から求める処理を行う。ひび割れ同士の対応関係を求める方法として、例えば、ひび割れの形状を重ね合わせた時の重複度合いに基づいて決定する方法がある。図1(e)は、ひび割れ121をひび割れデータ112に重ね合わせて領域131部分を拡大した様子を示している。図1(e)より、ひび割れ121との重複度合いが最も高いひび割れはひび割れ132と求まる。その後、ひび割れ121、132を用いて、ひび割れの進行度を算出する。ひび割れの進行度として、例えば、ひび割れの総延長や最大ひび割れ幅の差分を算出する。
If this process of finding the correspondence is performed for all cracks indicated by the crack data 111, it will take a very long time. Therefore, the correspondence is found only for cracks that should be emphasized in determining the soundness. For example, from the crack data 111,
以上のように、部材表面に多数のひび割れが発生している場合であっても、健全度の判断で重視するひび割れのみ選択することで、効率的に進行度を算出することができる。 As described above, even if multiple cracks have occurred on the surface of a component, the degree of progression can be calculated efficiently by selecting only the cracks that are important in determining the soundness.
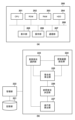
<情報処理装置>
図2(a)は、本実施形態に係る情報処理装置200のハードウェア構成図である。図2(a)に示すように、情報処理装置200は、CPU201、ROM202、RAM203、HDD204、表示部205、操作部206、及び、通信部207を有する。CPU201は、中央演算装置(Central Processing Unit)であり、各種処理のための演算や論理判断等を行い、システムバス208に接続された各構成要素を制御する。ROM(Read-Only Memory)202は、プログラムメモリであって、後述する各種処理手順を含むCPU201による制御のためのプログラムを格納する、RAM(Random Access Memory)203は、CPU201の主メモリ、ワークエリア等の一時記憶領域として用いられる。尚、情報処理装置200に接続された外部記憶装置等からRAM203にプログラムをロードすることで、プログラムメモリを実現しても構わない。
<Information processing device>
FIG. 2A is a hardware configuration diagram of an
HDD204は、本実施形態に係る電子データやプログラムを記憶しておくためのハードディスクである。同様の役割を果たすものとして外部記憶装置を用いてもよい。ここで、外部記憶装置は、例えば、メディア(記録媒体)と、当該メディアへのアクセスを実現するための外部記憶ドライブとで実現することができる。このようなメディアとしては、例えば、フレキシブルディスク(FD)、CD-ROM、DVD、USBメモリ、MO、フラッシュメモリ等が知られている。また、外部記憶装置は、ネットワークで接続されたサーバ装置等であってもよい。
表示部205は、例えばCRTディスプレイや、液晶ディスプレイ等であって、表示画面に画像を出力するデバイスである。なお表示部205は、情報処理装置200と有線あるいは無線で接続された外部デバイスでも構わない。操作部206は、キーボードやマウスを有し、ユーザによる各種操作を受け付ける。通信部207は、公知の通信技術により、他の情報処理装置や通信機器、外部記憶装置等との間で、有線又は無線による双方向の通信を行う。
The
<機能ブロック図>
図2(b)は、情報処理装置200の機能構成を示すブロック図の一例である。これらの各機能部は、CPU201が、ROM202に格納されたプログラムをRAM203に展開し、後述する各フローチャートに従った処理を実行することで実現されている。そして、各処理の実行結果をRAM203に保持する。また例えば、CPU201を用いたソフトウェア処理の代替としてハードウェアを構成する場合には、ここで説明する各機能部の処理に対応させた演算部や回路を構成すればよい。
<Function block diagram>
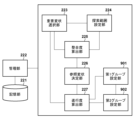
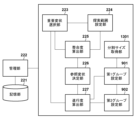
2B is an example of a block diagram showing the functional configuration of the
管理部222は、記憶部221(例えばHDD204)に記憶された、異なる時期に撮影された画像や各画像に対応する変状データ、構造物に係る構造情報を管理する。重要変状選択部223は、第1の変状データから、進行度算出対象の変状データを重要変状として選択する。探索範囲設定部224は、重要変状選択部223で選択した重要変状に対応する変状を、第2の変状データの中から探索する範囲を設定する。整合度算出部225は、探索範囲中の変状と重要変状を用いて、整合度を算出する処理を行う。参照変状決定部226は、整合度の算出結果に基づいて、重要変状に対応する変状を参照変状として決定する。進行度算出部227は、重要変状と参照変状の差分を進行度として算出する処理を行う。
The
<画像と変状データの関係と構造情報の説明>
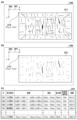
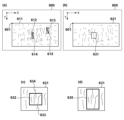
本実施形態を説明するにあたり、画像と変状データの関係、および構造情報について説明する。画像点検において、構造物壁面を撮影した画像は、その設計図面と対応付けて管理することが好ましい。図3(a)は、インフラ構造物の1つの例として、橋梁の壁面を撮影した画像311を、図面300へ張り付けた状態を示している。図面300は、点302を原点とした図面座標301を持つ。画像の図面上の位置は、画像左上の頂点座標で定義される。例えば、画像311の図面上の位置を示す座標は、頂点312の位置(x312、y312)である。画像は、座標情報とともに、記憶部221に記憶されている。本実施形態において、インフラ構造物の画像点検で使用する画像は、微細なひび割れなどを確認できるよう高解像度(例:1画素あたり1mm)で撮影する。このため、点検に用いる構造物の画像のサイズは大きい。例えば、図3(a)の画像311は、20m×10mの橋梁の床版を撮影した画像である。画像解像度が1画素あたり1.0mm(1.0mm/pixel)の場合、画像311の画像サイズは20,000pixel×10,000pixelとなる。高解像度で撮影した画像311には、多数(例:1000以上)のひび割れや鉄筋露出等の変状が存在するが、すべての変状を紙面上で表現することは困難であるため、紙面に表示している変状は一部に限定している。以降の説明で広範囲の画像や変状データを表示している図においても、表示している変状は一部に限定している。
<Explanation of the relationship between images and deformation data and structural information>
In explaining this embodiment, the relationship between the image and the deformation data, and the structural information will be explained. In image inspection, it is preferable to manage the image of the wall surface of the structure in association with its design drawing. FIG. 3A shows a state in which an
変状データは、コンクリート壁面に生じるひび割れ等の変状の自動検出結果、または人間による入力結果を記録した情報である。本実施形態を説明するにあたり、変状データは図面に対応付けて管理しているものとする。図3(b)に、画像311に対応する変状データ321を、図面300に、画像311と同じ位置に張り付けた状態を示す。変状データ321には、紙面に表示されない変状も含め多数(例:1000以上)の変状が存在している。変状データ321中の各変状データの図面上の位置は、変状データの構成する画素座標で定義される。図3(c)に、変状データのデータ構造を表す変状データテーブル331の一例を示す。この変状データテーブル331における第1、第2フィールドは変状を特定するためのID、変状の種別を示している。また、変状データテーブル331のうち、第3、第4フィールドの座標列と数値列は、変状データを構成する複数の座標と、その座標における変状の幅を表す属性値である。例えば、ひび割れC001は、(Xc001_1、Yc001_1)から(Xc001_n、Yc001_n)のn点からなる連続画素で表されていることを示す。また、変状データテーブル331における第5乃至第7フィールドには、最大幅、総延長/輪郭長、面積が格納される。
Deformation data is information that records the results of automatic detection of deformations such as cracks on a concrete wall surface, or the results of human input. In explaining this embodiment, it is assumed that deformation data is managed in association with a drawing. FIG. 3B shows a state in which deformation
このように、本実施形態では、変状データは画素で表現されているものとする。変状データの表現は、複数点から構成されるポリラインや曲線等のベクターデータで表現するようにしてもよい。変状データをベクターデータで表現する場合、データ容量が減少し、より簡略的な表現となる。ひび割れ以外の変状データの例として、IDがT001の鉄筋露出がある。鉄筋露出をポリラインで表現する場合、ポリラインで囲まれた領域を持つ変状となる。なお、変状データの持つ属性情報は、変状データテーブル331に示す属性情報に限定されるものではなく、その他の属性情報を保持してもよい。 As described above, in this embodiment, the deformation data is represented by pixels. The deformation data may be represented by vector data such as polylines or curves consisting of multiple points. When deformation data is represented by vector data, the data volume is reduced and the representation is simpler. An example of deformation data other than cracks is exposed rebar with ID T001. When exposed rebar is represented by polylines, it becomes a deformation having an area surrounded by the polylines. Note that the attribute information held by the deformation data is not limited to the attribute information shown in the deformation data table 331, and other attribute information may be held.
構造情報とは、検査対象の構造物の構造に係る情報であり、構造物の種別や基本構造、構造物の各種寸法、部材情報、竣工年度をはじめとする諸元を含む情報である。さらに、補修実績として、補修年度や補修箇所、補修方式といった保守メンテナンスに係る情報を含んでもよい。本実施形態では、部材情報や補修情報といった構造物の特定位置に関する構造情報は、図面上における位置情報とともに記憶されているものとする。すなわち、各部材の図面上の位置や補修箇所の図面上の位置が構造情報の一部として記憶される。したがって、図面を介して、構造情報と画像および変状データとの対応関係を求めることができる。構造情報は、画像や変状データとともに記憶部221に格納され、管理部222により取得することができる。なお、構造情報に含まれる情報は、上記の情報に限定されるものではなく、その他の情報を保持してもよい。また、構造物の種別に応じて、種別ごとに限定された情報を保持してもよい。
The structural information is information related to the structure of the inspected structure, including the type and basic structure of the structure, various dimensions of the structure, component information, and specifications such as the year of completion. Furthermore, the repair record may include information related to maintenance such as the repair year, repair location, and repair method. In this embodiment, structural information related to a specific position of the structure, such as component information and repair information, is stored together with position information on the drawing. That is, the position on the drawing of each component and the position on the drawing of the repair location are stored as part of the structural information. Therefore, the correspondence between the structural information and the image and the deformation data can be obtained via the drawing. The structural information is stored in the
<フローチャート>
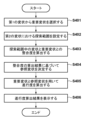
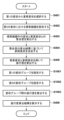
図4は、本実施形態における情報処理装置のメイン処理の流れを表すフローチャートである。以下、各工程(ステップ)は、それら符号の先頭にはSを付与して説明することとする。本実施形態では、構造物の壁面に生じる変状の進行度を算出するために、2つの異なる時期に撮影した第1、2の画像を用いる。第1の画像を撮影した時期は、第2の画像を撮影した時期から、数年(例えば5年)経過した時期であるとする。第1の画像と第2の画像はともに、構造物の壁面に生じる多数(例:1,000以上)の変状を撮影した画像であるとする。第1の画像から変状を検出したデータを第1の変状データとし、第2の画像から変状を検出したデータを第2の変状データとする。本実施形態では、操作部206から、処理開始の入力を受け付けて、図4のフローチャートの処理を開始する。そして、進行度の算出処理が完了したら、進行度算出結果を示す表示データを表示部205に表示して、処理が終了する。以下、図4のフローチャートに従って本実施形態の処理を説明する。
<Flowchart>
FIG. 4 is a flowchart showing the flow of the main processing of the information processing device in this embodiment. Hereinafter, each process (step) will be described with S added to the beginning of the code. In this embodiment, in order to calculate the progress of the deformation occurring on the wall surface of the structure, the first and second images taken at two different times are used. The time when the first image was taken is assumed to be several years (for example, 5 years) after the time when the second image was taken. The first and second images are both assumed to be images of a large number (for example, 1,000 or more) of deformations occurring on the wall surface of the structure. The data in which the deformation is detected from the first image is assumed to be the first deformation data, and the data in which the deformation is detected from the second image is assumed to be the second deformation data. In this embodiment, the input of the start of processing is accepted from the
<重要変状の選択>
S401にて、重要変状選択部223は、第1の画像に対応する第1の変状データの中から、進行度算出対象の変状を重要変状として選択する。重要変状を選択する方法として、例えば、変状データの属性情報に基づいて選択する方法がある。本実施形態では、ひび割れの進行度の算出方法を説明する例として、変状データの最大幅に基づいて第1の変状データから重要変状を選択する方法を説明する。
<Selection of significant changes>
In S401, the important
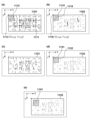
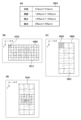
図5(a)は、図面500上の座標503に張り付けた第1の画像501を示し、図5(b)は第1の画像501における第1の変状データ502を示している。第1の画像501のサイズは、20,000pixel×10,000pixelである。第1の変状データ502の破線と実線は、それぞれ最大幅が1.0mm未満のひび割れと1.0mm以上のひび割れを示している。第1の画像501および第1の変状データ502には、紙面で表現していない多数の変状が存在している。
Figure 5(a) shows a
第1の変状データ502の中から重要変状を選択する方法として、例えば、基準値以上の最大幅を持つ変状データを経年変化の状態の判定対象とする重要変状として選択する方法がある。その判定式を次式(1)に示す。
W≦Wc …(1)
ここで、パラメータWcは、各変状データの最大幅の値であり、パラメータWは、重要変状とするか否かを判定する基準値(もしくは閾値)である。本実施形態におけるパラメータWを決定する1つの方法として、変状種別毎に構造物全体であらかじめ決められた一律の基準値を閾値として使用する方法がある。例えば、変状種別がひび割れの場合における基準値Wを1.0mmとした場合、変状データ502において、1.0mm以上の太いひび割れを示す実線の変状511、512が重要変状として選択される。パラメータWを決定する他の方法として、構造情報毎にあらかじめ決められた基準値を使用する方法がある。図5(c)に、橋梁における構造毎の異なる基準値一覧521の例を示す。画像・変状データと、構造物の構造との対応関係は、図面を介して求めることができる。したがって、検査対象の構造に合わせて、重要変状を選択する基準値を切り替えることができる。これらの基準値は、実験的に求めた値を使用してもよいし、点検結果を蓄積した過去DBに基づいて決定してもよい。また、パラメータWを決定する他の方法として、ユーザが直接指定できるようにしてもよい。ユーザが基準値を指定する場合、基準値を指定する範囲を、任意の範囲で指定できることが望ましい。例えば、画像単位や部分画像単位で基準値を指定してもよいし、構造情報毎(例:部材毎、構造物毎)で基準値を指定してもよい。
As a method for selecting an important deformation from the
W≦W c (1)
Here, the parameter Wc is the maximum width value of each deformation data, and the parameter W is a reference value (or threshold value) for determining whether or not the deformation is an important deformation. As one method for determining the parameter W in this embodiment, there is a method of using a uniform reference value that is predetermined for the entire structure for each deformation type as a threshold value. For example, if the reference value W is 1.0 mm when the deformation type is a crack, in the
最大幅に基づいて重要変状を選択する他の方法として、例えば、最大幅が大きい上位10の変状データを重要変状として選択してもよい。重要変状の選択数を固定にすることにより、進行度を算出する処理時間の増加を抑制することができる。また、その他の方法として、最大幅の大きい順から上位1%の変状データを重要変状として選択してもよい。 As another method for selecting important variations based on the maximum width, for example, the top 10 pieces of variation data with the largest maximum width may be selected as important variations. By fixing the number of selected important variations, it is possible to suppress an increase in the processing time required to calculate the progress. As another method, the top 1% of the variation data in descending order of maximum width may be selected as important variations.
ここまで、属性情報の1つである最大幅を用いて重要変状を選択する例を説明したが、使用する属性情報は最大幅に限定されない。例えば、ひび割れ長さを示す総延長に基づいて、基準値以上の長さを持つひび割れを重要変状として選択することもできる。重要変状か否かを判定する式(1)や、ひび割れ長基準値(パラメータW)の決定方法等は最大幅を用いた場合と同様の方法を用いることができる。 So far, we have explained an example of selecting a significant variation using the maximum width, which is one piece of attribute information, but the attribute information used is not limited to the maximum width. For example, cracks with a length equal to or greater than a reference value can be selected as significant variations based on the total length, which indicates the crack length. The formula (1) for determining whether or not a variation is significant, and the method for determining the crack length reference value (parameter W), etc. can be the same as when the maximum width is used.
重要変状を選択する他の方法として、複数の変状データを組合せた複合変状を選択してもよい。複合変状の一例として、図5(d)に、同一種別のひび割れを組み合わせた格子状ひび割れ531を示す。複数のひび割れが交差して格子状を形成すると、斜線で囲われた領域532のコンクリート壁面がはがれやすくなる。その結果、コンクリート落下や鉄筋露出による構造物内部の劣化などの可能性が高くなる。そのため、格子状ひび割れ531のような、複数の同一変状からなる複合変状を重要変状として選択することが望ましい。格子状ひび割れを識別する方法には、任意の方法を利用可能である。例えば、形状の一部が重なりあうひび割れを数珠繋ぎのように複数選択して閉領域を構成する場合に、選択した複数のひび割れを格子状ひび割れと識別することができる。複数の変状データを組み合わせた他の複合変状として、異なる変状種別の変状を組み合わせた複合変状でもよい。例えば、図5(e)に示すようなひび割れの近傍にエフロレッセンスが発生している複合変状533がある。析出物を伴うひび割れは、ひび割れが構造物内部に進行している可能性があり、構造物の機能への影響が高い。したがって複合変状533のような変状は重要変状として選択することが望ましい。なお、析出物を伴うひび割れのような複合変状は、変状の種別、変状の形状および相対的な位置関係に基づいて識別可能である。 重要変状を選択する他の方法として、構造情報を用いて重要変状を選択してもよい。例えば、構造物の表面付近に鉄筋が敷設されている壁面では、壁面のコンクリートがはく離すると鉄筋が露出し、構造物の劣化が進行しやすくなる。そのため、鉄筋等の部材材料が内部に敷設されている壁面付近の変状を重要変状として選択することが望ましい。鉄筋等の構造部材、部材材料に関する情報は、構造情報として記憶部221に記憶されているため、画像や変状データと構造物内部の鉄筋の相対的な位置関係は、図面を介して求めることができる。
As another method for selecting a significant deformation, a composite deformation that combines multiple deformation data may be selected. As an example of a composite deformation, FIG. 5(d) shows a lattice-shaped
<探索範囲の設定>
S402にて、探索範囲設定部224は、重要変状に対応する変状を第2の変状データから探索する探索範囲を設定する。図6を参照して、この探索範囲を設定する方法を説明する。
<Search range setting>
In S402, the search
図6(a)は第1の変状データ611を示す図、図6(b)は第2の変状データ621を示す図である。それぞれの変状データは、ともに図面600上の同一位置に張り付けられている。第1の変状データ611のうち、実線で示す変状612,613を、重要変状選択部223により選択された重要変状とする。
Figure 6 (a) is a diagram showing the
探索範囲を設定する1つの方法として、重要変状の座標情報を用いて設定する方法がある。具体的には、第1の変状データ611上の重要変状612、613を囲む矩形範囲614、615を、各重要変状における探索範囲とする。探索範囲のサイズは、重要変状の座標情報を囲む矩形範囲であれば、任意のサイズに変更してもよい。例えば、重要変状を囲む矩形範囲を初期範囲とし、図面上のX軸およびY軸方向に任意のサイズ分拡張させた矩形範囲を探索範囲とする。
One method for setting the search range is to use the coordinate information of the important variations. Specifically, the rectangular ranges 614, 615 surrounding the
重要変状の座標情報のみを用いて探索範囲を決定した場合、探索範囲の境界付近で第2の変状データの一部が分断されてしまうことがある。図6(c)に、第2の変状データの一部の変状が分断される例として、第2の変状データ621の一部の領域631と、重要変状612の座標情報を用いて決定した探索範囲632を示す。図6(c)上の探索範囲632は、変状633、634を境界付近で分断してしまっている。第2の変状データを分断する探索範囲を設定した場合、後述するS403の整合度算出処理が複雑化してしまう。そこで、変状633、634の座標を全て含むように矩形範囲を拡張する。図6(d)に、拡張後の探索範囲635を示す。このように第2の変状データを分断しないように探索範囲を拡張することが好適な方法である。
When the search range is determined using only the coordinate information of the important deformation, a part of the second deformation data may be divided near the boundary of the search range. Figure 6 (c) shows a part of the
<整合度の算出>
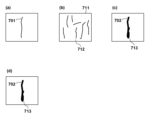
S403にて、整合度算出部225は、重要変状と探索範囲内の変状を用いて、整合度を算出する処理を行う。整合度を算出する1つの方法として、探索範囲内の1つの変状と重要変状の両方の形状をそれぞれまたは一方を膨張させ、変状同士の重なり度合いを整合度として算出する方法がある。図7を参照して、整合度算出処理の例を説明する。
<Calculation of consistency>
In S403, the
図7(a)は、第1の変状データの中から、重要変状選択部223により選択された重要変状701を示す図である。図7(b)は、第2の変状データのうち、重要変状701に対応する探索範囲に含まれる変状データ711を示す図である。整合度を算出するにあたり、まず、変状データ711の中から、変状712を参照変状候補として1つ選択する。次に、変状712と、重要変状701の形状を重ね合わせる処理を行う。このとき、第1の変状データと第2の変状データの間に含む位置ずれを考慮するため、変状の形状を膨張させてから重ね合わせる。図7(c)に、膨張させた重要変状702と膨張させた参照変状候補713を重ね合わせた状態を示す。そして、重要変状702、参照変状候補713の重複度合いを整合度として算出する。この整合度Cは、例えば次式(2)に従って算出する。
C={S1 Λ S2}/{S1 V S2} …(2)
式中、「Λ」は論理積、「V」は論理和を示す。また、パラメータS1は、膨張後の重要変状702の面積を示し、パラメータS2は、膨張後の参照変状候補713の面積を示す。式(2)より、変状同士が一致する場合は、整合度Cは1となり、変状同士が一切重なっていない場合には、整合度Cは0となる。すなわち、変状同士の重複度合いを整合度として算出する場合、整合度の取りうる範囲は0~1となる。
FIG. 7(a) is a diagram showing an
C={S 1 Λ S 2 }/{S 1 V S 2 }...(2)
In the formula, "Λ" indicates logical product and "V" indicates logical sum. Furthermore, parameter S1 indicates the area of the
式(2)を用いて整合度を1つ算出したのち、重要変状は固定のままで、探索範囲内の変状データの中から別の変状を次の参照変状候補に選択し、整合度を算出する。この整合度算出処理を繰り返すことで、探索範囲内のすべての変状データに対する整合度を算出する。 After calculating one consistency level using formula (2), the important variation is left fixed, and another variation is selected from the variation data within the search range as the next reference variation candidate, and the consistency level is calculated. By repeating this consistency level calculation process, the consistency levels for all variation data within the search range are calculated.
整合度を算出する他の方法として、変状データから算出した特徴量を用いてもよい。一例として、変状の面積重心座標を用いて整合度Cを算出する算出式を式(3)、(4)に示す。
C=1/{(S1x - S2x)2 + (S1y - S2y)2}1/2 …(3)
C=Cc …(4)
ここで、パラメータS1x,S1yは、重要変状の面積重心座標(S1x,S1y)を示し、パラメータS2x,S2yは、参照変状候補の面積重心座標(S2x,S2y)を示す。パラメータCcは、変状同士の面積重心座標が一致する場合の固定値であり、1より大きな任意の定数を指定する。式(3)より、変状同士の面積重心間距離が離れるほど、整合度Cは小さな値となる。反対に、変状同士の面積重心が一致する場合は、整合度が最も高い定数Ccとなる。
As another method for calculating the consistency, a feature calculated from the deformation data may be used. As an example, the formulas for calculating the consistency C using the area center coordinates of the deformation are shown in formulas (3) and (4).
C=1/{(S 1x - S 2x ) 2 + (S 1y - S 2y ) 2 } 1/2 ...(3)
C = C c ... (4)
Here, parameters S1x , S1y indicate the area centroid coordinates ( S1x , S1y ) of the important deformation, and parameters S2x , S2y indicate the area centroid coordinates ( S2x , S2y ) of the reference deformation candidate. Parameter Cc is a fixed value when the area centroid coordinates of the deformations match, and specifies an arbitrary constant greater than 1. According to formula (3), the greater the distance between the area centroids of the deformations, the smaller the consistency C becomes. Conversely, when the area centroids of the deformations match, the constant Cc has the highest consistency.
<参照変状の決定>
S404には、参照変状決定部226は、整合度の算出結果に基づいて、重要変状に対応する参照変状を決定する処理を行う。整合度を用いて参照変状を決定する例について、図8を参照して説明する。ここで、本実施形態で使用する整合度は、変状同士の重複度合いに基づいて算出した整合度とする。したがって、整合度の取りうる値の範囲は0~1であり、1に近い値ほど変状同士の整合関係が高いことを表している。
<Determination of reference deformation>
In S404, the reference
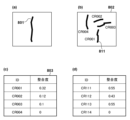
図8(a)と(b)は、整合度算出対象の重要変状801および重要変状801に対応する探索範囲内の変状データ802を示す図である。変状データ802上の各変状の近傍には、“CR”から始まる数字で構成されるIDが併記されている。図8(c)は、重要変状801と、変状データ802上の各変状(参照変状候補)のそれぞれに対して算出した整合度一覧803を示している。整合度に基づいて参照変状を決定する1つの方法として、整合度が最大の変状を参照変状として決定する。たとえば、図8(c)の整合度一覧803のうち、整合度が最大の変状(ID:CR001)を、参照変状に決定する。整合度一覧803のように、整合度の最大値が1つのみの場合には、整合度を用いて、参照変状を一意に決定することができる。
8(a) and (b) are diagrams showing an
一方、図8(d)のように、整合度が最大値の変状が複数あると、参照変状を一意に決定することができない。このような場合は、整合度が最大となった複数の変状と、重要変状とを示す画像データを生成して表示部205に表示させ、ユーザに参照変状を決定させるのが望ましい。
On the other hand, as in FIG. 8(d), if there are multiple variations with the highest consistency, it is not possible to uniquely determine the reference variation. In such a case, it is desirable to generate image data showing the multiple variations with the highest consistency and the important variation, display them on the
整合度算出結果において、整合度の最大値が0に近い値(例:0.1)となる場合がある。このとき、整合度に基づいて参照変状を一意に決定することはできるが、そもそも参照変状として適切でない可能性が高い。このような場合は、算出した整合度の最大値が所定の基準値(例:0.2)よりも低い場合に、整合度の最大値とともに参照変状と重要変状とを示す画像データを生成し、表示部205に表示してユーザに参照変状を確認・修正・選択させることが望ましい。
In the consistency calculation result, the maximum consistency value may be close to 0 (e.g., 0.1). In this case, the reference deformation can be uniquely determined based on the consistency, but there is a high possibility that it is not appropriate as a reference deformation in the first place. In such a case, if the calculated maximum consistency value is lower than a predetermined reference value (e.g., 0.2), it is desirable to generate image data showing the reference deformation and important deformation along with the maximum consistency value, display it on the
算出した整合度がいずれも0の場合や、ユーザ確認の結果参照変状が指定されなかった場合は、「重要変状に対応する参照変状なし」と決定する。この場合、後述するS405の進行度算出処理において、重要変状自体が進行したと判定される。なお、S404において、整合度に基づいて参照変状を決定する例を説明したが、これに限られない。例えば、第2の画像に含まれる変状のうち重要変状の座標上の位置と最も距離が短い変状を参照変造として決定する構成としてもよい。また、ユーザの選択に基づいて参照変造として決定する構成としてもよい。 If all the calculated consistency levels are 0 or if the user has not specified a reference anomaly, it is determined that there is no reference anomaly corresponding to the important anomaly. In this case, in the progress level calculation process in S405 described later, it is determined that the important anomaly itself has progressed. Note that, although an example of determining the reference anomaly based on the consistency level in S404 has been described, this is not limiting. For example, the anomaly that is the closest to the coordinate position of the important anomaly among the anomalies contained in the second image may be determined as the reference anomaly. Alternatively, the reference anomaly may be determined based on the user's selection.
<進行度の算出>
S405にて、進行度算出部227が、重要変状と参照変状を用いて、重要変状に対する進行度を算出する。本実施形態では、変状データの属性値の差を進行度として求める処理を行う。例えば、変状種別がひび割れの場合、最大幅や総延長の差分を算出する。ひび割れの最大幅や総延長は、記憶部221に格納されている。したがって、重要変状と参照変状のそれぞれで最大幅と総延長を取得し、変状間で差を求めることにより、重要変状に対する進行度を算出することができる。変状種別がひび割れ以外の場合も、同様の方法で進行度を算出することができる。例えば、変状種別が鉄筋露出の場合、面積の差分を進行度として算出する。変状データの面積は、属性値として記憶部221に格納されている。したがって、重要変状と参照変状の面積を取得し、変状間で面積差を求めることにより進行度を算出することができる。なお、S405にて、変状の経年変化の状態を示す情報として進行度を判定する構成を例示したが、これに限られない。例えば、S405にて、情報処理装置200は、経年変化の状態を示す情報として、「進行している」、「進行していない」などの2値の情報を求める構成としてもよい。
<Calculation of progress>
In S405, the
そして、S406にて、進行度算出部227は、算出した進行度を表示部205に出力し、算出した進行度を表示し、ユーザに進行度を示すことになる。進行度の表示形式は特に問わないが、進行度を表す数値を表示しても良いし、進行度に応じた色で変状データを色分けして表示しても良い。
Then, in S406, the
<第1の実施形態の変形>
ここまで第1の実施形態では、第1の変状データから重要変状を選択し、第2の変状データから重要変状に対応する参照変状を求めて進行度を算出する方法を説明したが、第2の変状データから重要変状を選択する実施形態も考えられる。すなわち、過去の点検結果に対応する第2の変状データの中から重要変状を選択し、第1の変状データから重要変状に対応する参照変状を求め、進行度を算出する。これにより、例えば、過去の点検結果における健全度の判断で重視した変状がどのように進行したかを確認することができる。
<Modification of the first embodiment>
In the first embodiment, a method for selecting a significant deformation from the first deformation data, obtaining a reference deformation corresponding to the significant deformation from the second deformation data, and calculating the degree of progress has been described, but an embodiment in which a significant deformation is selected from the second deformation data is also conceivable. That is, a significant deformation is selected from the second deformation data corresponding to the past inspection results, a reference deformation corresponding to the significant deformation is obtained from the first deformation data, and the degree of progress is calculated. This makes it possible to check, for example, how the deformation that was emphasized in determining the soundness of the past inspection results has progressed.
以上説明した第1の実施形態によれば、異なる時期に撮影した画像から検出したひび割れ等の変状が多数存在している場合であっても、健全度の判断で重視する変状に限定することにより、効率的に進行度を算出することができる。 According to the first embodiment described above, even if there are many abnormalities such as cracks detected from images taken at different times, the degree of progression can be efficiently calculated by limiting the abnormalities to those that are important in determining the soundness.
[第2の実施形態]
第1の実施形態では、多数の変状の中から一部の重要な変状の進行度を求める例を説明した。構造物の健全度を判断するにあたり、一部の変状の進行度に加え、全体的な変状の進行傾向を確認したい場合がある。しかし、一部の変状のみの進行度から全体的な変状の進行傾向を把握することは難しい。そこで、第2の実施形態では、一部の変状の進行度に加えて、小領域毎の変状データの進行度を算出する例を説明する。具体的には、画像を分割して、分割領域毎に変状データをグループ化してグループ単位で進行度を算出する。これにより、一部の変状の進行度と、全体的な変状の進行度の両方を確認しながら構造物や部材の健全度を判断することができる。以下、第1の実施形態との差分を中心に、第2の実施形態を説明する。
Second Embodiment
In the first embodiment, an example of determining the degree of progress of some important deformations from among a large number of deformations has been described. In determining the soundness of a structure, in addition to the degree of progress of some deformations, it may be desired to check the overall trend of deformation. However, it is difficult to grasp the overall trend of deformation from the degree of progress of only some deformations. Therefore, in the second embodiment, an example of calculating the degree of progress of deformation data for each small area in addition to the degree of progress of some deformations is described. Specifically, an image is divided, and deformation data is grouped for each divided area to calculate the degree of progress for each group. This makes it possible to determine the soundness of a structure or member while checking both the degree of progress of some deformations and the degree of progress of the overall deformation. Hereinafter, the second embodiment will be described, focusing on the difference from the first embodiment.
第2の実施形態に係る情報処理装置200のハードウェア構成は、図2(a)に示した第1の実施形態の構成に準じるため、説明を省略する。図9は、第2の実施形態の構成に係る情報処理装置200の機能ブロック図の一例を示す図である。第2の実施形態の構成は、第1の実施形態の図2(b)の構成に、第1グループ設定部901、第2グループ設定部902が追加したものである。第1グループ設定部901は、CPU201の機能部であって、第1の変状データの一部をグループ化して第1の変状グループを作成する。第2グループ設定部902は、CPU201の機能部であって、第1の変状グループに対応する第2の変状グループを作成する。なお、進行度算出部227は、一部の変状の進行度を算出する処理に加えて、第1の変状グループと第2の変状グループを用いて、変状グループ単位の進行度を算出する処理を行う。
The hardware configuration of the
図10は、第2の実施形態に係る情報処理装置200が実行するメイン処理の一部を示すフローチャートである。図10のフローチャートにおいて、第1の実施形態で説明した図4のフローチャートと同じ番号を付したステップでは、第1の実施形態と同様の処理が実行されるものと理解されたい。第2の実施形態の場合、S405で重要変状の進行度を算出した後、処理はS1001へ進む。
Figure 10 is a flowchart showing part of the main processing executed by the
S1001にて、第1グループ設定部901は、第1の変状データから第1の変状グループを設定する処理を行う。続くS1002にて、第2グループ設定部902が、第1の変状グループに対応する第2の変状グループを設定する。その後、S1003へ進み、第1の変状グループと第2の変状グループを用いて、変状グループの進行度を算出する。変状グループの進行度として、例えば、変状グループ内の変状の個数や変状の総延長を集計し、変状グループ間の集計データの差分を進行度とする。その後、S406にて、進行度算出部227は、算出された進行度を表示部205に表示する処理を行い、本終了する。
In S1001, the first
<第1グループの設定および第2グループの設定>
続いて、図11を参照して、S1001の第1の変状グループの設定、S1002の第2の変状グループの設定を、順に説明する。本第2の実施形態における変状データは、第1の実施形態と同様に、構造物表面のひび割れとする。また、第1の画像と第2の画像、およびそれぞれの画像に対応する変状データは、すべて同一図面の同一位置に張り付けられている。図11(a)は、第1の画像1101、同図(b)は第1の画像1101に含まれる変状を示す第1の変状データ1102を示している。また、図11(c)は第2の画像1121、図11(d)は、第2の画像1121に含まれる変状を示す第2の形状データ1122を示している。
<First group setting and second group setting>
Next, the setting of the first deformation group in S1001 and the setting of the second deformation group in S1002 will be described in order with reference to FIG. 11. The deformation data in this second embodiment is cracks on the surface of the structure, as in the first embodiment. The first image, the second image, and the deformation data corresponding to each image are all pasted at the same position on the same drawing. FIG. 11(a) shows a
S1001の処理では、第1グループ設定部901は、第1の変状データから第1の変状グループを設定する。第1の変状グループを設定する方法として、第1の画像を分割し、分割領域毎に第1の変状データをグループ化する例を説明する。まず、第1グループ設定部901は、第1の画像1101を任意の固定サイズで分割する。格子状の線分1111は、第1の画像1101をX軸、Y軸方向に等間隔で分割する線分であり、例えば1,024pixel間隔で分割する。次に、第1グループ設定部901は、分割領域のうち、斜線で囲われた領域1112を1つ選択し、領域1112の左上頂点座標1113と領域サイズを取得する。そして、第1グループ設定部901は、第1の変状データ1102上で、領域1112と同一位置および同一サイズの斜線領域1114を設定する。その後、斜線領域1114に含まれる変状データをグループ化して、第1の変状グループ1115とする。以上の処理を分割領域毎に繰り返すことにより、全体にわたって第1の変状グループを設定することができる。ここで、第1の画像1101を分割する方法として等間隔に分割する例を説明したが、任意の間隔で分割してもよい。例えば、X軸方向に1,024pixel、Y軸方向に512pixel間隔で分割して、長方形の領域単位で第1の変状グループを作成してもよい。
In the process of S1001, the first
続くS1002の処理で、第2グループ設定部902は、第1の変状グループに対応する第2の変状グループを設定する。第2の変状グループを設定する方法として、例えば、第1の変状グループと同一位置および同一範囲の領域に含まれる第2の変状データをグループ化する方法がある。ここで、第1の変状グループ1115に対応する第2の変状グループを設定する例を説明する。まず、第2グループ設定部902は、斜線領域1114の左上頂点座標1116と領域サイズを取得する。次に、第2グループ設定部902は、図11(d)の第2の変状データ1122上で、斜線領域1114と同一位置および同一範囲の斜線領域1131を設定する。そして、斜線領域1131に含まれる第2の変状データをグループ化して、第2の変状グループ1132とする。このように、同一位置、同一範囲内の変状データのグループ同士を対応付けることで、第2の変状グループを設定することができる。
In the subsequent process of S1002, the second
通常、異なる時期の撮影では撮影条件が異なるため、同一構造物の同一壁面を撮影した場合であっても、第1の画像と第2の画像の各画素の間には位置ずれを含む。したがって、第1の変状データと第2の変状データの間にも位置ずれが含まれる。上記の例は、この位置ずれを無視して、簡易的に第1の変状グループと第2の変状グループを作成する例である。変状グループ間の変状の進行度は、大まかな進行の傾向をとらえることを目的とするため、厳密に変状グループ間の対応を取らなくても良い。このように簡易的に第1の変状グループと第2の変状グループを作成する方法では、グループ作成の処理が簡易となる。 Normally, since the shooting conditions are different when photographing at different times, even when the same wall surface of the same structure is photographed, there is a positional shift between each pixel of the first image and the second image. Therefore, there is also a positional shift between the first deformation data and the second deformation data. The above example is an example of simply creating the first deformation group and the second deformation group, ignoring this positional shift. The degree of deformation between the deformation groups is intended to capture the general trend of progression, so there is no need to strictly correspond between the deformation groups. This method of simply creating the first deformation group and the second deformation group simplifies the group creation process.
一方、変状グループ間の対応関係を求めるときに、位置ずれを考慮するようにしても良い。画像間の位置ずれを取得する方法の一例として、画像特徴量を用いて領域毎の位置ずれを取得する処理の概要を説明する。まず、第1の画像上の分割領域を1つ選択し、領域内の部分画像を取得する。次に、取得した部分画像を、第2の画像に重ね合わせ、各画素の輝度値差分の二乗和を算出する。この算出処理を、重ね合わせ位置をずらしながら繰り返し、算出結果が最小となる位置、すなわち、領域単位の位置ずれを求める。この処理を、第1の画像の分割領域毎に繰り返すことにより、画像間の位置ずれを、領域単位で全体にわたって取得することができる。ここで一例として、第1の変状グループから、位置ずれを反映させて第2の変状グループを設定した結果を図11(e)に示す。図11(e)は、第1の変状グループ1115から、位置ずれを補正して求めた第2の変状グループ1141を示す図である。このように、画像間の位置ずれを考慮した第2の変状グループを設定することができる。
On the other hand, when determining the correspondence between the deformation groups, the positional deviation may be taken into consideration. As an example of a method for obtaining the positional deviation between images, an outline of a process for obtaining the positional deviation for each region using image features will be described. First, one divided region on the first image is selected, and a partial image in the region is obtained. Next, the obtained partial image is superimposed on the second image, and the squared sum of the brightness value difference of each pixel is calculated. This calculation process is repeated while shifting the superposition position, and the position where the calculation result is the smallest, that is, the positional deviation in region units, is obtained. By repeating this process for each divided region of the first image, the positional deviation between images can be obtained throughout the entire region unit. Here, as an example, the result of setting the second deformation group by reflecting the positional deviation from the first deformation group is shown in FIG. 11(e). FIG. 11(e) is a diagram showing the
変状グループ間の位置ずれを取得する他の方法として、重要変状の座標情報に基づいて決定してもよい。例えば、第1変状グループ内に含まれる重要変状の少なくとも1つを選択し、重要変状の面積重心座標の平均を、位置ずれの始点とする。そして、選択した重要変状に対応する参照変状の面積重心座標の平均を位置ずれの終点とする。この始点と終点を結ぶベクトルを、第1の変状グループの位置ずれとする。このように、重要変状の位置ずれを変状グループ間の位置ずれに代用することで、位置ずれを考慮した第2の変状グループを効率的に求めることができる。 As another method of obtaining the positional deviation between deformation groups, it may be determined based on the coordinate information of the important deformation. For example, at least one of the important deformations included in the first deformation group is selected, and the average of the area centroid coordinates of the important deformation is set as the start point of the positional deviation. Then, the average of the area centroid coordinates of the reference deformation corresponding to the selected important deformation is set as the end point of the positional deviation. The vector connecting this start point and end point is set as the positional deviation of the first deformation group. In this way, by substituting the positional deviation of the important deformation for the positional deviation between deformation groups, the second deformation group that takes the positional deviation into consideration can be efficiently obtained.
<変状グループの進行度の算出処理>
S1003にて、進行度算出部227は、第1の変状グループと第2の変状グループから、変状グループ間の進行度を算出する。本実施形態では、変状グループ内の変状データを集計した集計データを用いて進行度を算出する。例えば、変状種別がひび割れの場合、第1の変状グループと第2の変状グループのそれぞれでひび割れ本数やひび割れ密度等を集計データとして求める。その後、進行度算出部227は、集計データの差を変状グループ間の進行度として算出する。
<Calculation process of the degree of progression of the deformation group>
In S1003, the
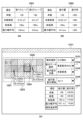
図12(a)、(b)は、変状種別がひび割れの場合の集計データ1201と変状グループ間の進行度1202の例を示している。集計データ1201は、第1の変状グループと第2の変状グループのそれぞれで、ひび割れの本数、本数密度、総延長、最大幅平均を集計した結果である。集計データ1201のうち、本数は、変状グループ毎の変状データ個数をカウントすることで取得できる。本数密度は、変状データの個数に加え、変状グループの領域サイズと画像解像度を用いて算出することができる。総延長や最大幅平均は、変状グループ内の各変状データの持つ属性値を集計して算出することができる。進行度1202は、変状グループ間の集計データの差を求めることにより算出できる。
Figures 12 (a) and (b) show examples of aggregated
図12(c)に、一例として、第2の実施形態における進行度算出結果の可視化画面を示す。図12(c)は、ウインドウ1211上に、重要変状の進行度および領域毎の変状の進行度を可視化した可視化結果1212を表示する例である。可視化結果1212は、ひび割れの本数密度に係る進行度を可視化した結果であり、進行度の違いに応じて、領域毎に異なるパターンで表現している。可視化結果1212では、パターン密度の高い領域ほど進行度の高い領域であることを表現しているが、進行度に応じて領域毎に異なる輝度や異なる色で表現するのが好適な表示方法である。図12(c)上のひび割れ1221、1222は、重要変状を示しており、重要変状の近傍には、進行情報1123のように、ひび割れ近傍に進行度に係る情報を併記している。このように、領域毎の進行度と重要変状の進行度を同時に表示することにより、重要変状の進行度と変状の全体的な進行傾向をユーザは確認しやすい。
12(c) shows an example of a visualization screen of the progress calculation result in the second embodiment. FIG. 12(c) shows an example of displaying a visualization result 1212 in which the progress of the important deformation and the progress of the deformation for each area are visualized on a
可視化画面において、ユーザが進行度の可視化内容を切り替えられることが望ましい。例えば、種別選択項目1213のユーザによる選択に合わせて、CPU201は、可視化結果1212における進行度表示対象の変状データを切り替える。ユーザによる表示データ選択項目1214の切り替えに応じて、CPU201は、可視化結果1212における変状データの表示対象(例:重要変状のみ表示、すべての変状を表示)を切り替える。ユーザによる進行表示対象項目1215の切り替えに応じて、CPU201は、可視化結果1212における進行度の表示対象(例:本数密度、総延長、最大幅平均)を切り替える。このように、ユーザが確認したい内容を切り替えられるようにするのが好適な方法である。また、重要変状の進行度や領域単位の進行度を詳細に確認できることが望ましい。例えば、進行度表示領域選択1216による選択や、マウス1224を用いたクリック操作により、領域を選択する。その領域選択に応じて、詳細な進行情報を表示する。例えば、図12(c)では、選択中の領域「A4-2」に対応する進行情報を、進行結果1217に表示している。
It is desirable for the user to be able to switch the visualization content of the progress on the visualization screen. For example, in accordance with the user's selection of the
以上、第2の実施形態によれば、一部の変状の進行度に加えて、領域単位の変状の進行度を算出することができる。これにより、全ての変状データについて、過去の変状データと個々の整合性を判定することなく、全体的な変状の進行度を判定することができるようになる。且つ、重要な変状データについては、ひび割れ幅の変化量など、過去の変状データからの進行度を詳細に把握できるようになる。 As described above, according to the second embodiment, in addition to the degree of progression of a portion of the deformation, the degree of progression of the deformation on an area-by-area basis can be calculated. This makes it possible to determine the overall degree of progression of the deformation for all deformation data without determining the consistency of each piece with past deformation data. Furthermore, for important deformation data, it becomes possible to grasp the degree of progression in detail from past deformation data, such as the amount of change in crack width.
[第3の実施形態]
第2の実施形態では、一部の変状の進行度に加え、領域単位で変状の進行度を算出する例を説明した。構造物の劣化状況は、様々な要因により、部位ごとに大きく異なる。そのため、一部の部位で変状の進行度を詳細に確認したい場合がある。しかし、固定領域サイズで変状の進行度を算出する場合、進行度を詳細に把握するためには、領域サイズを小さくする必要があり、処理時間が大幅に増加してしまう。そこで、第3の実施形態では、部位ごとに異なる領域サイズで変状の進行度を算出する例を説明する。部位に応じて変状をグループ化する領域サイズを変更することにより、処理時間の増加を抑制しつつ、特定の部位の変状の進行度を詳細に把握することができる。以下、第2の実施形態との差分を中心に、本第3の実施形態を説明する。
[Third embodiment]
In the second embodiment, an example of calculating the degree of progress of the deformation in units of regions in addition to the degree of progress of some of the deformations has been described. The deterioration state of a structure varies greatly from part to part due to various factors. Therefore, there are cases where it is desired to check the degree of progress of the deformation in detail in some parts. However, when calculating the degree of progress of the deformation with a fixed region size, it is necessary to reduce the region size in order to grasp the degree of progress in detail, which significantly increases the processing time. Therefore, in the third embodiment, an example of calculating the degree of progress of the deformation with different region sizes for each part will be described. By changing the region size for grouping the deformations according to the part, it is possible to grasp the degree of progress of the deformation in a specific part in detail while suppressing the increase in processing time. Hereinafter, the third embodiment will be described, focusing on the difference from the second embodiment.
第3の実施形態に係る情報処理装置200のハードウェア構成は、図2(a)に示した第1の実施形態の構成に準じるため、説明を省略する。図13は、第3の実施形態の構成に係る情報処理装置200の機能ブロック図の一例を示す図である。本第3の実施形態は、第2の実施形態で示した構成(図9)に、分割サイズ取得部1301を追加した構成となる。分割サイズ取得部1301は、CPU201の機能部であって、第1の変状データの一部をグループ化する範囲のサイズを取得する。
The hardware configuration of the
図14は、第3の実施形態に係る情報処理装置200が実行するメイン処理の一部を示すフローチャートである。図14のフローチャートにおいて、第2の実施形態で説明した図10のフローチャートと同じ番号を付したステップでは、第2の実施形態と同様の処理が実行されるものと理解されたい。本第3の実施形態の場合、S405にて、重要変状の進行度を算出した後、処理はS1401へ進む。
Figure 14 is a flowchart showing part of the main processing executed by the
S1401にて、分割サイズ取得部1301で取得した分割サイズに基づいて、第1グループ設定部901が、第1の変状データを分割して第1の変状グループを設定する処理を行う。続くS1002にて、第2グループ設定部902が、第1の変状グループに対応する第2の変状グループを設定する。その後、S1003へ進み、進行度算出部227が、第1の変状グループと第2の変状グループを用いて、変状グループの進行度を算出する。その後、S406には、進行度算出部227が、進行度算出結果を表示部205に表示させ、本処理を終了する。
In S1401, the first
<異なるサイズの第1グループ設定>
図15を参照して、S1401における異なるサイズで第1の変状グループを設定する処理を説明する。本実施形態における変状データは、第2の実施形態と同様に、構造物表面のひび割れとする。
<First group setting of different sizes>
The process of setting the first deformation groups with different sizes in S1401 will be described with reference to Fig. 15. The deformation data in this embodiment is set to cracks on the surface of a structure, similar to the second embodiment.
S1401にて、第1グループ設定部901は、分割サイズ取得部1301により取得した分割サイズに基づいて第1の変状データを分割し、分割領域毎に第1の変状グループを設定する。第1の変状データの分割サイズを決定する方法として、構造情報に基づいて分割サイズを決定する方法がある。図15(a)に、橋梁の部位毎の異なる分割サイズ一覧1501の例を示す。分割サイズ一覧1501を用いて第1の変状データを分割する例を図15(b)、(c)に示す。図15(b)は、橋梁の床版画像に対応する第1の変状データ1502と、格子状の分割線1511を示す図である。図15(b)上の斜線領域1512のサイズは、512pixel×512pixelである。また、図15(c)は、橋梁の橋脚画像に対応する第1の変状データ1503と、格子状の分割線1521を示す図である。図15(c)上の斜線領域1522のサイズは、1,024pixel×1,024pixelである。各変状データと構造情報との対応関係は、図面を介して求めることができる。したがって、構造情報を用いることにより、特定の部位のみ変状の進行度を詳細に求めることができる。分割サイズ一覧1501に示すような分割サイズを決定する方法として、実験的に求めた値を使用してもよいし、ユーザが指定した分割サイズを使用してもよい。
In S1401, the first
第1の変状データの分割サイズを決定する他の方法として、変状の分布状況に基づいて決定してもよい。具体的には、第1の変状データにおいて、あらかじめ変状の分布状況(密度)を求めておく。そして、変状の分布状況に応じて、異なるサイズで第1の変状データを分割する。図15(d)に、第1の変状データ1531を変状の分布状況に合わせて異なるサイズで分割した例を示す。第1の変状データ1531において、変状が密集している中央付近の分割サイズは小さく、変状が疎な端付近の分割サイズは大きい。このように、変状の分布状況に基づいて分割サイズを変更することにより、例えば、変状が密集している箇所のみ変状の進行度を詳細に求めることができる。
As another method for determining the division size of the first deformation data, it may be determined based on the distribution of deformations. Specifically, the distribution (density) of deformations is determined in advance in the first deformation data. Then, the first deformation data is divided into different sizes according to the distribution of deformations. FIG. 15(d) shows an example in which the
第1の変状データの分割サイズを決定する他の方法として、重要変状に基づいて決定してもよい。例えば、第1の変状データの分割サイズを、重要変状近傍では小さく、重要近傍から離れた位置では大きくする。重要変状周辺の変状の進行度を詳細に把握することにより、重要変状の構造物機能に対する影響度合いや、重要変状の今後の進行可能性を判断しやすくすることができる。 As another method for determining the division size of the first deformation data, it may be determined based on the significant deformation. For example, the division size of the first deformation data may be small near the significant deformation and large at a location away from the significant deformation. By grasping the degree of progression of the deformation around the significant deformation in detail, it becomes easier to determine the degree of impact of the significant deformation on the function of the structure and the possibility of the significant deformation progressing in the future.
第1の変状データの分割サイズを決定する他の方法として、複数の異なるサイズで繰り返し分割(多重分割レベルで分割)して、分割サイズの異なる複数の第1の変状グループを作成してもよい。例えば、第1の変状データ全体を、3パターンの分割レベル(1,024pixel×1,024pixel、512pixel×512pixel、256×256pixel)でそれぞれ分割し、各分割レベルで第1の変状グループを設定する。そして、詳細な処理は省略するが、分割領域毎に変状の進行度を算出する。このように多重分割レベルで第1の変状データを分割することにより、変状の進行度を確認するユーザ作業において、狭い範囲の詳細な進行度と、広範囲な大まかな進行度を容易に切り替えることができるようになる。なお、多重分割レベルで分割する第1の変状データの範囲は、分割レベル毎に任意の範囲に限定してもよい。例えば、1つ目の分割レベル(1,024pixel×1,024pixel)では、第1の変状データ全体を分割し、2つ目の分割レベル(256×256pixel)では、第1の変状データ上の重要変状近傍のみ分割する。分割レベル毎に第1の変状データの範囲を限定することにより、進行度算出にかかる時間の増加を抑制しつつ、特定の範囲のみ詳細な進行度を確認できるようになる。 As another method for determining the division size of the first deformation data, it is possible to repeatedly divide the data into a plurality of different sizes (division at multiple division levels) to create a plurality of first deformation groups with different division sizes. For example, the entire first deformation data is divided into three division levels (1,024 pixels x 1,024 pixels, 512 pixels x 512 pixels, 256 x 256 pixels), and a first deformation group is set at each division level. Then, although detailed processing is omitted, the degree of deformation is calculated for each divided area. By dividing the first deformation data at multiple division levels in this way, it becomes possible to easily switch between a narrow range of detailed progress and a wide range of rough progress in the user's work of checking the degree of deformation. Note that the range of the first deformation data divided at multiple division levels may be limited to an arbitrary range for each division level. For example, at the first division level (1,024 pixels x 1,024 pixels), the entire first deformation data is divided, and at the second division level (256 x 256 pixels), only the area near the major deformation on the first deformation data is divided. By limiting the range of the first deformation data for each division level, it becomes possible to check the detailed degree of progress only in a specific range while suppressing the increase in the time required for calculating the degree of progress.
以上、第3の実施形態によれば、処理時間の大幅な増加を抑制しつつ、特定部位の変状の進行度を詳細に算出することができる。 As described above, according to the third embodiment, it is possible to calculate the degree of progression of a specific area in detail while preventing a significant increase in processing time.
なお、上記実施形態では、理解を容易にするため構造物として橋梁を例にして説明したが、構造物の種類はこれに限らず、他の構造物(例えばビル、ダム等)であっても構わない。 In the above embodiment, a bridge has been used as an example of a structure to facilitate understanding, but the type of structure is not limited to this and may be other structures (e.g., buildings, dams, etc.).
(その他の実施例)
本発明は、上述の実施形態の1以上の機能を実現するプログラムを、ネットワーク又は記憶媒体を介してシステム又は装置に供給し、そのシステム又は装置のコンピュータにおける1つ以上のプロセッサーがプログラムを読出し実行する処理でも実現可能である。また、1以上の機能を実現する回路(例えば、ASIC)によっても実現可能である。
Other Examples
The present invention can also be realized by a process in which a program for implementing one or more of the functions of the above-described embodiments is supplied to a system or device via a network or a storage medium, and one or more processors in a computer of the system or device read and execute the program. The present invention can also be realized by a circuit (e.g., ASIC) that implements one or more of the functions.
発明は上記実施形態に制限されるものではなく、発明の精神及び範囲から離脱することなく、様々な変更及び変形が可能である。従って、発明の範囲を公にするために請求項を添付する。 The invention is not limited to the above-described embodiment, and various modifications and variations are possible without departing from the spirit and scope of the invention. Therefore, the following claims are appended to disclose the scope of the invention.
221…記憶部、222…管理部、223…重要度選択部、224…探索範囲設定部、225…整合後算出部、226…参照変状決定部、227…進行度算出部 221...storage unit, 222...management unit, 223...importance selection unit, 224...search range setting unit, 225...post-matching calculation unit, 226...reference deformation determination unit, 227...progress calculation unit
Claims (13)
前記第1の画像の前記部分領域に含まれる第1の変状と前記第2の画像の前記部分領域に含まれる第2の変状とに基づいて、前記第1の変状から前記第2の変状についての進行度を表示するための表示データを生成する生成手段と、を備えることを特徴とする、情報処理装置。 a determination means for determining a partial area of a first image, which is an image of a structure at a first time, and determining a partial area in a second image, which is an image of the structure at a second time after the first time, that corresponds to the partial area of the first image;
an information processing device comprising: a generating means for generating display data for displaying a degree of progress from the first deformation to the second deformation based on a first deformation included in the partial area of the first image and a second deformation included in the partial area of the second image.
前記第1の画像の前記部分領域に含まれる第1の変状と前記第2の画像の前記部分領域に含まれる第2の変状とに基づいて、前記第1の変状から前記第2の変状についての進行度を表示するための表示データを生成する生成工程と、を備えることを特徴とする、情報処理装置の制御方法。 a determining step of determining a partial area of a first image, which is an image of a structure at a first time, and determining a partial area in a second image, which is an image of the structure at a second time after the first time, that corresponds to the partial area of the first image;
A control method for an information processing device, comprising: a generating process for generating display data for displaying a degree of progress from the first deformation to the second deformation based on a first deformation included in the partial area of the first image and a second deformation included in the partial area of the second image.
前記第1の時期とは異なる第2の時期における前記構造物の画像である第2の画像に含まれる複数の変状の中から前記選択手段により選択された前記変状に対応する変状を決定する決定手段と、
前記選択手段により選択された変状と前記決定手段により決定された変状とに基づいて、前記選択された変状または前記決定された変状についての進行度を表示するための表示データを生成する生成手段と、を備えることを特徴とする、情報処理装置。 A selection means for selecting a part of the deformations among the multiple deformations included in a first image, which is an image of the structure at a first time, based on at least one of the information on the deformation, the information on the structure, and the information on two or more deformations;
A determination means for determining a deformation corresponding to the deformation selected by the selection means from among a plurality of deformations included in a second image, which is an image of the structure at a second time different from the first time;
An information processing device comprising: a generating means for generating display data for displaying a degree of progress of the deformation selected by the selection means or the deformation determined by the determining means based on the deformation selected by the selection means or the deformation determined by the determining means.
前記第1の時期とは異なる第2の時期における前記構造物の画像である第2の画像に含まれる複数の変状の中から前記選択工程により選択された前記変状に対応する変状を決定する決定工程と、
前記選択工程により選択された変状と前記決定工程により決定された変状とに基づいて、前記選択された変状または前記決定された変状についての進行度を表示するための表示データを生成する生成工程と、を備えることを特徴とする、情報処理装置の制御方法。 A selection process of selecting some of the deformations included in a first image, which is an image of the structure at a first time, based on at least one of the information on the deformation, the information on the structure, and the information on two or more deformations;
A determination process for determining a deformation corresponding to the deformation selected by the selection process from among a plurality of deformations included in a second image, which is an image of the structure at a second time different from the first time;
A control method for an information processing device, comprising: a generation process for generating display data for displaying the progress of the selected deformation or the determined deformation based on the deformation selected in the selection process and the deformation determined in the determination process.
Priority Applications (1)
| Application Number | Priority Date | Filing Date | Title |
|---|---|---|---|
| JP2024155132A JP2024166300A (en) | 2020-09-29 | 2024-09-09 | Information processing device, control method for information processing device, and program |
Applications Claiming Priority (2)
| Application Number | Priority Date | Filing Date | Title |
|---|---|---|---|
| JP2020163886A JP7564671B2 (en) | 2020-09-29 | 2020-09-29 | Information processing device, control method, and program |
| JP2024155132A JP2024166300A (en) | 2020-09-29 | 2024-09-09 | Information processing device, control method for information processing device, and program |
Related Parent Applications (1)
| Application Number | Title | Priority Date | Filing Date |
|---|---|---|---|
| JP2020163886A Division JP7564671B2 (en) | 2020-09-29 | 2020-09-29 | Information processing device, control method, and program |
Publications (1)
| Publication Number | Publication Date |
|---|---|
| JP2024166300A true JP2024166300A (en) | 2024-11-28 |
Family
ID=80822284
Family Applications (2)
| Application Number | Title | Priority Date | Filing Date |
|---|---|---|---|
| JP2020163886A Active JP7564671B2 (en) | 2020-09-29 | 2020-09-29 | Information processing device, control method, and program |
| JP2024155132A Pending JP2024166300A (en) | 2020-09-29 | 2024-09-09 | Information processing device, control method for information processing device, and program |
Family Applications Before (1)
| Application Number | Title | Priority Date | Filing Date |
|---|---|---|---|
| JP2020163886A Active JP7564671B2 (en) | 2020-09-29 | 2020-09-29 | Information processing device, control method, and program |
Country Status (2)
| Country | Link |
|---|---|
| US (2) | US11898966B2 (en) |
| JP (2) | JP7564671B2 (en) |
Families Citing this family (2)
| Publication number | Priority date | Publication date | Assignee | Title |
|---|---|---|---|---|
| JP7564671B2 (en) * | 2020-09-29 | 2024-10-09 | キヤノン株式会社 | Information processing device, control method, and program |
| JP7466588B2 (en) * | 2022-06-17 | 2024-04-12 | 三菱電機株式会社 | Analysis system, analysis method, and analysis program |
Citations (6)
| Publication number | Priority date | Publication date | Assignee | Title |
|---|---|---|---|---|
| WO2017216943A1 (en) * | 2016-06-17 | 2017-12-21 | 三菱電機株式会社 | State change progress determination device and state change progress determination method |
| JP2019020220A (en) * | 2017-07-14 | 2019-02-07 | 公益財団法人鉄道総合技術研究所 | Image processing apparatus, image processing method, and program |
| JP2019211277A (en) * | 2018-06-01 | 2019-12-12 | 富士フイルム株式会社 | Device and method for determining crack change |
| JP2020096325A (en) * | 2018-12-14 | 2020-06-18 | キヤノン株式会社 | Information processor, control method of information processor, and program |
| JP6749528B1 (en) * | 2020-01-31 | 2020-09-02 | 三菱電機株式会社 | Defect management device, modification management method, and modification management program |
| JP2022056085A (en) * | 2020-09-29 | 2022-04-08 | キヤノン株式会社 | Information processing equipment, information processing methods, and programs |
Family Cites Families (26)
| Publication number | Priority date | Publication date | Assignee | Title |
|---|---|---|---|---|
| DE4037934C2 (en) * | 1990-11-23 | 1993-11-25 | Mannesmann Ag | Method and device for measuring deformations on test specimens in testing machines |
| JPH11132961A (en) * | 1997-10-29 | 1999-05-21 | Nikon Corp | Inspection equipment for structures |
| KR101127796B1 (en) * | 2010-04-05 | 2012-03-23 | 노바테크 (주) | An Glass Substrate Crack Montoring Method and Unit |
| JP5852919B2 (en) * | 2012-05-14 | 2016-02-03 | 大成建設株式会社 | Crack detection method |
| DE102012107037B3 (en) * | 2012-08-01 | 2014-02-06 | Bundesrepublik Deutschland, vertreten durch das Bundesministerium für Wirtschaft und Technologie, dieses vertreten durch den Präsidenten der BAM, Bundesanstalt für Materialforschung und -prüfung | Crack detection and crack monitoring by means of luminescence |
| JP6363863B2 (en) | 2014-04-15 | 2018-07-25 | キヤノン株式会社 | Information processing apparatus and information processing method |
| JP6397226B2 (en) | 2014-06-05 | 2018-09-26 | キヤノン株式会社 | Apparatus, apparatus control method, and program |
| JP6426968B2 (en) | 2014-10-08 | 2018-11-21 | キヤノン株式会社 | INFORMATION PROCESSING APPARATUS AND METHOD THEREOF |
| JP6573354B2 (en) | 2014-11-28 | 2019-09-11 | キヤノン株式会社 | Image processing apparatus, image processing method, and program |
| JP6494331B2 (en) | 2015-03-03 | 2019-04-03 | キヤノン株式会社 | Robot control apparatus and robot control method |
| CN105510344B (en) * | 2015-11-24 | 2018-08-14 | 昆明理工大学 | Electric power pylon increases crack detecting method newly in a kind of region |
| JP2017122993A (en) * | 2016-01-05 | 2017-07-13 | キヤノン株式会社 | Image processor, image processing method and program |
| CN105910902A (en) * | 2016-05-11 | 2016-08-31 | 青岛理工大学 | Fractal analysis method for crack propagation path of concrete member |
| JP6740033B2 (en) | 2016-06-28 | 2020-08-12 | キヤノン株式会社 | Information processing device, measurement system, information processing method, and program |
| JP6833366B2 (en) * | 2016-07-06 | 2021-02-24 | キヤノン株式会社 | Information processing device, control method and program of information processing device |
| KR101866781B1 (en) * | 2016-11-21 | 2018-06-12 | 서해기술단 주식회사 | structure safety diagnosis system using drone |
| CN106770325B (en) * | 2016-12-19 | 2019-09-10 | 湖北省建筑科学研究设计院 | A kind of concrete structure member crevices automatic testing method |
| KR101793262B1 (en) * | 2017-09-08 | 2017-11-02 | 조현석 | Analysis system for occurrence and growth progression of crack |
| WO2019150799A1 (en) * | 2018-01-31 | 2019-08-08 | 富士フイルム株式会社 | Repair length determination method and repair length determination device |
| JP7030614B2 (en) * | 2018-05-25 | 2022-03-07 | 株式会社ブリヂストン | Tire condition management system and tire condition management program |
| WO2020110576A1 (en) | 2018-11-27 | 2020-06-04 | キヤノン株式会社 | Information processing device |
| JP7429648B2 (en) * | 2018-12-13 | 2024-02-08 | 富士フイルム株式会社 | Damage diagram creation support device, damage diagram creation support method, damage diagram creation support program, and damage diagram creation support system |
| CN109946296A (en) * | 2019-03-01 | 2019-06-28 | 威海华菱光电股份有限公司 | Crack change monitoring device and crack change monitoring method |
| KR102288311B1 (en) * | 2019-10-21 | 2021-08-10 | 한국도로공사 | System and method for detecting pothole sign of road pavement using electromagnetic wave, and a recording medium having computer readable program for executing the method |
| CN116710763A (en) * | 2021-01-14 | 2023-09-05 | 富士胶片株式会社 | Image analysis device, image analysis method and program |
| JP2024000324A (en) | 2022-06-20 | 2024-01-05 | キヤノン株式会社 | Information processing device, information processing method, and program |
-
2020
- 2020-09-29 JP JP2020163886A patent/JP7564671B2/en active Active
-
2021
- 2021-08-18 US US17/405,607 patent/US11898966B2/en active Active
-
2023
- 2023-12-28 US US18/398,260 patent/US12523616B2/en active Active
-
2024
- 2024-09-09 JP JP2024155132A patent/JP2024166300A/en active Pending
Patent Citations (6)
| Publication number | Priority date | Publication date | Assignee | Title |
|---|---|---|---|---|
| WO2017216943A1 (en) * | 2016-06-17 | 2017-12-21 | 三菱電機株式会社 | State change progress determination device and state change progress determination method |
| JP2019020220A (en) * | 2017-07-14 | 2019-02-07 | 公益財団法人鉄道総合技術研究所 | Image processing apparatus, image processing method, and program |
| JP2019211277A (en) * | 2018-06-01 | 2019-12-12 | 富士フイルム株式会社 | Device and method for determining crack change |
| JP2020096325A (en) * | 2018-12-14 | 2020-06-18 | キヤノン株式会社 | Information processor, control method of information processor, and program |
| JP6749528B1 (en) * | 2020-01-31 | 2020-09-02 | 三菱電機株式会社 | Defect management device, modification management method, and modification management program |
| JP2022056085A (en) * | 2020-09-29 | 2022-04-08 | キヤノン株式会社 | Information processing equipment, information processing methods, and programs |
Also Published As
| Publication number | Publication date |
|---|---|
| US11898966B2 (en) | 2024-02-13 |
| US12523616B2 (en) | 2026-01-13 |
| JP7564671B2 (en) | 2024-10-09 |
| US20220099588A1 (en) | 2022-03-31 |
| US20240151650A1 (en) | 2024-05-09 |
| JP2022056085A (en) | 2022-04-08 |
Similar Documents
| Publication | Publication Date | Title |
|---|---|---|
| JP2024166300A (en) | Information processing device, control method for information processing device, and program | |
| JP7624491B2 (en) | Inspection support device, method and program | |
| JP5145116B2 (en) | Surface defect data display management apparatus and surface defect data display management method | |
| JP7686381B2 (en) | Information processing device, information processing method, and program | |
| JP7429774B2 (en) | Damage evaluation device, method and program | |
| JP7344692B2 (en) | Information processing device, information processing method, and program | |
| CN101275917A (en) | Defect inspection device, graphic rendering device, and graphic rendering system | |
| JP7757380B2 (en) | Information processing device, server device, control method for information processing device, control method for server device, and program | |
| CN106169431B (en) | GPU-Based Mask and Wafer Defect Detection Method | |
| JP7131127B2 (en) | APPEARANCE INSPECTION SYSTEM, APPEARANCE INSPECTION RESULT DISPLAY METHOD AND APPEARANCE INSPECTION RESULT DISPLAY PROGRAM | |
| JP7654463B2 (en) | Information processing device, information processing method, and program | |
| JP7368288B2 (en) | Crack shape generator | |
| JP7479528B2 (en) | Image processing device, image processing method, and program | |
| EP4296956A1 (en) | Defect detection in partial images capturing an entire inspected infrastructure | |
| US20260049947A1 (en) | Information processing apparatus, information processing method, and non-transitory computer-readable storage medium | |
| JPH08184570A (en) | Flaw detection apparatus | |
| JP7152972B2 (en) | Inspection condition creation support device, inspection condition creation support method, inspection condition creation support program, and recording medium | |
| JP2024156382A (en) | Information processing device, information processing method, and program | |
| JP2025108242A (en) | Information processing device, information processing method, and program | |
| JP2023157303A (en) | Information processing device, information processing method and program | |
| JP2025095927A (en) | Information processing device, information processing method, and program | |
| JP2026004839A (en) | Information processing device, information processing method, and program | |
| JP2025089121A (en) | Information processing device, information processing method, and program | |
| CN121414648A (en) | Image processing apparatus, image processing method, and non-transitory computer-readable storage medium | |
| JP2024173421A (en) | Information processing device, system, method, and program |
Legal Events
| Date | Code | Title | Description |
|---|---|---|---|
| A621 | Written request for application examination |
Free format text: JAPANESE INTERMEDIATE CODE: A621 Effective date: 20240909 |
|
| A131 | Notification of reasons for refusal |
Free format text: JAPANESE INTERMEDIATE CODE: A131 Effective date: 20251107 |
|
| A521 | Request for written amendment filed |
Free format text: JAPANESE INTERMEDIATE CODE: A523 Effective date: 20251223 |