JP2023166300A - Analyzing method and device for composite material structure, and its program - Google Patents
Analyzing method and device for composite material structure, and its program Download PDFInfo
- Publication number
- JP2023166300A JP2023166300A JP2022077273A JP2022077273A JP2023166300A JP 2023166300 A JP2023166300 A JP 2023166300A JP 2022077273 A JP2022077273 A JP 2022077273A JP 2022077273 A JP2022077273 A JP 2022077273A JP 2023166300 A JP2023166300 A JP 2023166300A
- Authority
- JP
- Japan
- Prior art keywords
- composite material
- image set
- image
- dimensional
- region
- Prior art date
- Legal status (The legal status is an assumption and is not a legal conclusion. Google has not performed a legal analysis and makes no representation as to the accuracy of the status listed.)
- Pending
Links
Images


Landscapes
- Analysing Materials By The Use Of Radiation (AREA)
- Image Analysis (AREA)
Abstract
Description
本発明は、二種類以上の材料からなる複合材の表面もしくは断面の二次元画像の各画素に割り当てられたK次元ベクトルに基いて、複合材組織を解析する方法に関する。 The present invention relates to a method for analyzing the structure of a composite material based on a K-dimensional vector assigned to each pixel of a two-dimensional image of the surface or cross section of a composite material made of two or more types of materials.
複合材は複数の原材料を混合し、攪拌、加熱などの工程を経て形成される。複合材の特性は原材料の特性だけでなく、複合材組織にも依存するため、組織制御による特性向上の開発が進められている。複合材組織の解析では、表面もしくは断面像を顕微鏡で撮影し、得られた二次元画像の各画素に割り当てられた強度情報をもとに各画素にクラスを付けて領域分割し、各領域の形状的な特徴量を解析する。今回、各画素にK次元ベクトルが割り当てられた二次元画像を領域分割する技術を調査した結果、以下の先行技術が抽出された。 Composite materials are formed by mixing multiple raw materials and going through processes such as stirring and heating. Since the properties of composite materials depend not only on the properties of the raw materials but also on the structure of the composite material, efforts are being made to improve properties through structure control. In the analysis of composite material structures, a surface or cross-sectional image is photographed using a microscope, and each pixel is assigned a class and divided into regions based on the intensity information assigned to each pixel in the two-dimensional image obtained, and each region is divided into regions. Analyze geometric features. This time, as a result of investigating techniques for dividing a two-dimensional image into regions in which each pixel is assigned a K-dimensional vector, the following prior art was extracted.
特許文献1には、信号分析装置は、EDX装置等の測定装置で測定した二次元座標上のスペクトル分布から、複数の特定信号の強度分布を生成し、n個の特定信号の強度の組み合わせで定義されるn次元空間上のn次元座標点をEMアルゴリズムにより複数のクラスタに分類する技術が記載されている。
我々は、プロセス-複合材組織-複合材特性の関係を解析し、組織制御によって複合材特性を向上させる研究開発を進めている。 We are conducting research and development to improve the properties of composites by analyzing the relationship between process, composite structure, and properties of composites, and controlling the structure.
入力されたデータセットを幾つかのクラスに分類する方法としては、クラス分類とクラスタリングがある。クラス分類は事前に正解が決まっている属性を適切に付与する問題である。一方、クラスタリングはいくつかのかたまりにグループ分けする問題であり、絶対的な正解はない。最初に分類の仕方を指定できる場合はクラス分類を使い、データの分け方はわからないが、統計的な基準で整理したいときにはクラスタリングを使うことが推奨されている。 Class classification and clustering are methods for classifying input data sets into several classes. Class classification is a problem of appropriately assigning attributes for which the correct answer is determined in advance. On the other hand, clustering is a problem of grouping things into several groups, and there is no absolute correct answer. It is recommended to use class classification when you can specify the classification method first, and to use clustering when you do not know how to divide the data but want to organize it using statistical criteria.
各画素にK次元ベクトルが割り当てられた二次元画像を領域分割した教師画像を作成するには、ベクトル成分ごとにK枚の画像を作成し、作業者がK枚の画像を見比べながら各画素のクラスを決定する作業が必要になる。K枚の画像を見比べながら、共通の基準で教師画像を作成することは困難である。特許文献1では、作業者の主観を排したクラスタリングを実行することは困難である。特許文献1では、領域分割にクラスタリングを導入し、EMアルゴリズムの収束判定を用いて各画素のベクトルとクラスの対応付けを実行している。しかし、画像毎にクラスタリングを実行すると、収束判定された時のベクトルとクラスの対応が画像毎に違ってしまう。つまり、同じベクトルであっても、ある画像では1とクラス付けされるが、別の画像では2とクラス付けされるという現象が発生する。画像毎にベクトルとクラスの対応が異なると、領域分割画像間の比較が困難になる。つまり、プロセスを変えた試料の組織特徴の比較や、特性の異なる試料の比較を、領域分割画像では行えない。プロセス-複合材組織-複合材特性の関係を解析するという点について考慮されていない。
To create a teacher image in which a two-dimensional image in which each pixel is assigned a K-dimensional vector is segmented, K images are created for each vector component, and an operator compares the K images while dividing each pixel. Work is required to determine the class. It is difficult to create a teacher image using a common standard while comparing K images. In
本発明の目的は、同じ基準で領域分割された画像セットを作成することで、領域分割画像間の形状的な特徴量の違いを数値化して比較できるようにし、プロセス-複合材組織-複合材特性の関係を解析することである。 The purpose of the present invention is to create a set of images divided into regions based on the same criteria, so that differences in geometric features between region divided images can be quantified and compared. It is to analyze the relationship between characteristics.
上記課題を解決するための、本発明の「複合材組織の解析方法」の一例を挙げるならば、二種類以上の材料からなる複合材料の組織形状の解析方法であって、各画素にK次元ベクトルが割り当てられた二次元画像を複数枚含む画像セットを入力し、前記画像セットに含まれる二次元画像のK次元ベクトルをスタックしたデータセットを作成し、前記データセットをK次元ベクトルが類似したデータ点同士でクラスタリングしてクラスタリング結果を作成し(S3)、前記クラスタリング結果に基いて前記画像セットの各画素のK次元ベクトルをクラスに置換した領域分割画像セットを作成し、前記領域分割画像セットを出力する(S5)、複合材組織の解析方法である。 An example of the "method for analyzing the structure of a composite material" of the present invention to solve the above problems is a method for analyzing the structure shape of a composite material made of two or more types of materials, in which each pixel has K dimensions. An image set containing multiple two-dimensional images to which vectors are assigned is input, a dataset is created by stacking the K-dimensional vectors of the two-dimensional images included in the image set, and the dataset is stacked with similar K-dimensional vectors. Create a clustering result by clustering the data points (S3), create a region segmented image set in which the K-dimensional vector of each pixel of the image set is replaced with a class based on the clustering result, and create a region segmented image set based on the clustering result. This is a composite material structure analysis method that outputs (S5).
また、本発明の「複合材組織の解析装置」の一例を挙げるならば、各画素にK次元ベクトルが割り当てられた二次元画像を複数枚含む画像セットを入力する画像セット入力部と、前記画像セットに含まれる二次元画像のK次元ベクトルをスタックしたデータセットを作成する入力データセット作成部と、前記データセットをK次元ベクトルが類似したデータ点同士でクラスタリングしてクラスタリング結果を作成するクラスタリング結果作成部と、前記クラスタリング結果に基いて前記画像セットの各画素のK次元ベクトルをクラスに置換した領域分割画像セットを作成する領域分割画像セット作成部と、前記領域分割画像セットを出力する出力部と、を有する複合材組織の解析装置である。 Further, to give an example of the "composite material structure analysis device" of the present invention, an image set input section that inputs an image set including a plurality of two-dimensional images in which each pixel is assigned a K-dimensional vector; an input dataset creation unit that creates a dataset in which K-dimensional vectors of two-dimensional images included in the set are stacked; and a clustering result that creates a clustering result by clustering the dataset with data points with similar K-dimensional vectors. a creation unit, a region division image set creation unit that creates a region division image set in which the K-dimensional vector of each pixel of the image set is replaced with a class based on the clustering result, and an output unit that outputs the region division image set. This is a composite material structure analysis device having the following.
本発明によれば、領域分割の教師画像の作成が困難なK次元ベクトル画像でも、K次元ベクトルとクラスとの対応付けが統一された領域分割画像セットが得られるようになる。また、領域分割画像間の形状的な特徴量の違いを数値化して比較できるようになり、プロセス-複合材組織-複合材特性の関係解析が可能になる。そして、組織制御による複合材特性改善の研究・開発が加速される。 According to the present invention, even for a K-dimensional vector image for which it is difficult to create a teacher image for region segmentation, a region-divided image set in which the correspondence between K-dimensional vectors and classes is unified can be obtained. In addition, it becomes possible to quantify and compare the differences in geometric features between region-divided images, making it possible to analyze the relationship between process, composite material structure, and composite material properties. Research and development on improving composite material properties through microstructural control will be accelerated.
上記した以外の課題、構成および効果は、以下の実施形態の説明により明らかにされる。 Problems, configurations, and effects other than those described above will be made clear by the following description of the embodiments.
以下、本発明の実施の形態について、図面を用いて詳細に説明する。ただし、本発明は以下に示す実施の形態の記載内容に限定して解釈されるものではない。本発明の思想ないし趣旨から逸脱しない範囲で、その具体的構成を変更し得ることは当業者であれば容易に理解される。 Hereinafter, embodiments of the present invention will be described in detail using the drawings. However, the present invention should not be construed as being limited to the contents described in the embodiments shown below. Those skilled in the art will readily understand that the specific configuration can be changed without departing from the spirit or spirit of the present invention.
また、以下に説明する発明の構成において、同一部分又は同様な機能を有する部分には同一の符号を異なる図面間で共通して用い、重複する説明は省略することがある。 Furthermore, in the configuration of the invention described below, the same parts or parts having similar functions may be designated by the same reference numerals in different drawings, and redundant explanations may be omitted.
本明細書等における「第1」、「第2」、「第3」などの表記は、構成要素を識別するために付するものであり、必ずしも、数、順序、もしくはその内容を限定するものではない。また、構成要素の識別のための番号は文脈毎に用いられ、一つの文脈で用いた番号が、他の文脈で必ずしも同一の構成を示すとは限らない。また、ある番号で識別された構成要素が、他の番号で識別された構成要素の機能を兼ねることを妨げるものではない。
図面等において示す各構成の位置、大きさ、形状、範囲などは、発明の理解を容易にするため、実際の位置、大きさ、形状、範囲などを表していない場合がある。このため、本発明は、必ずしも、図面等に開示された位置、大きさ、形状、範囲などに限定されない。また、特にことわりが無ければ、画像は二次元画像を示す。
In this specification, etc., expressions such as "first,""second," and "third" are used to identify constituent elements, and do not necessarily limit the number, order, or content thereof. isn't it. Further, numbers for identifying components are used for each context, and a number used in one context does not necessarily indicate the same configuration in another context. Furthermore, this does not preclude a component identified by a certain number from serving the function of a component identified by another number.
The position, size, shape, range, etc. of each component shown in the drawings etc. may not represent the actual position, size, shape, range, etc. in order to facilitate understanding of the invention. Therefore, the present invention is not necessarily limited to the position, size, shape, range, etc. disclosed in the drawings or the like. Furthermore, unless otherwise specified, images represent two-dimensional images.
実施例1では本発明における複合材組織の解析工程の詳細を説明する。 In Example 1, details of the process of analyzing a composite material structure in the present invention will be explained.
図1に、本発明における解析方法のフローチャートを示す。本発明の好ましい一側面は、処理装置、記憶装置、入力装置、および出力装置を備える情報処理装置を用い、各画素にK次元ベクトルが割り当てられた二次元画像を複数枚含む第1の画像セットを入力し(S1)、第1の画像セットに含まれる二次元画像のK次元ベクトルをスタックした第1のデータセットを作成し(S2)、第1のデータセットをK次元ベクトルが類似したデータ点同士でクラスタリングして第1のクラスタリング結果を作成し(S3)、第1のクラスタリング結果に基いて第1の画像セットの各画素のK次元ベクトルをクラスに置換した第1の領域分割画像セットを作成し(S4)、第1の領域分割画像セットを出力する(S5)、複合材組織の解析方法である。以下、各工程の詳細を説明する。 FIG. 1 shows a flowchart of the analysis method in the present invention. A preferred aspect of the present invention uses an information processing device including a processing device, a storage device, an input device, and an output device to create a first image set including a plurality of two-dimensional images in which each pixel is assigned a K-dimensional vector. (S1), create a first dataset in which K-dimensional vectors of two-dimensional images included in the first image set are stacked (S2), and convert the first dataset into data with similar K-dimensional vectors. A first region segmented image set in which points are clustered to create a first clustering result (S3), and the K-dimensional vector of each pixel of the first image set is replaced with a class based on the first clustering result. This is a composite material structure analysis method, in which a first region-divided image set is created (S4) and a first region-divided image set is output (S5). The details of each step will be explained below.
<S1.第1の画像セット入力工程>
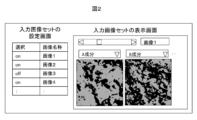
二次元画像の各画素にK次元ベクトルが割り当てられた第1の画像セットを入力する、画像セット入力工程を説明する。図2に、画像セット入力工程で使用するGUI(Graphical User Interface)の一例を示す。第1の入力画像セットの設定画面を用い、第1の入力画像セットに含まれる画像の名称を選択する。画像の各画素にはK次元ベクトル(A,B,C,…)が設定されている。画像名称が画像1の画像のA成分を割り当てた画像を画像1A、B成分を割り当てた画像を画像1Bと表記する。第1の入力画像セットの表示画面を用い、画像名称と成分名を指定して表示し、画像の内容を確認する。表示画面で確認した結果、入力画像セットから外したい画像があれば、入力画像セットの設定画面の選択をoffに設定し、入力画像セットから外すことが出来る。
<S1. First image set input process>
An image set input step of inputting a first image set in which a K-dimensional vector is assigned to each pixel of a two-dimensional image will be described. FIG. 2 shows an example of a GUI ( Graphical User Interface ) used in the image set input process. Using the first input image set setting screen, select the name of the image included in the first input image set. A K-dimensional vector (A, B, C, . . . ) is set for each pixel of the image. The image to which the A component of the image whose image name is
<S2.第1のデータセット作成工程>
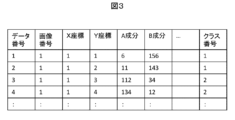
第1の画像セットに含まれる二次元画像のK次元ベクトルをスタックした第1のデータセットを作成する、第1のデータセット作成工程を説明する。二次元画像の各画素にK次元ベクトル(A,B,…)が割り当てられている第1の画像セットが入力された場合、図3に示すデータセットが作成される。列名には各画素が持つデータ、すなわち画像番号、X座標、Y座標、ベクトル成分(A成分、B成分、…)を設定する。また、データ番号とクラス番号が設定されている。入力データセット作成時にはクラス番号の列は空欄になっており、次のクラスタリング工程で得られたクラスタリング結果を格納する。
<S2. First dataset creation process>
A first data set creation step of creating a first data set in which K-dimensional vectors of two-dimensional images included in the first image set are stacked will be described. When a first image set in which each pixel of a two-dimensional image is assigned a K-dimensional vector (A, B, . . . ) is input, a data set shown in FIG. 3 is created. Data possessed by each pixel, that is, an image number, an X coordinate, a Y coordinate, and a vector component (A component, B component, . . . ) are set in the column name. Additionally, a data number and class number are set. When creating the input data set, the class number column is blank, and the clustering results obtained in the next clustering step are stored.
<S3.第1のクラスタリング結果作成工程>
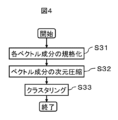
図4に、第1のデータセットをK次元ベクトルが類似したデータ点同士でクラスタリングして第1のクラスタリング結果を作成する工程のフローチャートを示す。クラスタリング(S33)を実行する前に、各ベクトル成分の規格化(S31)と、ベクトル成分の次元圧縮(S32)をおこなう。
<S3. First clustering result creation process>
FIG. 4 shows a flowchart of a process of creating a first clustering result by clustering the first data set using data points having similar K-dimensional vectors. Before performing clustering (S33), each vector component is normalized (S31) and the dimensions of the vector component are compressed (S32).
各ベクトル成分の規格化(S31)は、クラスタリングで各成分を同等に扱うために必要な処理である。一般には、第1のデータセットの平均がゼロに、標準偏差が1になる様に規格化する。データにアーティファクトが混入している確率が高い場合は、第1のデータセットの最頻値がゼロに、四分位範囲の幅が1になるロバスト規格化しても良い。また、大きく外れたデータが混入している場合は、規格化後、外れ値を±3にサチュレーションさせても良い。 Standardization of each vector component (S31) is a process necessary for treating each component equally in clustering. Generally, the first data set is normalized so that the mean is zero and the standard deviation is one. If there is a high probability that the data is contaminated with artifacts, robust normalization may be performed such that the mode of the first data set is zero and the width of the interquartile range is one. Furthermore, if there is data that deviates significantly, the outliers may be saturated to ±3 after normalization.
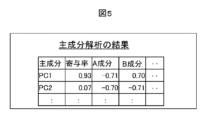
次に、ベクトル成分の次元圧縮(S32)について説明する。クラスタリング(S33)では与えられたデータ数に対して、データの次元数が多すぎるとクラスタリング(S33)の性能が低下する。一般的な次元圧縮法として主成分解析(PCA:Principal Component Analysis)がある。相関のある多数の変数から、各次元のベクトルを線形結合した主成分を作成する。相関のない少数の主成分で全体のばらつきを最もよく表すように変換される。第一主成分はその方向の分散が最大になる様に選ばれる。続く主成分は、それまでに決定した主成分と直交するという拘束条件の下で分散が最大になる様に選ばれる。主成分がどれくらいデータセットの特長を説明しているかを示す指標として寄与率がある。寄与率はデータセット全体の分散に対する、その主成分の方向の分散の割合として算出される。累積寄与率は抽出された主成分の寄与率の累計である。累積寄与率が低い場合は主成分数を増加させるか、不要な入力成分を削除して再度PCAを行う。図5に、主成分解析結果の一例を示す。次元削減手法としてはPCA以外にも潜在意味解析(特異値分解)、線形判別分析、独立成分分析などが公開、使用されている。データセットの特徴に合わせて適切な手法を選択する。 Next, dimensional compression of vector components (S32) will be explained. In clustering (S33), if the number of data dimensions is too large for the given number of data, the performance of clustering (S33) will deteriorate. Principal Component Analysis (PCA) is a general dimension reduction method. Create principal components by linearly combining vectors of each dimension from a large number of correlated variables. It is transformed so that the overall variation is best represented by a small number of uncorrelated principal components. The first principal component is chosen so that the variance in that direction is maximized. The subsequent principal components are selected so that the variance is maximized under the constraint that they are orthogonal to the principal components determined so far. Contribution rate is an index that shows how much the principal components explain the features of a dataset. The contribution rate is calculated as the ratio of the variance in the direction of the principal component to the variance of the entire data set. The cumulative contribution rate is the cumulative total of the contribution rates of the extracted principal components. If the cumulative contribution rate is low, increase the number of principal components or delete unnecessary input components and perform PCA again. FIG. 5 shows an example of principal component analysis results. In addition to PCA, other methods for reducing dimensionality include latent semantic analysis (singular value decomposition), linear discriminant analysis, and independent component analysis. Select an appropriate method according to the characteristics of the dataset.
クラスタリング(S33)は、教師なしデータ分類手法、つまり与えられたデータを外的基準なしに自動的に分類する手法である。さまざまな手法が提案されているが、大きく分けるとデータの分類が階層的になされる階層型手法と、特定のクラスタ数に分類する非階層的手法とがある。それぞれの代表的な手法としてウォード法、K-Means法などがある。今回はK-Meansでクラスタリングするが、データセットの内容によっては他の手法を選択しても良い。例えば、画像セットに含まれる画像の枚数が増加し、メモリオーバーの場合はMiniBach K-meanを使用した方が良い。その他のクラスタリングの手法としては、Spectral Clustering、GMM、MeanShift、VBGMMなどがある。 Clustering (S33) is an unsupervised data classification method, that is, a method of automatically classifying given data without external criteria. Various methods have been proposed, but they can be broadly divided into hierarchical methods, which classify data hierarchically, and non-hierarchical methods, which classify data into a specific number of clusters. Typical methods include the Ward method and the K-Means method. Although clustering will be performed using K-Means this time, other methods may be selected depending on the contents of the data set. For example, if the number of images included in an image set increases and the memory is overflowing, it is better to use MiniBach K-mean. Other clustering methods include Spectral Clustering, GMM, MeanShift, and VBGMM.
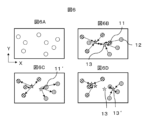
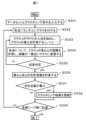
K-Meansによるクラスタリングを、図6A~6Dの説明図と図7のフローチャートを用いて説明する。まず、データセットとクラスタリング条件を入力する(S331、図6A)。初めに、各点にランダムにクラスを付ける(S332、図6B)。クラスnが付けられた点を抽出し、クラスnの重心を計算する(S333、図6B)。各点について、クラスnの重心との距離を計算し、距離が一番近いクラスに変更する(S334、図6C)。新しいクラス付けで重心を計算し(S333、図6D)、クラスが変更しなくなるまで繰り返す(S335)。クラス付けの変更が収束した後、重心と点との合計距離を計算する(S336)。 Clustering by K-Means will be explained using the explanatory diagrams of FIGS. 6A to 6D and the flowchart of FIG. 7. First, a data set and clustering conditions are input (S331, FIG. 6A). First, a class is randomly assigned to each point (S332, FIG. 6B). Points assigned class n are extracted, and the center of gravity of class n is calculated (S333, FIG. 6B). For each point, the distance from the center of gravity of class n is calculated and changed to the class with the closest distance (S334, FIG. 6C). The center of gravity is calculated with the new classification (S333, FIG. 6D), and this is repeated until the class does not change (S335). After the classification change converges, the total distance between the center of gravity and the point is calculated (S336).
図6Aは各データ点に二次元ベクトル(X,Y)が割り振られたデータセットの例であり、このデータセットを2つにクラスタリングする。図6Bはデータ点にランダムにクラス付けされた例であり、データ点11にはクラス1、データ点12にはクラス2が付けられている。クラス2が付けられたデータ点の重心13を計算する。図6Cはクラスnの重心との距離を計算し、距離が一番近いクラスに変更した結果であり、データ点11‘のクラスが1から2に変更されている。図6Dは新しいクラス付けで重心を計算した結果を示しており、クラス2の重心が13から13’に変更されている。
FIG. 6A is an example of a data set in which a two-dimensional vector (X, Y) is assigned to each data point, and this data set is clustered into two. FIG. 6B is an example in which data points are randomly assigned to classes, with
クラスタリング結果はS332における乱数の与えた方で変化するため、乱数シードを変えてS332からS336の工程を再度実行する。合計距離がすでに計算された合計距離よりも小さい場合(S337)はクラスタリング結果を更新する(S338)。S331で入力するクラスタリング条件には、クラスタ数、クラスの初期値設定(S332)で使用する乱数シードの種類と、収束判定(S335)で使用される最大繰り返し数と収束判定の許容誤差、終了判定(S339)で使用する乱数シード数がある。乱数シード数が入力値に到達したらクラスタリングを終了する(S339)。クラスタリング結果として、各点のクラス、クラスタの重心、合計距離が出力される。 Since the clustering result changes depending on the random number given in S332, the steps from S332 to S336 are executed again with a different random number seed. If the total distance is smaller than the already calculated total distance (S337), the clustering result is updated (S338). The clustering conditions input in S331 include the number of clusters, the type of random number seed used in the initial value setting of the class (S332), the maximum number of iterations used in the convergence determination (S335), the tolerance for convergence determination, and the termination determination. There is a random number seed number used in (S339). When the random number seed number reaches the input value, clustering ends (S339). As a clustering result, the class of each point, the centroid of the cluster, and the total distance are output.
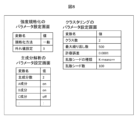
図8に、クラスタリング工程(S3)で使用されるパラメータの入力画面の一例を示す。強度規格化のパラメータ設定画面では、各ベクトル成分の規格化(S31)で使用される規格化方法や外れ値を設定する。主成分解析のパラメータ設定画面では、主成分解析による次元圧縮(S32)で使用されるベクトル成分や主成分数を設定する。クラスタリングのパラメータ設定画面では、クラスタリング(S33)で使用するパラメータを設定する。パラメータとしては、クラス数、クラスの初期値設定(S332)で使用する乱数シードの種類と、収束判定(S335)で使用される最大繰り返し数と収束判定の許容誤差、終了判定(S339)で使用する乱数シード数がある。 FIG. 8 shows an example of a parameter input screen used in the clustering step (S3). On the intensity normalization parameter setting screen, the normalization method and outliers used in the normalization of each vector component (S31) are set. On the parameter setting screen for principal component analysis, vector components and the number of principal components used in dimension reduction by principal component analysis (S32) are set. On the clustering parameter setting screen, parameters used in clustering (S33) are set. The parameters include the number of classes, the type of random number seed used in class initial value setting (S332), the maximum number of iterations used in convergence determination (S335), the allowable error for convergence determination, and the end determination (S339). There is a random seed number.
<S4.領域分割画像セット作成工程>
データ点に付けられたクラスに基いて二次元画像の各画素にクラスが付けられた領域分割画像セットを作成する領域分割画像セット作成工程を説明する。図3に示したデータセットには各データ点にクラス番号が入力されているので、画像番号、X座標、Y標を参照して各画素にクラス番号を割り当てることで、領域分割画像を作成することが出来る。
<S4. Region segmentation image set creation process>
A region-divided image set creation process for creating a region-divided image set in which each pixel of a two-dimensional image is assigned a class based on the class assigned to a data point will be described. Since a class number is input to each data point in the data set shown in Figure 3, a region segmented image is created by assigning a class number to each pixel by referring to the image number, X coordinate, and Y mark. I can do it.
<S5.領域分割画像セット出力工程>
作成された領域分割画像セットを出力する。図9に、領域分割画像セット出力工程で使用するGUIの一例を示す。画像セットの解析結果として、各クラスのデータ数、重心、合計距離が表示される。また、主成分の散布図行列を表示させ、データセットの分散状態とクラスタリング結果の対応を確認することが出来る。各画像のクラスタリング結果として、領域分割像と、その画像に含まれる各成分のヒストグラムを表示させる。表示画面には入力画像も表示させ、領域分割像と比較し、クラスタリングの妥当性を確認する。表示画面には、画像名称、入力画像及びヒストグラムに表示成分を選択する入力欄が設けられている。また、領域分割画像の形状的な特徴量を計算し、表示させることもできる。例えば各クラスの面積比率を画像毎に計算し、表示する。なお、今回の計算では各データの面積は画素の面積としているので、各クラスのデータ数の比率と各クラスの面積の比率は一致する。表示画面にてクラスタリング結果を確認し、クラスタリング結果を記憶装置に保存する。クラスタリング結果は、入力画像セットの設定条件、クラスタリングの設定パラメータと紐付けられた形式で保存される。
<S5. Region segmented image set output process>
Output the created region segmented image set. FIG. 9 shows an example of a GUI used in the region-divided image set output step. The number of data for each class, center of gravity, and total distance are displayed as the analysis results for the image set. Additionally, you can display the scatter plot matrix of the principal components and check the correspondence between the distribution state of the dataset and the clustering results. As a result of clustering each image, a region segmented image and a histogram of each component included in the image are displayed. The input image is also displayed on the display screen and compared with the region segmentation image to confirm the validity of the clustering. The display screen is provided with input fields for selecting display components for the image name, input image, and histogram. It is also possible to calculate and display the geometric feature amount of the region segmented image. For example, the area ratio of each class is calculated for each image and displayed. Note that in this calculation, the area of each data is the area of a pixel, so the ratio of the number of data in each class and the ratio of the area of each class match. Check the clustering results on the display screen and save the clustering results in the storage device. The clustering results are stored in a format associated with the setting conditions of the input image set and the clustering setting parameters.
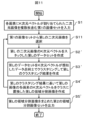
領域分割画像の形状的な特徴量は必要に応じて計算される値であるので、形状的な特徴量を計算する場合と計算しない場合のフローチャートを各々示す。図1は形状的特徴量を計算しない場合の、図10は計算する場合のフローチャートである。図10において、第1の領域分割画像セット作成工程(S4)の後に、第1の領域分割画像の形状的な特徴量を計算する工程(S6)が設けられている。そして、出力工程(S5)では、第1の領域分割画像セット及び/又は形状的な特徴量を出力する。領域分割画像の形状的な特徴量としては、各クラスの面積比率以外の値を用いても良い。例えば、領域分割画像を細線化して界面の長さを数値化する規格化境界長を計算しても良い。規格化境界長を計算する方法は特願2021-123682号に記載されている。また、領域分割画像に含まれる各領域を粒子で近似して解析する粒子解析を用い、平均粒径や粒子の配向度を計算しても良い。粒子解析は形状的な特徴量の解析方法として一般に知られた方法である。 Since the shape feature amount of the region segmented image is a value that is calculated as necessary, flowcharts are shown for cases in which the shape feature amount is calculated and cases in which the shape feature amount is not calculated. FIG. 1 is a flowchart when the geometric feature quantity is not calculated, and FIG. 10 is a flowchart when it is calculated. In FIG. 10, after the first region-divided image set creation step (S4), a step (S6) of calculating the shape feature amount of the first region-divided image is provided. Then, in the output step (S5), the first region segmented image set and/or the shape feature amount is output. Values other than the area ratio of each class may be used as the shape feature amount of the region segmented image. For example, the normalized boundary length may be calculated by thinning the area segmented image and quantifying the length of the interface. A method for calculating the normalized boundary length is described in Japanese Patent Application No. 2021-123682. Alternatively, the average particle size and degree of orientation of particles may be calculated using particle analysis in which each area included in a region-divided image is approximated and analyzed using particles. Particle analysis is a generally known method for analyzing geometric features.
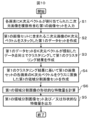
次に、入力画像セットを、図1に示す本発明のフローチャートで解析した結果と、図11に示す従来技術のフローチャートで解析した結果を比較する。従来技術では、図11に示すように、各画素にK次元ベクトルが割り当てられた二次元画像を複数枚含む第1の画像セットを入力し(S1)、第1の画像セットから第Lの二次元画像を選択し(S11)、第Lの二次元画像のK次元ベクトルをスタックした第Lのデータセットを作成し(S2’)、第LのデータセットをK次元ベクトルが類似したデータ点同士でクラスタリングして第Lのクラスタリング結果を作成し(S3’)、第Lのクラスタリング結果に基いて第Lの画像の各画素のK次元ベクトルをクラスに置換した第Lの領域分割画像を作成し(S4’)、第Lの領域分割画像をまとめた第2の領域分割画像セットを出力する(S5’)。 Next, the results of analyzing the input image set using the flowchart of the present invention shown in FIG. 1 and the results of analyzing the input image set using the flowchart of the prior art shown in FIG. 11 will be compared. In the conventional technology, as shown in FIG. 11, a first image set including a plurality of two-dimensional images in which each pixel is assigned a K-dimensional vector is input (S1), and an L-th second image is extracted from the first image set. Select a dimensional image (S11), create an L-th dataset by stacking the K-dimensional vectors of the L-th two-dimensional image (S2'), and create the L-th dataset by stacking data points with similar K-dimensional vectors. Create an L-th clustering result by clustering with (S4'), and outputs a second region divided image set which is a collection of the Lth region divided images (S5').
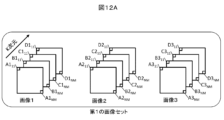
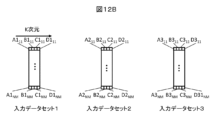
図1に示す本発明のフローチャートと、図11に示す従来技術のフローチャートとの違いを説明のために、図12Aに示される、各画素にK次元ベクトル(A,B,C,…)が割り当てられた3つの画像(画像1、画像2、画像3)からなる第1の画像セットを仮定する。従来技術では第1の画像セットを入力し(S1)、第1の画像セットから第Lの二次元画像を選択し(S11)、第Lの二次元画像のK次元ベクトルをスタックした第Lのデータセットを作成する(S2’)。例えば画像1を選択し、図12Bに示される、各画素のベクトルをスタックしたデータセット1を作成する。一方、本発明では、図12Cに示される、第1の画像セットに含まれる二次元画像のK次元ベクトルをスタックした第1のデータセットを作成する。
To explain the difference between the flowchart of the present invention shown in FIG. 1 and the flowchart of the prior art shown in FIG. 11, a K-dimensional vector (A, B, C,...) is assigned to each pixel as shown in FIG. Assume a first image set consisting of three images (
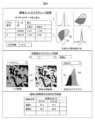
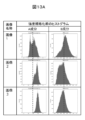
ここで、第1の画像セットとして各画素に2次元ベクトル(A,B)が割り当てられた画像を仮定する。図13Aに、各画像におけるA成分及びB成分の画像強度ヒストグラムを示す。横軸がベクトル成分の値、縦軸が頻度を示す。画像1はA成分の値が低く、B成分の値が高い、低A高Bデータの比率が高い。画像3はA成分の値が高く、B成分の値が低い、高A低Bデータの比率が高い。
Here, assume that the first image set is an image in which each pixel is assigned a two-dimensional vector (A, B). FIG. 13A shows an image intensity histogram of the A component and B component in each image. The horizontal axis shows the value of the vector component, and the vertical axis shows the frequency. In
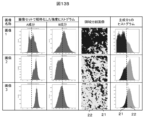
図13Bは本発明のフローチャート(図1)に従い、第1の画像セット全体で規格化し、主成分解析を実施し、クラスタ数=2でクラスタリングした結果である。第1の画像セット全体でベクトル成分の平均値がゼロになる様に規格化されるので、格化後の強度ヒストクラムでも、画像1では低A高Bなデータの比率が高く、画像3では低A高Bなデータの比率が低いままである。領域分割画像を見ると、画像1はクラス1の領域の比率が高く、画像3は低い。低A高Bデータはクラス1に、高A低Bデータはクラス2に分類されていることが分かる。主成分1のヒストグラムでも、画像1はクラス1のデータ比率が高く、画像3は低くなっている。
FIG. 13B shows the result of normalizing the entire first image set, performing principal component analysis, and clustering with the number of clusters=2, according to the flowchart of the present invention (FIG. 1). Since the average value of the vector components is normalized to zero for the entire first image set, even in the intensity histogram after categorization,
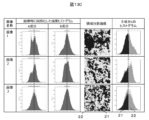
図13Cは従来技術のフローチャート(図11)に従い、各ベクトル成分を画像毎に規格化、主成分解析を実施し、クラスタ数=2でクラスタリングした結果である。各画像でベクトル成分の平均値がゼロになる様に規格化されるので、画像1では低A高Bデータの比率が高く、画像3では低A高Bデータの比率が低いという情報が失われる。この状態でクラスタリングすると、低A高Bデータであるクラス1と、高A低Bデータであるクラス2の比率がほぼ等しくなる。
FIG. 13C shows the results of normalizing each vector component for each image, performing principal component analysis, and clustering with the number of clusters=2, according to the flowchart of the prior art (FIG. 11). Because each image is normalized so that the average value of the vector components is zero, the information that
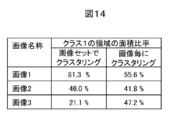
図14は領域分割画像の形状的な特徴量としてクラス1の領域面積の比率を計算した結果を示している。従来技術のフローチャートに従って画像毎にクラスタリングすると、クラス1の領域面積の比率は画像1で55.6%、画像2で41.8%、画像3で47.2%とどの画像も50%近傍になる。つまり、第1の画像セット間の変化を数値化できていない。一方、本発明のフローチャートに従って第1の画像セットでクラスタリングすると、クラス1の比率が画像1では81.3%と高く、画像3では21.1%と低くなる。クラス1の領域面積の比率を計算することで、第1の画像セット間の変化が数値化されている。第1の画像セット全体でK次元ベクトルとクラスと対応を決めて領域分割画像セットを作成し、領域分割画像間の形状的な特徴量の違いを数値化することで、画像間の違いを定量評価できることが分かる。
FIG. 14 shows the results of calculating the area ratio of
二次元画像の各画素にK次元ベクトルが割り当てられたデータとしては、様々な測定装置を想定している。SEM(Scanning Electron Microscope)-EDX(Energy Dispersive X-ray Spectroscopy)は、収束した電子線を試料表面で走査し、電子線の入射位置で二次元画像の各画素との対応を制御する。試料から発生するX線スペクトルを測定し、試料に含まれる元素に対応する特性X線の波長領域にあるX線強度を測定する。複数の元素を指定することで、各画素に複数のX線強度測定結果、すなわちベクトル情報が割り当てられる。入射プローブをX線にして測定した蛍光X線分析でも各画素にベクトル情報が割り当てられる。画素毎にスペクトルが得られる装置としては、ラマン分光分析、STEM(Scanning Transmission Electron Microscope)-EELS(Electron Energy Loss Spectroscopy)などもある。 Various measuring devices are assumed to be used as data in which a K-dimensional vector is assigned to each pixel of a two-dimensional image. SEM ( Scanning Electron Microscope ) - EDX (Energy Dispersive . The X-ray spectrum generated from the sample is measured, and the X-ray intensity in the characteristic X-ray wavelength region corresponding to the element contained in the sample is measured. By specifying multiple elements, multiple X-ray intensity measurement results, that is, vector information, are assigned to each pixel. Vector information is also assigned to each pixel in fluorescent X-ray analysis, which is measured using an incident probe as X-rays. Examples of devices that can obtain a spectrum for each pixel include Raman spectroscopy, STEM (Scanning Transmission Electron Microscope)-EELS (Electron Energy Loss Spectroscopy), and the like.
また、K次元ベクトルはスペクトル以外のデータからも得ることが出来る。AFM(Atomic Force Microscopy)は、試料の表面を探針で走査し、試料表面を探針との間に発生する力を検出して画像を得る顕微鏡である。AFMには様々な測定モードがあり、PET(Peak Force Tapping)モードではプローブを試料に近づけ(approach)、接触させた後、遠ざけていく(withdraw)過程でプローブと試料との間で発生する力を測定する。横軸にプローブの高さ、縦軸をプローブにかかる力をプロットしたフォースカーブを画素毎に測定し、フォースカーブを解析することで、試料表面の高さ、弾性率、凝着力などを解析する。これらの解析結果をベクトル情報として各画素に割り当てる。 Furthermore, the K-dimensional vector can be obtained from data other than spectra. AFM (Atomic Force Microscopy) is a microscope that scans the surface of a sample with a probe and obtains an image by detecting the force generated between the sample surface and the probe. AFM has various measurement modes. In the PET (Peak Force Tapping) mode, the force generated between the probe and the sample is measured during the process of bringing the probe close to the sample, making contact, and then drawing it away from the sample. Measure. Measure the force curve for each pixel, plotting the height of the probe on the horizontal axis and the force applied to the probe on the vertical axis, and analyze the force curve to analyze the height, elastic modulus, adhesion force, etc. of the sample surface. . These analysis results are assigned to each pixel as vector information.
上記の測定方法を用いてプロセス-複合材組織-複合材特性の関係を解析する際、プロセスが異なる試料をグループ化し、複合材組織の違いを解析する。または、複合材特性が異なる試料をグループ化し、複合材組織の違いを解析する。複合材組織の違いを定量的に解析するには、観察像を領域分割し、組織形状の違いを数値化する必要がある。本発明によって、領域分割の教師画像の作成が困難なK次元ベクトル画像でも、K次元ベクトルとクラスとの対応付けが統一された領域分割画像セットが得られるようになる。また、領域分割画像間の形状的な特徴量の違いを数値化して比較できるようになり、プロセス-複合材組織-複合材特性の関係解析が可能になる。そして、組織制御による複合材特性改善の研究・開発が加速される。 When analyzing the relationship between process-composite structure-composite material properties using the above measurement method, samples with different processes are grouped and differences in composite structure are analyzed. Alternatively, group samples with different composite properties and analyze differences in composite structure. In order to quantitatively analyze the differences in the structure of composite materials, it is necessary to divide the observed image into regions and quantify the differences in the structure shape. According to the present invention, even for K-dimensional vector images for which it is difficult to create a teacher image for region segmentation, a region-divided image set in which the correspondence between K-dimensional vectors and classes is unified can be obtained. In addition, it becomes possible to quantify and compare the differences in geometric features between region-divided images, making it possible to analyze the relationship between process, composite material structure, and composite material properties. Research and development on improving composite material properties through microstructural control will be accelerated.
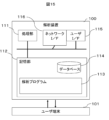
実施例2は、複合材組織の解析装置の実施例である。図15に示す情報処理装置は、解析装置100と、1以上のユーザ端末101とで構成される。解析装置100はパーソナルコンピュータ、汎用計算機などで構成される。解析装置100は、CPUなどの処理部111、記憶部112、ユーザインターフェース(図ではユーザI/F)115、ネットワークインターフェース(図ではネットワークI/F)116、及びこれら構成物を接続する内部ネットワークを含む。処理部111は、記憶部112に格納された解析プログラム113を実行することができる。また、記憶部112は、解析プログラム113を格納するとともに、データベース114に各種情報を格納する。ユーザインターフェース115は、例えば、タッチパネル、ディスプレイ、キーボード、マウス等であるが、作業者(ユーザ)からの操作を受け付け、情報表示ができるのであれば、他のデバイスであってもよい。ネットワークインターフェース116は、ネットワークを介して外部の装置(例えば、ユーザ端末101等)と通信するためのインターフェースである。ユーザ端末101は、解析装置100を利用するユーザによって使用される。ユーザ端末101は、プロセッサ、メモリ、ユーザに対する入出力用のインターフェース(IF)を有している。
Example 2 is an example of a composite material structure analysis device. The information processing device shown in FIG. 15 includes an
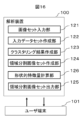
図16に、図15の解析装置が実行する処理の機能ブロック構成図を示す。図1あるいは図10の解析フローチャートに対応し、画像セット入力部121、入力データセット作成部122、クラスタリング結果作成部123、領域域分割画像セット作成部124、形状的特徴量計算部126、領域分割画像セット出力部125を有している。
FIG. 16 shows a functional block configuration diagram of processing executed by the analysis device of FIG. 15. Corresponding to the analysis flowchart of FIG. 1 or FIG. It has an image
画像セット入力部121は、各画素にK次元ベクトルが割り当てられた二次元画像を複数枚含む第1の画像セットを入力する。
入力データセット作成部122は、第1の画像セットに含まれる二次元画像のK次元ベクトルをスタックした第1のデータセットを作成する。
クラスタリング結果作成部123は、第1のデータセットをK次元ベクトルが類似したデータ点同士でクラスタリングして第1のクラスタリング結果を作成する。
領域域分割画像セット作成部124は、第1のクラスタリング結果に基いて第1の画像セットの各画素のK次元ベクトルをクラスに置換した第1の領域分割画像セットを作成する。
図10に対応する形状的特徴量算出部126は、第1の領域分割画像の形状的な特徴量を計算する。
領域分割画像セット出力部125は、第1の領域分割画像セット及び/又は形状的な特徴量を出力する。
The image set
The input data
The clustering
The region segmented image set
The shape feature
The region-divided image
本発明のプログラムは、情報処理装置を図16の複合材組織の解析装置として動作させるものである。すなわち、コンピュータを複合材組織の解析装置として機能させるプログラムであって、各画素にK次元ベクトルが割り当てられた二次元画像を複数枚含む画像セットを入力する画像セット入力部と、前記画像セットに含まれる二次元画像のK次元ベクトルをスタックしたデータセットを作成する入力データセット作成部と、前記データセットをK次元ベクトルが類似したデータ点同士でクラスタリングしてクラスタリング結果を作成するクラスタリング結果作成部と、前記クラスタリング結果に基いて前記画像セットの各画素のK次元ベクトルをクラスに置換した領域分割画像セットを作成する領域分割画像セット作成部と、前記領域分割画像セットを出力する出力部、として機能させるプログラムである。プログラムは、図15の記憶部112に解析プログラム113として記憶されており、解析プログラム113を読み出して処理部111で実行することにより、複合材組織の解析装置が構成される。なお、解析装置100はクラウド上に構成してもよい。
The program of the present invention causes the information processing device to operate as the composite material structure analysis device shown in FIG. That is, the program causes a computer to function as a composite material structure analysis device, and includes an image set input unit that inputs an image set including a plurality of two-dimensional images in which each pixel is assigned a K-dimensional vector; an input dataset creation unit that creates a dataset in which K-dimensional vectors of included two-dimensional images are stacked; and a clustering result creation unit that creates a clustering result by clustering the dataset with data points having similar K-dimensional vectors. and a region segmented image set creation unit that creates a region segmented image set in which the K-dimensional vector of each pixel of the image set is replaced with a class based on the clustering result, and an output unit that outputs the region segmented image set. This is a program that makes it work. The program is stored as an
なお、本発明は上記した実施例に限定されるものではなく、様々な変形例が含まれる。例えば、上記した実施例は本発明を分かりやすく説明するために詳細に説明したものであり、必ずしも説明した全ての構成を備えるものに限定されるものではない。また、ある実施例の構成の一部を他の実施例の構成に置き換えることが可能であり、また、ある実施例の構成に他の実施例の構成を加えることも可能である。また、各実施例の構成の一部について、他の構成の追加・削除・置換をすることが可能である。 Note that the present invention is not limited to the above-described embodiments, and includes various modifications. For example, the embodiments described above are described in detail to explain the present invention in an easy-to-understand manner, and the present invention is not necessarily limited to having all the configurations described. Furthermore, it is possible to replace a part of the configuration of one embodiment with the configuration of another embodiment, and it is also possible to add the configuration of another embodiment to the configuration of one embodiment. Further, it is possible to add, delete, or replace a part of the configuration of each embodiment with other configurations.
11…S332でクラス1が付けられたデータ点
11’…S334でクラス2が付けられたデータ点
12…S332でクラス2が付けられたデータ点
13…S332でクラス2が付けられたデータ点の重心
13’…S334でクラス2が付けられたデータ点の重心
21…クラス1の領域
22…クラス2の領域
100…解析装置
101…ユーザ端末
111…処理部
112…記憶部
113…解析プログラム
114…データベース
115…ユーザインターフェース
116…ネットワークインターフェース
121…画像セット入力部
122…入力データセット作成部
123…クラスタリング結果作成部
124…領域分割画像セット作成部
125…領域分割画像セット出力部
126…特徴量計算部
11...Data point 11' assigned
Claims (14)
各画素にK次元ベクトルが割り当てられた二次元画像を複数枚含む画像セットを入力し、
前記画像セットに含まれる二次元画像のK次元ベクトルをスタックしたデータセットを作成し、
前記データセットをK次元ベクトルが類似したデータ点同士でクラスタリングしてクラスタリング結果を作成し、
前記クラスタリング結果に基いて前記画像セットの各画素のK次元ベクトルをクラスに置換した領域分割画像セットを作成し、
前記領域分割画像セットを出力する、
複合材組織の解析方法。 A method for analyzing the structure shape of a composite material made of two or more types of materials, the method comprising:
Input an image set containing multiple two-dimensional images in which each pixel is assigned a K-dimensional vector,
Create a dataset in which K-dimensional vectors of two-dimensional images included in the image set are stacked,
Clustering the data set using data points with similar K-dimensional vectors to create a clustering result;
creating a region segmented image set in which the K-dimensional vector of each pixel of the image set is replaced with a class based on the clustering result;
outputting the region segmented image set;
Analysis method of composite material structure.
前記画像セットは、試料に荷電粒子線もしくはX線を照射し、試料より発生したX線もしくは荷電粒子線のスペクトル情報から二次元画像の各画素にK次元ベクトルが割り当てられている、ことを特徴とする複合材組織の解析方法。 The method for analyzing a composite material structure according to claim 1,
The image set is characterized in that a sample is irradiated with a charged particle beam or an X-ray, and a K-dimensional vector is assigned to each pixel of the two-dimensional image from spectrum information of the X-ray or charged particle beam generated from the sample. A method for analyzing the structure of composite materials.
前記画像セットは、プローブと試料表面との相互作用により得られた信号情報から二次元画像の各画素にK次元ベクトルが割り当てられている、ことを特徴とする複合材組織の解析方法。 The method for analyzing a composite material structure according to claim 1,
A method for analyzing a composite material structure, characterized in that, in the image set, a K-dimensional vector is assigned to each pixel of a two-dimensional image from signal information obtained by interaction between a probe and a sample surface.
前記領域分割画像セットを用い、領域分割画像の形状的な特徴量を計算し、前記領域分割画像の形状的な特徴量を出力する、ことを特徴とする複合材組織の解析方法。 The method for analyzing a composite material structure according to claim 1, further comprising:
A method for analyzing a composite material structure, characterized in that the shape feature amount of the region segmentation image is calculated using the region segmentation image set, and the shape feature amount of the region segmentation image is output.
前記領域分割画像の形状的な特徴量は、領域の面積比率である、ことを特徴とする複合材組織の解析方法。 In the method for analyzing a composite material structure according to claim 4,
A method for analyzing a composite material structure, characterized in that the geometrical feature amount of the region-divided image is an area ratio of regions.
前記クラスタリング結果の作成は、
各ベクトル成分を規格化し、
ベクトル成分の次元を圧縮し、
クラスタリングを行う、
ことを特徴とする複合材組織の解析方法。 The method for analyzing a composite material structure according to claim 1,
The creation of the clustering results is as follows:
Standardize each vector component,
Compress the dimensions of the vector components,
perform clustering,
A method for analyzing composite material structures characterized by the following.
前記ベクトル成分の次元の圧縮は主成分解析による、ことを特徴とする複合材組織の解析方法。 The method for analyzing a composite material structure according to claim 6,
A method for analyzing a structure of a composite material, characterized in that the dimension reduction of the vector components is performed by principal component analysis.
前記画像セットに含まれる二次元画像のK次元ベクトルをスタックしたデータセットを作成する入力データセット作成部と、
前記データセットをK次元ベクトルが類似したデータ点同士でクラスタリングしてクラスタリング結果を作成するクラスタリング結果作成部と、
前記クラスタリング結果に基いて前記画像セットの各画素のK次元ベクトルをクラスに置換した領域分割画像セットを作成する領域分割画像セット作成部と、
前記領域分割画像セットを出力する出力部と、
を有する複合材組織の解析装置。 an image set input unit that inputs an image set including a plurality of two-dimensional images in which each pixel is assigned a K-dimensional vector;
an input data set creation unit that creates a data set in which K-dimensional vectors of two-dimensional images included in the image set are stacked;
a clustering result creation unit that creates a clustering result by clustering the data set using data points having similar K-dimensional vectors;
a region-divided image set creation unit that creates a region-divided image set in which a K-dimensional vector of each pixel of the image set is replaced with a class based on the clustering result;
an output unit that outputs the region-divided image set;
Composite structure analysis device with
前記領域分割画像セットを用い、領域分割画像の形状的な特徴量を計算する形状的特徴量計算部を備え、
前記出力部は、前記領域分割画像の形状的な特徴量を出力する、ことを特徴とする複合材組織の解析装置。 The composite material structure analysis device according to claim 8, further comprising:
comprising a shape feature calculation unit that calculates a shape feature of the region divided image using the region divided image set,
The apparatus for analyzing a composite material structure, wherein the output unit outputs a geometric feature amount of the region-divided image.
前記領域分割画像の形状的な特徴量は、領域の面積比率である、ことを特徴とする複合材組織の解析装置。 The composite material structure analysis device according to claim 9,
An apparatus for analyzing a composite material structure, characterized in that the shape feature amount of the region-divided image is an area ratio of regions.
前記クラスタリング結果作成部は、
各ベクトル成分を規格化し、
ベクトル成分の次元を圧縮し、
クラスタリングを行う、
ことを特徴とする複合材組織の解析装置。 The composite material structure analysis device according to claim 9,
The clustering result creation unit includes:
Standardize each vector component,
Compress the dimensions of the vector components,
perform clustering,
A composite material structure analysis device characterized by the following.
前記ベクトル成分の次元の圧縮は主成分解析による、ことを特徴とする複合材組織の解析装置。 The composite material structure analysis device according to claim 11,
An apparatus for analyzing a structure of a composite material, wherein the dimension of the vector component is compressed by principal component analysis.
各画素にK次元ベクトルが割り当てられた二次元画像を複数枚含む画像セットを入力する画像セット入力部と、
前記画像セットに含まれる二次元画像のK次元ベクトルをスタックしたデータセットを作成する入力データセット作成部と、
前記データセットをK次元ベクトルが類似したデータ点同士でクラスタリングしてクラスタリング結果を作成するクラスタリング結果作成部と、
前記クラスタリング結果に基いて前記画像セットの各画素のK次元ベクトルをクラスに置換した領域分割画像セットを作成する領域分割画像セット作成部と、
前記領域分割画像セットを出力する出力部、
として機能させるプログラム。 A program that causes a computer to function as a composite material structure analysis device,
an image set input unit that inputs an image set including a plurality of two-dimensional images in which each pixel is assigned a K-dimensional vector;
an input data set creation unit that creates a data set in which K-dimensional vectors of two-dimensional images included in the image set are stacked;
a clustering result creation unit that creates a clustering result by clustering the data set using data points having similar K-dimensional vectors;
a region-divided image set creation unit that creates a region-divided image set in which a K-dimensional vector of each pixel of the image set is replaced with a class based on the clustering result;
an output unit that outputs the region segmented image set;
A program that functions as
前記領域分割画像セットを用い、領域分割画像の形状的な特徴量を計算する形状的特徴量計算部として機能させ、
前記出力部において、前記領域分割画像の形状的な特徴量を出力させる、ことを特徴とするプログラム。 The program according to claim 13, further comprising:
Functioning as a shape feature calculation unit that calculates a shape feature of the region divided image using the region divided image set,
A program characterized in that the output unit outputs a geometric feature amount of the area segmented image.
Priority Applications (1)
| Application Number | Priority Date | Filing Date | Title |
|---|---|---|---|
| JP2022077273A JP2023166300A (en) | 2022-05-09 | 2022-05-09 | Analyzing method and device for composite material structure, and its program |
Applications Claiming Priority (1)
| Application Number | Priority Date | Filing Date | Title |
|---|---|---|---|
| JP2022077273A JP2023166300A (en) | 2022-05-09 | 2022-05-09 | Analyzing method and device for composite material structure, and its program |
Publications (1)
| Publication Number | Publication Date |
|---|---|
| JP2023166300A true JP2023166300A (en) | 2023-11-21 |
Family
ID=88836807
Family Applications (1)
| Application Number | Title | Priority Date | Filing Date |
|---|---|---|---|
| JP2022077273A Pending JP2023166300A (en) | 2022-05-09 | 2022-05-09 | Analyzing method and device for composite material structure, and its program |
Country Status (1)
| Country | Link |
|---|---|
| JP (1) | JP2023166300A (en) |
Citations (1)
| Publication number | Priority date | Publication date | Assignee | Title |
|---|---|---|---|---|
| JP2023119367A (en) * | 2022-02-16 | 2023-08-28 | 日本電子株式会社 | PHASE ANALYZER, SAMPLE ANALYZER, AND ANALYSIS METHOD |
-
2022
- 2022-05-09 JP JP2022077273A patent/JP2023166300A/en active Pending
Patent Citations (1)
| Publication number | Priority date | Publication date | Assignee | Title |
|---|---|---|---|---|
| JP2023119367A (en) * | 2022-02-16 | 2023-08-28 | 日本電子株式会社 | PHASE ANALYZER, SAMPLE ANALYZER, AND ANALYSIS METHOD |
Similar Documents
| Publication | Publication Date | Title |
|---|---|---|
| Förster et al. | A deep learning approach for determining the chiral indices of carbon nanotubes from high-resolution transmission electron microscopy images | |
| US20250216842A1 (en) | Computer implemented method for defect detection in an imaging dataset of a wafer, corresponding computer-readable medium, computer program product and systems making use of such methods | |
| KR102110755B1 (en) | Optimization of unknown defect rejection for automatic defect classification | |
| US7619751B2 (en) | High-accuracy pattern shape evaluating method and apparatus | |
| TWI889675B (en) | Method, system, and non-transitory computer readable medium of machine learning-based classification of defects in a semiconductor specimen | |
| Ghamarian et al. | Hierarchical density-based cluster analysis framework for atom probe tomography data | |
| CN114600170B (en) | Grain-based mineralogical classification systems and methods | |
| TW201407154A (en) | Integration of automatic and manual defect classification | |
| US11972552B2 (en) | Abnormal wafer image classification | |
| CN117794089B (en) | A dynamic etching compensation method for printed circuit board circuits | |
| TW202041854A (en) | Pattern evaluation system and pattern evaluation method | |
| CN118152835A (en) | Carbon emission influencing factor analysis method, device, terminal equipment and storage medium | |
| CN109727295B (en) | Electromagnetic image extraction method, device, computer equipment and storage medium | |
| CN119249367B (en) | Intelligent environment monitoring method, system, equipment and readable storage medium | |
| WO2020129041A1 (en) | Classifying defects in a semiconductor specimen | |
| Devadasan et al. | Quantitative atomic force microscopy: A statistical treatment of high-speed AFM data for quality control applications | |
| JP2023166300A (en) | Analyzing method and device for composite material structure, and its program | |
| JP2025524428A (en) | Apparatus, system and method for analyzing and characterizing surface topography | |
| CN120801284A (en) | Method for rapidly detecting compound components of traditional Chinese medicine | |
| CN118710988B (en) | Trade goods classification and standardization method and system based on intelligent algorithm | |
| Schwarting et al. | Reverse afm height map search: Content-based topography retrieval via self-supervised deep learning | |
| López-García et al. | Cluster analysis for the selection of potential discriminatory variables and the identification of subgroups in archaeometry | |
| Yuan et al. | Generative learning of morphological and contrast heterogeneities for self-supervised electron micrograph segmentation | |
| JP2025505033A (en) | Method and device for processing experimental data by machine learning | |
| Zanotelli et al. | A flexible image segmentation pipeline for heterogeneous multiplexed tissue images based on pixel classification |
Legal Events
| Date | Code | Title | Description |
|---|---|---|---|
| A621 | Written request for application examination |
Free format text: JAPANESE INTERMEDIATE CODE: A621 Effective date: 20241128 |
|
| A131 | Notification of reasons for refusal |
Free format text: JAPANESE INTERMEDIATE CODE: A131 Effective date: 20260203 |
|
| A521 | Request for written amendment filed |
Free format text: JAPANESE INTERMEDIATE CODE: A523 Effective date: 20260326 |