JP2022166350A - Material process search device, material process search system and correlation model generation method - Google Patents
Material process search device, material process search system and correlation model generation method Download PDFInfo
- Publication number
- JP2022166350A JP2022166350A JP2021071500A JP2021071500A JP2022166350A JP 2022166350 A JP2022166350 A JP 2022166350A JP 2021071500 A JP2021071500 A JP 2021071500A JP 2021071500 A JP2021071500 A JP 2021071500A JP 2022166350 A JP2022166350 A JP 2022166350A
- Authority
- JP
- Japan
- Prior art keywords
- correlation model
- tissue
- numerical analysis
- information
- unit
- Prior art date
- Legal status (The legal status is an assumption and is not a legal conclusion. Google has not performed a legal analysis and makes no representation as to the accuracy of the status listed.)
- Pending
Links
Images


Landscapes
- Analysing Materials By The Use Of Radiation (AREA)
Abstract
Description
本発明は、材料のプロセス、組織および特性を結びつける相関モデルの生成方法、およびそれらを用いた材料プロセス探索装置、材料プロセス探索システムに関する。 The present invention relates to a method of generating a correlation model that connects material processes, structures and properties, and a material process searching apparatus and material process searching system using them.
近年、実験および計算により得られた材料データベースとデータマイニングなどの情報科学を融合することにより、要求仕様を満足する新材料や代替材料を効率的に探索するマテリアルズ・インフォマティクス(Materials Informatics:MI)という技術が研究開発されている。従来のMIでは、主に組成によって決まる物質探索に重きがおかれているが、各物質は圧延や熱処理などの製造条件の影響で最終特性が変化する。そのため、組成と製造条件の組み合わせ(プロセス)が最終特性に対してどのように影響を与えるかを把握する事が求められる。 In recent years, Materials Informatics (MI) has been developed to efficiently search for new materials and alternative materials that satisfy required specifications by fusing information science such as data mining with material databases obtained through experiments and calculations. technology is being researched and developed. In conventional MI, emphasis is placed on searching for materials that are mainly determined by composition, but the final properties of each material change under the influence of manufacturing conditions such as rolling and heat treatment. Therefore, it is required to understand how the combination (process) of composition and manufacturing conditions affects the final characteristics.
特に、金属材料は特性のプロセス依存性が大きな材料として知られている。例えば、凝固時の冷却速度や熱処理の温度および保持時間の違いにより、金属材料の引張り強さや疲労強度などが大きく変化する。これらは、金属材料の組織がプロセスに応じて様々に変化することに由来しており、その結果として材料特性が変化している。 In particular, metal materials are known as materials whose properties are highly dependent on process. For example, the tensile strength, fatigue strength, etc. of the metal material change greatly due to differences in the cooling rate during solidification and the temperature and holding time of the heat treatment. These are derived from various changes in the structure of the metal material according to the process, resulting in changes in material properties.
プロセス依存性の大きな材料の探索システムには、組成や製造条件に加えて組織データを考慮するための様々なモデルが提案されている。特許文献1には、成分組成、製造条件および金属組織の状態を表す指標を含む入力情報と材料の特性値を含む出力情報とを菅家付けた数理モデルを用いて、目標特性に対する最適な組成や製造条件を算出する方法が開示されている。 Various models have been proposed for material search systems that are highly process-dependent, taking into account structural data in addition to composition and manufacturing conditions. In Patent Document 1, using a mathematical model with input information including indexes representing the composition, manufacturing conditions, and metallographic state and output information including characteristic values of materials, the optimum composition and A method for calculating manufacturing conditions is disclosed.
材料の組織情報は、組織の種類だけでなく、存在比率やサイズ、形態、分散度合いなど様々な指標を有する。ある組織が一定比率存在している条件下でも、一定のサイズで均一に分散している場合と、不均一なサイズで特定箇所に固まって存在している場合では、材料特性が変化する。金属材料を溶融させるだけでなく、構造物の変形や内部組織変化に対しても影響を与える。従って、種類や割合などの統計的な指標だけでなく、個々の形態や分散度などを含む詳細な組織指標が重要である。 The structure information of a material includes not only the type of structure but also various indexes such as abundance ratio, size, morphology, degree of dispersion, and the like. Even under the condition that a certain structure exists at a constant ratio, the material properties change depending on whether the structure is uniformly dispersed with a fixed size or when the structure is unevenly sized and concentrated at a specific location. It not only melts metal materials, but also affects structural deformation and internal structure changes. Therefore, not only statistical indicators such as types and proportions, but also detailed organizational indicators including individual morphology and dispersity are important.
組織の詳細情報を有するデータベースに基づいて、プロセスおよび特性との相関関係を相関モデルとして整理することができれば、相関モデルそのものの精度が向上し、材料プロセス探索の精度もともに向上する。 If the correlation between processes and characteristics can be organized as a correlation model based on a database containing detailed information on the structure, the accuracy of the correlation model itself will be improved, and the accuracy of material process search will also be improved.
しかし、プロセス依存性の大きな材料に対して様々な条件毎に、材料を試作してプロセス、組織、特性のデータを取得し、データベースとして蓄積しながら相関モデルを生成すると、多大な時間やコストがかかる。そのため、プロセスおよび組織の詳細情報を効率的に収集・定量化することができる技術が求められている。特許文献1に記載された技術によると、金属組織の状態を表す指標を含むデータに基づいて最適材料を探索する事ができる。しかし、考慮している材料組織は組織の種類および分率のみであり、形態などの詳細な組織情報は含まれていない。従って、これらの影響を加味した、高精度な相関モデルに基づく材料探索技術が望まれる。 However, it takes a lot of time and money to create a correlation model while accumulating data on process, structure, and characteristics from trial production of materials under various conditions for highly process-dependent materials. It takes. Therefore, there is a need for a technology that can efficiently collect and quantify detailed information on processes and organizations. According to the technique described in Patent Literature 1, it is possible to search for the optimum material based on data including an index representing the state of the metal structure. However, the material structure considered is only the type and fraction of the structure, and detailed structure information such as morphology is not included. Therefore, a material search technique based on a high-precision correlation model that considers these effects is desired.
そこで、本発明は、材料組織の形態の指標に基づく高精度な相関モデルを高効率で生成し、この相関モデルを用いて最適な材料プロセスを探索することを課題とする。 Accordingly, an object of the present invention is to efficiently generate a highly accurate correlation model based on the index of the morphology of the material structure, and to search for the optimum material process using this correlation model.
前記した課題を解決するため、本発明の材料プロセス探索装置は、組成および製造条件を組み合わせたプロセス、並びに材料特性、材料組織画像に基づく組織の形態および分散度の指標を含む材料組織の情報を格納するデータベースと、前記プロセスと前記材料組織との対応関係に基づく第一の相関モデルを有するプロセス判定部と、前記材料組織と前記材料特性との対応関係に基づく第二の相関モデルを有する特性判定部と、判定対象の前記プロセスより前記材料特性を算出するか、または判定対象の前記材料特性より前記プロセスを算出する演算部と、を備えることを特徴とする。 In order to solve the above-described problems, the material process searching apparatus of the present invention provides information on a process combining composition and manufacturing conditions, material properties, and information on material structure including indices of morphology and degree of dispersion based on material structure images. a database to be stored; a process determination unit having a first correlation model based on the correspondence between the process and the material structure; and a property having a second correlation model based on the correspondence between the material structure and the material property. and a computing unit that calculates the material properties from the process to be judged, or calculates the process from the material properties to be judged.
本発明の材料プロセス探索システムは、組成および製造条件を組み合わせたプロセス、並びに材料特性、材料組織画像に基づく組織の形態および分散度の指標を含む材料組織の情報を格納するデータベースと、前記プロセスと前記材料組織との対応関係に基づく第一の相関モデルを有するプロセス判定部と、前記材料組織と前記材料特性との対応関係に基づく第二の相関モデルを有する特性判定部と、判定対象の前記プロセスより前記材料特性を算出するか、または判定対象の前記材料特性より前記プロセスを算出する演算部と、を備えることを特徴とする。 A material process search system of the present invention includes a database storing information on a process combining composition and manufacturing conditions, material properties, material structure information including indices of morphology and dispersion degree of the structure based on material structure images, and the process and A process determination unit having a first correlation model based on the correspondence relationship with the material structure; a property determination unit having a second correlation model based on the correspondence relationship between the material structure and the material properties; and a calculation unit that calculates the material properties from a process or calculates the process from the material properties to be determined.
本発明の相関モデル生成方法は、数値解析部が、材料を生成する所定のプロセスから材料組織の予測画像を数値解析によって生成するステップと、位相的データ解析部が、数値解析によって生成された材料組織の予測画像および他のプロセスで生成された材料を撮像した材料組織の実験画像の位相的データ解析を行って、材料組織の情報を取得するステップと、材料を生成した各プロセスの因子と、前記材料に係る材料組織の情報との相関により相関モデルを生成するステップと、を実行することを特徴とする。
その他の手段については、発明を実施するための形態のなかで説明する。
The correlation model generation method of the present invention includes the step of the numerical analysis unit generating a predicted image of the material structure from a predetermined process for generating the material by numerical analysis; performing a topological data analysis of predicted images of the texture and experimental images of the material texture imaged of the material produced by other processes to obtain material texture information and the factors of each process that produced the material; and a step of generating a correlation model by correlating with information on the material structure of the material.
Other means are described in the detailed description.
本発明の材料プロセス探索装置、材料プロセス探索システム、および、相関モデル生成方法によれば、様々な材料プロセス候補および要求特性に対して、それぞれ期待される材料特性および必要とされるプロセス条件を高精度に予測することができる。 According to the material process search apparatus, material process search system, and correlation model generation method of the present invention, expected material properties and required process conditions can be improved for various material process candidates and required properties. can be predicted with precision.
以降、本発明を実施するための形態を、各図を参照して詳細に説明する。
本発明者らは、鋭意研究した結果、材料の組織形態の指標を考慮した相関モデルの生成方法を新たに見出した。本発明者らは、数値解析による材料組織予測と、位相的データ解析(Topological Data Analysis:TDA)の組み合わせにより、プロセス依存の組織形態データを高効率に生成する方法と、組織形態を数値で表現する方法を発明した。更に本発明者らは、この組織形態の数値情報を相関モデルの構築に用いる方法を発明した。以下、本発明の一実施形態に係る相関モデルの生成方法および材料プロセス探索装置について説明する。
EMBODIMENT OF THE INVENTION Henceforth, the form for implementing this invention is demonstrated in detail with reference to each figure.
As a result of intensive research, the inventors of the present invention have newly found a method of generating a correlation model that considers an index of the structure morphology of a material. The present inventors have developed a method for efficiently generating process-dependent structure morphology data and numerically expressing structure morphology by combining material structure prediction by numerical analysis and topological data analysis (TDA). invented a way to do it. Furthermore, the present inventors invented a method of using this numerical information on tissue morphology to construct a correlation model. A method of generating a correlation model and a material process searching apparatus according to an embodiment of the present invention will be described below.
本実施形態に係る相関モデルの生成方法および材料プロセス探索装置は、材料のプロセス、組織構造、特性の相互関係である相関モデルを生成し、この相関モデルに基づき材料特性や材料プロセスを探索するものである。相関モデルにより、位相的データ解析による組織構造特徴量の数値表現により、数値解析による材料組織形態を予測することができる。材料プロセス探索装置は、相関モデルを用いて、最適な材料プロセスや期待される材料特性の予測値を求めるものである。 The correlation model generation method and material process search device according to the present embodiment generate a correlation model that is the mutual relationship between the process, structure, and properties of a material, and search for material properties and material processes based on this correlation model. is. By using the correlation model, it is possible to predict the material structure morphology by numerical analysis, based on the numerical expression of the structural feature amount by topological data analysis. The material process search device uses a correlation model to find the optimum material process and predicted values of expected material properties.
これらの方法および装置は、数値解析で得られた予測組織から位相的データ解析で形態特徴量を抽出して、組織構造に関係する相関モデルのデータとして利用する事を特徴の一つとしている。 One of the characteristics of these methods and apparatuses is to extract morphological feature values from the predicted tissue obtained by numerical analysis by topological data analysis and use them as data for a correlation model related to tissue structure.
本実施形態に係る相関モデルの生成方法および材料プロセス探索装置において、相関モデルの生成は、任意の材料の種類や、任意の製造プロセス毎に行うことができる。予測対象とする材料としては、その種類は、特に制限されるものではない。予測対象とする材料の具体例としては、金属材料が挙げられるが、金属材料以外の材料、例えば、樹脂材料やセラミックス等であってもよい。 In the correlation model generation method and the material process searching apparatus according to the present embodiment, the correlation model can be generated for each arbitrary material type and arbitrary manufacturing process. The type of material to be predicted is not particularly limited. A specific example of the material to be predicted is a metal material, but it may be a material other than the metal material, such as a resin material or ceramics.
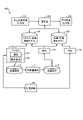
図1は、本発明の実施形態に係る材料プロセス探索装置100における探索方法を示す図である。
材料プロセス探索装置100は、判定対象情報入力部101と、目的情報出力部102と、演算部103と、プロセス-組織相関モデル104と、組織-特性相関モデル105とを含む。材料プロセス探索装置100は更に、不図示のデータベースにプロセス106、組織因子4とそれを含む組織109、特性110、組織画像2を格納する。
FIG. 1 is a diagram showing a searching method in a material
The material
プロセス-組織相関モデル104は、プロセスと材料組織との対応関係に基づく第一の相関モデルである。プロセス-組織相関モデル104では、対象とする材料のプロセス106と、そのプロセス106によって形成される材料の組織109との対応関係が示されている。このプロセス-組織相関モデル104は、プロセス106と組織109との対応関係を、回帰分析や機械学習によって推定した結果である。ユーザがプロセス106で生成された材料の組織画像2を取得し、この組織画像2の特徴量を抽出することで、組織109を構成する組織因子4が得られる。プロセス-組織相関モデル104と演算部103の組み合わせにより、プロセス因子と組織因子との対応を判定するプロセス判定部が具現化される。
The process-
組織-特性相関モデル105は、材料組織と材料特性との対応関係に基づく第二の相関モデルである。組織-特性相関モデル105では、対象とする材料の組織109と、その材料の特性110との対応関係が示されている。ユーザが、プロセス106で生成された材料に対して、特性試験50を実施することで、材料の特性110を得ることができる。この組織-特性相関モデル105と演算部103の組み合わせにより、特性と組織因子との対応を判定する特性判定部が具現化される。
The structure-
はじめに、材料プロセス探索に用いる各相関モデルについて説明する。
プロセス-組織相関モデル104では、対象とする材料のプロセス106と、そのプロセス106によって形成される材料の組織109との対応関係が示されている。プロセス106は、材料の組成107および材料の製造条件108で構成される。組成107は、例えば金属材料における構成元素濃度や、複合材料であれば母材と添加剤の割合などである。また、製造条件108は、材料の状態に変化を与える条件であって、金属材料の凝固過程における冷却速度や、鍛造工程でのひずみ速度、熱処理工程での保持温度や保持時間などである。
First, each correlation model used for material process search will be described.
The process-
材料の組織画像2は、例えば金属材料において光学顕微鏡(Optical Microscope:OM)や走査型電子顕微鏡(Scanning Electron Microscope:SEM)などで観察される結晶組織の画像である。この組織画像2の特徴量を抽出したものが組織因子4である。組織109は、組織因子4によって構成される。プロセス106に応じて組織109は変化するため、プロセス106と組織109の対応関係をプロセス-組織相関モデル104として定義する事ができる。
The
組織109と特性110の対応関係である組織-特性相関モデル105も、プロセス-組織相関モデル104と同様に、組織因子と特性との関係性を回帰分析などで検証する事で定義できる。これにより、組織因子から特性を予測したり、要求特性からあるべき組織因子を推定したりする事ができる。
An organization-
図2は、材料プロセス探索装置100のハードウェア構成図である。
入力装置801は、入力されたデータを記憶する装置であり、ユーザにより入力された、判定対象の材料のプロセス106、組織109、特性110の情報等が記憶される。入力装置801は、例えば、キーボード、マウス、タッチパッド、トラックボール等によって構成することができる。この入力装置801により、判定対象情報入力部101の機能部が具現化される
FIG. 2 is a hardware configuration diagram of the material
The
記憶装置804は、例えば、RAM(Random Access Memory)、ROM(Read Only Memory)、フラッシュメモリ、ハードディスク、光ディスク等によって構成することができる。記憶装置804は、その一部又は全部が、計算機802と一体に設けられてもよい。この記憶装置804には、プロセス-組織相関モデル104や、組織-特性相関モデル105を始めとして、プロセス106、組織109、特性110、組織画像2、組織因子4などの各種情報や、計算機802に材料プロセス探索処理を実行させるためのプログラムなどが格納されている
The
計算機802は、入力されたデータを用いて数値解析を行う装置であり、図1の演算部103を具現化するものである。計算機802は、所定の計算プログラムを実行することにより、入力された材料データや、予め用意された相関モデル等を読み出し、これらを用いた計算処理を実行して、判定対象材料のプロセス106、組織109、特性110の予測値を算出する。
The
なお、計算機802は、数値解析に用いる所定の計算プログラムを演算回路に直接組み込んだ装置であってもよいし、外部に記憶されている所定の計算プログラムを読み込んで実行する装置であってもよい。また、計算機802は、表示処理等の各種処理を実行する機能を備えてもよい。
The
計算機802は、例えば、集積回路等の演算回路、メモリやレジスタが組み込まれたCPU(Central Processing Unit)等の各種の計算装置によって構成することができる。
The
表示装置803は、計算機802が求めた結果を表示する装置であり、計算機802が算出した材料のプロセス106、組織109、特性110の予測値を、数値自体の表示、数値に対応した色やテクスチャ等の分布表示等として、ユーザに表示する。
A
表示装置803は、例えば、液晶ディスプレイ、プラズマディスプレイ、有機ELディスプレイ、ブラウン管等によって構成されており、計算機802と組み合わせて、目的情報出力部102を具現化する。
The
図3は、プロセス-組織相関モデル104について説明するグラフである。
グラフの縦軸は、或る材料の組織因子4の析出相サイズを表し、グラフの横軸は、この材料を生成する際のプロセス106の因子である冷却速度を表す。例えば金属材料の凝固過程において、冷却速度の大きな急冷条件において析出相のサイズが微細化する傾向が観察される。プロセス因子-組織因子対応関係201は、異なる冷却速度での凝固条件と、各条件で得られた凝固組織を光学顕微鏡や走査電子顕微鏡で観察した析出相サイズをプロットしたものである。これら複数の組織因子とプロセス因子の対応関係に基づき、回帰分析を行う事で、回帰曲線202が得られる。回帰曲線202は、プロセス-組織相関モデル104の一例である。プロセス-組織相関モデル104が決まると、プロセス-組織相関モデル104の回帰曲線202から、あるプロセス因子を仮定したときに想定される組織因子が求められる。また、組織因子からプロセス因子を推定することも可能になる。
FIG. 3 is a graph describing the process-
The vertical axis of the graph represents the precipitation phase size of a given material's
なお、相関モデルとして結びつけるプロセス因子および組織因子はそれぞれ一つずつに限らない。複数のプロセス因子と一つの組織因子の対応関係や、複数の組織因子と一つのプロセス因子の対応関係であってもよく、複数の組織因子と複数のプロセス因子の対応関係でもよい。更に、対応関係は誤差範囲を含んでもよく、例えばあるプロセス因子に対して、想定される組織因子が一定の幅に入る、または、ある値より大きくなる(小さくなる)、というものでもよい。更に、プロセス因子と組織因子の対応関係の導出は、回帰分析に限らず、機械学習や深層学習などを活用してもよい。 It should be noted that the number of process factors and tissue factors to be combined as a correlation model is not limited to one each. It may be a correspondence relationship between a plurality of process factors and one tissue factor, a correspondence relationship between a plurality of tissue factors and one process factor, or a correspondence relationship between a plurality of tissue factors and a plurality of process factors. Further, the correspondence may include an error range, for example, an assumed tissue factor falls within a certain range or becomes larger (smaller) than a certain value for a certain process factor. Furthermore, the derivation of the correspondence between process factors and tissue factors is not limited to regression analysis, and machine learning, deep learning, and the like may be used.
図1に戻り説明を続ける。判定対象情報入力部101では、対象とする材料の情報の入力を受け付ける。プロセスから特性を探索する場合は対象のプロセス情報を入力し、特性からプロセスを探索する場合は特性情報を入力する。
Returning to FIG. 1, the description continues. The determination target
演算部103は、判定対象情報に対応する目的情報を出力する。この演算部103は、判定対象のプロセスより目的である材料特性を算出するか、または判定対象の材料特性より目的であるプロセスを算出する。演算部103は、入力された材料情報と事前に定義された相関モデルに基づき、入力情報と対応づけられる組織因子4を同定する。
The
例えば、特性からプロセス106を探索する場合、演算部103は、組織-特性相関モデル105に基づき、判定対象情報入力部101にて入力された材料の特性に対応する組織因子4を同定する。次に、演算部103は、プロセス-組織相関モデル104に基づき、同定された組織因子4に対応するプロセス106を決定する。これらの手続きにより、判定対象情報入力部101で入力された材料の特性に対応するプロセス106の情報が得られる。
For example, when searching for the
また、プロセスから特性110を探索する場合、演算部103は、プロセス-組織相関モデル104に基づき、判定対象情報入力部101にて入力された材料のプロセスに対応する組織因子4を同定する。次に、演算部103は、組織-特性相関モデル105に基づき、同定された組織因子4に対応するプロセス106を決定する。これらの手続きにより、判定対象情報入力部101で入力された材料のプロセスに対応する材料の特性110の情報が得られる。
When searching for the
目的情報出力部102は、演算部103によって探索した結果として得られたプロセスまたは材料の特性を出力する。なお、目的情報出力部102は、演算の途中段階で同定された組織因子を含めて出力してもよい。
The target
また、判定対象情報入力部101は、組織因子の入力を受け付けてもよい。演算部103は、入力された材料情報と事前に定義された相関モデルに基づき、入力情報と対応づけられる組織因子を同定する。例えば、組織因子からプロセス106を探索する場合、演算部103は、プロセス-組織相関モデル104に基づき、判定対象情報入力部101にて入力された材料の組織因子4に対応するプロセス106を決定する。これらの手続きにより、演算部103は、判定対象情報入力部101で入力された材料の特性に対応するプロセス106の情報が得られる。
Further, the determination target
プロセス-組織相関モデル104を生成するために必要なプロセス因子を取得するには、材料の合成や製造・加工工程をモニタリングする必要がある。例えば金属材料では、原料として投入した構成元素の濃度が溶融中に蒸発して減少したり、凝固過程で偏析したりすることで不均一な分布になることがある。また、凝固過程で鋳造する体積が大きい場合には、場所によって冷却速度が変わることがあり、事前に設定した冷却速度と異なる場合がある。そのため、組織を観察する場所ごとに組成や製造条件を確認する必要があり、プロセス因子を取得するには多大なコストが要求される。
In order to obtain the process factors necessary to generate the process-
組織因子4には、一般的に析出相サイズや、結晶相の面積率などが用いられる。しかし、存在比率が同じであっても、系全体に均一に分散している場合と、場所によって疎密が生じている場合では、組織の状態が同じであるとは言えない。また、組織の形態が球状か、針状か、枝分かれしているか、などは、界面強度や濃度偏析に影響する。そのため、組織の形態も材料特性に影響する事が知られている。このような組織の分散状態や形態は数値による定量評価が困難であり、相関モデル生成のための組織因子として積極的に活用されていない。
As the
本発明者らが鋭意研究した結果、数値解析による材料組織予測技術と、位相的データ解析を用いた組織の形態や分散度を含む特徴量の抽出を組み合わせることにより、組織形態および分散度の因子を考慮した相関モデルを高効率に生成し、かつ高精度化する事が可能である事を見出した。 As a result of intensive research by the present inventors, by combining the material structure prediction technology by numerical analysis and the extraction of feature quantities including the morphology and dispersity of the structure using topological data analysis, the factor of the structure morphology and dispersity We found that it is possible to efficiently generate a correlation model considering
図4は、数値解析と位相的データ解析を活用した相関モデル生成方法および材料プロセス探索装置100Aの構成を示す図である。
材料プロセス探索装置100Aは、図1に示した材料プロセス探索装置100に加えて更に、数値解析部21と、位相的データ解析部3Aと、数値材料試験部51とを含み、組織予測画像22を格納している。
FIG. 4 is a diagram showing a configuration of a correlation model generation method and a material
In addition to the material
従来の組織画像2は、光学顕微鏡や走査電子顕微鏡を用いて実験的に観察することで取得(撮像)されていた。これに対して数値解析部21は、材料を生成する所定のプロセスを入力として、数値解析により、このプロセスで生成される材料の組織を予測する組織予測画像22を生成する。これにより実験よりも容易かつ大量に、組織予測画像を生成することができる。
The
位相的データ解析部3Aは、組織画像2や組織予測画像22に対して位相的データ解析を行って、組織因子4を取得する。これにより位相的データ解析部3Aは、組織のサイズや存在比率だけにとどまらず、従来では数値化が困難であった組織の形態や分散度の指標を組織因子4に含ませることができる。位相的データ解析部3Aが取得した組織因子4は、組織-特性相関モデル105やプロセス-組織相関モデル104の生成に用いられる。
Topological
位相的データ解析部3Aは、例えばパーシステントホモロジーを用いた材料組織の特徴量解析を適用する。位相的データ解析部3Aは、パーシステントホモロジーに限らず、位相的データ解析が可能な任意の解析手段を用いてよい。
The topological
数値材料試験部51は、プロセス106の情報に対して数値材料試験を行うことで、このプロセス106で生成される材料の特性110を得るものである。
The numerical
図5Aから図5Dは、材料組織画像から組織の特徴因子を抽出する一連の流れを示す図である。
図5Aは、合金の組織状態を走査電子顕微鏡などで観察して撮像された組織画像である。
組織画像には、複数の結晶相が混在している場合が多い。そのため、ユーザは、色調や明度などを指標としてどの部位がどの結晶相に対応しているかを分類する作業(セグメンテーション)を行う。
5A to 5D are diagrams showing a series of steps for extracting tissue feature factors from material tissue images.
FIG. 5A is a structural image obtained by observing the structural state of the alloy with a scanning electron microscope or the like.
A tissue image often contains a mixture of multiple crystal phases. Therefore, the user performs an operation (segmentation) to classify which portion corresponds to which crystal phase using color tone, brightness, and the like as indices.
図5Bは、セグメンテーションした組織画像の例である。ここで組織画像は、例えばA相とB相とC相の3つのうち何れかに分類される。
最も濃い輝度で示される部位23は、A相に分類される。やや薄い輝度の部位24は、B相に分類される。白色の部位25は、C相に分類される。このようなセグメンテーションは、対象材料に知見のある作業者が経験をもとに実施してもよく、また、機械学習などで生成した分類モデルを適用することで実施してもよい。
FIG. 5B is an example of a segmented tissue image. Here, the tissue image is classified, for example, into one of three phases, A phase, B phase, and C phase.
The
次に、セグメンテーション済みの画像から、評価の対象とする相を抽出して二値化を行う。ここではA相を評価対象として、A相に対応する部位を白く、その他の部位を黒く塗りつぶした二値化画像としている。 Next, the phase to be evaluated is extracted from the segmented image and binarized. Here, the A phase is the object of evaluation, and a binarized image is obtained in which the portion corresponding to the A phase is painted white and the other portions are painted black.
図5Cは、二値化した組織画像の例である。
二値化した組織画像に対してパーシステントホモロジー解析を実施すると、0次のパーシステント図が得られる。これは組織の連結成分や島構造を可視化したものである。
FIG. 5C is an example of a binarized tissue image.
When a persistent homology analysis is performed on the binarized tissue image, a zero-order persistent diagram is obtained. This is a visualization of the connected components and island structures of the tissue.
図5Dにおけるパーシステント図は、二値化画像の評価対象領域(白い領域)を穴とみなして、穴の周囲のピクセルを逐次的に増減させていた時の穴の生成および消滅のステップをプロットしたものである。パーシステント図の横軸は、穴の生成するタイミングを示すbirth軸である。パーシステント図の縦軸は、穴が周囲の穴と結合して消滅するタイミングを示すdeath軸である。 The persistence diagram in FIG. 5D plots the steps of creation and disappearance of a hole when the evaluation target area (white area) of the binarized image is regarded as a hole and the pixels around the hole are sequentially increased and decreased. It is what I did. The horizontal axis of the persistence diagram is the birth axis that indicates the timing at which holes are generated. The vertical axis of the persistence diagram is a death axis that indicates the timing at which a hole merges with surrounding holes and disappears.
元画像の状態をbirthおよびdeathが0のステップと定義して、ステップを巻き戻しながら(0→-1→-2→・・・)、穴の外周からピクセルを一つずつ削除していくと、あるタイミングで穴が消滅する。従って、負のステップ値からステップを増加させていくと、対象とする穴が生成するステップを求めることができる。この時のステップ値をbirth軸にプロットする。 Defining the state of the original image as a step where birth and death are 0, and rewinding the steps (0→-1→-2→...), deleting pixels one by one from the perimeter of the hole , the hole disappears at a certain timing. Therefore, by increasing the step from a negative step value, it is possible to obtain the step generated by the target hole. The step value at this time is plotted on the birth axis.
更にステップを増加させるとともに穴の外周にピクセルを一つずつ追加して穴の領域を拡大していくと、周囲の穴も領域が拡大することに伴い、あるステップで対象とする穴が最近接の穴と結合するステップが求められる。このステップを穴の消滅のステップとして、death軸にプロットする。 As the number of steps is increased and pixels are added to the perimeter of the hole one by one to expand the area of the hole, as the area of the surrounding holes expands, the target hole becomes the closest at a certain step. A step is required to connect with the hole in the This step is plotted on the death axis as the hole's disappearance step.
このように定義して生成したパーシステント図では、death軸が正の領域にプロットされる穴は孤立粒子、death軸が負の領域にプロットされる穴は連結した粒子に相当する。また、孤立粒子においては、death軸の絶対値が大きくなるほど粒子間隔が広い状態を示し、birth軸の絶対値が大きくなるほど粒子サイズが大きい状態を示す。一方、death軸が負の領域にプロットされる穴は、連結した粒子に相当し、プロット位置によって凹凸の大きさや、太さなどの違いが表現される。 In the persistent diagram generated by defining in this way, the holes plotted in the positive region of the death axis correspond to isolated particles, and the holes plotted in the negative region of the death axis correspond to connected particles. In isolated particles, the larger the absolute value of the death axis, the wider the particle spacing, and the larger the absolute value of the birth axis, the larger the particle size. On the other hand, the holes plotted in the area where the death axis is negative correspond to connected particles, and the difference in the size and thickness of the unevenness is expressed depending on the plotted position.
パーシステント図において、プロット頻度の高い領域は、その組織の主要な特徴を示している。従って、例えばパーシステント図における重心位置などの特徴点は、対象とする材料の組織因子4の特徴量として利用することができる。前記の通り、パーシステント図における各種特徴点は従来の組織評価因子では数値表現が困難であった組織の形態や分散状態を示している。これらの組織因子4を組織109の情報としてプロセス-組織相関モデル104および組織-特性相関モデル105を生成することで、新たな説明因子が加わり、相関モデルの精度が向上する。
In the persistence diagram, areas with high plot frequency indicate the major features of the tissue. Therefore, for example, a feature point such as the position of the center of gravity in the persistent diagram can be used as a feature quantity of the
組織画像については、光学顕微鏡や走査電子顕微鏡などにより実際に観察した組織画像に限らず、数値解析により生成した組織予測画像を併用することが可能である。例えば、フェーズフィールド法を用いて対象プロセスをシミュレーション上で再現することで、仮想的に組織画像を生成することができる。また、組織画像の生成は、フェーズフィールド法に限らず、モンテカルロ法やセルオートマトン法など、任意の組織形成予測方法を用いてよい。 The tissue image is not limited to the tissue image actually observed with an optical microscope, scanning electron microscope, or the like, but can also be a tissue prediction image generated by numerical analysis. For example, a virtual tissue image can be generated by reproducing the target process on a simulation using the phase-field method. Moreover, any tissue formation prediction method, such as the Monte Carlo method or the cellular automaton method, may be used to generate the tissue image without being limited to the phase field method.
フェーズフィールド法は、対象材料のプロセス(組成および温度履歴)を定義して、その条件下における材料の組織形成過程を数値解析によって導出する方法である。従って、評価対象の材料組織と、それを形成したプロセスの対応関係が事前に明らかになっている。これは、実験によりプロセス情報を収集する際の多大なコストを簡略化することにつながり、相関モデルを効率よく生成することが可能である。 The phase field method is a method of defining the process (composition and temperature history) of the target material and deriving the structure formation process of the material under those conditions by numerical analysis. Therefore, the correspondence relationship between the material structure to be evaluated and the process forming it is clarified in advance. This leads to simplification of a great deal of cost in collecting process information through experiments, and enables efficient generation of correlation models.
更に、フェーズフィールド法では、個々の結晶組織に対して異なる変数が割り当てられている。つまり、計算で得られた組織画像に対して、どの部位がどの結晶相に対応しているかが、変数の違いによって明示されている。そのため、セグメンテーションにかかる工数が大幅に削減可能である。実験観察で得られる組織画像のセグメンテーションでは、例えば経験者の知見による分類では、見落としや誤った判断によるセグメンテーション精度の低下が少なからず存在する。セグメンテーション精度向上のために、高品質な観察画像を用意する場合には、エッチングや研磨条件の最適化、高倍率での測定などが必要であり、多大な工数が必要である。実験画像に加えて数値解析による組織予測画像を用いることで、相関モデル生成に必要な組織画像データを高効率かつ高精度に提供することが可能となる。 Furthermore, the phase-field method assigns different variables to individual crystal structures. In other words, which part corresponds to which crystal phase in the tissue image obtained by calculation is clearly indicated by the difference in variables. Therefore, the man-hours required for segmentation can be greatly reduced. In the segmentation of tissue images obtained by experimental observation, for example, in the classification based on the knowledge of an experienced person, the segmentation accuracy is not a little reduced due to oversights and erroneous judgments. In order to prepare a high-quality observation image in order to improve the segmentation accuracy, optimization of etching and polishing conditions, measurement at high magnification, etc. are necessary, and a large number of man-hours are required. By using tissue prediction images obtained by numerical analysis in addition to experimental images, it is possible to provide tissue image data necessary for correlation model generation with high efficiency and high accuracy.
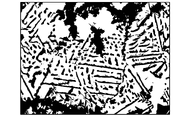
図6Aは、Cr基合金の凝固組織を実際の走査電子顕微鏡で撮影した実験画像である。図6Bは、この実験画像のパーシステント図である。図6Aに示す白黒の二値化画像において、白い部分が炭化物相に相当する。 FIG. 6A is an experimental image of a solidified structure of a Cr-based alloy taken by an actual scanning electron microscope. FIG. 6B is a persistent view of this experimental image. In the black and white binarized image shown in FIG. 6A, the white portion corresponds to the carbide phase.
図7Aは、Cr基合金の凝固組織の予測画像である。図7Bは、この予測画像のパーシステント図である。図7Aに示す白黒の二値化画像において、白い部分が炭化物相に相当する。 FIG. 7A is a predicted image of the solidified structure of a Cr-based alloy. FIG. 7B is a persistent diagram of this predicted image. In the black and white binarized image shown in FIG. 7A, the white portion corresponds to the carbide phase.
図6Aの実験画像と図7Aの予測画像を比較すると、分散粒子状態の炭化物や、針状に伸びた炭化物など、組織の形態やサイズ、分布状態は実験画像と予測画像で近い状態にあることが分かる。ここでは、両者に対してパーシステントホモロジー解析を実施してパーシステント図で比較している。パーシステント図で表現することで、プロットの多い領域や、プロット全体の広がりなどを数値的に比較することができる。 Comparing the experimental image of FIG. 6A and the predicted image of FIG. 7A, the morphology, size, and distribution of the structure, such as carbides in the form of dispersed particles and needle-like elongated carbides, are similar between the experimental image and the predicted image. I understand. Here, a persistent homology analysis is performed on both and the persistent diagrams are compared. By using persistent diagrams, it is possible to numerically compare areas with many plots and the spread of the entire plot.
主要な組織特徴点として、例えば連結粒子の状態を表す、death軸が負となる下部領域の重心(下部重心)に注目する。図6Bの実験画像のパーシステント図の重心座標(birth,death)が(-96,-21)であるのに対して、図7Bの予測画像のパーシステント図の重心座標は(-95,-30)となり、よく一致している。
数値解析で再現可能な組織因子に基づいて相関モデルを整理すれば、実験画像と予測画像を統合することが可能になる。
As a major tissue feature point, for example, attention is paid to the center of gravity of the lower region (lower center of gravity) where the death axis is negative, which represents the state of connected particles. The barycentric coordinates (birth, death) of the persistent diagram of the experimental image in FIG. 6B are (-96, -21), while the barycentric coordinates of the persistent diagram of the predicted image in FIG. 30), which is in good agreement.
By organizing the correlation model based on tissue factors that can be reproduced by numerical analysis, it becomes possible to integrate the experimental and predicted images.
図8は、材料組織の実験画像と予測画像を併用した相関モデル生成を示すグラフである。
グラフの縦軸は、組織因子のうち何れかである。グラフの横軸は、プロセス因子のうち何れかである。円形のプロットは、実験で得られたプロセス因子-組織因子対応関係601である。三角形のプロットは、数値解析で実験結果の再現性を検証したプロセス因子-組織因子対応関係602と実験で検証していない領域に対して前記検証済みの数値解析モデルで予測したプロセス因子-組織因子対応関係603である。破線は、プロセス因子-組織因子対応関係601~603に基づいて算出した回帰曲線604である。
FIG. 8 is a graph showing correlation model generation using both experimental images and predicted images of material structures.
The vertical axis of the graph is any of the tissue factors. The horizontal axis of the graph is any of the process factors. A circular plot is the process factor-
実験で得られたプロセス因子-組織因子対応関係601に加えて、数値解析で実験結果の再現性を検証したプロセス因子-組織因子対応関係602、および、実験で検証していない領域に対して前記検証済みの数値解析モデルで予測したプロセス因子-組織因子対応関係603を用いて回帰分析などを行うことで、実験結果のみに基づいて作成した回帰曲線よりも高精度な回帰曲線604が得られる。
In addition to the process factor-
図9は、相関モデル生成処理のフローチャートである。
最初、演算部103は、実験画像のプロセス因子を内挿するプロセス因子を決定する(ステップS10)。数値解析部21は、演算部103が決定したプロセス因子から生成される材料の組織の予測画像を生成する(ステップS11)。
次に位相的データ解析部3Aは、生成した予測画像と実験画像の位相的データ解析により、材料組織の情報を取得する(ステップS12)。そして、演算部103は、材料を生成する各プロセス因子と材料組織の情報の相関によりプロセス-組織相関モデル104を生成すると(ステップS13)、図9の処理を終了する。
FIG. 9 is a flowchart of correlation model generation processing.
First, the
Next, the topological
図10は、実験の外挿領域に対して予測した組織画像を用いて相関モデルを拡張可能であることを示すグラフである。
グラフの縦軸は、組織因子のうち何れかである。グラフの横軸は、プロセス因子のうち何れかである。円形のプロットは、実験で確認したプロセス因子-組織因子対応関係701である。三角形のプロットは、数値解析で内挿補間したプロセス因子-組織因子対応関係702である。粗い破線は、実験データおよび内挿領域の数値解析データに基づいた回帰曲線704である。正方形のプロットは、これまで実験で確認してこなかった外挿領域でのプロセス因子-組織因子対応関係703であり、細かい破線は、実験データおよび内挿領域の数値解析データに加えて、外挿領域の数値解析データを併用した回帰曲線705である。
FIG. 10 is a graph showing that the correlation model can be extended with predicted tissue images for the extrapolated region of the experiment.
The vertical axis of the graph is any of the tissue factors. The horizontal axis of the graph is any of the process factors. A circular plot is the process factor-
図10は、実験的に検証したプロセス因子の領域の外側(外挿領域)に対しても予測画像の組織因子を用いることで、相関モデルを拡張可能であることを示している。実験で確認したプロセス因子-組織因子対応関係701および数値解析で内挿補間したプロセス因子-組織因子対応関係702に加えて、これまで実験で確認してこなかった外挿領域でのプロセス因子-組織因子対応関係703についても数値解析でデータ生成が可能であり、相関モデル生成のためのデータとして活用することができる。実験データおよび内挿領域の数値解析データに基づいた回帰曲線704に比較して、外挿領域の数値解析データを併用した回帰曲線705は、外挿領域の材料プロセス探索において高精度な相関モデルとして利用することができる。
FIG. 10 shows that the correlation model can be extended by using the tissue factor of the predicted image even outside the experimentally verified process factor region (extrapolation region). In addition to the process factor-
図11は、相関モデル生成処理のフローチャートである。
最初、演算部103は、実験画像のプロセス因子を外挿または内挿するプロセス因子を決定する(ステップS10A)。以降の処理は、図9で示したステップS11~S13の処理と同様である。
FIG. 11 is a flowchart of correlation model generation processing.
First, the
(変形例)
本発明は上記した実施形態に限定されるものではなく、様々な変形例が含まれる。例えば上記した実施形態は、本発明を分かりやすく説明するために詳細に説明したものであり、必ずしも説明した全ての構成を備えるものに限定されるものではない。ある実施形態の構成の一部を他の実施形態の構成に置き換えることが可能であり、ある実施形態の構成に他の実施形態の構成を加えることも可能である。また、各実施形態の構成の一部について、他の構成の追加・削除・置換をすることも可能である。
(Modification)
The present invention is not limited to the above-described embodiments, and includes various modifications. For example, the above-described embodiments have been described in detail in order to explain the present invention in an easy-to-understand manner, and are not necessarily limited to those having all the described configurations. A part of the configuration of one embodiment can be replaced with the configuration of another embodiment, and it is also possible to add the configuration of another embodiment to the configuration of one embodiment. Moreover, it is also possible to add, delete, or replace a part of the configuration of each embodiment with another configuration.
上記の各構成、機能、処理部、処理手段などは、それらの一部または全部を、例えば集積回路などのハードウェアで実現してもよい。上記の各構成、機能などは、プロセッサがそれぞれの機能を実現するプログラムを解釈して実行することにより、ソフトウェアで実現してもよい。各機能を実現するプログラム、テーブル、ファイルなどの情報は、メモリ、ハードディスク、SSD(Solid State Drive)などの記録装置、または、フラッシュメモリカード、DVD(Digital Versatile Disk)などの記録媒体に置くことができる。 Some or all of the above configurations, functions, processing units, processing means, etc. may be realized by hardware such as integrated circuits. Each of the above configurations, functions, etc. may be realized by software by a processor interpreting and executing a program for realizing each function. Information such as programs, tables, and files that implement each function can be stored in recording devices such as memory, hard disks, SSDs (Solid State Drives), or recording media such as flash memory cards and DVDs (Digital Versatile Disks). can.
各実施形態に於いて、制御線や情報線は、説明上必要と考えられるものを示しており、製品上必ずしも全ての制御線や情報線を示しているとは限らない。実際には、殆ど全ての構成が相互に接続されていると考えてもよい。
本発明の変形例として、例えば、次の(a),(b)のようなものがある。
In each embodiment, control lines and information lines indicate those considered necessary for explanation, and not all control lines and information lines are necessarily indicated on the product. In fact, it may be considered that almost all configurations are interconnected.
Modifications of the present invention include, for example, the following (a) and (b).
(a) 本発明は、単一の計算機として実装された材料プロセス探索装置100,100Aに限定されず、複数の装置が連携して材料プロセスを探索する材料プロセス探索システムとして実装してもよい。
(a) The present invention is not limited to material
(b) 数値材料試験部51が、プロセス因子と特性との対応関係の実験データを内挿または外挿するように、プロセス因子からこの材料の特性情報を算出してもよい。これにより、組織-特性相関モデル105を高効率に作成可能である。
(b) The numerical
100 材料プロセス探索装置
101 判定対象情報入力部
102 目的情報出力部
103 演算部
104 プロセス-組織相関モデル
105 組織-特性相関モデル
106 プロセス
107 組成
108 製造条件
109 組織
110 特性
2 組織画像
21 数値解析部
22 組織予測画像
23~25 部位
3 特徴量抽出
3A 位相的データ解析部
4 組織因子
50 特性試験
51 数値材料試験部
201 プロセス因子-組織因子対応関係
202 回帰曲線
601~603,701~703 プロセス因子-組織因子対応関係
604,704,705 回帰曲線
801 入力装置
802 計算機
803 表示装置
804 記憶装置
100 Material
Claims (12)
前記プロセスと前記材料組織との対応関係に基づく第一の相関モデルを有するプロセス判定部と、
前記材料組織と前記材料特性との対応関係に基づく第二の相関モデルを有する特性判定部と、
判定対象の前記プロセスより前記材料特性を算出するか、または判定対象の前記材料特性より前記プロセスを算出する演算部と、
を備えることを特徴とする材料プロセス探索装置。 a database storing material texture information, including process combinations of composition and manufacturing conditions, material properties, and indices of texture morphology and dispersity based on material texture images;
a process determination unit having a first correlation model based on the corresponding relationship between the process and the material structure;
a property determination unit having a second correlation model based on the correspondence relationship between the material structure and the material property;
a calculation unit that calculates the material properties from the process to be determined, or calculates the process from the material properties to be determined;
A material process searching device comprising:
を備えることを特徴とする請求項1に記載の材料プロセス探索装置。 a topological data analysis unit that performs topological data analysis of the material structure image to acquire information of the material structure in the first correlation model and the second correlation model;
The material process searching device according to claim 1, characterized by comprising:
前記位相的データ解析部は、実験により取得した材料組織画像と前記数値解析部が生成した材料組織画像に基づき、前記材料組織の情報を取得する、
ことを特徴とする請求項2に記載の材料プロセス探索装置。 further comprising a numerical analysis unit that generates the material structure image by numerical analysis,
The topological data analysis unit acquires information on the material structure based on the material structure image obtained by the experiment and the material structure image generated by the numerical analysis unit.
The material process searching apparatus according to claim 2, characterized in that:
ことを特徴とする請求項3に記載の材料プロセス探索装置。 The numerical analysis unit generates, by numerical analysis, a material texture image generated by another process that interpolates the material texture image of the material generated by a predetermined process.
The material process searching apparatus according to claim 3, characterized by:
ことを特徴とする請求項3に記載の材料プロセス探索装置。 The numerical analysis unit generates, by numerical analysis, a material texture image generated by another process that extrapolates the material texture image of the material generated by a predetermined process.
The material process searching apparatus according to claim 3, characterized by:
を備えることを特徴とする請求項1に記載の材料プロセス探索装置。 a determination target information input unit for inputting the process to be determined or the material properties to be determined as determination target information;
The material process searching device according to claim 1, characterized by comprising:
を備えることを特徴とする請求項1に記載の材料プロセス探索装置。 a target information output unit that outputs the process to be determined calculated by the computing unit or the material properties to be determined as target information;
The material process searching device according to claim 1, characterized by comprising:
を備えることを特徴とする請求項1に記載の材料プロセス探索装置。 Numerical material testing department that calculates the characteristics of the material produced by the process by numerical material testing from the information of the process;
The material process searching device according to claim 1, characterized by comprising:
前記プロセスと前記材料組織との対応関係に基づく第一の相関モデルを有するプロセス判定部と、
前記材料組織と前記材料特性との対応関係に基づく第二の相関モデルを有する特性判定部と、
判定対象の前記プロセスより前記材料特性を算出するか、または判定対象の前記材料特性より前記プロセスを算出する演算部と、
を備えることを特徴とする材料プロセス探索システム。 a database storing material texture information, including process combinations of composition and manufacturing conditions, material properties, and indices of texture morphology and dispersity based on material texture images;
a process determination unit having a first correlation model based on the corresponding relationship between the process and the material structure;
a property determination unit having a second correlation model based on the correspondence relationship between the material structure and the material property;
a calculation unit that calculates the material properties from the process to be determined, or calculates the process from the material properties to be determined;
A material process search system comprising:
位相的データ解析部が、数値解析によって生成された材料組織画像および他のプロセスで生成された材料を撮像した材料組織画像の位相的データ解析を行って、材料組織の情報を取得するステップと、
材料を生成したプロセスの因子と、前記材料に係る材料組織の情報との相関により相関モデルを生成するステップと、
を実行することを特徴とする相関モデル生成方法。 a numerical analysis unit generating a material structure image generated by a predetermined process by numerical analysis;
a step in which the topological data analysis unit performs topological data analysis of the material texture image generated by the numerical analysis and the material texture image obtained by imaging the material generated by another process to obtain material texture information;
generating a correlation model by correlating factors of the process that generated the material and material structure information related to the material;
A correlation model generation method characterized by executing
を実行することを特徴とする請求項10に記載の相関モデル生成方法。 the numerical analysis unit determining the predetermined process to interpolate other processes that produced the imaged material;
11. The correlation model generation method according to claim 10, wherein:
を実行することを特徴とする請求項10に記載の相関モデル生成方法。 the numerical analysis unit determining the predetermined process to extrapolate other processes that produced the imaged material;
11. The correlation model generation method according to claim 10, wherein:
Priority Applications (1)
| Application Number | Priority Date | Filing Date | Title |
|---|---|---|---|
| JP2021071500A JP2022166350A (en) | 2021-04-21 | 2021-04-21 | Material process search device, material process search system and correlation model generation method |
Applications Claiming Priority (1)
| Application Number | Priority Date | Filing Date | Title |
|---|---|---|---|
| JP2021071500A JP2022166350A (en) | 2021-04-21 | 2021-04-21 | Material process search device, material process search system and correlation model generation method |
Publications (1)
| Publication Number | Publication Date |
|---|---|
| JP2022166350A true JP2022166350A (en) | 2022-11-02 |
Family
ID=83851644
Family Applications (1)
| Application Number | Title | Priority Date | Filing Date |
|---|---|---|---|
| JP2021071500A Pending JP2022166350A (en) | 2021-04-21 | 2021-04-21 | Material process search device, material process search system and correlation model generation method |
Country Status (1)
| Country | Link |
|---|---|
| JP (1) | JP2022166350A (en) |
Cited By (1)
| Publication number | Priority date | Publication date | Assignee | Title |
|---|---|---|---|---|
| WO2025057534A1 (en) * | 2023-09-11 | 2025-03-20 | パナソニックIpマネジメント株式会社 | Search device, search method, and program |
Citations (3)
| Publication number | Priority date | Publication date | Assignee | Title |
|---|---|---|---|---|
| WO2020152993A1 (en) * | 2019-01-21 | 2020-07-30 | Jfeスチール株式会社 | Design assistance method for metal material, prediction model generation method, metal material manufacturing method, and design assistance device |
| WO2021153633A1 (en) * | 2020-01-29 | 2021-08-05 | Jfeスチール株式会社 | Metal structure phase classification method, metal structure phase classification device, metal structure phase learning method, metal structure phase learning device, material property prediction method for metal material, and material property prediction device for metal material |
| WO2021199937A1 (en) * | 2020-03-31 | 2021-10-07 | Jfeスチール株式会社 | Method for determining condition for imaging of metallographic structure, method for imaging metallographic structure, method for classifying phases of metallographic structure, device for determining condition for imaging of metallographic structure, device for imaging metallographic structure, device for classifying phases of metallographic structure, method for predicting material properties of metallic material, and device for predicting material properties of metallic material |
-
2021
- 2021-04-21 JP JP2021071500A patent/JP2022166350A/en active Pending
Patent Citations (4)
| Publication number | Priority date | Publication date | Assignee | Title |
|---|---|---|---|---|
| WO2020152993A1 (en) * | 2019-01-21 | 2020-07-30 | Jfeスチール株式会社 | Design assistance method for metal material, prediction model generation method, metal material manufacturing method, and design assistance device |
| WO2020152750A1 (en) * | 2019-01-21 | 2020-07-30 | Jfeスチール株式会社 | Design assistance method for metal material, prediction model generation method, metal material manufacturing method, and design assistance device |
| WO2021153633A1 (en) * | 2020-01-29 | 2021-08-05 | Jfeスチール株式会社 | Metal structure phase classification method, metal structure phase classification device, metal structure phase learning method, metal structure phase learning device, material property prediction method for metal material, and material property prediction device for metal material |
| WO2021199937A1 (en) * | 2020-03-31 | 2021-10-07 | Jfeスチール株式会社 | Method for determining condition for imaging of metallographic structure, method for imaging metallographic structure, method for classifying phases of metallographic structure, device for determining condition for imaging of metallographic structure, device for imaging metallographic structure, device for classifying phases of metallographic structure, method for predicting material properties of metallic material, and device for predicting material properties of metallic material |
Non-Patent Citations (1)
| Title |
|---|
| 足立 吉隆: "機械学習支援の材料情報統合システム", システム/制御/情報, vol. 第61巻,第5号, JPN6025015650, 15 May 2017 (2017-05-15), JP, ISSN: 0005576712 * |
Cited By (1)
| Publication number | Priority date | Publication date | Assignee | Title |
|---|---|---|---|---|
| WO2025057534A1 (en) * | 2023-09-11 | 2025-03-20 | パナソニックIpマネジメント株式会社 | Search device, search method, and program |
Similar Documents
| Publication | Publication Date | Title |
|---|---|---|
| CN110858505B (en) | System and method for predicting structure and properties of atomic elements and their alloy materials | |
| Swetlana et al. | Development of Vickers hardness prediction models via microstructural analysis and machine learning | |
| Donegan et al. | Extreme value analysis of tail departure from log-normality in experimental and simulated grain size distributions | |
| JP7330712B2 (en) | Material property prediction device and material property prediction method | |
| TWI802294B (en) | Test site recommendation device, test site recommendation method, and semiconductor device manufacturing system | |
| US9070203B2 (en) | Identification and quantification of microtextured regions in materials with ordered crystal structure | |
| Benito et al. | Microstructural analysis of powder metallurgy tool steels in the context of abrasive wear behavior: a new computerized approach to stereology | |
| JP2022166350A (en) | Material process search device, material process search system and correlation model generation method | |
| WO2020225959A1 (en) | Design assistance system, design assistance method, and design assistance program | |
| US11762562B2 (en) | Performance analysis apparatus and performance analysis method | |
| JP2013025702A (en) | Patent evaluation device and inventor evaluation device | |
| JP7406441B2 (en) | Manufacturing defect factor search method and manufacturing defect factor search device | |
| JPWO2020075436A1 (en) | Prediction status visualization device, forecast status visualization method and forecast status visualization program | |
| JP2019003453A (en) | Defect factor analysis system and defect factor analysis method | |
| Rauch et al. | Identification of multi-inclusion statistically similar representative volume element for advanced high strength steels by using data farming approach | |
| JP2012038012A (en) | Defective factor extraction device, defective factor extraction method, program and recording medium | |
| CN118901105A (en) | Material characteristic value prediction method, learning completion model generation method, program and device | |
| JP2020204824A (en) | Information processing system and information processing method | |
| JP7718610B2 (en) | Quality factor estimation method, operation condition change method, model generation method, quality factor estimation device, and operation condition change device | |
| JP2024139245A (en) | Condition prediction method, program, and device | |
| US9275484B2 (en) | Goodness of fit based on error calculation and fit type | |
| Bitka et al. | Analysis of the possibility of using exploration and learning algorithms in the production of castings | |
| He et al. | Instance segmentation and microstructure characterization based on powder microscopic image data | |
| TWI905671B (en) | Cost Prediction System and Methods | |
| Iyer et al. | MIST (MIcrostrusture STatistics): a open source library in python for the analysis of anisotropic microstructures |
Legal Events
| Date | Code | Title | Description |
|---|---|---|---|
| A621 | Written request for application examination |
Free format text: JAPANESE INTERMEDIATE CODE: A621 Effective date: 20240201 |
|
| A131 | Notification of reasons for refusal |
Free format text: JAPANESE INTERMEDIATE CODE: A131 Effective date: 20250422 |
|
| A02 | Decision of refusal |
Free format text: JAPANESE INTERMEDIATE CODE: A02 Effective date: 20250916 |