JP2021136832A - Power supply and demand plan creation device and power supply and demand plan creation method - Google Patents
Power supply and demand plan creation device and power supply and demand plan creation method Download PDFInfo
- Publication number
- JP2021136832A JP2021136832A JP2020033530A JP2020033530A JP2021136832A JP 2021136832 A JP2021136832 A JP 2021136832A JP 2020033530 A JP2020033530 A JP 2020033530A JP 2020033530 A JP2020033530 A JP 2020033530A JP 2021136832 A JP2021136832 A JP 2021136832A
- Authority
- JP
- Japan
- Prior art keywords
- data
- power
- adjustment
- price
- demand
- Prior art date
- Legal status (The legal status is an assumption and is not a legal conclusion. Google has not performed a legal analysis and makes no representation as to the accuracy of the status listed.)
- Granted
Links
Images


Classifications
-
- Y—GENERAL TAGGING OF NEW TECHNOLOGICAL DEVELOPMENTS; GENERAL TAGGING OF CROSS-SECTIONAL TECHNOLOGIES SPANNING OVER SEVERAL SECTIONS OF THE IPC; TECHNICAL SUBJECTS COVERED BY FORMER USPC CROSS-REFERENCE ART COLLECTIONS [XRACs] AND DIGESTS
- Y04—INFORMATION OR COMMUNICATION TECHNOLOGIES HAVING AN IMPACT ON OTHER TECHNOLOGY AREAS
- Y04S—SYSTEMS INTEGRATING TECHNOLOGIES RELATED TO POWER NETWORK OPERATION, COMMUNICATION OR INFORMATION TECHNOLOGIES FOR IMPROVING THE ELECTRICAL POWER GENERATION, TRANSMISSION, DISTRIBUTION, MANAGEMENT OR USAGE, i.e. SMART GRIDS
- Y04S10/00—Systems supporting electrical power generation, transmission or distribution
- Y04S10/50—Systems or methods supporting the power network operation or management, involving a certain degree of interaction with the load-side end user applications
Landscapes
- Supply And Distribution Of Alternating Current (AREA)
- Management, Administration, Business Operations System, And Electronic Commerce (AREA)
Abstract
Description
本開示は、電力需給計画作成装置及び電力需給計画作成方法に関する。 The present disclosure relates to a power supply and demand planning device and a power supply and demand planning method.
日本では近年、電力自由化が推進されており、2020年には発電事業と送電事業とを分離する発送電分離の実施が予定されている。2021年には需給調整市場が開設される予定であり、従来、電力会社の発電部門と送配電部門とが一体的に確保していた発電機の調整力は、需給調整市場で取引されることになる。ここで、調整力とは、変動する電力需要に対して需給一致及び周波数調整を図るために予め確保される発電機の余力である。発電事業者は、自社が保有する発電機の余力を調整力として送配電事業者に売ることができるが、その分だけ調整力を目的としない電力として取引する機会を失うことになる。したがって、電力取引の機会損失を見込んで、最経済となるように調整力及び電力の取引を行うことが、発電事業者の収益増加にとって重要となる。収益は、調整力及び電力の価格に大きく依存することから、収益の変動リスクも考慮して取引計画と発電機運転計画とを作成することが必要である。 In recent years, the liberalization of electric power has been promoted in Japan, and in 2020, it is planned to implement the separation of electric power transmission and transmission, which separates the power generation business and the transmission business. The supply and demand adjustment market is scheduled to open in 2021, and the adjustment power of the generator, which was conventionally secured by the power generation department and the power transmission and distribution department of the electric power company, will be traded in the supply and demand adjustment market. become. Here, the adjusting power is the surplus power of the generator secured in advance in order to match the supply and demand and adjust the frequency with respect to the fluctuating power demand. Power generation companies can sell the surplus power of their own generators to power transmission and distribution companies as adjustment power, but they will lose the opportunity to trade as power that does not aim for adjustment power. Therefore, it is important for the power generation company to increase the profits by trading the adjustment power and the electric power so as to be the most economical in anticipation of the opportunity loss of the electric power transaction. Since profits largely depend on adjustment power and electricity prices, it is necessary to prepare a transaction plan and a generator operation plan in consideration of the risk of fluctuations in profits.
特許文献1には、電力需要予測値及び電力市場価格予測値の確率分布からリスクを考慮して、運転効率や運用経済性を最適に維持する発電機運転計画及び電力取引計画を作成する技術が提案されている。 Patent Document 1 describes a technique for creating a generator operation plan and an electric power transaction plan that optimally maintain operating efficiency and operational economic efficiency in consideration of risks from the probability distribution of electric power demand forecast values and electric power market price forecast values. Proposed.
特許文献2には、収益の変動リスクとなる要因として、降水量、日射量、電力取引価格などを考慮して、発電機運転計画及び電力取引計画を作成する技術が提案されている。
しかしながら、これらの技術は、調整力の取引を計画しないという問題があった。 However, these technologies have the problem of not planning coordination trading.
そこで、本開示は、上記のような問題点を鑑みてなされたものであり、調整力の取引計画を作成可能な技術を提供することを目的とする。 Therefore, the present disclosure has been made in view of the above-mentioned problems, and an object of the present disclosure is to provide a technique capable of creating a transaction plan of adjustment power.
本開示に係る電力需給計画作成装置は、スポット市場で取り引きされる電力の将来の約定価格を時系列で表す1以上のスポット価格シナリオデータと、需給調整市場で取り引きされる調整力の将来の約定価格を時系列で表す1以上の調整力価格シナリオデータと、前記調整力の将来の発動割合を時系列で表す1以上の調整力発動割合シナリオデータと、前記電力及び前記調整力を生成する発電機の仕様を表す発電機データと、前記発電機の将来の燃料価格を時系列で表す1以上の燃料価格データとを取得する取得部と、前記取得部で取得された前記スポット価格シナリオデータ、前記調整力価格シナリオデータ、前記調整力発動割合シナリオデータ、前記発電機データ、及び、前記燃料価格データに基づいて、電気事業の損失から前記電気事業の収益を引いた損益を表す目的関数の最適化問題であって前記目的関数が表す前記損益を最小化する最適化問題を解くことにより、発電機運転計画と、前記スポット市場及び前記需給調整市場での取引計画とを作成する計画作成部とを備える。 The power supply and demand planning device according to the present disclosure includes one or more spot price scenario data representing the future contracted prices of electricity traded in the spot market in chronological order, and future contracts of adjustment power traded in the supply and demand adjustment market. One or more adjustment power price scenario data representing the price in chronological order, one or more adjustment power activation ratio scenario data representing the future activation ratio of the adjustment power in chronological order, the electric power and the power generator generating the adjustment power. An acquisition unit that acquires generator data representing the specifications of the generator and one or more fuel price data representing the future fuel price of the generator in chronological order, and the spot price scenario data acquired by the acquisition unit. Optimal of the objective function representing the profit / loss obtained by subtracting the profit of the electric business from the loss of the electric business based on the adjustment power price scenario data, the adjustment power activation ratio scenario data, the generator data, and the fuel price data. A planning unit that creates a generator operation plan and a transaction plan in the spot market and the supply and demand adjustment market by solving the optimization problem that minimizes the profit and loss represented by the objective function. To be equipped.
本開示によれば、スポット価格シナリオデータ、調整力価格シナリオデータ、調整力発動割合シナリオデータ、発電機データ、及び、燃料価格データに基づいて、目的関数が表す損益を最小化する最適化問題を解くことにより、発電機運転計画と、スポット市場及び需給調整市場での取引計画とを作成する。このような構成によれば、調整力の取引計画を作成することができる。 According to the present disclosure, based on spot price scenario data, adjustment power price scenario data, adjustment power activation ratio scenario data, generator data, and fuel price data, an optimization problem that minimizes the profit and loss represented by the objective function is solved. By solving, a generator operation plan and a transaction plan in the spot market and the supply and demand adjustment market are created. With such a configuration, it is possible to create a transaction plan for coordinating power.
<実施の形態1>
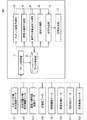
図1は、本実施の形態1に係る電力需給計画作成装置の概略構成図である。図1に示すように、電力需給計画作成装置100は、演算に必要なデータを取得するデータ取得部11と、演算に必要なデータ及び演算結果を格納するデータ格納部12と、電気事業の損益を表す目的関数の最適化問題を解くことにより発電機運転計画とスポット市場(電力)及び需給調整市場(調整力)での取引計画とを作成する計画作成部16と、計画作成部16で作成された発電機運転計画及び取引計画を出力する計画出力部17とを備える。
<Embodiment 1>
FIG. 1 is a schematic configuration diagram of the power supply and demand planning device according to the first embodiment. As shown in FIG. 1, the power supply /
ここで電気事業の損益は、発電コストと、電力の取引による収益と、調整力の取引による収益と、調整力の発動による発電コストとを合わせた収支である。具体的には、電気事業の損益は、電気事業の損失(コスト)から電気事業の収益を引いて得られた値であり、電気事業の損益の正の値は全体として損失であることを表し、当該損益の負の値は全体として収益であることを表す。なお本実施の形態1では、発電コストは、計画期間に亘って、計画の対象となるすべての発電機が発電するのに必要なコストの総額を意味する。 Here, the profit and loss of the electricity business is the balance of the power generation cost, the profit from the electric power transaction, the profit from the adjustment power transaction, and the power generation cost due to the activation of the adjustment power. Specifically, the profit / loss of the electric business is the value obtained by subtracting the profit of the electric business from the loss (cost) of the electric business, and the positive value of the profit / loss of the electric business is the loss as a whole. , The negative value of the profit or loss indicates that it is profit as a whole. In the first embodiment, the power generation cost means the total cost required for all the generators to be planned to generate power over the planning period.
取得部であるデータ取得部11は、スポット価格シナリオデータ121、調整力価格シナリオデータ122、調整力発動割合シナリオデータ123、発電機データ114、及び、燃料価格データ115を取得し、各データをデータ格納部12に格納する。
The
スポット価格シナリオデータ121は、図2に示すように、スポット市場で取り引きされると想定される将来の電力の約定価格を時系列で表すデータである。スポット価格シナリオデータ121は、市場で公開されている最新の約定価格の実績値を元に設定されてもよいし、ユーザ自身が入札履歴などを参考にして求めた想定値を元に設定されてもよい。
As shown in FIG. 2, the spot
調整力価格シナリオデータ122は、需給調整市場で取り引きされると想定される将来の調整力の約定価格を時系列で表すデータである。調整力価格シナリオデータ122は、市場で公開されている最新の約定価格の実績値を元に設定されてもよいし、ユーザ自身が入札履歴などを参考にして求めた想定値を元に設定されてもよい。
The adjustment power
調整力発動割合シナリオデータ123は、想定される将来の調整力の発動割合(発電割合)を時系列で表すデータである。調整力発動割合シナリオデータ123は、市場で公開されている最新の約定量及び発動量の実績値を元に設定されてもよいし、ユーザ自身が入札履歴及び発動実績などを参考にして求めた想定値を元に設定されてもよい。
The adjustment power activation
発電機データ114は、電力及び調整力を生成する発電機の仕様を表すデータである。発電機データ114は、例えば発電機の出力上下限値、出力変化速度、燃料種別、起動費、最小運転時刻、最小停止時刻、燃料消費の特性、燃料消費量曲線係数、起動停止回数上限値、故障発生モデルパラメータなどを含む。
The
燃料価格データ115は、発電機の想定される将来の単位量あたりの燃料価格ひいてはその変動を時系列で表すデータである。燃料価格データ115は、例えば過去の燃料価格の推移に基づいて算出される。燃料は、例えば石炭、LNG、石油などを含む。
The
図3は、本実施の形態1に係る電力需給計画作成装置100のデータフローを示す概略構成図である。
FIG. 3 is a schematic configuration diagram showing a data flow of the power supply and
計画作成部16は、データ取得部11で取得されたスポット価格シナリオデータ121、調整力価格シナリオデータ122、調整力発動割合シナリオデータ123、発電機データ114、及び、燃料価格データ115に基づいて、電気事業の損益を表す目的関数及びその制約条件を定式化する。そして、計画作成部16は、目的関数が表す損益を最小化する最適化問題を解くことで発電機運転計画並びに電力及び調整力の取引計画を作成する。
The
発電機運転計画は起動停止計画データ124及び発電量計画データ125として算出され、電力の取引計画は電力取引計画データ126として算出され、調整力の取引計画は調整力取引計画データ127として算出される。
The generator operation plan is calculated as start /
起動停止計画データ124は、計画期間における発電機の起動または停止の状態を時系列で表すデータである。また発電量計画データ125は、計画期間における発電機で発電される発電量を時系列で表すデータである。電力取引計画データ126及び調整力取引計画データ127は、計画期間における入札価格を時系列で表すデータである。
The start /
次に、計画作成部16による、発電機運転計画、並びに、電力及び調整力の取引計画の最適化問題の演算の一例について説明する。
Next, an example of the calculation of the generator operation plan and the optimization problem of the transaction plan of the electric power and the adjusting power by the
計画作成部16は、目的関数が表す損益を最小化する最適化問題を解く。具体的には、「計画期間の各時刻において発電機の出力の合計を電力の取引量に一致させる制約条件」、及び「発電機の出力の余力の合計を調整力の取引量以上とする制約条件」の下で、目的関数が表す損益を最小化する最適化問題を解く。これにより、電気事業全体としての損失が最小化され、電気事業全体としての収益が最大化される。計画作成部16は、電気事業の損益が最小化されたときの起動停止計画データ124、発電量計画データ125、電力取引計画データ126、及び、調整力取引計画データ127を求める。
The
計画作成部16は、このような最適化問題を、例えば混合整数二次計画問題として定式化して、分枝限定法などによって解く。この解法は、特許文献1に開示されるなど公知であるため、この解法の具体的な説明は省略する。最適化問題の定式化の一例を式(1)〜式(4)に示す。式(1)は、目的関数が表す損益を最小化する最適化問題を示す。式(2)〜式(4)のそれぞれは、目的関数の制約条件を示す。
The
![]()
![]()

![]()
![]()
![]()
![]()
ここで、Fは電気事業の損益、tは時刻、gは発電機番号である。∀は「全ての」を表す記号である。Qkwh(t)は時刻tにおける電力の取引量を示す変数であり、最適化問題を解くことによって求めるべき数である。Vkwh(t)は時刻tにおける電力の価格を示す変数であり、スポット価格シナリオデータ121に含まれる。QΔkw(t)は時刻tにおける調整力の取引量を示す変数であり、最適化問題を解くことによって求めるべき数である。VΔkw(t)は時刻tにおける調整力のΔkw価格を示す変数であり、調整力価格シナリオデータ122に含まれる。RusedΔkw(t)は時刻tにおける調整力の発動割合を示す変数であり、調整力発動割合シナリオデータ123に含まれる。VusedΔkw(t)は時刻tにおける調整力のkwh価格を示す変数であり、調整力価格シナリオデータ122に含まれる。
Here, F is the profit and loss of the electric power business, t is the time, and g is the generator number. ∀ is a symbol representing "all". QkWh (t) is a variable indicating the amount of electric power traded at time t, and is a number to be obtained by solving an optimization problem. V kwh (t) is a variable indicating the price of electric power at time t, and is included in the spot
Eは時刻tにおける発電機番号gの発電機の発電コストの関数である。x(g,t)は時刻tにおける発電機番号gの発電機の発電量を示す変数であり、最適化問題を解くことによって求めるべき数である。u(g,t)は時刻tにおける発電機番号gの発電機の起動停止状態を示す変数であり、最適化問題を解くことによって求めるべき数である。u(g,t)として、停止が「0」、起動が「1」で表される。y(g,t)は時刻tにおける発電機番号gの発電機の余力であり、発電機データ114に含まれる。
E is a function of the power generation cost of the generator with the generator number g at time t. x (g, t) is a variable indicating the amount of power generated by the generator with the generator number g at time t, and is a number to be obtained by solving the optimization problem. u (g, t) is a variable indicating the start / stop state of the generator with the generator number g at time t, and is a number to be obtained by solving the optimization problem. As u (g, t), stop is represented by "0" and start is represented by "1". y (g, t) is the surplus capacity of the generator of the generator number g at time t, and is included in the
式(2)の右辺に示すように、損益は、第1項の発電コストから第2項の電力の取引による収益と第3項の調整力の取引による収益とを引き、調整力の発動による第4項の発電コストを足したものになる。つまり本実施の形態1では、電気事業の損益は、計画期間に亘って必要とする発電コストと、計画期間に亘って行われるスポット市場での電力の取引、及び、計画期間に亘って行われる需給調整市場での調整力の取引による売電金額とを合わせた収支を含む。
As shown on the right side of equation (2), the profit and loss is calculated by subtracting the profit from the transaction of electricity in
ここで、式(2)の右辺の時刻tにおける発電機番号gの発電機の発電コストの関数Eは、例えば式(5)のように表される。 Here, the function E of the power generation cost of the generator of the generator number g at the time t on the right side of the formula (2) is expressed as, for example, the formula (5).
fuel(g,t)は時刻tにおける発電機番号gの発電機の燃料価格であり、燃料価格データ115に含まれる。a(g)、b(g)、c(g)は、発電機番号gの発電機の燃料消費の特性を示す係数であり、発電機データ114に含まれる。d(g)は発電機番号gの発電機の起動費であり、発電機データ114に含まれる。
feel (g, t) is the fuel price of the generator of the generator number g at time t, and is included in the
式(5)に示すように、ある時刻における各発電機の発電コストは、例えば、燃料価格と発電量との積に、各発電機の起動費を加算した値として表される。なお、式(5)において発電量を二次関数で表す例を示したが、これに限らず線形の式であってもよい。 As shown in the formula (5), the power generation cost of each generator at a certain time is expressed as, for example, a value obtained by adding the start-up cost of each generator to the product of the fuel price and the amount of power generation. Although the example in which the amount of power generation is expressed by a quadratic function is shown in the equation (5), the equation (5) is not limited to this and may be a linear equation.
式(3)は、各時刻において、全ての発電機が発電する発電量を電力の取引量と調整力の発動量との和に等しくする制約条件を示す。 Equation (3) shows a constraint condition that equalizes the amount of power generated by all generators to the sum of the amount of electricity traded and the amount of adjustment power activated at each time.
式(4)は、各時刻において、全ての発電機の余力を調整力の取引量以上にする制約条件を示す。調整力の取引には上げ調整力商品の取引と下げ調整力商品の取引とがある。上げ調整力商品について取引する場合は、発電機の余力yは上げ余力であり、発電機の出力上限と発電機出力との差として計算できる。また、下げ調整力商品について取引する場合は、発電機の余力yは下げ余力であり、発電機出力と発電機の出力下限との差として計算できる。 Equation (4) indicates a constraint condition that makes the surplus capacity of all generators equal to or greater than the transaction amount of the adjusting power at each time. There are two types of adjustment power transactions: up adjustment power products and down adjustment power products. When trading a product, the surplus power y of the generator is the surplus power to be raised, and can be calculated as the difference between the upper limit of the output of the generator and the output of the generator. Further, when trading for a lowering adjustment power product, the surplus power y of the generator is the lowering reserve power, and can be calculated as the difference between the generator output and the lower limit of the output of the generator.
計画作成部16は、上記式以外に制約条件を追加してもよい。例えば、最小運転時刻制約、最小停止時刻制約、変化速度制約、燃料消費量制約、潮流制約などの制約条件を追加してもよい。また計画の対象となる発電機に起動停止を素早く変更できない発電機がある場合には、当該発電機が起動停止となるように制約条件を追加してもよい。また、上げ調整力商品と下げ調整力商品とを共に取引してもよいし、異なる種類の上げ調整力商品または下げ調整力商品を取引してもよい。この場合、それぞれの商品を異なる変数として定義し、上げ余力が上げ調整力の取引量の総和以上となる制約条件と、下げ余力が下げ調整力の取引量の総和以上となる制約条件とを追加し、各商品の取引及び調整力の発動による利益を目的関数に含めればよい。
The
このように計画作成部16は、最適化問題を解くことにより、電気事業の損益が最小となるときの起動停止計画データ124、発電量計画データ125、電力取引計画データ126、調整力取引計画データ127を、u(g,t)、x(g,t)、Qkwh(t)、QΔkw(t)としてそれぞれ得ることができる。
In this way, the
起動停止計画データ124、発電量計画データ125、電力取引計画データ126、調整力取引計画データ127は、計画出力部17に出力され、例えばグラフや表として表示される。
The start /
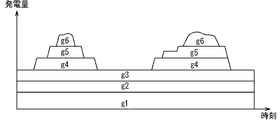
図4は、本実施の形態1に係る電力需給計画作成装置100の発電機運転計画を説明するための説明図である。横軸は時刻、縦軸は発電量を示す。発電機運転計画では、例えば、発電機番号g1、g2、・・・、g6の発電機が発電する発電量の推移が示される。
FIG. 4 is an explanatory diagram for explaining the generator operation plan of the power supply and demand
図5は、本実施の形態1に係る電力需給計画作成装置100の電力の取引計画と調整力の取引計画とを説明するための説明図である。横軸は時刻、縦軸は取引量を示す。これらの取引計画では、例えば、発電機番号g1、g2、・・・、g6の発電機の運転により得られる電力及び調整力の取引量の推移が示される。
FIG. 5 is an explanatory diagram for explaining the electric power transaction plan and the adjustment power transaction plan of the electric power supply / demand
図6は、本実施の形態1に係る電力需給計画作成装置100の電力の取引計画と調整力の取引計画との関係を説明するための説明図である。ここでは、図5の発電機番号g3の発電機の一部の期間での取引分を例示している。発電機の出力を電力として取引し、電力の取引により生まれた発電機の余力の一部または全部を調整力として取引する。具体的には、発電機の出力と出力上限との差の一部または全部、及び、発電機の出力と出力下限との差の一部または全部を、それぞれ上げ調整力及び下げ調整力として取引する。
FIG. 6 is an explanatory diagram for explaining the relationship between the electric power transaction plan and the adjustment power transaction plan of the electric power supply / demand
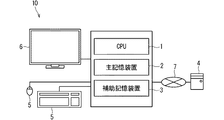
図7は、本実施の形態1に係る電力需給計画作成装置100のハードウェアを示す概略構成図である。電力需給計画作成装置100は、例えばPC(Personal Computer)10を用いて構成される。PC10は、CPU(Central Processing Unit)1、主記憶装置2、補助記憶装置3、外部記憶装置4、入力装置5及び出力装置6を備える。なお、外部記憶装置4は、ネットワーク7を介して接続されていてもよい。
FIG. 7 is a schematic configuration diagram showing the hardware of the power supply and
主記憶装置2は、例えばDRAM(Dynamic Random Access Memory)などのメモリ装置である。補助記憶装置3は、例えば磁気ディスクである。外部記憶装置4は、CD(Compact Disc)−R、DVD(Digital Versatile Disc)−Rなどの光学ディスク、またはUSB(Universal Serial Bus)メモリ、SD(Secure Digital)カードなどのフラッシュメモリ記憶装置などである。入力装置5は、例えばマウス、キーボードである。出力装置6は、例えばディスプレイ、プリンタである。ネットワーク7は、例えば光通信機器で構成される。
The
次に、本実施の形態1に係る電力需給計画作成装置100を用いた電力需給計画作成方法について説明する。
Next, a method of creating a power supply and demand plan using the power supply and demand
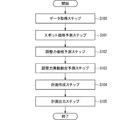
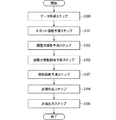
図8は、本実施の形態1に係る電力需給計画作成装置100の処理手順の一例を示すフローチャートである。
FIG. 8 is a flowchart showing an example of the processing procedure of the power supply and demand
ステップS100では、データ取得部11は、スポット価格シナリオデータ121、調整力価格シナリオデータ122、調整力発動割合シナリオデータ123、発電機データ114、燃料価格データ115を取得し、各データをデータ格納部12に格納する。
In step S100, the
ステップS104では、計画作成部16は、データ格納部12に格納されたスポット価格シナリオデータ121、調整力価格シナリオデータ122、調整力発動割合シナリオデータ123、発電機データ114、燃料価格データ115に基づいて、発電機運転計画並びに電力及び調整力の取引計画を作成する。
In step S104, the
具体的には、計画作成部16は、スポット価格シナリオデータ121、調整力価格シナリオデータ122、調整力発動割合シナリオデータ123、発電機データ114、燃料価格データ115に基づいて、電気事業の損益を表す目的関数及びその制約条件を定式化する。そして、計画作成部16は、目的関数が表す損益を最小化する最適化問題を解くことで発電機運転計画並びに電力及び調整力の取引計画を作成する。なお、発電機運転計画並びに電力及び調整力の取引計画の、より具体的な説明については、後で別のフローチャートを用いて説明する。
Specifically, the
計画作成部16は、発電機運転計画として得られた起動停止計画データ124及び発電量計画データ125と、電力の取引計画として得られた電力取引計画データ126と、調整力の取引計画として得られた調整力取引計画データ127とをデータ格納部12に格納する。
The
ステップS105では、計画出力部17は、起動停止計画データ124、発電量計画データ125、電力取引計画データ126、調整力取引計画データ127をデータ格納部12から取得し、発電機運転計画、電力の取引計画、及び、調整力の取引計画として出力装置6に出力する。出力装置6は、例えば、これら計画をプリントまたはディスプレイに表示してユーザに示す。
In step S105, the
図9は、本実施の形態1における電力需給計画作成装置100のステップS104の最適化処理の一例を示すフローチャートである。
FIG. 9 is a flowchart showing an example of the optimization process of step S104 of the power supply and
ステップS1041では、計画作成部16は、損益を最小化することを式(1)に示すように定式化する。
In step S1041, the
ステップS1042では、計画作成部16は、最適化問題の制約条件を式(2)〜式(4)に示すように定式化する。また、式(2)について各発電機の発電コストを式(5)のように定式化する。
In step S1042, the
そして、計画作成部16は、データ格納部12から、スポット価格シナリオデータ121、調整力価格シナリオデータ122、調整力発動割合シナリオデータ123、発電機データ114、燃料価格データ115を取得し、式(2)〜式(5)のパラメータとして設定する。例えば、計画作成部16は、発電機データ114の起動費及び燃料消費の特性と、燃料価格データ115の燃料価格とを、式(5)のパラメータとして設定する。また、計画作成部16は、スポット価格シナリオデータ121のスポット価格と、調整力価格シナリオデータ122のΔkW価格及びkWh価格と、調整力発動割合シナリオデータ123の発動割合とを、式(2)のパラメータとして設定する。
Then, the
ステップS1403では、計画作成部16は、制約条件を満たすように、目的関数が表す損益を最小化する最適化問題を解く。式(3)により、電力の取引のための電力が確保され、式(4)により調整力の取引のための調整力が確保される。そして、計画作成部16は、損益が最小となったときの変数u(g,t)、x(g,t)、Qkwh(t)、QΔkw(t)を、起動停止計画データ124、発電量計画データ125、電力取引計画データ126、調整力取引計画データ127としてそれぞれデータ格納部12に格納する。
In step S1403, the
<実施の形態1のまとめ>
上述のとおり、本実施の形態1に係る電力需給計画作成装置及び電力需給計画作成方法では、損益を最小化する最適化問題を解くことで、発電機運転計画及び電力の取引計画に加えて調整力の取引計画を作成できる。このため、発電事業者の収益の評価の改善に寄与できる。
<Summary of Embodiment 1>
As described above, in the electric power supply / demand plan creation device and the electric power supply / demand plan creation method according to the first embodiment, adjustments are made in addition to the generator operation plan and the electric power transaction plan by solving the optimization problem that minimizes the profit and loss. You can create a power trading plan. Therefore, it can contribute to the improvement of the evaluation of the profit of the power generation company.
例えば、ある時刻における1台の発電機の計画を考える。ここでは、発電機の最大出力が500[MWh]、発電機の発電単価が9[円/kWh]、電力の価格が10[円/kWh]、上げ調整力の価格が5[円/kW]、上げ調整力の発動に対する価格が8[円/kWh]、調整力の発動割合が40%である場合を想定する。 For example, consider a plan for one generator at a given time. Here, the maximum output of the generator is 500 [MWh], the unit price of power generation of the generator is 9 [yen / kWh], the price of electricity is 10 [yen / kWh], and the price of the raising adjustment power is 5 [yen / kWh]. It is assumed that the price for the activation of the raising adjustment power is 8 [yen / kWh] and the activation ratio of the adjustment power is 40%.
このとき、取引の計画について、電力しか考慮しない場合は、発電単価9[円/kWh]よりも電力の価格10[円/kWh]が高いため、可能な限り発電することが得である。この場合、電力の取引の収支が5000000円(=500[MWh]×10[円/kWh])となり、発電コストが4500000円(=500[MWh]×9[円/kWh])となるため、500000円の黒字となる。 At this time, when only electric power is considered in the transaction plan, the electric power price of 10 [yen / kWh] is higher than the power generation unit price of 9 [yen / kWh], so it is advantageous to generate as much power as possible. In this case, the balance of electricity transactions is 5,000,000 yen (= 500 [MWh] x 10 [yen / kWh]), and the power generation cost is 4500000 yen (= 500 [MWh] x 9 [yen / kWh]). It will be in the black of 500,000 yen.
一方、電力に加えて調整力の取引を考慮する場合として、上記500[MWh]のうち例えば電力を100[MWh]で、調整力を400[MW]で取引する場合を想定する。この場合、電力の取引の収支が1000000円(=100[MWh]×10[円/kWh])、調整力の取引の収支が3280000円(=400[MW]×5[円/kW]+400[MW]×40[%]×8[円/kWh])となる。そして、発電コストが2340000円(=(電力の取引量(100[MWh])+調整力の発動量(400[MW]×40[%]))×9[円/kWh])となる。このため、1940000円の黒字となり、電力のみの取引と比較して収益が1440000円改善する。 On the other hand, as a case of considering the transaction of the adjusting power in addition to the electric power, it is assumed that, for example, the electric power is traded at 100 [MWh] and the adjusting power is traded at 400 [MW] among the above 500 [MWh]. In this case, the balance of electricity transactions is 1,000,000 yen (= 100 [MWh] x 10 [yen / kWh]), and the balance of adjustment power transactions is 3280000 yen (= 400 [MW] x 5 [yen / kWh] + 400 [ MW] x 40 [%] x 8 [yen / kWh]). Then, the power generation cost is 2340000 yen (= (transaction amount of electric power (100 [MWh]) + activation amount of adjustment power (400 [MW] × 40 [%])) × 9 [yen / kWh]). As a result, it will be in the black at 1940000 yen, and profits will improve by 1440000 yen compared to transactions with only electricity.
なお、ここでは取引量を仮定した例について説明した。本実施の形態1では、取引量の制約を考慮するだけでなく、発電機の運転制約も考慮した上で、電気事業全体としての損失が最小となるように(電気事業全体としての利益が最大となるように)、電力及び調整力の取引量を決定することができる。 Here, an example assuming a transaction volume has been described. In the first embodiment, not only the transaction volume constraint but also the generator operation constraint is taken into consideration so that the loss of the electric power business as a whole is minimized (the profit of the electric power business as a whole is maximum). ), The trading volume of electricity and adjustment power can be determined.
<実施の形態2>
図10は、本実施の形態2に係る電力需給計画作成装置100の概略構成図である。以下では、実施の形態1と同様である点の説明を省略し、異なる点を中心に説明する。
<
FIG. 10 is a schematic configuration diagram of the power supply and
図10の電力需給計画作成装置100の構成は、図1の電力需給計画作成装置100の構成に、スポット価格予測部13、調整力価格予測部14、及び、調整力発動割合予測部15を取得部として加えた構成と同様である。
As for the configuration of the power supply and demand
スポット価格予測部13は、スポット市場で取り引きされる電力の約定価格の実績値を時系列で表すスポット市場取引実績データ111に基づいて、それぞれが当該電力の約定価格のシナリオを表す複数のスポット価格シナリオデータ121を予測する。調整力価格予測部14は、需給調整市場で取り引きされる調整力の約定価格の実績値を時系列で表す需給調整市場取引実績データ112に基づいて、それぞれが当該調整力の約定価格のシナリオを表す複数の調整力価格シナリオデータ122を予測する。調整力発動割合予測部15は、需給調整市場取引実績データ112と、上記調整力の発動量の実績値を時系列で表す調整力発動量実績データ113とに基づいて、それぞれが発動割合のシナリオを表す複数の調整力発動割合シナリオデータ123を予測する。
The spot
なお、複数のスポット価格シナリオデータ121のそれぞれは、実施の形態1で説明したスポット価格シナリオデータ121と同様である。複数の調整力価格シナリオデータ122のそれぞれは、実施の形態1で説明した調整力価格シナリオデータ122と同様である。複数の調整力発動割合シナリオデータ123のそれぞれは、実施の形態1で説明した調整力発動割合シナリオデータ123と同様である。
Each of the plurality of spot
本実施の形態2における電気事業の損益は、実施の形態1と同様に、発電コストと、電力の取引による収益と、調整力の取引による収益と、調整力の発動による発電コストとを合わせた収支である。発電コストは、計画期間に亘って、計画の対象となるすべての発電機が発電するのに必要なコストの総額を意味する。 The profit and loss of the electric power business in the second embodiment is the sum of the power generation cost, the profit from the electric power transaction, the profit from the adjustment power transaction, and the power generation cost from the activation of the adjustment power, as in the first embodiment. It is a balance. Power generation cost means the total cost required for all the generators under planning to generate electricity over the planning period.
取得部であるデータ取得部11は、スポット市場取引実績データ111、需給調整市場取引実績データ112、調整力発動量実績データ113、発電機データ114、燃料価格データ115、及び、信頼水準データ116を取得し、各データをデータ格納部12に格納する。
The
スポット市場取引実績データ111は、スポット市場で取り引きされる電力の約定価格の実績値を時系列で表すデータである。スポット市場取引実績データ111は、市場で公開されている約定価格の実績値を元に設定されてもよいし、ユーザ自身が入札履歴などを参考にして求めた想定値を元に設定されてもよい。
The spot market
需給調整市場取引実績データ112は、需給調整市場で取り引きされる調整力の約定価格の実績値と総約定量の実績値とを時系列で表すデータである。調整力の約定価格は、調整力の確保に対する価格であるΔkW価格と、調整力の発動に対する価格であるkWh価格とを含む。需給調整市場取引実績データ112は、市場で公開されている約定価格の実績値と総約定量を元に設定されてもよいし、ユーザ自身が入札履歴などを参考にして求めた想定値を元に設定されてもよい。
The supply and demand adjustment market
調整力発動量実績データ113は、調整力の発動量の実績値を時系列で表すデータである。調整力発動量実績データ113は、市場で公開されている発動量の実績値を元に設定されてもよいし、ユーザ自身が発動量の履歴などを参考にして求めた想定値を元に設定されてもよい。発電機データ114及び燃料価格データ115は、実施の形態1で説明した発電機データ114及び燃料価格データ115と同様である。
The adjustment force activation amount
信頼水準データ116は、電力需給計画作成装置100で作成される計画で発生し得る電気事業の損益のリスクに対して、ユーザがリスクを許容できない度合い、つまりユーザがリスクを避けたい度合いを反映した値であり、0〜100%の値が設定される。換言すれば、信頼水準データ116は、電気事業の損益に関するリスク指標の信頼水準を表す。本実施の形態2において、信頼水準データ116が表すリスク指標は、VaR(Value at Risk)である。ここでVaRとは、一定の確率、すなわち一定の信頼水準で発生し得る最大の損益(損失)である。ユーザのリスクに対する許容度が大きくなれば、リスクを避けたい度合いを反映する信頼水準は小さい値に設定され、ユーザのリスクに対する許容度が小さくなれば、信頼水準は大きい値に設定される。
The
図11は、本実施の形態2に係る電力需給計画作成装置100で用いるVaRを説明するための説明図である。図11において、横軸は電気事業の損益、縦軸は発電コストの度数を示す。複数のスポット価格シナリオデータ121が表す複数のスポット価格シナリオと、複数の調整力価格シナリオデータ122が表す複数の調整力価格シナリオと、複数の調整力発動割合シナリオデータ123が表す調整量発動割合シナリオとの全組合せに対してそれぞれ損益を算出した場合、発電コストは、図11に示すような頻度分布で表される。
FIG. 11 is an explanatory diagram for explaining the VaR used in the power supply and
VaRは、頻度分布において小さい発電コストから累積された度数の全度数に対する比率がα%となる発電コスト区間で発生し得る最大の発電コストである。換言すれば、VaRは、信頼水準αのパーセント点に対応する発電コストである。例えば、信頼水準90%のVaRが1億円とすると、発電コストは90%の確率で1億円以内に収まることを意味する。ユーザは、電力需給計画作成装置100の各種予測に基づいて作成される発電機運転計画の発電コストが頻度分布をもつことを想定して予め信頼水準を電力需給計画作成装置100に入力する。
VaR is the maximum power generation cost that can occur in the power generation cost section in which the ratio of the accumulated frequency to the total frequency from the small power generation cost in the frequency distribution is α%. In other words, VaR is the power generation cost corresponding to the percentage point of the confidence level α. For example, if VaR with a reliability level of 90% is 100 million yen, it means that the power generation cost will be within 100 million yen with a probability of 90%. The user inputs the reliability level to the power supply / demand
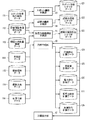
図12は、本実施の形態2に係る電力需給計画作成装置のデータフローを示す概略構成図である。 FIG. 12 is a schematic configuration diagram showing a data flow of the power supply and demand planning apparatus according to the second embodiment.
スポット価格予測部13は、スポット市場取引実績データ111に基づいて、複数のスポット価格シナリオデータ121を作成する。スポット価格シナリオデータ121は、想定される将来の電力の約定価格を時系列で表すデータである。図13は、本実施の形態2に係る電力需給計画作成装置100の複数のスポット価格シナリオデータ121、つまり複数の電力需要のシナリオを説明するための説明図である。
The spot
スポット価格予測部13は、例えば最尤推定により時系列モデルのモデルパラメータを算出した後、当該モデルパラメータにモンテカルロ法を用いて、モンテカルロ法の試行回数分のスポット価格シナリオデータ121−1〜121−nを作成する。時系列モデルは自己回帰和分移動平均またはベクトル自己回帰モデルを用いてもよいし、その他のモデルを用いてもよい。また、スポット価格予測部13は、例えばスポット市場取引実績データ111を曜日や季節でクラスタリングしてスポット価格シナリオデータ121を作成してもよい。
The spot
調整力価格予測部14は、需給調整市場取引実績データ112に基づいて、複数の調整力価格シナリオデータ122を作成する。調整力価格シナリオデータ122は、想定される将来の調整力の約定価格を時系列で表すデータである。調整力の約定価格は、ΔkW価格とkWh価格とを含む。調整力価格予測部14は、スポット価格予測部13と同様に、例えばモンテカルロ法やクラスタリングにより調整力価格シナリオデータ122を作成する。
The adjustment power
調整力発動割合予測部15は、需給調整市場取引実績データ112と調整力発動量実績データ113とに基づいて、複数の調整力発動割合シナリオデータ123を作成する。調整力発動割合シナリオデータ123は、想定される将来の調整力発動割合を時系列で表すデータである。調整力発動割合予測部15は、需給調整市場の総約定量に占める調整力の発動量の割合を算出した後、スポット価格予測部13と同様に、例えばモンテカルロ法やクラスタリングにより調整力発動割合シナリオデータ123を作成する。
The adjustment power activation
計画作成部16は、スポット価格シナリオデータ121、調整力価格シナリオデータ122、調整力発動割合シナリオデータ123、発電機データ114、燃料価格データ115、及び、信頼水準データ116に基づいて、目的関数及びその制約条件を定式化し、最適化問題を解くことで発電機運転計画並びに電力及び調整力の取引計画を作成する。
The
発電機運転計画は起動停止計画データ124及び発電量計画データ125として算出され、電力の取引計画は電力取引計画データ126として算出され、調整力の取引計画は調整力取引計画データ127として算出される。
The generator operation plan is calculated as start /
起動停止計画データ124は、計画期間における発電機の起動または停止の状態を時系列で表すデータである。また発電量計画データ125は、計画期間における発電機で発電される発電量を時系列で表すデータである。これら起動停止計画データ124及び発電量計画データ125は、スポット価格シナリオ、調整力価格シナリオ、及び、調整力発動割合シナリオに依存する。ただし、発電機が起動停止を素早く変更できない場合などには、起動停止計画データ124は、スポット価格シナリオ、調整力価格シナリオ、及び、調整力発動割合シナリオの全てに依存しなくてもよい。
The start /
電力取引計画データ126及び調整力取引計画データ127は、計画期間における入札価格を時系列で表すデータであり、スポット価格シナリオ、調整力価格シナリオ、調整力発動割合シナリオそれぞれに依存する。
The electric power
次に、計画作成部16が演算する発電機運転計画並びに電力及び調整力の取引計画の最適化問題の一例について説明する。なお、本実施の形態2では、目的関数が表す損益が、各種予測への信頼水準αに基づく損益のVaRである場合について説明する。この場合、計画作成部16は、信頼水準αに基づく損益のVaRを表す目的関数の最適化問題として、VaRを最小化する最適化問題を解く。具体的には、「スポット価格シナリオデータ121、調整力価格シナリオデータ122、及び、調整力発動割合シナリオデータ123の各シナリオにおける発電コストがVaR以下となる比率を信頼水準データ116の信頼水準α以上にする制約条件」、「計画期間の各時刻において発電機の出力の合計を電力の取引量に一致させる制約条件」、及び「発電機の出力の余力の合計を調整力の取引量以上とする制約条件」の下で、目的関数が表す信頼水準αに基づく損益のVaRを最小化する最適化問題を解く。そして、計画作成部16は、VaRが最小化されたときの起動停止計画データ124、発電量計画データ125、電力取引計画データ126、調整力取引計画データ127を求める。
Next, an example of the optimization problem of the generator operation plan calculated by the
計画作成部16は、このような最適化問題を、例えば混合整数二次計画問題として定式化して、分枝限定法などによって解く。最適化問題の定式化の一例を式(6)〜式(10)に示す。式(6)は、目的関数が表す損益のVaRを最小化する最適化問題を示す。式(7)〜式(10)のそれぞれは、目的関数の制約条件を示す。
The
![]()
![]()
![]()
![]()
![]()
![]()
ここで、Fは電気事業の損益のVaR、tは時刻、sはシナリオ、gは発電機番号である。シナリオは、スポット価格シナリオ、調整力価格シナリオ、調整力発動割合シナリオの全ての組合せである。Mは非常に大きな数字であり、例えば信頼水準が100%であるときに最適化問題を解いたときのFが、ユーザが許容できる最大の損益となるように設定される。n(s)は補助変数であり、例えばバイナリ変数である。 Here, F is VaR of the profit and loss of the electric power business, t is the time, s is the scenario, and g is the generator number. The scenario is a combination of the spot price scenario, the adjustment power price scenario, and the adjustment power activation ratio scenario. M is a very large number, and F, for example, when the optimization problem is solved when the confidence level is 100%, is set so as to be the maximum profit and loss that the user can tolerate. n (s) is an auxiliary variable, for example a binary variable.
Qkwh(t,s)は時刻t、シナリオsにおける電力の取引量を示す変数であり、最適化問題を解くことによって求めるべき数である。Vkwh(t,s)は時刻t、シナリオsにおける電力の価格を示す変数であり、スポット価格シナリオデータ121に含まれる。QΔkw(t,s)は時刻t、シナリオsにおける調整力の取引量を示す変数であり、最適化問題を解くことによって求めるべき数である。VΔkw(t,s)は時刻t、シナリオsにおける調整力のΔkw価格を示す変数であり、調整力価格シナリオデータ122に含まれる。RusedΔkw(t,s)は時刻t、シナリオsにおける調整力の発動割合を示す変数であり、調整力発動割合シナリオデータ123に含まれる。VusedΔkw(t,s)は時刻t、シナリオsにおける調整力のkwh価格を示す変数であり、調整力価格シナリオデータ122に含まれる。
QkWh (t, s) is a variable indicating the transaction volume of electric power in the time t and the scenario s, and is a number to be obtained by solving the optimization problem. V kwh (t, s) is a variable indicating the price of electric power in the time t and the scenario s, and is included in the spot
Eは時刻t、シナリオsにおける発電機番号gの発電機の発電コストの関数である。x(g,t,s)は時刻t、シナリオsにおける発電機番号gの発電機の発電量を示す変数であり、最適化問題を解くことによって求めるべき数である。u(g,t,s)は時刻t、シナリオsにおける発電機番号gの発電機の起動停止状態を示す変数であり、最適化問題を解くことによって求めるべき数である。u(g,t,s)として、停止が「0」、起動が「1」で表される。αは信頼水準であり、|S|はシナリオの総数である。y(g,t,s)は時刻t、シナリオsにおける発電機番号gの発電機の余力であり、発電機データ114に含まれる。
E is a function of the power generation cost of the generator of the generator number g in the time t and the scenario s. x (g, t, s) is a variable indicating the amount of power generated by the generator with the generator number g in the time t and the scenario s, and is a number to be obtained by solving the optimization problem. u (g, t, s) is a variable indicating the start / stop state of the generator of the generator number g in the time t and the scenario s, and is a number to be obtained by solving the optimization problem. As u (g, t, s), stop is represented by "0" and start is represented by "1". α is the confidence level and | S | is the total number of scenarios. y (g, t, s) is the surplus capacity of the generator of the generator number g in the time t and the scenario s, and is included in the
式(7)の右辺に示すように、損益は、第1項の発電コストから第2項の電力の取引による収益と第3項の調整力の取引による収益とを引き、調整力の発動による第4項の発電コストを足したものになる。式(7)の補助変数n(s)により、各シナリオにおける損益がVaR以下となるか否かが判定される。補助変数n(s)が0であれば各シナリオにおける損益はVaRより小さく、補助変数n(s)が1であれば各シナリオにおける損益はVaRよりも大きいことを意味する。
As shown on the right side of equation (7), the profit and loss is calculated by subtracting the profit from the transaction of electricity in
ここで、式(7)の右辺の時刻t、シナリオsにおける発電機番号gの発電機の発電コストの関数Eは、例えば式(11)のように表される。 Here, the function E of the power generation cost of the generator of the generator number g in the scenario s at the time t on the right side of the equation (7) is expressed as, for example, the equation (11).
fuel(g,t)は時刻tにおける発電機番号gの発電機の燃料価格であり、燃料価格データ115に含まれる。a(g)、b(g)、c(g)は、発電機番号gの発電機の燃料消費の特性を示す係数であり、発電機データ114に含まれる。d(g)は発電機番号gの発電機の起動費であり、発電機データ114に含まれる。
feel (g, t) is the fuel price of the generator of the generator number g at time t, and is included in the
式(11)に示すように、ある時刻における各発電機の発電コストは、例えば、燃料価格と発電量との積に、各発電機の起動費を加算した値として表される。なお、式(11)において発電量を二次関数で表す例を示したが、これに限らず線形の式であってもよい。 As shown in the formula (11), the power generation cost of each generator at a certain time is expressed as, for example, a value obtained by adding the start-up cost of each generator to the product of the fuel price and the amount of power generation. Although the example in which the amount of power generation is expressed by a quadratic function is shown in the equation (11), the equation (11) is not limited to this and may be a linear equation.
式(8)の左辺は、式(7)の補助変数n(s)の合計をシナリオの数で割った値を示す。式(8)は、電力需要の各シナリオにおける発電コストがVaR以下となる確率を信頼水準α以上にする制約条件を示す。 The left side of the equation (8) shows the value obtained by dividing the total of the auxiliary variables n (s) of the equation (7) by the number of scenarios. Equation (8) shows a constraint condition for setting the probability that the power generation cost is VaR or less in each scenario of power demand to be the reliability level α or more.
式(9)は、各時刻、各シナリオにおいて、全ての発電機が発電する発電量を電力の取引量と調整力の発動量との和に等しくする制約条件を示す。 Equation (9) shows a constraint condition that equalizes the amount of power generated by all generators to the sum of the amount of electricity traded and the amount of adjustment power activated at each time and in each scenario.
式(10)は、各時刻、各シナリオにおいて、全ての発電機の余力を調整力の取引量以上にする制約条件を示す。調整力の取引には上げ調整力商品の取引と下げ調整力商品の取引とがある。上げ調整力商品について取引する場合は、発電機の余力yは上げ余力であり、発電機の出力上限と発電機出力との差として計算できる。また、下げ調整力商品について取引する場合は、発電機の余力yは下げ余力であり、発電機出力と発電機の出力下限との差として計算できる。 Equation (10) indicates a constraint condition that makes the surplus capacity of all generators equal to or greater than the transaction amount of the adjusting power at each time and in each scenario. There are two types of adjustment power transactions: up adjustment power products and down adjustment power products. When trading a product, the surplus power y of the generator is the surplus power to be raised, and can be calculated as the difference between the upper limit of the output of the generator and the output of the generator. Further, when trading for a lowering adjustment power product, the surplus power y of the generator is the lowering reserve power, and can be calculated as the difference between the generator output and the lower limit of the output of the generator.
計画作成部16は、上記式以外に制約条件を追加してもよい。例えば、最小運転時刻制約、最小停止時刻制約、変化速度制約、燃料消費量制約、潮流制約などの制約条件を追加してもよい。また計画の対象となる発電機に起動停止を素早く変更できない発電機がある場合は、当該発電機に対して全シナリオでの起動停止が同一となるように制約条件を追加してもよい。また、上げ調整力商品と下げ調整力商品とを共に取引してもよいし、異なる種類の上げ調整力商品または下げ調整力商品を取引してもよい。この場合、それぞれの商品を異なる変数として定義し、上げ余力が上げ調整力の取引量の総和以上となる制約条件と、下げ余力が下げ調整力の取引量の総和以上となる制約条件とを追加し、各商品の取引及び調整力の発動による利益を目的関数に含めればよい。
The
このように計画作成部16は、最適化問題を解くことにより、信頼水準αに基づく損益のVaRが最小となるときの起動停止計画データ124、発電量計画データ125、電力取引計画データ126、調整力取引計画データ127を、u(g,t,s)、x(g,t,s)、Qkwh(t,s)、QΔkw(t,s)としてそれぞれ得ることができる。
In this way, the
起動停止計画データ124、発電量計画データ125、電力取引計画データ126、調整力取引計画データ127は、計画出力部17に出力され、例えばグラフや表として表示される。
The start /
図4は、本実施の形態2に係る電力需給計画作成装置100の発電機運転計画を説明するための説明図である。横軸は時刻、縦軸は発電量を示す。発電機運転計画では、例えば、発電機番号g1、g2、・・・、g6の発電機が発電する発電量の推移が示される。
FIG. 4 is an explanatory diagram for explaining the generator operation plan of the power supply and demand
図5は、本実施の形態2に係る電力需給計画作成装置100の電力の取引計画と調整力の取引計画とを説明するための説明図である。横軸は時刻、縦軸は取引量を示す。これらの取引計画では、例えば、発電機番号g1、g2、・・・、g6の発電機の運転により得られる電力及び調整力の取引量の推移が示される。
FIG. 5 is an explanatory diagram for explaining the electric power transaction plan and the adjustment power transaction plan of the electric power supply / demand
図6は、本実施の形態2に係る電力需給計画作成装置100の電力の取引計画と調整力の取引計画との関係を説明するための説明図である。ここでは、図5の発電機番号g3の発電機の一部の期間での取引分を例示している。発電機の出力を電力として取引し、電力の取引により生まれた発電機の余力の一部または全部を調整力として取引する。具体的には、発電機の出力と出力上限との差の一部または全部、及び、発電機の出力と出力下限との差の一部または全部を、それぞれ上げ調整力及び下げ調整力として取引する。
FIG. 6 is an explanatory diagram for explaining the relationship between the electric power transaction plan and the adjustment power transaction plan of the electric power supply /
図7は、本実施の形態2に係る電力需給計画作成装置100の概略構成図である。電力需給計画作成装置100は、例えばPC10を用いて構成される。PC10は、CPU1、主記憶装置2、補助記憶装置3、外部記憶装置4、入力装置5及び出力装置6を備える。外部記憶装置4は、ネットワーク7を介して接続されていてもよい。
FIG. 7 is a schematic configuration diagram of the power supply and
主記憶装置2は、例えばDRAMなどのメモリ装置である。補助記憶装置3は、例えば磁気ディスクである。外部記憶装置4は、CD−R、DVD−Rなどの光学ディスク、またはUSBメモリ、SDカードなどのフラッシュメモリ記憶装置などである。入力装置5は、例えばマウス、キーボードである。出力装置6は、例えばディスプレイ、プリンタである。ネットワーク7は、例えば光通信機器で構成される。
The
次に、本実施の形態2に係る電力需給計画作成装置100を用いた電力需給計画作成方法について説明する。
Next, a method of creating a power supply and demand plan using the power supply and demand
図14は、本実施の形態2に係る電力需給計画作成装置100の処理手順の一例を示すフローチャートである。なお、図14の実施の形態2のフローチャートは、図8の実施の形態1のフローチャートに、ステップS101,S102,S103を追加したものとほぼ同様である。
FIG. 14 is a flowchart showing an example of the processing procedure of the power supply and demand
ステップS100では、データ取得部11は、スポット市場取引実績データ111、需給調整市場取引実績データ112、調整力発動量実績データ113、発電機データ114、燃料価格データ115、信頼水準データ116を取得し、各データをデータ格納部12に格納する。データ取得部11は、入力装置5を介して各データを取得してもよいし、外部記憶装置4に記憶されたデータを、ネットワーク7を介して取得してもよい。また各データが予めデータ格納部12に格納されている場合は、本処理を省略してもよい。
In step S100, the
ステップS101では、スポット価格予測部13は、データ格納部12からスポット市場取引実績データ111を取得し、そのスポット市場取引実績データ111に基づいて、電力の約定価格の変動を示すスポット価格シナリオデータ121を複数作成する。スポット価格予測部13は、作成された複数のスポット価格シナリオデータ121をデータ格納部12に格納する。
In step S101, the spot
ステップS102では、調整力価格予測部14は、データ格納部12から需給調整市場取引実績データ112を取得し、その需給調整市場取引実績データ112に基づいて、調整力の約定価格の変動を示す調整力価格シナリオデータ122を複数作成する。調整力価格予測部14は、作成された複数の調整力価格シナリオデータ122をデータ格納部12に格納する。
In step S102, the adjustment power
ステップS103では、調整力発動割合予測部15は、データ格納部12から需給調整市場取引実績データ112及び調整力発動量実績データ113を取得し、その需給調整市場取引実績データ112及び調整力発動量実績データ113に基づいて、調整力の発動割合の変動を示す調整力発動割合シナリオデータ123を複数作成する。調整力発動割合予測部15は、作成された複数の調整力発動割合シナリオデータ123をデータ格納部12に格納する。
In step S103, the adjustment force activation
ステップS104では、計画作成部16は、データ格納部12に格納されたスポット価格シナリオデータ121、調整力価格シナリオデータ122、調整力発動割合シナリオデータ123、発電機データ114、燃料価格データ115及び信頼水準データ116に基づいて、発電機運転計画並びに電力及び調整力の取引計画を作成する。
In step S104, the
具体的には、計画作成部16は、スポット価格シナリオデータ121、調整力価格シナリオデータ122、調整力発動割合シナリオデータ123、発電機データ114、燃料価格データ115及び信頼水準データ116に基づいて、損益のVaRを表す目的関数及びその制約条件を定式化する。そして、計画作成部16は、目的関数が表す損益のVaRを最小化する最適化問題を解くことで発電機運転計画並びに電力及び調整力の取引計画を作成する。なお、発電機運転計画並びに電力及び調整力の取引計画の、より具体的な説明については、後で別のフローチャートを用いて説明する。
Specifically, the
計画作成部16は、発電機運転計画として得られた起動停止計画データ124及び発電量計画データ125と、電力の取引計画として得られた電力取引計画データ126と、調整力の取引計画として得られた調整力取引計画データ127とをデータ格納部12に格納する。
The
ステップS105では、計画出力部17は、起動停止計画データ124、発電量計画データ125、電力取引計画データ126、調整力取引計画データ127をデータ格納部12から取得し、発電機運転計画、電力の取引計画、及び、調整力の取引計画として出力装置6に出力する。出力装置6は、例えば、これら計画をプリントまたはディスプレイに表示してユーザに示す。
In step S105, the
図15は、本実施の形態2における電力需給計画作成装置100のステップS104の最適化処理の一例を示すフローチャートである。
FIG. 15 is a flowchart showing an example of the optimization process of step S104 of the power supply and
ステップS1046では、計画作成部16は、信頼水準αに基づく損益のVaRを最小化することを式(6)に示すように定式化する。
In step S1046, the
ステップS1041では、計画作成部16は、最適化問題の制約条件を式(7)〜式(10)に示すように定式化する。また、式(7)について各発電機の発電コストを式(11)のように定式化する。
In step S1041, the
計画作成部16は、データ格納部12から、スポット価格シナリオデータ121、調整力価格シナリオデータ122、調整力発動割合シナリオデータ123、発電機データ114、燃料価格データ115及び信頼水準データ116を取得し、式(7)〜式(11)のパラメータとして設定する。例えば、計画作成部16は、発電機データ114の起動費及び燃料消費の特性と、燃料価格データ115の燃料価格とを、式(11)のパラメータとして設定する。また、計画作成部16は、スポット価格シナリオデータ121のスポット価格と、調整力価格シナリオデータ122のΔkW価格及びkWh価格と、調整力発動割合シナリオデータ123の発動割合とを、式(7)にパラメータとして設定する。
The
ステップS1402では、計画作成部16は、制約条件を満たすように、目的関数が表す損益のVaRを最小化する最適化問題を解く。式(7)により、電力の価格、調整力の価格、調整力の発動割合の各シナリオにおける損益が、損益のVaR以上であるか否かが判定され、各シナリオにおける損益が損益のVaR以下となる解が選択される。また、式(8)により、各シナリオにおける損益がVaR以下となる比率が信頼水準以上となる。また、式(9)により、電力の取引のための電力が確保され、式(10)により調整力の取引のための調整力が確保される。そして、計画作成部16は、VaRが最小となったときの変数u(g,t,s)、x(g,t,s)、Qkwh(t,s)、QΔkw(t,s)を、起動停止計画データ124、発電量計画データ125、電力取引計画データ126、調整力取引計画データ127としてそれぞれデータ格納部12に格納する。
In step S1402, the
<実施の形態2のまとめ>
上述のとおり、本実施の形態2に係る電力需給計画作成装置及び電力需給計画作成方法では、信頼水準データ116の信頼水準α%のパーセント点に対応する損益のVaRを目的関数として用いる。そして、電力の価格、調整力の価格、調整力の発動割合の各シナリオにおける損益がVaR以下となる比率が信頼水準α%以上となる制約条件下でVaRを最小化する最適化問題を解く。これにより、ユーザがリスクを許容できない度合いを反映しつつ、信頼水準α%で発生する最大の損益が最も小さくなるように最適化された計画を作成できる。
<Summary of
As described above, in the power supply / demand plan creation device and the power supply / demand plan creation method according to the second embodiment, the profit / loss VaR corresponding to the percentage point of the confidence level α% of the
例えば、信頼水準を100%などの大きい値に設定してVaRが最小となる計画を作成した場合、電気事業全体の損失は大きいが、当該損失が想定損失以上となるのでリスクの小さい発電機運転計画、電力の取引計画、調整力の取引計画を作成することができる。言い換えると、電気事業全体の収益は小さいが、当該収益が想定収益以下となるのでリスクの小さい計画を作成することができる。 For example, if a plan is created in which the reliability level is set to a large value such as 100% and VaR is minimized, the loss of the entire electric power business is large, but the loss exceeds the expected loss, so the generator operation with low risk. You can create plans, electricity trading plans, and coordination trading plans. In other words, although the profit of the entire electric power business is small, the profit is less than the expected profit, so it is possible to create a plan with low risk.
例えば、ある時刻における1台の発電機の計画を考える。ここでは説明を簡単にするため、電力価格のシナリオのみを考え、電力価格が6[円/kWh]となるシナリオが10ケース、10[円/kWh]となるシナリオが70ケース、14[円/kWh]となるシナリオが20ケースあるとする。また、信頼水準は80%であるとする。実施の形態1と同様に、発電機の最大出力が500[MWh]、発電機の発電単価が9[円/kWh]、上げ調整力の価格が5[円/kW]、上げ調整力の発動に対する価格が8[円/kWh]、調整力の発動割合が40%である場合を想定する。 For example, consider a plan for one generator at a given time. Here, for the sake of simplicity, only the power price scenario is considered, and there are 10 cases where the power price is 6 [yen / kWh], 70 cases where the power price is 10 [yen / kWh], and 14 [yen / kWh]. It is assumed that there are 20 cases of [kWh]. The reliability level is assumed to be 80%. Similar to the first embodiment, the maximum output of the generator is 500 [MWh], the power generation unit price of the generator is 9 [yen / kWh], the price of the raising adjustment power is 5 [yen / kWh], and the raising adjustment power is activated. It is assumed that the price is 8 [yen / kWh] and the adjustment power activation rate is 40%.
このとき、例えば電力を100[MWh]で、調整力を400[MW]で取引するとすれば、実施の形態1と同様の計算により、収益は10ケースで1540000円、70ケースで1940000円、20ケースで2340000円となる。このとき、信頼水準80%に基づく損益のVaRは、損益(損失)が大きい方から数えて80%の値となるので、1940000円となる。 At this time, for example, if the electric power is traded at 100 [MWh] and the adjusting power is traded at 400 [MW], the profit is 1540000 yen in 10 cases, 1940000 yen in 70 cases, and 20 by the same calculation as in the first embodiment. The case costs 2340000 yen. At this time, the VaR of the profit / loss based on the confidence level of 80% is 1940000 yen because the value is 80% counting from the one with the largest profit / loss (loss).
一方で、例えば電力を50[MWh]で取引し、調整力を500[MW]で取引するとすれば、実施の形態1と同様の計算により、収益は10ケースで1920000円、70ケースで2120000円、20ケースで2320000円となる。このとき、信頼水準80%に基づく損益のVaRは、2120000円となるため、電力を100[MWh]で、調整力を400[MW]で取引するケースに比べて収益を改善しつつ、リスクを回避する取引が実現される。 On the other hand, for example, if electric power is traded at 50 [MWh] and adjustment power is traded at 500 [MW], the profit is 1920000 yen in 10 cases and 2120,000 yen in 70 cases by the same calculation as in the first embodiment. , 20 cases will cost 2320,000 yen. At this time, the VaR of profit and loss based on the confidence level of 80% is 2120,000 yen, so the risk is improved while improving the profit compared to the case of trading with 100 [MWh] for electric power and 400 [MW] for adjustment power. Transactions to avoid are realized.
なお、ここでは取引量を仮定して例について説明した。本実施の形態2では、取引量の制約及び発電機の運転制約を考慮した上で、信頼水準α%のパーセント点に対応する損益のVaRが最小となるように、電力及び調整力の取引量を決定することができる。 Here, an example has been described assuming a transaction volume. In the second embodiment, the transaction amount of electric power and adjustment power is minimized so that the VaR of profit / loss corresponding to the percentage point of the confidence level α% is minimized in consideration of the transaction amount constraint and the generator operation constraint. Can be determined.
また信頼水準を例えば10%などの小さな値を設定して損益のVaRが最小となる計画を作成した場合、損益が想定損益以上となるリスクは大きいが、損益の小さい発電機運転計画、電力の取引計画、調整力の取引計画を作成することができる。言い換えると、電気事業全体の収益が想定収益以下となるリスクは大きいが、当該収益の大きい計画を作成することができる。なお、仮に調整力よりも電力のほうが期待される価格が高いならば、電力の取引量を多くすればよい。 Also, if you set a small value such as 10% for the reliability level and create a plan that minimizes the VaR of profit and loss, there is a large risk that the profit and loss will exceed the expected profit and loss, but the generator operation plan with small profit and loss and the power It is possible to create a trading plan and a trading plan with adjustment power. In other words, there is a high risk that the profit of the entire electric power business will be less than the expected profit, but it is possible to create a plan with a large profit. If the expected price of electric power is higher than that of adjusting power, the transaction volume of electric power should be increased.
また信頼水準を50%と設定して損益のVaRが最小となる計画を作成した場合、リスク指標として期待値を用いた場合と比べて、確率の低い極端なシナリオや外れ値の影響を低減することができる。ここで本実施の形態2と異なり、リスク指標として期待値を用いる構成では、スポット価格の高騰を期待して発電量を増やすような計画が作成される可能性がある。このような場合には、損益が悪化する確率が大きくなり、ユーザのキャッシュフローに悪影響を与えてしまうことがある。これに対して、信頼水準50%の損益のVaRは、電力の価格、調整力の価格、調整力の発動割合のシナリオに基づいて想定される損益の確率分布の中央値である。中央値は、生起確率の低い極端なシナリオの影響を受けにくい。このため本実施の形態2によれば、リスク指標として期待値を用いた構成よりも、電気事業者のキャッシュフローに悪影響を与えにくい発電機運転計画、電力の取引計画、調整力の取引計画が得られる。 In addition, when the confidence level is set to 50% and a plan that minimizes the VaR of profit and loss is created, the influence of extreme scenarios with low probability and outliers is reduced compared to the case where the expected value is used as a risk index. be able to. Here, unlike the second embodiment, in the configuration in which the expected value is used as the risk index, there is a possibility that a plan for increasing the amount of power generation is created in anticipation of a sharp rise in the spot price. In such a case, the probability of deterioration of profit and loss increases, which may adversely affect the cash flow of the user. On the other hand, the VaR of profit / loss with a confidence level of 50% is the median value of the probability distribution of profit / loss assumed based on the scenario of the price of electric power, the price of adjustment power, and the activation ratio of adjustment power. The median is less susceptible to extreme scenarios with low probability of occurrence. Therefore, according to the second embodiment, the generator operation plan, the electric power transaction plan, and the adjustment power transaction plan, which are less likely to adversely affect the cash flow of the electric power company, than the configuration using the expected value as the risk index. can get.
またスポット価格予測部13、調整力価格予測部14、及び、調整力発動割合予測部15が、想定される様々な電力の価格、調整力の価格、調整力の発動割合のシナリオを作成する。これにより、これらの変動に起因する損益の変動に対応した発電機運転計画、電力の取引計画、調整力の取引計画を作成できる。また、VaRは、信頼水準という単一のパラメータを用いて表される。このため、リスクと損益とのトレードオフ関係を有する複数の項目のそれぞれにパラメータを設定して重み付けする手法と比べ、ユーザの経験や試行錯誤による繰り返し計算を抑制でき、ユーザの意思決定を容易にする計画を作成することが可能になる。
Further, the spot
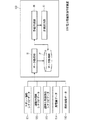
<実施の形態3>
図16は、本実施の形態3に係る電力需給計画作成装置100の概略構成図である。以下では、実施の形態2と同様である点の説明を省略し、異なる点を中心に説明する。
<Embodiment 3>
FIG. 16 is a schematic configuration diagram of the power supply and
図16の電力需給計画作成装置100の構成は、図10の電力需給計画作成装置100の構成に、需要予測部18を加えた構成と同様である。本実施の形態3では、発電された電力量の一部を、取引所を介さずに小売事業者に相対取引で売却する場合を想定して、電気事業の損益のVaRが最小となるときの発電機運転計画並びに電力及び調整力の取引計画を作成する。本実施の形態3において、電気事業の損益は、発電コストと、電力取引による買電金額などの損失と、電力取引による売電金額の収益とを計画期間を通じて合わせた収支である。
The configuration of the power supply and demand
データ取得部11は、スポット市場取引実績データ111、需給調整市場取引実績データ112、調整力発動量実績データ113、発電機データ114、燃料価格データ115、信頼水準データ116に加えて、相対取引データ117、需要実績データ118をさらに取得する。
The
図17は、本実施の形態3に係る電力需給計画作成装置100のデータフローを示す概略構成図である。相対取引データ117は、計画作成部16での演算に用いられる。需要実績データ118は、需要予測部18での需要シナリオデータ128の演算に用いられる。需要シナリオデータ128は、計画作成部16での演算に用いられる。
FIG. 17 is a schematic configuration diagram showing a data flow of the power supply and
相対取引データ117は、小売事業者との相対契約についてのデータであり、小売事業者への売電価格である。
The
需要実績データ118は、小売事業者へ売った電力量(以下「需要」と記すこともある)の時系列データである。需要実績データ118は、過去の契約における需要を元に設定されてもよいし、でんき予報などから取得したエリア需要を元に設定されてもよい。
The
需要予測部18は、需要実績データ118に基づいて、複数の需要シナリオデータ128を作成する。需要シナリオデータ128は、想定される将来の需要を時系列で表すデータである。
The
需要予測部18は、例えば最尤推定により時系列モデルのモデルパラメータを算出した後、当該モデルパラメータにモンテカルロ法を用いて、モンテカルロ法の試行回数分の需要シナリオデータ128を作成する。時系列モデルは自己回帰和分移動平均またはベクトル自己回帰モデルを用いてもよいし、その他のモデルを用いてもよい。また、需要予測部18は、例えば需要実績データ118を曜日や季節でクラスタリングして需要シナリオデータ128を作成してもよい。
The
計画作成部16は、スポット価格シナリオデータ121、調整力価格シナリオデータ122、調整力発動割合シナリオデータ123、発電機データ114、燃料価格データ115及び信頼水準データ116、相対取引データ117、及び、需要シナリオデータ128に基づいて、目的関数及びその制約条件を定式化し、最適化問題を解くことで発電機運転計画並びに電力及び調整力の取引計画を作成する。
The
次に、計画作成部16が演算する各種計画の最適化問題の一例ついて説明する。本実施の形態3では、計画作成部16は、実施の形態2の式(7)を式(12)に、式(9)を式(13)に変更した最適化問題を解く。
Next, an example of the optimization problem of various plans calculated by the
![]()
![]()
ここで、D(t,s)は時刻t、シナリオsにおける需要であり、需要シナリオデータ128に含まれる。Pは小売事業者への売電価格であり、相対取引データ117に含まれる。本実施の形態3が実施の形態2と異なる点は、発電事業者の損益に相対取引による収支が加わる点、及び、電力量のつりあいの式に需要が含まれる点である。
Here, D (t, s) is the demand at the time t and the scenario s, and is included in the
式(12)の右辺は損益であり、発電コストから電力の取引による収益と調整力の取引による収益と相対取引による収益とを引き、調整力の発動による収益を足したものになる。つまり、本実施の形態3における電気事業の損益は、計画期間に亘って必要とする発電コストと、計画期間に亘って行われるスポット市場での電力の取引、計画期間に亘って行われる需給調整市場での調整力の取引、及び、計画期間の電力の相対取引による売電金額とを合わせた収支を含む。 The right side of equation (12) is the profit and loss, which is obtained by subtracting the profit from the electricity transaction, the profit from the adjustment power transaction, and the profit from the bilateral transaction from the power generation cost, and adding the profit from the activation of the adjustment power. That is, the profit and loss of the electric power business in the third embodiment is the power generation cost required over the planning period, the transaction of electricity in the spot market performed over the planning period, and the supply and demand adjustment performed over the planning period. Includes the balance of adjustment power transactions in the market and the amount of electricity sold by bilateral transactions of electricity during the planned period.
式(12)の補助変数n(s)により、各シナリオにおける損益がVaR以下となるか否かが判定される。補助変数n(s)が0であれば各シナリオにおける損益はVaRより小さく、補助変数n(s)が1であれば各シナリオにおける損益はVaRよりも大きいことを意味する。 The auxiliary variable n (s) of the equation (12) determines whether or not the profit / loss in each scenario is less than or equal to VaR. If the auxiliary variable n (s) is 0, the profit / loss in each scenario is smaller than VaR, and if the auxiliary variable n (s) is 1, the profit / loss in each scenario is larger than VaR.
式(13)は、各時刻、各シナリオにおいて、全ての発電機が発電する発電量を電力の取引量と調整力の発動量と需要との和に等しくする制約条件を示す。 Equation (13) shows a constraint condition that equalizes the amount of power generated by all generators to the sum of the amount of electricity traded, the amount of adjustment power activated, and the demand at each time and in each scenario.
次に、本実施の形態3に係る電力需給計画作成装置100を用いた電力需給計画作成方法について説明する。
Next, a method of creating a power supply and demand plan using the power supply and demand
図18は、本実施の形態3に係る電力需給計画作成装置100の処理手順の一例を示すフローチャートである。なお、図18の実施の形態3のフローチャートは、以下で説明するように、図14の実施の形態2のフローチャートに対して、ステップS100、S106、S104が異なる。
FIG. 18 is a flowchart showing an example of a processing procedure of the power supply and demand
データ取得ステップであるステップS100では、データ取得部11は、スポット市場取引実績データ111、需給調整市場取引実績データ112、調整力発動量実績データ113、発電機データ114、燃料価格データ115、信頼水準データ116に加えて、相対取引データ117、需要実績データ118をデータ格納部12に格納する。
In step S100, which is a data acquisition step, the
需要予測ステップであるステップS106では、需要予測部18は、データ格納部12から需要実績データ118を取得し、その需要実績データ118に基づいて、需要の変動を示す需要シナリオデータ128を複数作成する。需要予測部18は、作成された複数の需要シナリオデータ128をデータ格納部12に格納する。
In step S106, which is a demand forecasting step, the
計画作成ステップであるステップS104では、計画作成部16は、データ格納部12に格納されたスポット価格シナリオデータ121、調整力価格シナリオデータ122、調整力発動割合シナリオデータ123、発電機データ114、燃料価格データ115、信頼水準データ116、相対取引データ117、及び、需要シナリオデータ128に基づいて、発電機運転計画並びに電力及び調整力の取引計画を作成する。
In step S104, which is a plan creation step, the
<実施の形態3のまとめ>
上述のとおり、本実施の形態3に係る電力需給計画作成装置及び電力需給計画作成方法では、信頼水準データ116の信頼水準α%のパーセント点に対応する損益のVaRを目的関数として用いる。そして、電力の価格、調整力の価格、調整力の発動割合、需要の各シナリオにおける損益がVaR以下となる比率が信頼水準α%以上となる制約条件下でVaRを最小化する最適化問題を解く。これにより、ユーザがリスクを許容できない度合いを反映しつつ、信頼水準α%で発生する最大の損益が最も小さくなるように最適化された計画を作成できる。
<Summary of Embodiment 3>
As described above, in the power supply / demand plan creation device and the power supply / demand plan creation method according to the third embodiment, the profit / loss VaR corresponding to the percentage point of the confidence level α% of the
また、需要予測部18が、想定される様々な需要のシナリオを作成するので、需要の変動に起因する損益の変動に対応した発電機運転計画、電力の取引計画、調整力の取引計画を作成できる。需要の変動は、例えば気温の上下に伴う冷暖房需要の変化などによって引き起こされる。このため、例えば、猛暑等により需要の増加が予想されるときは、信頼水準などの信頼区間を大きく設定することで、発電機の出力を増加させて下げ調整力を売るといったリスク回避可能な計画を作成できる。
In addition, since the
<実施の形態4>
図19は、本実施の形態4に係る電力需給計画作成装置100の概略構成図である。以下では、実施の形態2と同様である点の説明を省略し、異なる点を中心に説明する。
<Embodiment 4>
FIG. 19 is a schematic configuration diagram of the power supply and
本実施の形態4では、発電された電力量の一部を先渡取引で売却する場合を想定して、電気事業の損益のVaRが最小となるときの発電機運転計画並びに電力及び調整力の取引計画を作成する。 In the fourth embodiment, assuming that a part of the generated electric power is sold by a forward transaction, the generator operation plan and the electric power and the adjusting power when the VaR of the profit and loss of the electric power business is minimized. Create a transaction plan.
データ取得部11は、スポット市場取引実績データ111、需給調整市場取引実績データ112、調整力発動量実績データ113、発電機データ114、燃料価格データ115、信頼水準データ116に加えて、先渡市場データ119をさらに取得する。
In addition to the spot market
図20は、本実施の形態4に係る電力需給計画作成装置100のデータフローを示す概略構成図である。先渡市場データ119は、計画作成部16での演算に用いられる。
FIG. 20 is a schematic configuration diagram showing a data flow of the power supply and
先渡市場データ119は、先渡市場の入札のうち、まだ約定していない買い入札のデータであり、入札価格及び入札量のデータを含む。先渡市場データ119は、先渡市場の板情報を元に設定されてもよいし、予想される買い入札のデータを元に設定されてもよい。
The
次に、計画作成部16が演算する各種計画の最適化問題の一例ついて説明する。本実施の形態4では、計画作成部16は、実施の形態2の式(7)を式(14)に、式(9)を式(15)に変更した最適化問題を解く。
Next, an example of the optimization problem of various plans calculated by the
ここで、Qforward(t,n)は、先渡市場でまだ約定していない買い入札に通し番号を付けたときのn番目の入札の時刻tでの入札量であり、先渡市場データ119に含まれる。Vforward(n)は、n番目の入札の入札価格であり、先渡市場データ119に含まれる。Bforward(n)は、最適化問題を解くことによって求めるべきバイナリ変数であり、n番目の買い入札に対して売り入札をするなら1、そうでないなら0となる。本実施の形態4が実施の形態2と異なる点は、発電事業者の損益に先渡取引による収支が加わる点、及び、電力量のつりあいの式に先渡契約が含まれる点である。
Here, Q forward (t, n) is the bid amount at the time t of the nth bid when the buy bids that have not yet been executed in the forward market are serially numbered, and is in the
式(14)の右辺は損益であり、発電コストから電力の取引による収益と調整力の取引による収益と先渡取引による収益とを引き、調整力の発動による収益を足したものになる。つまり、本実施の形態4における電気事業の損益は、計画期間に亘って必要とする発電コストと、計画期間に亘って行われるスポット市場での電力の取引、計画期間に亘って行われる需給調整市場での調整力の取引、及び、計画期間の先渡市場での電力の取引による売電金額とを合わせた収支を含む。 The right side of equation (14) is the profit and loss, which is obtained by subtracting the profit from the electricity transaction, the profit from the adjustment power transaction, and the profit from the forward contract from the power generation cost, and adding the profit from the activation of the adjustment power. That is, the profit and loss of the electric power business in the fourth embodiment is the power generation cost required over the planning period, the transaction of electricity in the spot market performed over the planning period, and the supply and demand adjustment performed over the planning period. Includes the balance of adjustment power transactions in the market and the amount of electricity sold in the forward market during the planning period.
式(14)の補助変数n(s)により、各シナリオにおける損益がVaR以下となるか否かが判定される。補助変数n(s)が0であれば各シナリオにおける損益はVaRより小さく、補助変数n(s)が1であれば各シナリオにおける損益はVaRよりも大きいことを意味する。 The auxiliary variable n (s) of the equation (14) determines whether or not the profit / loss in each scenario is less than or equal to VaR. If the auxiliary variable n (s) is 0, the profit / loss in each scenario is smaller than VaR, and if the auxiliary variable n (s) is 1, the profit / loss in each scenario is larger than VaR.
式(15)は、各時刻、各シナリオにおいて、全ての発電機が発電する発電量をスポット市場での取引量と調整力の発動量と先渡市場での取引量との和に等しくする制約条件を示す。 Equation (15) is a constraint that equalizes the amount of power generated by all generators at each time and in each scenario to the sum of the amount of transactions in the spot market, the amount of adjustment power activated, and the amount of transactions in the forward market. Show the conditions.
次に、本実施の形態4に係る電力需給計画作成装置100を用いた電力需給計画作成方法について説明する。
Next, a method of creating a power supply and demand plan using the power supply and demand
本実施の形態4の処理手順を示すフローチャートは実施の形態2のフローチャート(図14)とほぼ同様である。ただし、両者の間には、以下で説明するように、データ取得ステップであるステップS100、計画作成ステップであるステップS104で取得及び格納するデータに違いがある。 The flowchart showing the processing procedure of the fourth embodiment is substantially the same as the flowchart of the second embodiment (FIG. 14). However, as will be described below, there is a difference in the data acquired and stored in step S100, which is a data acquisition step, and step S104, which is a plan creation step.
データ取得ステップであるステップS100では、データ取得部11は、スポット市場取引実績データ111、需給調整市場取引実績データ112、調整力発動量実績データ113、発電機データ114、燃料価格データ115、信頼水準データ116に加えて、先渡市場データ119をデータ格納部12に格納する。
In step S100, which is a data acquisition step, the
計画作成ステップであるステップS104では、計画作成部16は、データ格納部12に格納されたスポット価格シナリオデータ121、調整力価格シナリオデータ122、調整力発動割合シナリオデータ123、発電機データ114、燃料価格データ115、信頼水準データ116、及び、先渡市場データ119に基づいて、発電機運転計画並びに電力及び調整力の取引計画を作成する。
In step S104, which is a plan creation step, the
具体的には、計画作成部16は、最適化問題を解き、VaRが最小となったときの変数u(g,t,s)、x(g,t,s)、Qkwh(t,s)、QΔkw(t,s)、Bforward(n)を、起動停止計画データ124、発電量計画データ125、電力取引計画データ126、調整力取引計画データ127、先渡取引計画データ129としてそれぞれデータ格納部12に格納する。
Specifically, the
<実施の形態4のまとめ>
上述のとおり、本実施の形態4に係る電力需給計画作成装置及び電力需給計画作成方法では、信頼水準データ116の信頼水準α%のパーセント点に対応する損益のVaRを目的関数として用いる。そして、電力の価格、調整力の価格、調整力の発動割合の各シナリオにおける損益がVaR以下となる比率が信頼水準α%以上となる制約条件下でVaRを最小化する最適化問題を解く。これにより、ユーザがリスクを許容できない度合いを反映しつつ、信頼水準α%で発生する最大の損益が最も小さくなるように最適化された計画を作成できる。
<Summary of Embodiment 4>
As described above, in the power supply / demand plan creation device and the power supply / demand plan creation method according to the fourth embodiment, the VaR of the profit / loss corresponding to the percentage point of the confidence level α% of the
また、先渡市場データ119に基づいて、計画作成部16で取引を定式化し、計画を作成することにより、損益の変動を先渡市場での取引によって軽減する発電機運転計画、電力の取引計画、調整力の取引計画を作成できる。このため、例えば、スポット価格の予測の不確実さが大きい場合には、信頼水準などの信頼区間を大きく設定することで、先渡市場での取引を増やし、スポット市場での取引量を減らすといったリスク回避可能な計画を作成できる。
In addition, based on the
<実施の形態5>
図21は、本実施の形態5に係る電力需給計画作成装置100の概略構成図である。以下では、実施の形態2と同様である点の説明を省略し、異なる点を中心に説明する。
<
FIG. 21 is a schematic configuration diagram of the power supply and
本実施の形態5では、電気事業の損益のVaRが最小となるときの発電機運転計画並びに電力及び調整力の取引計画を作成する。金融派生商品である先物取引を運用することにより、電力取引により生じる損益のばらつきを抑えることを想定する。 In the fifth embodiment, a generator operation plan and a transaction plan for electric power and adjustment power are created when the VaR of the profit and loss of the electric power business is minimized. By operating futures trading, which is a financial derivative product, it is assumed that the variation in profit and loss caused by electric power trading can be suppressed.
データ取得部11は、スポット市場取引実績データ111、需給調整市場取引実績データ112、調整力発動量実績データ113、発電機データ114、燃料価格データ115、信頼水準データ116に加えて、先物市場データ120をさらに取得する。
The
図22は、本実施の形態5に係る電力需給計画作成装置100のデータフローを示す概略構成図である。先物市場データ120は、計画作成部16での演算に用いられる。
FIG. 22 is a schematic configuration diagram showing a data flow of the power supply and
先物市場データ120は、先物市場の入札のうち、まだ約定していない買い入札のデータ及び最終決済価格のデータであり、入札価格及び入札量のデータと最終決済価格のデータとを含む。先物市場データ120は、先物市場の板情報を元に設定されてもよいし、予想される買い入札のデータを元に設定されてもよい。
The
なお、最終決済価格のデータは、差金決済の清算に用いられるデータである、先月のスポット取引市場の月間平均価格を元に設定されてもよいし、スポット価格の変動のトレンドを考慮して運用者が予測した値を元に設定されてもよい。 The final settlement price data may be set based on the monthly average price of the spot trading market last month, which is the data used for the settlement of the difference settlement, or it is operated in consideration of the trend of fluctuations in the spot price. It may be set based on the value predicted by the person.
以下では、計画作成部16が演算する各種計画の最適化問題の一例ついて説明する。本実施の形態5では、計画作成部16は、実施の形態2の式(7)を式(16)に変更した最適化問題を解く。
Hereinafter, an example of the optimization problem of various plans calculated by the
ここで、Qfuture(m)は、先物市場でまだ約定していない買い入札に通し番号を付けたときのm番目の入札の入札量であり、先物市場データ120に含まれる。Vfuture(m)は、m番目の入札の入札価格であり、先物市場データ120に含まれる。Vfinalは最終決済価格であり、先物市場データ120に含まれる。Bfuture(m)は、最適化問題を解くことによって求めるべきバイナリ変数であり、m番目の買い入札に対して売り入札をするなら1、そうでないなら0となる。本実施の形態5が、実施の形態2と異なる点は、発電事業者の損益に先物取引による収支が加わる点である。
Here, Q future (m) is the bid amount of the m-th bid when the buy bids that have not yet been executed in the futures market are serially numbered, and is included in the
式(16)の右辺は損益であり、発電コストから電力の取引による収益と調整力の取引による収益と先物取引による収益とを引き、調整力の発動による収益を足したものになる。つまり、本実施の形態5における電気事業の損益は、計画期間に亘って必要とする発電コストと、計画期間に亘って行われるスポット市場での電力の取引、及び、計画期間に亘って行われる需給調整市場での調整力の取引による売電金額と、計画期間の先物市場での電力の取引による売電金額及び差金決済額とを合わせた収支を含む。 The right side of equation (16) is the profit and loss, which is obtained by subtracting the profit from the electricity transaction, the profit from the adjustment power transaction, and the profit from the futures transaction from the power generation cost, and adding the profit from the activation of the adjustment power. That is, the profit and loss of the electric power business in the fifth embodiment is carried out over the planned period, the power generation cost required over the planned period, the transaction of electric power in the spot market over the planned period, and the planned period. It includes the balance of the amount of electricity sold by trading the adjustment power in the supply and demand adjustment market, the amount of electricity sold by the transaction of electricity in the future market during the planning period, and the amount of settlement of the difference.
式(16)の補助変数n(s)により、各シナリオにおける損益がVaR以下となるか否かが判定される。補助変数n(s)が0であれば各シナリオにおける損益はVaRより小さく、補助変数n(s)が1であれば各シナリオにおける損益はVaRよりも大きいことを意味する。 The auxiliary variable n (s) of the equation (16) determines whether or not the profit / loss in each scenario is less than or equal to VaR. If the auxiliary variable n (s) is 0, the profit / loss in each scenario is smaller than VaR, and if the auxiliary variable n (s) is 1, the profit / loss in each scenario is larger than VaR.
次に、本実施の形態5に係る電力需給計画作成装置100を用いた電力需給計画作成方法について説明する。
Next, a method of creating a power supply and demand plan using the power supply and demand
本実施の形態5の処理手順を示すフローチャートは実施の形態2のフローチャート(図14)とほぼ同様である。ただし、両者の間には、以下で説明するように、データ取得ステップであるステップS100、計画作成ステップであるステップS104で取得及び格納するデータに違いがある。 The flowchart showing the processing procedure of the fifth embodiment is substantially the same as the flowchart of the second embodiment (FIG. 14). However, as will be described below, there is a difference in the data acquired and stored in step S100, which is a data acquisition step, and step S104, which is a plan creation step.
データ取得ステップであるステップS100では、データ取得部11は、スポット市場取引実績データ111、需給調整市場取引実績データ112、調整力発動量実績データ113、発電機データ114、燃料価格データ115、信頼水準データ116に加えて、先物市場データ120をデータ格納部12に格納する。
In step S100, which is a data acquisition step, the
計画作成ステップであるステップS104では、計画作成部16は、データ格納部12に格納されたスポット価格シナリオデータ121、調整力価格シナリオデータ122、調整力発動割合シナリオデータ123、発電機データ114、燃料価格データ115、信頼水準データ116、及び、先物市場データ120に基づいて、発電機運転計画並びに電力及び調整力の取引計画を作成する。
In step S104, which is a plan creation step, the
具体的には、計画作成部16は、最適化問題を解き、VaRが最小となったときの変数u(g,t,s)、x(g,t,s)、Qkwh(t,s)、QΔkw(t,s)、Bfuture(m)を、起動停止計画データ124、発電量計画データ125、電力取引計画データ126、調整力取引計画データ127、先物取引計画データ130としてそれぞれデータ格納部12に格納する。
Specifically, the
<実施の形態5のまとめ>
上述のとおり、本実施の形態5に係る電力需給計画作成装置及び電力需給計画作成方法では、信頼水準データ116の信頼水準α%のパーセント点に対応する損益のVaRを目的関数として用いる。そして、電力の価格、調整力の価格、調整力の発動割合の各シナリオにおける損益がVaR以下となる比率が信頼水準α%以上となる制約条件下でVaRを最小化する最適化問題を解く。これにより、ユーザがリスクを許容できない度合いを反映しつつ、信頼水準α%で発生する最大の損益が最も小さくなるように最適化された計画を作成できる。
<Summary of
As described above, in the power supply / demand plan creation device and the power supply / demand plan creation method according to the fifth embodiment, the VaR of the profit / loss corresponding to the percentage point of the confidence level α% of the
また、先物市場データ120に基づいて、計画作成部16で取引を定式化し、計画を作成することにより、損益の変動を先物市場での取引によって軽減する発電機運転計画、電力の取引計画、調整力の取引計画を作成できる。このため、例えば、スポット価格の予測の不確実さが大きい場合には、信頼水準などの信頼区間を大きく設定することで、先物市場での取引を増やし、スポット市場での取引による価格の変動を相殺するといったリスク回避可能な計画を作成できる。
In addition, based on the
<実施の形態6>
図23は、本実施の形態6に係る電力需給計画作成装置100の概略構成図である。以下では、実施の形態2と同様である点の説明を省略し、異なる点を中心に説明する。
<
FIG. 23 is a schematic configuration diagram of the power supply and
図23の電力需給計画作成装置100の構成は、図10の電力需給計画作成装置100の構成に、燃料価格予測部19を加えた構成と同様である。本実施の形態6では、為替の変動などに伴う燃料価格の変動を想定して、電気事業の損益のVaRが最小となるときの発電機運転計画並びに電力及び調整力の取引計画を作成する。
The configuration of the electric power supply and demand
データ取得部11は、スポット市場取引実績データ111、需給調整市場取引実績データ112、調整力発動量実績データ113、発電機データ114、信頼水準データ116を取得する。また、データ取得部11は、燃料価格データ115の代わりに燃料価格実績データ131を取得する。
The
図24は、本実施の形態6に係る電力需給計画作成装置100のデータフローを示す概略構成図である。燃料価格実績データ131は、燃料価格予測部19での燃料価格シナリオデータ132の演算に用いられる。燃料価格シナリオデータ132は計画作成部16での演算に用いられる。
FIG. 24 is a schematic configuration diagram showing a data flow of the power supply and
燃料価格実績データ131は、燃料価格の実績値を時系列で表すデータである。燃料価格実績データ131は、過去の一定期間における燃料価格の平均値を元に設定されてもよいし、為替の変動を考慮した予測値を元に設定されてもよい。燃料価格実績データ131は、燃料種別ごと(石炭、石油、LNGなど)のデータであってもよいし、発電機別のデータであってもよい。
The fuel price
燃料価格シナリオデータ132は、燃料価格のシナリオを表すデータである。
The fuel
燃料価格予測部19は、例えば最尤推定により時系列モデルのモデルパラメータを算出した後、当該モデルパラメータにモンテカルロ法を用いて、モンテカルロ法の試行回数分の燃料価格シナリオデータ132を作成する。時系列モデルは自己回帰和分移動平均またはベクトル自己回帰モデルを用いてもよいし、その他のモデルを用いてもよい。
The fuel
次に、計画作成部16が演算する各種計画の最適化問題の一例ついて説明する。本実施の形態6では、計画作成部16は、実施の形態2の式(7)を式(17)に、式(11)を式(18)に変更した最適化問題を解く。
Next, an example of the optimization problem of various plans calculated by the
ここで、fuel(s,g,t)は、時刻t、シナリオsにおける発電機番号gの燃料価格であり、燃料価格シナリオデータ132に含まれる。実施の形態2と異なる点は、発電機のコスト(E)及び燃料価格(fuel)がシナリオs別になる点である。
Here, fuel (s, g, t) is the fuel price of the generator number g at the time t and the scenario s, and is included in the fuel
次に、本実施の形態6に係る電力需給計画作成装置100を用いた電力需給計画作成方法について説明する。
Next, a method of creating a power supply and demand plan using the power supply and demand
図25は、本実施の形態6に係る電力需給計画作成装置100の処理手順の一例を示すフローチャートである。なお、図25の実施の形態6のフローチャートは、以下で説明するように、図14の実施の形態2のフローチャートに対して、ステップS100、S107、S104が異なる。
FIG. 25 is a flowchart showing an example of the processing procedure of the power supply and demand
データ取得ステップであるステップS100では、データ取得部11は、スポット市場取引実績データ111、需給調整市場取引実績データ112、調整力発動量実績データ113、発電機データ114、信頼水準データ116、及び、燃料価格実績データ131をデータ格納部12に格納する。
In step S100, which is a data acquisition step, the
燃料価格予測ステップであるステップS107では、燃料価格予測部19は、データ格納部12から燃料価格実績データ131を取得し、その燃料価格実績データ131に基づいて、燃料価格の変動を示す燃料価格シナリオデータ132を複数作成する。燃料価格予測部19は、作成された複数の燃料価格シナリオデータ132をデータ格納部12に格納する。
In step S107, which is a fuel price prediction step, the fuel
計画作成ステップであるステップS104では、計画作成部16は、データ格納部12に格納されたスポット価格シナリオデータ121、調整力価格シナリオデータ122、調整力発動割合シナリオデータ123、発電機データ114、信頼水準データ116、及び、燃料価格シナリオデータ132に基づいて、発電機運転計画並びに電力及び調整力の取引計画を作成する。
In step S104, which is a plan creation step, the
<実施の形態6のまとめ>
上述のとおり、本実施の形態6に係る電力需給計画作成装置及び電力需給計画作成方法では、信頼水準データ116の信頼水準α%のパーセント点に対応する損益のVaRを目的関数として用いる。そして、電力の価格、調整力の価格、調整力の発動割合、燃料価格の各シナリオにおける損益がVaR以下となる比率が信頼水準α%以上となる制約条件下でVaRを最小化する最適化問題を解く。これにより、ユーザがリスクを許容できない度合いを反映しつつ、信頼水準α%で発生する最大の損益が最も小さくなるように最適化された計画を作成できる。
<Summary of
As described above, in the power supply / demand plan creation device and the power supply / demand plan creation method according to the sixth embodiment, the profit / loss VaR corresponding to the percentage point of the confidence level α% of the
また、燃料価格シナリオデータ132に基づいて、計画作成部16で計画を作成することにより、燃料価格の変動に起因する発電コストの変動を考慮した発電機運転計画、電力の取引計画、調整力の取引計画を作成できる。このため、例えば、燃料価格の変動が大きい場合には、信頼水準などの信頼区間を大きく設定することで、スポット市場での電力の取引を減らし、需給調整市場での調整力の取引を増やすといったリスク回避可能な計画を作成できる。
In addition, by creating a plan in the
<変形例>
以上の説明では、電気事業の損益は、電気事業の損失(コスト)から電気事業の収益を引いて得られた値であったが、電気事業の収益から電気事業の損失(コスト)を引いて得られた値であってもよい。この場合、計画作成部16は、計画作成部16は、目的関数が表す損益を最大化する最適化問題を解くことで発電機運転計画並びに電力及び調整力の取引計画を作成すればよい。
<Modification example>
In the above explanation, the profit / loss of the electric power business was the value obtained by subtracting the profit of the electric business from the loss (cost) of the electric business, but subtracting the loss (cost) of the electric business from the profit of the electric business. It may be the obtained value. In this case, the
なお、各実施の形態及び各変形例を自由に組み合わせたり、各実施の形態及び各変形例を適宜、変形、省略したりすることが可能である。 It is possible to freely combine each embodiment and each modification, and appropriately modify or omit each embodiment and each modification.
11 データ取得部、13 スポット価格予測部、14 調整力価格予測部、15 調整力発動割合予測部、16 計画作成部、19 燃料価格予測部、100 電力需給計画作成装置。 11 Data acquisition unit, 13 Spot price forecasting department, 14 Adjusting power price forecasting department, 15 Adjusting power activation rate forecasting department, 16 Planning department, 19 Fuel price forecasting department, 100 Electric power supply and demand planning equipment.
Claims (10)
前記取得部で取得された前記スポット価格シナリオデータ、前記調整力価格シナリオデータ、前記調整力発動割合シナリオデータ、前記発電機データ、及び、前記燃料価格データに基づいて、電気事業の損失から前記電気事業の収益を引いた損益を表す目的関数の最適化問題であって前記目的関数が表す前記損益を最小化する最適化問題を解くことにより、発電機運転計画と、前記スポット市場及び前記需給調整市場での取引計画とを作成する計画作成部と
を備える、電力需給計画作成装置。 One or more spot price scenario data that represents the future contract price of electricity traded in the spot market in chronological order, and one or more adjustment power that represents the future contract price of the adjustment power traded in the supply and demand adjustment market in chronological order. Price scenario data, one or more adjustment power activation ratio scenario data representing the future activation ratio of the adjustment power in chronological order, generator data representing the specifications of the power and the generator that generates the adjustment power, and the above. An acquisition unit that acquires one or more fuel price data that represents the future fuel price of the generator in chronological order,
Based on the spot price scenario data, the adjustment power price scenario data, the adjustment power activation ratio scenario data, the generator data, and the fuel price data acquired by the acquisition unit, the electricity is generated from the loss of the electricity business. By solving the optimization problem of the objective function that represents the profit and loss obtained by subtracting the profit of the business and that minimizes the profit and loss represented by the objective function, the generator operation plan and the spot market and the supply and demand adjustment are adjusted. A power supply and demand planning device equipped with a planning unit that creates a transaction plan in the market.
前記電気事業の前記損益は、
計画期間に亘る発電コストと、前記計画期間に亘って行われる前記スポット市場での電力の取引、及び、前記計画期間に亘って行われる前記需給調整市場での調整力の取引による売電金額とを合わせた収支を含む、電力需給計画作成装置。 The power supply and demand planning device according to claim 1.
The profit and loss of the electric power business is
The power generation cost over the planning period, the transaction of electricity in the spot market over the planning period, and the amount of electricity sold by the transaction of adjustment power in the supply and demand adjustment market over the planning period. A power supply and demand planning device that includes the combined balance of payments.
前記取得部は、
前記スポット市場で取り引きされる電力の約定価格の実績値を時系列で表すスポット市場取引実績データに基づいて前記1以上のスポット価格シナリオデータを予測し、
前記需給調整市場で取り引きされる調整力の約定価格の実績値を時系列で表す需給調整市場取引実績データに基づいて前記1以上の調整力価格シナリオデータを予測し、
前記需給調整市場取引実績データと、前記調整力の発動量の実績値を時系列で表す調整力発動量実績データとに基づいて前記1以上の調整力発動割合シナリオデータを予測する、電力需給計画作成装置。 The power supply and demand planning device according to claim 1 or 2.
The acquisition unit
Predict the spot price scenario data of 1 or more based on the spot market transaction record data representing the actual value of the contract price of the electric power traded in the spot market in chronological order.
Predict the adjustment power price scenario data of 1 or more based on the supply and demand adjustment market transaction performance data that represents the actual value of the contract price of the adjustment power traded in the supply and demand adjustment market in chronological order.
A power supply and demand plan that predicts the adjustment power activation ratio scenario data of 1 or more based on the supply and demand adjustment market transaction record data and the adjustment force activation amount actual data representing the actual value of the adjustment force activation amount in chronological order. Creation device.
前記1以上のスポット価格シナリオデータは、複数のスポット価格シナリオデータであり、
前記1以上の調整力価格シナリオデータは、複数の調整力価格シナリオデータであり、
前記1以上の調整力発動割合シナリオデータは、複数の調整力発動割合シナリオデータであり、
前記目的関数が表す前記損益は、
前記取得部の予測への信頼水準に基づく前記損益のVaR(Value at Risk)である、電力需給計画作成装置。 The power supply and demand planning device according to claim 3.
The one or more spot price scenario data is a plurality of spot price scenario data.
The adjustment power price scenario data of one or more is a plurality of adjustment power price scenario data.
The adjustment power activation ratio scenario data of 1 or more is a plurality of adjustment power activation ratio scenario data.
The profit and loss represented by the objective function is
A power supply and demand planning device that is a ValR (Value at Risk) of the profit and loss based on the level of confidence in the forecast of the acquisition unit.
前記電気事業の前記損益は、
計画期間に亘る発電コストと、前記計画期間に亘って行われる前記スポット市場での電力の取引、前記計画期間に亘って行われる前記需給調整市場での調整力の取引、及び、前記計画期間の電力の相対取引による売電金額とを合わせた収支を含む、電力需給計画作成装置。 The power supply and demand planning apparatus according to any one of claims 1 to 4.
The profit and loss of the electric power business is
Power generation costs over the planning period, power transactions in the spot market over the planning period, adjustment power transactions in the supply and demand adjustment market over the planning period, and of the planning period. An electric power supply and demand planning device that includes a balance including the amount of electricity sold through bilateral transactions of electric power.
前記電気事業の前記損益は、
計画期間に亘る発電コストと、前記計画期間に亘って行われる前記スポット市場での電力の取引、前記計画期間に亘って行われる前記需給調整市場での調整力の取引、及び、前記計画期間の先渡市場での電力の取引による売電金額とを合わせた収支を含む、電力需給計画作成装置。 The power supply and demand planning apparatus according to any one of claims 1 to 4.
The profit and loss of the electric power business is
Power generation costs over the planning period, power transactions in the spot market over the planning period, adjustment power transactions in the supply and demand adjustment market over the planning period, and of the planning period. An electric power supply and demand planning device that includes the balance of electricity sold in the forward market.
前記電気事業の前記損益は、
計画期間に亘る発電コストと、前記計画期間に亘って行われる前記スポット市場での電力の取引、及び、前記計画期間に亘って行われる前記需給調整市場での調整力の取引による売電金額と、前記計画期間の先物市場での電力の取引による売電金額及び差金決済額とを合わせた収支を含む、電力需給計画作成装置。 The power supply and demand planning apparatus according to any one of claims 1 to 4.
The profit and loss of the electric power business is
The power generation cost over the planned period, the transaction of electric power in the spot market over the planned period, and the amount of electricity sold by the transaction of adjustment power in the supply and demand adjustment market over the planned period. , A power supply and demand planning device including a balance including the amount of electricity sold and the amount of settlement of the difference due to the transaction of electricity in the futures market during the planning period.
前記取得部は、
前記発電機の燃料価格の実績値を時系列で表す燃料価格実績データに基づいて、前記1以上の燃料価格データである複数の燃料価格シナリオデータを予測し、
前記目的関数が表す前記損益は、
前記取得部の予測への信頼水準に基づく前記損益のVaR(Value at Risk)である、電力需給計画作成装置。 The power supply and demand planning apparatus according to any one of claims 1 to 4.
The acquisition unit
Based on the actual fuel price data representing the actual fuel price of the generator in chronological order, a plurality of fuel price scenario data which are one or more fuel price data are predicted.
The profit and loss represented by the objective function is
A power supply and demand planning device that is a ValR (Value at Risk) of the profit and loss based on the level of confidence in the forecast of the acquisition unit.
前記取得部で取得された前記スポット価格シナリオデータ、前記調整力価格シナリオデータ、前記調整力発動割合シナリオデータ、前記発電機データ、及び、前記燃料価格データに基づいて、電気事業の収益から前記電気事業の損失を引いた損益を表す目的関数の最適化問題であって前記目的関数が表す前記損益を最大化する最適化問題を解くことにより、発電機運転計画と、前記スポット市場及び前記需給調整市場での取引計画とを作成する計画作成部と
を備える、電力需給計画作成装置。 One or more spot price scenario data that represents the future contract price of electricity traded in the spot market in chronological order, and one or more adjustment power that represents the future contract price of the adjustment power traded in the supply and demand adjustment market in chronological order. Price scenario data, one or more adjustment power activation ratio scenario data representing the future activation ratio of the adjustment power in chronological order, generator data representing the specifications of the power and the generator that generates the adjustment power, and the above. An acquisition unit that acquires one or more fuel price data that represents the future fuel price of the generator in chronological order,
Based on the spot price scenario data, the adjustment power price scenario data, the adjustment power activation ratio scenario data, the generator data, and the fuel price data acquired by the acquisition unit, the electricity is derived from the profit of the electricity business. By solving the optimization problem of the objective function that represents the profit and loss minus the loss of the business and that maximizes the profit and loss represented by the objective function, the generator operation plan and the spot market and the supply and demand adjustment A power supply and demand planning device equipped with a planning unit that creates a transaction plan in the market.
取得された前記スポット価格シナリオデータ、前記調整力価格シナリオデータ、前記調整力発動割合シナリオデータ、前記発電機データ、及び、前記燃料価格データに基づいて、電気事業の損失から前記電気事業の収益を引いた損益を表す目的関数の最適化問題であって前記目的関数が表す前記損益を最小化する最適化問題を解くことにより、発電機運転計画と、前記スポット市場及び前記需給調整市場での取引計画とを作成する、電力需給計画作成方法。 One or more spot price scenario data that represents the future contract price of electricity traded in the spot market in chronological order, and one or more adjustment power that represents the future contract price of the adjustment power traded in the supply and demand adjustment market in chronological order. Price scenario data, one or more adjustment power activation ratio scenario data representing the future activation ratio of the adjustment power in chronological order, generator data representing the specifications of the power and the generator that generates the adjustment power, and the above. Obtain one or more fuel price data that represents the future fuel price of the generator in chronological order,
Based on the acquired spot price scenario data, adjustment power price scenario data, adjustment power activation ratio scenario data, generator data, and fuel price data, the profit of the electricity business is calculated from the loss of the electricity business. By solving the optimization problem of the objective function representing the subtracted profit and loss and minimizing the profit and loss represented by the objective function, the generator operation plan and the transactions in the spot market and the supply and demand adjustment market How to create a power supply and demand plan to create a plan.
Priority Applications (1)
| Application Number | Priority Date | Filing Date | Title |
|---|---|---|---|
| JP2020033530A JP7154244B2 (en) | 2020-02-28 | 2020-02-28 | Power supply and demand plan creation device and power supply and demand plan creation method |
Applications Claiming Priority (1)
| Application Number | Priority Date | Filing Date | Title |
|---|---|---|---|
| JP2020033530A JP7154244B2 (en) | 2020-02-28 | 2020-02-28 | Power supply and demand plan creation device and power supply and demand plan creation method |
Publications (2)
| Publication Number | Publication Date |
|---|---|
| JP2021136832A true JP2021136832A (en) | 2021-09-13 |
| JP7154244B2 JP7154244B2 (en) | 2022-10-17 |
Family
ID=77661859
Family Applications (1)
| Application Number | Title | Priority Date | Filing Date |
|---|---|---|---|
| JP2020033530A Active JP7154244B2 (en) | 2020-02-28 | 2020-02-28 | Power supply and demand plan creation device and power supply and demand plan creation method |
Country Status (1)
| Country | Link |
|---|---|
| JP (1) | JP7154244B2 (en) |
Cited By (6)
| Publication number | Priority date | Publication date | Assignee | Title |
|---|---|---|---|---|
| CN114925893A (en) * | 2022-05-09 | 2022-08-19 | 重庆大学 | Cross-provincial and cross-regional whole-year electricity purchasing strategy hierarchical optimization method considering source-load time sequence simulation and reservoir inter-month coordination |
| CN116307144A (en) * | 2023-03-02 | 2023-06-23 | 国网能源研究院有限公司 | A coal-fired power adjustable capacity prediction method and a system having the same |
| WO2023162771A1 (en) | 2022-02-28 | 2023-08-31 | 株式会社Sustech | Information processing device, information processing method, and program |
| CN119205184A (en) * | 2024-11-28 | 2024-12-27 | 华电环球(北京)贸易发展有限公司 | A power grid clearing method, system, electronic equipment and medium |
| WO2025079499A1 (en) * | 2023-10-12 | 2025-04-17 | 株式会社グリッド | Cost function generation device, processing device, cost function generation method, and cost function generation program |
| WO2025205513A1 (en) * | 2024-03-26 | 2025-10-02 | Eneosホールディングス株式会社 | Energy conversion plan creation device, and energy conversion device control system and method |
Citations (4)
| Publication number | Priority date | Publication date | Assignee | Title |
|---|---|---|---|---|
| JP2017151717A (en) * | 2016-02-24 | 2017-08-31 | 富士電機株式会社 | Energy market transaction support device, energy market transaction support system, energy market transaction support method, and program |
| JP2017187932A (en) * | 2016-04-06 | 2017-10-12 | 三菱電機株式会社 | Energy supply/demand plan preparation device and energy supply/demand plan preparation program |
| JP2019139527A (en) * | 2018-02-09 | 2019-08-22 | 株式会社日立製作所 | Market response reliability management device, its method, and market management system |
| JP2019200622A (en) * | 2018-05-17 | 2019-11-21 | 株式会社日立製作所 | Demand and supply adjustment monitoring apparatus for power system |
-
2020
- 2020-02-28 JP JP2020033530A patent/JP7154244B2/en active Active
Patent Citations (4)
| Publication number | Priority date | Publication date | Assignee | Title |
|---|---|---|---|---|
| JP2017151717A (en) * | 2016-02-24 | 2017-08-31 | 富士電機株式会社 | Energy market transaction support device, energy market transaction support system, energy market transaction support method, and program |
| JP2017187932A (en) * | 2016-04-06 | 2017-10-12 | 三菱電機株式会社 | Energy supply/demand plan preparation device and energy supply/demand plan preparation program |
| JP2019139527A (en) * | 2018-02-09 | 2019-08-22 | 株式会社日立製作所 | Market response reliability management device, its method, and market management system |
| JP2019200622A (en) * | 2018-05-17 | 2019-11-21 | 株式会社日立製作所 | Demand and supply adjustment monitoring apparatus for power system |
Cited By (7)
| Publication number | Priority date | Publication date | Assignee | Title |
|---|---|---|---|---|
| WO2023162771A1 (en) | 2022-02-28 | 2023-08-31 | 株式会社Sustech | Information processing device, information processing method, and program |
| CN114925893A (en) * | 2022-05-09 | 2022-08-19 | 重庆大学 | Cross-provincial and cross-regional whole-year electricity purchasing strategy hierarchical optimization method considering source-load time sequence simulation and reservoir inter-month coordination |
| CN114925893B (en) * | 2022-05-09 | 2024-06-04 | 重庆大学 | Cross-provincial and cross-regional annual electricity purchasing strategy layered optimization method considering source-load time sequence simulation and reservoir inter-month coordination |
| CN116307144A (en) * | 2023-03-02 | 2023-06-23 | 国网能源研究院有限公司 | A coal-fired power adjustable capacity prediction method and a system having the same |
| WO2025079499A1 (en) * | 2023-10-12 | 2025-04-17 | 株式会社グリッド | Cost function generation device, processing device, cost function generation method, and cost function generation program |
| WO2025205513A1 (en) * | 2024-03-26 | 2025-10-02 | Eneosホールディングス株式会社 | Energy conversion plan creation device, and energy conversion device control system and method |
| CN119205184A (en) * | 2024-11-28 | 2024-12-27 | 华电环球(北京)贸易发展有限公司 | A power grid clearing method, system, electronic equipment and medium |
Also Published As
| Publication number | Publication date |
|---|---|
| JP7154244B2 (en) | 2022-10-17 |
Similar Documents
| Publication | Publication Date | Title |
|---|---|---|
| JP2021136832A (en) | Power supply and demand plan creation device and power supply and demand plan creation method | |
| Kettunen et al. | Optimization of electricity retailer's contract portfolio subject to risk preferences | |
| US20190130423A1 (en) | Management apparatus and management method | |
| JP7542408B2 (en) | Information processing device, information processing method, and computer program | |
| JP7059960B2 (en) | Power supply and demand planning device and power supply and demand planning method | |
| WO2018174030A1 (en) | Transaction planning device and transaction planning method | |
| Barton et al. | Aspen-EE: An agent-based model of infrastructure interdependency | |
| Zakeri et al. | Pricing wind: a revenue adequate, cost recovering uniform price auction for electricity markets with intermittent generation | |
| Wild | Determining commercially viable two-way and one-way ‘Contract-for-Difference’strike prices and revenue receipts | |
| Frew et al. | The interaction of wholesale electricity market structures under futures with decarbonization policy goals: A complexity conundrum | |
| JP2021047519A (en) | Bid plan determination device and bid plan determination method | |
| Delarue et al. | Effect of the accuracy of price forecasting on profit in a price based unit commitment | |
| Qudrat-Ullah | A framework for developing and implementing FIT policies for renewable energy based on local economic conditions | |
| JP7631103B2 (en) | Electricity supply and demand adjustment device, electricity supply and demand adjustment method, and program | |
| Lowry et al. | State performance-based regulation using multiyear rate plans for US electric utilities | |
| Geiger | Strategic power plant investment planning under fuel and carbon price uncertainty | |
| JP7525294B2 (en) | Power sales planning device, power sales planning method, and power sales planning program | |
| Đukan et al. | The impact of two-sided contracts for difference on debt sizing for offshore wind farms | |
| JP7345287B2 (en) | Power trading contract processing device and power trading contract processing method | |
| Schäfer et al. | On the functioning of a capacity market with an increasing share of renewable energy | |
| JP7701198B2 (en) | Power selling control device, power selling control system, and power selling control method | |
| JP2016207070A (en) | Power trading support device and method, or application device | |
| Pfeifenberger et al. | Second performance assessment of PJM’s reliability pricing model | |
| Sen et al. | Decision Aids for Scheduling and Hedging (DASH) in deregulated electricity markets: A stochastic programming approach to power portfolio optimization | |
| JP7697093B1 (en) | Information processing device, information processing method, and program |
Legal Events
| Date | Code | Title | Description |
|---|---|---|---|
| A621 | Written request for application examination |
Free format text: JAPANESE INTERMEDIATE CODE: A621 Effective date: 20211109 |
|
| A977 | Report on retrieval |
Free format text: JAPANESE INTERMEDIATE CODE: A971007 Effective date: 20220831 |
|
| TRDD | Decision of grant or rejection written | ||
| A01 | Written decision to grant a patent or to grant a registration (utility model) |
Free format text: JAPANESE INTERMEDIATE CODE: A01 Effective date: 20220906 |
|
| A61 | First payment of annual fees (during grant procedure) |
Free format text: JAPANESE INTERMEDIATE CODE: A61 Effective date: 20221004 |
|
| R150 | Certificate of patent or registration of utility model |
Ref document number: 7154244 Country of ref document: JP Free format text: JAPANESE INTERMEDIATE CODE: R150 |
|
| R250 | Receipt of annual fees |
Free format text: JAPANESE INTERMEDIATE CODE: R250 |