JP2018521714A - Device, system and method for visualization of patient related data - Google Patents
Device, system and method for visualization of patient related data Download PDFInfo
- Publication number
- JP2018521714A JP2018521714A JP2017559401A JP2017559401A JP2018521714A JP 2018521714 A JP2018521714 A JP 2018521714A JP 2017559401 A JP2017559401 A JP 2017559401A JP 2017559401 A JP2017559401 A JP 2017559401A JP 2018521714 A JP2018521714 A JP 2018521714A
- Authority
- JP
- Japan
- Prior art keywords
- plot
- patient
- related data
- visualization
- health
- Prior art date
- Legal status (The legal status is an assumption and is not a legal conclusion. Google has not performed a legal analysis and makes no representation as to the accuracy of the status listed.)
- Pending
Links
Images


Classifications
-
- A—HUMAN NECESSITIES
- A61—MEDICAL OR VETERINARY SCIENCE; HYGIENE
- A61B—DIAGNOSIS; SURGERY; IDENTIFICATION
- A61B5/00—Measuring for diagnostic purposes; Identification of persons
- A61B5/74—Details of notification to user or communication with user or patient ; user input means
- A61B5/742—Details of notification to user or communication with user or patient ; user input means using visual displays
-
- G—PHYSICS
- G16—INFORMATION AND COMMUNICATION TECHNOLOGY [ICT] SPECIALLY ADAPTED FOR SPECIFIC APPLICATION FIELDS
- G16H—HEALTHCARE INFORMATICS, i.e. INFORMATION AND COMMUNICATION TECHNOLOGY [ICT] SPECIALLY ADAPTED FOR THE HANDLING OR PROCESSING OF MEDICAL OR HEALTHCARE DATA
- G16H40/00—ICT specially adapted for the management or administration of healthcare resources or facilities; ICT specially adapted for the management or operation of medical equipment or devices
- G16H40/60—ICT specially adapted for the management or administration of healthcare resources or facilities; ICT specially adapted for the management or operation of medical equipment or devices for the operation of medical equipment or devices
- G16H40/63—ICT specially adapted for the management or administration of healthcare resources or facilities; ICT specially adapted for the management or operation of medical equipment or devices for the operation of medical equipment or devices for local operation
-
- A—HUMAN NECESSITIES
- A61—MEDICAL OR VETERINARY SCIENCE; HYGIENE
- A61B—DIAGNOSIS; SURGERY; IDENTIFICATION
- A61B5/00—Measuring for diagnostic purposes; Identification of persons
- A61B5/74—Details of notification to user or communication with user or patient ; user input means
- A61B5/746—Alarms related to a physiological condition, e.g. details of setting alarm thresholds or avoiding false alarms
-
- G—PHYSICS
- G16—INFORMATION AND COMMUNICATION TECHNOLOGY [ICT] SPECIALLY ADAPTED FOR SPECIFIC APPLICATION FIELDS
- G16H—HEALTHCARE INFORMATICS, i.e. INFORMATION AND COMMUNICATION TECHNOLOGY [ICT] SPECIALLY ADAPTED FOR THE HANDLING OR PROCESSING OF MEDICAL OR HEALTHCARE DATA
- G16H10/00—ICT specially adapted for the handling or processing of patient-related medical or healthcare data
- G16H10/60—ICT specially adapted for the handling or processing of patient-related medical or healthcare data for patient-specific data, e.g. for electronic patient records
-
- G—PHYSICS
- G16—INFORMATION AND COMMUNICATION TECHNOLOGY [ICT] SPECIALLY ADAPTED FOR SPECIFIC APPLICATION FIELDS
- G16H—HEALTHCARE INFORMATICS, i.e. INFORMATION AND COMMUNICATION TECHNOLOGY [ICT] SPECIALLY ADAPTED FOR THE HANDLING OR PROCESSING OF MEDICAL OR HEALTHCARE DATA
- G16H50/00—ICT specially adapted for medical diagnosis, medical simulation or medical data mining; ICT specially adapted for detecting, monitoring or modelling epidemics or pandemics
- G16H50/20—ICT specially adapted for medical diagnosis, medical simulation or medical data mining; ICT specially adapted for detecting, monitoring or modelling epidemics or pandemics for computer-aided diagnosis, e.g. based on medical expert systems
Abstract
本発明は、患者関連データの視覚化のためのデバイス、システム、及び方法に関する。介護者などのユーザが、患者の健康状態がクリティカルかどうかを迅速かつ容易に認識することを可能にするため、提案されるデバイスは、得られた患者関連データを視覚化するために処理するプロセッサ22を有する。プロセッサは、取得された患者関連データから導出される、時間にわたる少なくとも2つの異なる患者関連パラメータの時間依存プロット31〜35;101〜103を生成するよう構成される。上記プロットは、共通のタイミング図30;100における共通の視覚化のためディスプレイ11上に生成され、上記プロットのスケール、ベースライン、位置及び範囲が、上記プロットにより視覚化される個別のパラメータのパラメータ値が患者の健康状態にとってクリティカルでないと考えられるときに重複することなく共通タイミング図においてプロットを視覚化するよう選択され、上記プロットのパラメータのパラメータ値が患者の健康状態にとってクリティカルであると考えられるときに、別のプロットとの重なりを持つプロットを視覚化するよう選択される。The present invention relates to devices, systems, and methods for visualization of patient related data. In order to allow a user, such as a caregiver, to quickly and easily recognize whether a patient's health condition is critical, the proposed device processes a processor to visualize the resulting patient related data 22. The processor is configured to generate time-dependent plots 31-35; 101-103 of at least two different patient-related parameters over time, derived from acquired patient-related data. The plot is generated on the display 11 for common visualization in a common timing diagram 30; 100, and the scale, baseline, position and range of the plot are parameters of the individual parameters visualized by the plot. When the values are considered not critical to the patient's health, they are selected to visualize the plot in a common timing diagram without duplication, and the parameter values for the parameters in the plot are considered critical to the patient's health Sometimes it is chosen to visualize a plot that overlaps another plot.
Description
本発明は、患者関連データを視覚化するデバイス、システム、及び方法に関する。更に、本発明は、患者モニタに関する。 The present invention relates to devices, systems, and methods for visualizing patient related data. The invention further relates to a patient monitor.
患者モニタは、ヘルスケアにおいて、例えばICU又は一般的に病院で、患者関連データ、特に、バイタルサイン、スコア及び患者の状態に関連付けられる他の情報などの臨床データを監視及び視覚化するのに広く使用されている。例えば、よく知られているPhilips IntelliVue患者モニタは、患者の情報の明確な表示を提供し、臨床思考プロセスを反映した高度に構成可能な画面及び臨床判断支援ツールを使用する。IntelliVueモニタは、生理学的データを収集、結合、相互参照し、患者の状態の一貫した像を提供する。ポータブルデバイス、固定式スタンドアロンデバイス(ベッドサイドモニターなど)、又は従来のコンピュータで実行されるPC若しくはワークステーションソリューションを含む、これらのIntelliVueモニタのさまざまなバージョンが存在する。 Patient monitors are widely used in health care, for example in ICUs or hospitals in general, to monitor and visualize patient related data, in particular clinical data such as vital signs, scores and other information related to patient status. It is used. For example, the well-known Philips IntelliVue patient monitor provides a clear display of patient information and uses highly configurable screens and clinical decision support tools that reflect clinical thinking processes. The IntelliVue monitor collects, combines, and cross-references physiological data and provides a consistent picture of the patient's condition. There are various versions of these IntelliVue monitors, including portable devices, fixed stand-alone devices (such as bedside monitors), or PC or workstation solutions running on conventional computers.
1人の患者に関する利用可能な大量の患者関連データは、多くの利点をもたらすが、特に患者の状態及び患者の病歴を理解しようとする臨床医及び医師(又は一般に、介護者若しくはユーザ)にとって、チャレンジも課す。視覚化及び視覚的分析は、特に介護者に対する診断及び意思決定支援につき、この大量の患者関連データを分析、フィルタリング、及び説明するのに役立つことができる。しかし、視覚化は有用であり、かつ斯かる目標を達成するよう、慎重に設計されるべきである。 The large amount of patient-related data available for a single patient provides many benefits, but especially for clinicians and physicians (or generally caregivers or users) seeking to understand the patient's condition and patient history. Imposing a challenge. Visualization and visual analysis can help analyze, filter, and explain this large amount of patient-related data, especially for diagnosis and decision support for caregivers. However, visualization is useful and should be carefully designed to achieve such goals.
EP2730217A1号は、生体情報表示装置を開示する。これは、測定下の生体情報を表示する測定表示画面と、生体情報の異常を報知する情報を表示する異常表示画面と、異常発生時の生体情報とが表示される表示部を含む。生体情報表示装置は、測定表示画面上に異常表示画面を表示するよう構成される表示制御部を更に含む。その結果、異常表示画面が、測定表示画面に重畳される。異常表示画面が表示部に表示される場合、表示制御部は、表示部を制御し、異常が解消された場合であっても、異常が発生したタイミングの生体情報の異常を報知する情報及び生体情報が、異常表示画面に引き続き表示される。 EP 2730217 A1 discloses a biological information display device. This includes a measurement display screen for displaying the biological information under measurement, an abnormality display screen for displaying information for notifying abnormality of the biological information, and a display unit for displaying the biological information when the abnormality occurs. The biological information display device further includes a display control unit configured to display an abnormal display screen on the measurement display screen. As a result, the abnormality display screen is superimposed on the measurement display screen. When the abnormal display screen is displayed on the display unit, the display control unit controls the display unit, and even when the abnormality is resolved, information and biological information for notifying the abnormality of the biological information at the timing when the abnormality has occurred Information continues to be displayed on the anomaly display screen.
本発明の目的は、特に診断及び意思決定支援において、患者関連データを理解及び使用する介護者又は他のユーザを更に支援する患者関連データの視覚化に関するデバイス、システム及び方法を提供することである。更なる目的は、対応する患者モニタを提供することである。 It is an object of the present invention to provide a device, system and method for visualization of patient related data that further assists a caregiver or other user who understands and uses patient related data, particularly in diagnosis and decision support. . A further object is to provide a corresponding patient monitor.
これらの目的は、独立請求項により規定される本発明により解決される。有利な実施形態が、従属項において規定される。 These objects are solved by the present invention as defined by the independent claims. Advantageous embodiments are defined in the dependent claims.
本発明の第1の態様では、患者関連データの視覚化に関するデバイスが提示され、このデバイスは、
時間にわたり患者の患者関連データを取得するデータ入力と、
上記得られた患者関連データを視覚化するために処理するプロセッサであって、上記プロセッサが、上記取得された患者関連データから導出される、時間にわたる少なくとも2つの異なる患者関連パラメータの時間依存プロットを生成し、上記プロットは、ディスプレイにおける共通の時間軸を持つ共通のタイミング図において共通の視覚化のために生成される、プロセッサと、
上記生成された時間依存プロットを視覚化のためディスプレイに出力するデータ出力とを有し、
上記プロットのスケール、ベースライン、位置及び範囲が、上記プロットにより視覚化される個別のパラメータのパラメータ値が患者の健康状態にとってクリティカルでないと考えられるときに重複することなく共通タイミング図においてプロットを視覚化するよう選択され、所与のプロットのパラメータのパラメータ値が患者の健康状態にとってクリティカルであると考えられるときに、共通のタイミング図において視覚化される上記プロットの別のプロットと重複して、上記プロットの所与のプロットを視覚化するよう選択される。
In a first aspect of the invention, a device for visualization of patient related data is presented, the device comprising:
Data entry to capture patient related data of patients over time;
A processor for processing to visualize the obtained patient related data, wherein the processor derives a time dependent plot of at least two different patient related parameters over time derived from the acquired patient related data. Generating and the plot is generated for common visualization in a common timing diagram with a common time axis in the display; and
A data output for outputting the generated time-dependent plot to a display for visualization;
Visualize the plots in a common timing diagram without overlapping the scale, baseline, position, and range of the plots when the parameter values of the individual parameters visualized by the plots are not considered critical to the patient's health Overlapping with another plot of the above plot visualized in a common timing diagram when the parameter values of the parameters of a given plot are considered critical to the patient's health, A given plot of the plot is selected to be visualized.
本発明の更なる態様では、患者モニタが提示され、これは、本発明によるデバイスと、上記デバイスにより生成される時間依存プロットの視覚化のためのディスプレイとを有する。 In a further aspect of the invention, a patient monitor is presented, which comprises a device according to the invention and a display for visualization of the time-dependent plot generated by the device.
本発明の更なる態様では、システムが提示され、これは、患者関連データを取得する複数のセンサと、取得された患者関連データを取得及び処理する本発明による患者モニタとを有する。 In a further aspect of the present invention, a system is presented, which comprises a plurality of sensors for acquiring patient related data and a patient monitor according to the present invention for acquiring and processing acquired patient related data.
本発明のなお更なる態様において、患者関連データの視覚化方法が提示される。 In yet a further aspect of the invention, a method for visualizing patient related data is presented.
本発明の更なる態様において、コンピュータで実行されるとき、コンピュータが本書に記載される方法のステップを実行することをもたらすプログラムコード手段を有するコンピュータプログラム、及びプロセッサにより実行されるとき、本書に記載される方法が実行されることをもたらすコンピュータプログラムを格納する非一時的なコンピュータ可読記録媒体が提供される。 In a further aspect of the invention, a computer program having program code means that, when executed on a computer, causes the computer to perform the steps of the methods described herein, and described herein when executed by a processor. A non-transitory computer readable recording medium is provided that stores a computer program that causes the method to be performed.
本発明の好ましい実施形態は、従属項において規定される。請求項に記載される方法、システム、患者モニタ、コンピュータプログラム及び媒体は、独立及び従属請求項に記載されるデバイスと同様の及び/又は同一の好ましい実施形態を持つ点を理解されたい。 Preferred embodiments of the invention are defined in the dependent claims. It is to be understood that the method, system, patient monitor, computer program and medium described in the claims have preferred embodiments similar and / or identical to the devices described in the independent and dependent claims.
本発明は、患者が(潜在的に)クリティカルな健康状態にある又はそれに向かっているかどうかを直接かつ即座にユーザが認識することを可能にする態様で、得られた患者関連データを処理及び視覚化するという考えに基づかれる。このため、時間依存プロットが、時間にわたる患者関連パラメータから生成される。上記患者関連パラメータは一般に、取得された患者関連データから得られ、測定されたバイタルサイン(例えば、心拍数、呼吸数、血圧、SpO2、体温、ECG信号など)などの患者関連データそのものであってもよい。上記患者関連パラメータは、取得された患者関連データ(例えば、1つ又は複数のバイタルサイン)及び/又は任意の格納された若しくは入力された患者関連データ(例えば、患者履歴の医療データ、患者データ(サイズ、体重、BMI、性別など))の1つ又は複数のピースから計算される1つ又は複数のパラメータとすることができる。斯かる計算されたパラメータは、スコア(例えば、EWS(早期警告スコア)又はリスクスコア)、PWV(脈波伝播速度)、警報、通知、動き、又は作業リスト項目とすることができる。 The present invention processes and visualizes the patient-related data obtained in a manner that allows the user to recognize directly and immediately whether or not the patient is (potentially) critically healthy. Based on the idea of Thus, time dependent plots are generated from patient related parameters over time. The patient-related parameters are generally derived from acquired patient-related data and are patient-related data itself such as measured vital signs (eg, heart rate, respiratory rate, blood pressure, SpO2, body temperature, ECG signal, etc.) Also good. The patient-related parameters may be acquired patient-related data (eg, one or more vital signs) and / or any stored or entered patient-related data (eg, patient history medical data, patient data ( One or more parameters calculated from one or more pieces of size, weight, BMI, gender, etc.). Such a calculated parameter can be a score (eg, EWS (Early Warning Score) or risk score), PWV (Pulse Wave Velocity), alert, notification, motion, or work list item.
これにより、異なる患者関連パラメータの2つ以上のプロットが、ディスプレイにおける共通のタイミング図で共通に視覚化されるように生成される。言い換えると、従来各プロットは自身の図において視覚化されるが、プロットは同じ図に表示されるべきである。しかしながら、従来プロットは互いに複数回交差し、明確かつ即時的な理解可能性の喪失をもたらすが、プロットのスケール、ベースライン、位置及び範囲は、本発明に基づき特定の態様で選択される。これは、プロットが、プロットにより視覚化される個別のパラメータのパラメータ値が、患者の健康状態にとってクリティカルでないと考えられる時間において重複することなしに、共通のタイミング図において視覚化されることを確実にする。即ち正常な健康状態に関して、プロットは互いに交差しない。しかしながら、プロットのパラメータのパラメータ値が患者の健康状態にとってクリティカルであると考えられる時間において、対応するプロットは、別のプロットと、好ましくは隣接するプロットと重複して視覚化される。 This generates two or more plots of different patient-related parameters that are commonly visualized in a common timing diagram on the display. In other words, each plot is conventionally visualized in its own figure, but the plots should be displayed in the same figure. However, while conventional plots intersect each other multiple times, resulting in a clear and immediate loss of comprehension, the scale, baseline, position and range of the plot are selected in a particular manner based on the present invention. This ensures that the plots are visualized in a common timing diagram without duplicating the parameter values of the individual parameters visualized by the plot at times that are not considered critical to the patient's health. To. That is, the plots do not cross each other for normal health. However, at times when the parameter values of the parameters of the plot are considered critical to the patient's health, the corresponding plot is visualized overlapping with another plot, preferably with an adjacent plot.
本発明の文脈において、共通のタイミング図は好ましくは、2つ以上の時間依存プロットが共通の時間軸に対して共同して視覚化されるグラフ表現を指す。即ち、共通の時間軸に沿った各点について、共通のタイミング図で視覚化される異なるプロットが、同じ瞬間における対応する患者関連パラメータの値を提供する。 In the context of the present invention, a common timing diagram preferably refers to a graphical representation in which two or more time-dependent plots are jointly visualized against a common time axis. That is, for each point along a common time axis, different plots visualized in a common timing diagram provide corresponding patient-related parameter values at the same instant.
こうして、それは、ユーザにより簡単かつ迅速に認識されることができる。即ち、介護者が直ちに注意を必要とする場合がある、患者の健康にとって潜在的にクリティカルな状況があるかどうかを、プロット間に重複があるかどうかを識別することで認識することができる。斯かる重なりは、スクリーンに、例えば患者モニタのスクリーンに通常表示される様々な患者関連パラメータの複数のプロットを一般に含む、様々な種類の情報の集中的な研究なしに認識されることさえできる。しかし、遠方から少し見ただけでも、斯かる重なりは認識されることができ、その結果、ユーザは、患者のクリティカルな状況が存在するか否かを容易に知ることができる。 Thus, it can be easily and quickly recognized by the user. That is, it can be recognized by identifying whether there is an overlap between plots, whether there is a potentially critical situation for the patient's health that the caregiver may need immediate attention. Such overlap can even be recognized without intensive study of various types of information, typically involving multiple plots of various patient-related parameters that are typically displayed on a screen, for example, a patient monitor screen. However, even from a short distance, such an overlap can be recognized, so that the user can easily know if there is a critical situation for the patient.
この文脈において、重複は、2つのプロット間の交差として、及びプロットが通常(非クリティカルな状況に対して)視覚化されるシーケンスの変化(例えば、図における上から下又は左から右へ)として理解されるべきである。例えば、2つのプロット(例えば、心拍数(HR)及び呼吸数(RR))が互いの上に視覚化される場合(例えば、HRプロットがRRプロットの下に視覚化される)、2つのプロットの交差、及びプロットの配置における変化(例えば、RRが非常に低い(即ちクリティカルな)値へと降下することにより、ある時点のRRプロットがHRプロットと交差し、今やHRプロットの下にある場合)は、患者の健康状態が、直ちに注意を必要とする潜在的に危険な状態に悪化したことを示す。これは、介護者、例えば患者の病院の部屋に入る看護師により迅速かつ容易に認識されることができる。その結果、患者が実際にクリティカルな状態にあるかどうか、又は例えば、RRセンサの誤配置、若しくは患者がRRセンサを取り除いたといった何か他のことがプロットの視覚化における変化を引き起こしたかどうかを介護者は直ちにチェックすることができる。 In this context, overlap is as an intersection between two plots and as a sequence change (eg from top to bottom or from left to right in the figure) where the plot is usually visualized (for non-critical situations) Should be understood. For example, if two plots (eg, heart rate (HR) and respiration rate (RR)) are visualized on top of each other (eg, the HR plot is visualized below the RR plot), two plots And the change in the placement of the plot (eg, when RR falls to a very low (ie critical) value, the RR plot at a point in time intersects the HR plot and is now below the HR plot) ) Indicates that the patient's health has deteriorated to a potentially dangerous condition that requires immediate attention. This can be recognized quickly and easily by a caregiver, for example a nurse entering the patient's hospital room. As a result, whether the patient is actually in a critical state or whether something else has caused a change in the visualization of the plot, for example, mispositioning of the RR sensor, or the patient has removed the RR sensor. The caregiver can check immediately.
更に、この文脈において、クリティカルな健康状態(又は健康状況)は、患者の重度の損傷又は死亡を避けるために介護者が直ちに注意する必要がある度合にまで劣化する健康状況(又は状態)として理解される。クリティカルと考えられるパラメータ値は、あらゆる種類の患者及び一般的な健康状態に有効な一般的な意味において、特定の患者関連パラメータごとに予め決定されてもよい。更なる改良では、クリティカルと考えられるパラメータ値は、患者若しくは患者群及び/又は一般的な健康状態若しくはある種類の健康状態に適合されることができ、患者履歴も考慮されることができる。 Furthermore, in this context, a critical health condition (or health condition) is understood as a health condition (or condition) that degrades to the extent that the caregiver needs to be alerted immediately to avoid severe injury or death of the patient. Is done. Parameter values that are considered critical may be predetermined for each particular patient-related parameter in a general sense that is valid for all types of patients and general health conditions. In a further refinement, parameter values that are considered critical can be adapted to the patient or group of patients and / or general health conditions or certain health conditions, and the patient history can also be taken into account.
クリティカルな健康状態は、2つのプロットの間に重複がある場合にのみ与えられるわけではない点に留意されたい。2つのプロットの重複をもたらさない(所与の又は今後来る)クリティカルな健康状態が存在してもよい。従って、潜在的にクリティカルな健康状態を示す重複に加えて使用される他のインジケータが存在することができる。例えば、個別のパラメータ値がクリティカルになるか、プロットが点滅し始めるか、又はクリティカルになり始める場合プロットに加えて追加の記号(例:感嘆符)が表示される場合、プロットの視覚化に使用される色、線の太さ、又はアイコンが変化することができる。 Note that a critical health condition is not given only if there is an overlap between the two plots. There may be critical health conditions (given or coming) that do not result in duplication of the two plots. Thus, there can be other indicators used in addition to duplication indicating a potentially critical health condition. For example, if an individual parameter value becomes critical, the plot begins to flash, or an additional symbol (eg, exclamation mark) is displayed in addition to the plot, use it to visualize the plot Color, line thickness, or icon can be changed.
好ましい実施形態によれば、プロセッサは、プロットのスケール、ベースライン、位置及び範囲に関する一般的なデフォルト値を使用するよう構成される。これらの一般的なデフォルト値は、予め定められ、デフォルト使用のためにデバイスに記憶されてもよい。デフォルト値は、大多数の患者及び健康状況に対して、プロットが所望の挙動を示すよう決定される。 According to a preferred embodiment, the processor is configured to use common default values for plot scale, baseline, position and range. These general default values may be predetermined and stored on the device for default use. Default values are determined so that the plot shows the desired behavior for the majority of patients and health situations.
しかしながら、斯かる一般的なデフォルト値が最適でない患者及び健康状態が存在する。従って、別の実施形態において、プロセッサは、プロットのスケール、ベースライン、位置及び範囲を選択するため、患者関連デフォルト値を使用するよう構成され、上記患者関連デフォルト値は、年齢、サイズ、体重、ボディマス指数、性別、健康状態、現在の治療、現在の投薬、意識状態、患者の患者カテゴリの1つ又は複数に基づき選択される。これは、異常なタイプの患者及び健康状態であっても、プロットの望ましい挙動を確実にする。正しい患者関連デフォルト値を選択するのに使用される患者の必要なデータは例えば、デバイスに、好ましくはデバイスが接続される患者モニタ若しくは病院情報システムに既に格納されるか、又はユーザインターフェースを介して若しくは患者識別子(例えば、患者に割り当てられたバーコード又はRFID)を用いて、入力若しくは選択されることができる。 However, there are patients and health conditions where such general default values are not optimal. Thus, in another embodiment, the processor is configured to use patient related default values to select the scale, baseline, position and range of the plot, wherein the patient related default values include age, size, weight, Selected based on one or more of body mass index, gender, health status, current treatment, current medication, consciousness status, patient patient category. This ensures the desired behavior of the plot, even for abnormal types of patients and health conditions. The patient's necessary data used to select the correct patient-related default values are already stored in the device, preferably in the patient monitor or hospital information system to which the device is connected, or via a user interface, for example. Alternatively, it can be entered or selected using a patient identifier (eg, a barcode or RFID assigned to the patient).
別の実施形態では、プロセッサは、年齢、サイズ、体重、ボディマス指数、性別、健康状態、現在の治療、現在の投薬、意識状態、患者の患者カテゴリの1つ又は複数に基づいて、患者に関するプロットのスケール、ベースライン、位置及び範囲を個別に決定するよう構成される。これは、プロットの所望の挙動を更に改善する。例えば、アルゴリズム又はモデルの使用により、プロットのスケール、ベースライン、位置及び範囲は、患者に関する1つ又は複数のデータに基づいて決定されることができる。更に、プロットが共通の図で視覚化される患者関連パラメータのタイプは一般に、斯かる計算において考慮される。 In another embodiment, the processor plots the patient based on one or more of age, size, weight, body mass index, gender, health status, current treatment, current medication, consciousness status, patient patient category. Configured to individually determine the scale, baseline, position and range of This further improves the desired behavior of the plot. For example, through the use of an algorithm or model, the scale, baseline, position, and range of the plot can be determined based on one or more data about the patient. Furthermore, the types of patient-related parameters whose plots are visualized in a common diagram are generally considered in such calculations.
一般に、タイミング図の最上位のプロット(時間軸が水平軸の場合)には、上に隣接するプロットはなく、最下位のプロットには下に隣接するプロットはない。従って、クリティカルな状況を認識できるようにするため、プロセッサは、共通のタイミング図において視覚化されるべきプロットのスケール、ベースライン、位置及び範囲を最上位及び最下位のプロットとして選択するように更に構成されることができる。その結果、最上位のプロットは、最上位のプロットのパラメータのパラメータ値が増加して患者の健康状態にとってクリティカルであると考えられる時間において、上部閾値インジケータと重なり、最下位のプロットは、最下位のプロットのパラメータのパラメータ値が減少して患者の健康状態にとってクリティカルであると考えられる時間において、下部閾値インジケータと重なる。 In general, the top plot of the timing diagram (when the time axis is the horizontal axis) has no top adjacent plot, and the bottom plot has no bottom adjacent plot. Thus, in order to be able to recognize critical situations, the processor further selects the scale, baseline, position and range of plots to be visualized in a common timing diagram as the top and bottom plots. Can be configured. As a result, the top plot overlaps the upper threshold indicator at times when the parameter values of the parameters of the top plot increase and are considered critical to the patient's health, and the bottom plot is the bottom plot. The parameter values of the plot parameters overlap with the lower threshold indicator at a time when the parameter value decreases and is considered critical to the patient's health.
斯かる実施形態では、プロセッサが、最上位のプロットと上部の閾値インジケータとの重なりで、及び最下位のプロットと下部の閾値インジケータとの重なりで重複インジケータを生成するよう構成されることが更に好ましい。これは、潜在的にクリティカルな健康状態が存在するかどうかをユーザが認識する能力を更に改善する。斯かる重複インジケータは一般に、矢印、円、長方形、線、異なる色又はフォントの表示など、任意のはっきりと認識可能なマークとすることができる。 In such embodiments, it is further preferred that the processor is configured to generate a duplicate indicator at the overlap of the top plot and the upper threshold indicator, and at the overlap of the bottom plot and the lower threshold indicator. . This further improves the ability of the user to recognize whether a potentially critical health condition exists. Such an overlap indicator may generally be any clearly recognizable mark, such as an arrow, circle, rectangle, line, different color or font display.
この実施形態の別の改良形態では、プロセッサは、最上位のプロットが上部閾値インジケータとどの程度重なるか、又は最下位のプロットが下部閾値インジケータとどの程度重なるかを示すよう、重複インジケータを生成する。これは、患者の健康状態がどの程度悪化しているかを容易に認識することを可能にする。例えば、ラインの厚さ又は傾斜角は、重複の程度のインジケータとして使用されてもよい。即ち、ラインがどれほど厚いか、及び/又はラインがどれほど急であるかは、重複の程度であり、この程度は、患者の健康状態が強く悪化するほど大きくなる。 In another refinement of this embodiment, the processor generates a duplicate indicator to indicate how much the top plot overlaps the upper threshold indicator, or how much the bottom plot overlaps the lower threshold indicator. . This makes it possible to easily recognize how much the patient's health has deteriorated. For example, line thickness or tilt angle may be used as an indicator of the degree of overlap. That is, how thick the line is and / or how steep the line is the degree of overlap, and this degree increases as the patient's health is strongly worsened.
時間軸が垂直軸であるようタイミング図が構成される場合、同じ実施形態が適用されることができる。この場合、「最上位」及び「最下位」は、「右端」と「左端」に置き換えられ、「上」と「下」が、「右」と「左」に置き換えられる。 The same embodiment can be applied if the timing diagram is configured such that the time axis is the vertical axis. In this case, “highest” and “lowest” are replaced with “right end” and “left end”, and “upper” and “lower” are replaced with “right” and “left”.
別の実施形態によれば、プロセッサは、ディスプレイのタイプ及び/又はサイズに基づき、プロットのスケール、ベースライン、位置及び範囲を選択するよう構成される。図は一般に、PC、ラップトップ、タブレット、患者モニタ、スマートフォンなど多くの異なる種類のディスプレイに表示されてもよい。多くの異なるタイプ及びサイズのディスプレイが一般的に使用可能である。視覚化を最適化するため、それは、ディスプレイタイプ及び/又はサイズに基づき適合される。 According to another embodiment, the processor is configured to select the scale, baseline, position and range of the plot based on the display type and / or size. The diagram may generally be displayed on many different types of displays, such as a PC, laptop, tablet, patient monitor, smartphone, and the like. Many different types and sizes of displays are generally available. In order to optimize the visualization, it is adapted based on the display type and / or size.
提案される患者モニタは好ましくは、ユーザがプロットのスケール、ベースライン、位置、範囲及び/又は視覚化の種類を選択及び/又は変更することを可能にするユーザインターフェースを有する。斯かるユーザインターフェースは、例えば、タッチスクリーン、キーパッド又はコンピュータマウスなどのグラフィカルユーザインタフェースとすることができる。これは、一般に、自動的に生成された視覚化の設定を実際の患者及び患者の健康状態に適応させることを可能にする。一般に、すべての設定は、ユーザの選択及び/又は変更の対象となり得る。 The proposed patient monitor preferably has a user interface that allows the user to select and / or change the scale, baseline, position, range and / or type of visualization of the plot. Such a user interface can be, for example, a graphical user interface such as a touch screen, keypad or computer mouse. This generally allows the automatically generated visualization settings to be adapted to the actual patient and patient health. In general, all settings can be subject to user selection and / or modification.
提案される患者モニタは、ユーザがプロット又は完全なプロットの点を選択することを可能にするユーザインターフェースを更に有することができ、上記ディスプレイは、上記プロットの上記選択された点のパラメータの、上記選択された点の時間瞬間におけるすべてのパラメータの、又は上記選択された完全なプロットのパラメータのパラメータ値を表示するよう構成される。一般に、プロットのパラメータ値が格納され、これは、例えば、プロット上の特定の点を指すことにより、ユーザにより示されるパラメータ値の視覚化を可能にする。特にクリティカルな健康状態の場合、明示的なパラメータ値は、実際にクリティカルな状況が存在するか、又はどの程度クリティカルであるかを臨床医が決定するのに有用であり得る。 The proposed patient monitor may further have a user interface that allows a user to select a point of the plot or complete plot, and the display is a parameter of the selected point parameter of the plot. It is configured to display parameter values for all parameters at the time instant of the selected point, or for the parameters of the selected full plot. In general, the parameter values of the plot are stored, which allows visualization of the parameter values shown by the user, for example by pointing to a specific point on the plot. Explicit parameter values can be useful for a clinician to determine whether a critical situation actually exists or how critical, especially in critical health conditions.
提案される患者モニタは、非表示にしてはならないプロットを選択することにより、又は非表示にすべきプロットを選択することにより、ユーザが1つ又は複数のプロットを隠すことを可能にするユーザインターフェースを更に有することができる。これは、重要な情報を認識するのに更に役立つ。 The proposed patient monitor has a user interface that allows the user to hide one or more plots by selecting plots that should not be hidden or by selecting plots that should be hidden Can further be included. This further helps to recognize important information.
本発明のこれらの及び他の態様が、以下に説明される実施形態より明らとなり、これらの実施形態を参照して説明されることになる。 These and other aspects of the invention will be apparent from and will be elucidated with reference to the embodiments described hereinafter.
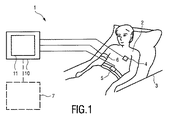
図1は、本発明による患者モニタ10を含む患者モニタリングのための本発明によるシステム1の概略図を示す。患者2は、この例では、例えば病院又は他の医療施設でベッド3に横たわっているが、例えばインキュベーターに横たわる新生児若しくは未熟児、又は自宅若しくは別の環境にいる人とすることもできる。患者モニタ10の他に、システム1は、患者関連データを取得する複数のセンサを有する。例えば、患者の心拍数を測定する心拍センサ4、患者の呼吸数を測定する呼吸数センサ5、患者の血圧などを測定する血圧センサ6等である。SpO2センサ、温度センサ、ECG電極など、特に患者2のバイタルサインを測定するために、より少ない又はより多くのセンサが提供されることができる。一般に、患者2の所望の監視に使用することができ、又は介護者により使用されることが望まれる、バイタルサイン又は他の任意の患者関連データを測定する任意の種類のセンサが、システム1において一般的に使用され得る。更なる患者関連データは、別のソース7から、例えば検査室、患者履歴ファイル、病院情報システムなどから患者モニタに提供されてもよい。
FIG. 1 shows a schematic diagram of a
患者モニタは、当該技術分野において一般的に知られている。例えば、本出願人のIntelliVue患者モニタであり、これは広く使用され、種々の実施形態で利用可能である。斯かる患者モニタは一般に、センサにより取得された信号を処理し、それらをディスプレイ11上に視覚化する。これにより、取得された信号の1つ又は複数が表示されるだけでなく、患者の健康状態に関するスコア又は他のデータなどの他の患者関連データも表示され得る。
Patient monitors are generally known in the art. For example, Applicants' IntelliVue patient monitor, which is widely used and available in various embodiments. Such patient monitors typically process the signals acquired by the sensors and visualize them on the
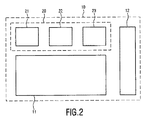
図2は、本発明による患者関連データの視覚化のためのデバイス20と、上記デバイス20により生成される時間依存プロットの視覚化のためのディスプレイ11とを含む、本発明による患者モニタ10の概略図を示す。
FIG. 2 is a schematic of a
デバイス20は例えば、コンピュータ又はプロセッサにより実現されることができ、センサ4、5、6とプロセッサ22との間に結合されるデータ入力インタフェースのようなデータ入力21を有する。患者関連データは好ましくは、センサ4、5、6により取得される信号であるが、デバイス20による処理のために(例えば、病院のアーカイブの)ストレージに記憶されるデータであってもよい(部分的に又は完全に)。
デバイス20は、視覚化のため、得られた患者関連データを処理するプロセッサ22を更に有する。これにより、取得された患者関連データから導出される少なくとも2つの異なる患者関連パラメータの時間にわたる時間依存プロットが生成される。患者関連パラメータは、患者関連データに対応してもよい。即ち、心拍数、呼吸数若しくは血圧などの測定されたバイタルサインとすることができ、及び/又は健康スコア、リスクスコア、他の生理学的パラメータ若しくは患者の健康状態に関連付けられる情報などの測定データから得られるパラメータとすることができる。
The
一般に、時間依存プロットは、例えばお互いのトップ及びディスプレイ上の別々のウィンドウに、別個のタイミング図において分離して描かれる。対照的に、本発明によれば、時間依存プロットは、共通の視覚化のため、ディスプレイ11上の共通のタイミング図において生成される。特に、プロットのスケール、ベースライン、位置及び範囲は、プロットにより視覚化される個別のパラメータのパラメータ値が患者の健康状態にとってクリティカルではないと考えられるとき、重複なしに共通タイミング図におけるプロットを視覚化し、及び上記プロットのパラメータのパラメータ値が患者の健康状態にとってクリティカルであると考えられるとき、別のプロットと重複してプロットを視覚化するよう選択される。
In general, time-dependent plots are drawn separately in separate timing diagrams, for example in separate windows on each other's top and display. In contrast, according to the present invention, time dependent plots are generated in a common timing diagram on
生成された視覚化のための時間依存プロットをディスプレイ11に出力するため、プロセッサ22とディスプレイ11との間に結合されるデータ出力インタフェースのようなデータ出力23が提供される。
A
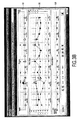
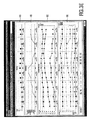
図3は、本発明によるデバイス又は方法により生成される時間依存プロットを示すタイミング図のいくつかの実施形態を示し、時間にわたる(ここでは6日間にわたる)様々な患者関連パラメータを示す。 FIG. 3 shows several embodiments of a timing diagram showing a time-dependent plot generated by a device or method according to the present invention, showing various patient-related parameters over time (here over 6 days).
図3Aは、(上から下へと)血圧(BP)のプロット31と、温度(Temp)のプロット32と、心拍数(Pulse)のプロット33、血液酸素飽和度(Sp02)のプロット34、呼吸数(Resp)のプロット35を含むいくつかのプロット(傾向とも呼ばれる)が時間にわたり視覚化されるタイミング図30の第1の実施形態を示す。この実施形態では、プロット32〜35は、個別の患者関連パラメータの利用可能なパラメータ値を結ぶ線として視覚化される。更に、パラメータ値は、異なるアイコン(例えば、Sp02に対するドット、HRに対するハート形)により別々に示される。血圧のプロット31は、個別の時間瞬間における収縮期血圧、平均血圧及び拡張期血圧を示す範囲指示により示される。
FIG. 3A shows (from top to bottom) blood pressure (BP) plot 31, temperature (Temp)
図3Aからわかるように、プロットは一般に、重なり合わないよう(即ち互いに交差しないよう)配置される。このことは、個別のパラメータがクリティカルでない範囲にある、即ち患者の健康状態がクリティカルでないものとして理解されるであろう。プロットのスケール、ベースライン、位置及び範囲はこれに基づき選択される。例えば、RRのプロット35の場合、プロット35がタイミング図30の最下位になるように、スケール、ベースライン、位置及び範囲が選択される。RRは通常10〜20の範囲にあるので、この範囲は、タイミング図30の最下位に位置し、タイミング図の上部領域に延在することはできない。隣接するプロット34について、Sp02は通常、94%と100%との間の範囲にある。この範囲は、通常(即ち、Sp02とRRのクリティカルでない値に対して)、プロット34がプロット35と交差しないよう、配置される。SpO2が約93%又は94%を下回った場合、プロット34及び35は交差し(即ち、重複し)、患者の潜在的にクリティカルな健康状態を示す(Sp02が低すぎるため)。
As can be seen from FIG. 3A, the plots are generally arranged so that they do not overlap (ie, do not cross each other). This will be understood as the individual parameters are in a non-critical range, i.e. the patient's health is not critical. The scale, baseline, position and range of the plot are selected based on this. For example, in the case of the
図3Aでは、HRのプロット33とSp02のプロット34の間で、O1、O2、O3、O4のような重複が2日目から6日目に見られる。プロット33がプロット34の上にある「通常の」(クリティカルではない)状況(例えば、1日目)と比較して、上記プロット33、34は互いに複数回交差し、従って、より長い期間(即ち、プロット34がプロット33の上にある場合はいつでも)重複する。従って、これらのプロット33、34の間のこれらの重複O1、O2、O3、O4は、(例えば、重複を示すすべてのプロット若しくは選択されたプロット又はメッセージを介護者のスマートフォン又はコンピュータに送信することにより)介護者にとって容易に認識可能な方法で、患者の健康状態が潜在的にクリティカルであることを示す。その結果、介護者はこれを確認し、必要に応じて直ちに処置を取ることができる。2日目から5日目のBPのプロット31と温度のプロット32との間、及び2日目の温度のプロット32とHRのプロット33との間に、更なる重複が現れる。
In FIG. 3A, an overlap, such as O1, O2, O3, O4, is seen from
2日目のプロット32〜35の鋸歯状部分から分かるように、負のスコア6が得られる(スコア図40に示される)。この負のスコア及び/又はプロットの重なりのため、例えば介護者により又は自動で測定間隔は短縮される。即ち、この例では別に行われる1日3回スポットチェックの代わりに患者がより注意深く監視される。こうして、より集中的な測定は、より多くの測定データを提供し、プロットの鋸歯状の部分をもたらす。この間、好ましくは、測定点を示すためのアイコン(例えば、心又は円)は使用されず、線のみが描かれる。患者の健康状態が再び改善した後、測定間隔は、1日目と同様に1日3回の測定に再び拡大される。
A negative score of 6 is obtained (score shown in FIG. 40) as can be seen from the serrated portion of plots 32-35 on
図3Aには、計算されたMEWS(修正早期警告スコア)を時間にわたり示すスコア図40と、LOC(意識レベル)を時間にわたり示す観察図50とを含む更なる図及び更なる情報が示される。更に、様々な一般情報(患者の名前、ID、誕生日及び年齢など)及び視覚化、設定又はメニュー項目を選択又は変更するための様々なボタンが示される。 FIG. 3A shows further diagrams and further information including a score diagram 40 showing the calculated MEWS (modified early warning score) over time and an observation diagram 50 showing the LOC (consciousness level) over time. In addition, various general information (such as patient name, ID, date of birth and age) and various buttons for selecting or changing visualization, settings or menu items are shown.
図3Bは、異なる図の第2の実施形態を示す。図3Aに示される図と比較して、スコア図41はスコア図40とわずかに異なる。スコア図41は、MEWSに加えて、特にSIRS(全身性炎症反応症候群)がある時刻(この例では2、3及び4日目である)に与えられる(SIRS)場合の敗血症を示す。
FIG. 3B shows a second embodiment of a different view. Compared to the diagram shown in FIG. 3A, the score diagram 41 is slightly different from the score diagram 40. Score diagram 41 shows sepsis in addition to MEWS, particularly when SIRS (systemic inflammatory response syndrome) is given (SIRS) at certain times (in this example,
図3Cは、異なる図の第3の実施形態を示す。図3Bに示される図と比較して、スコア図42は、SIRSが与えられているかどうかを示すだけでなく、敗血症が疑われるかどうか(Susp)(この例では2日目があてはまる)を示すことによりわずかに異なる。更に、観察図52は、新たな感染(New Inf.)が検出されたかどうか(この例では2日目があてはまる)を追加的に示し、これは、介護者が注意深く見なければならないかどうかを容易に認識することを可能にする。
FIG. 3C shows a third embodiment of a different view. Compared to the diagram shown in FIG. 3B, score diagram 42 not only shows whether SIRS is being given, but also shows whether sepsis is suspected (Susp) (in this
図3Dは、異なる図の第4の実施形態を示す。図3Cに示される図と比較して、スコア図43は、敗血症が疑われる又はSIRSが与えられるかどうかを示すだけでなく、敗血症が与えられない(No)かどうか(この例では1日目、5日目及び6日目及び部分的に2日目から4日目があてはまる)を追加的に示すことによりわずかに異なる。ここでは、通常のケースでは、グラフィカルな傾向が視覚的に過負荷にならないため、単一のパラメータに伴う何らかの限界をトレンド化しないという利点が見られる。図3Eは、異なる図の第5の実施形態を示す。この図は、PEWS(小児早期警告スコア)を示すスコア図60、患者の行動を示す行動図70、プロット形態で種々の心臓血管パラメータを示す心臓血管図80、及びプロット形態で種々の呼吸パラメータを示す呼吸ダイアグラム90を含む。図におけるプロットは、本発明に関して上述されたように、一般的に生成され及び視覚化される。 FIG. 3D shows a fourth embodiment of a different view. Compared to the diagram shown in FIG. 3C, the score diagram 43 not only shows whether sepsis is suspected or SIRS is given, but also whether sepsis is given (No) (in this example the first day) 5) and 6th day and partly from 2nd to 4th day)). Here, in the normal case, the graphical trend is not visually overloaded, so there is the advantage of not trending any limitations associated with a single parameter. FIG. 3E shows a fifth embodiment of a different view. This figure shows a score diagram 60 showing PEWS (Pediatric Early Warning Score), a behavior diagram 70 showing patient behavior, a cardiovascular diagram 80 showing various cardiovascular parameters in plot form, and various respiratory parameters in plot form. A respiration diagram 90 is shown. The plots in the figure are generally generated and visualized as described above with respect to the present invention.
図3Fは、図3Eと同様の異なる図の第6の実施形態を示す。しかしながら、図3Fに示される図71、81、91では、プロットは、図3Eのように線で視覚化されず、パラメータ値は特異点として示されている。 FIG. 3F shows a sixth embodiment of a different view similar to FIG. 3E. However, in FIGS. 71, 81, 91 shown in FIG. 3F, the plot is not visualized with lines as in FIG. 3E, and the parameter values are shown as singularities.
図3Gは、図3E及び図3Fと同様の異なる図の第7の実施形態を示す。しかしながら、図3Gに示される図82、92では、プロットのいくつかは、図3Eのように線で視覚化され、一方他のプロット(特に、パラメータが専用の状態又はパラメータ値のみを取ることができるもの)では、パラメータ値が特異点としてのみ示される。 FIG. 3G shows a seventh embodiment of a different view similar to FIGS. 3E and 3F. However, in FIGS. 82 and 92 shown in FIG. 3G, some of the plots are visualized with lines as in FIG. 3E, while other plots (especially the parameters may only take dedicated states or parameter values). Parameter), parameter values are shown only as singular points.
一般に、プロットは、任意の色、フォント、線の太さ、線のスタイル(点線、破線、連続、...)等の任意の可能な形態で視覚化されることができる。更に、図3に示される図において、時間軸は横軸であるが、代替的に縦軸とすることができる。更に、円、正方形、菱形、ハート形などの異なる記号又はアイコンが使用されることができる。例えば病院の一般的に使用されるスタイルに視覚化を適合させるため、ユーザは、自分のアイコンを追加することさえできる。 In general, the plot can be visualized in any possible form such as any color, font, line weight, line style (dotted line, dashed line, continuous, ...). Further, in the diagram shown in FIG. 3, the time axis is the horizontal axis, but can alternatively be the vertical axis. In addition, different symbols or icons such as circles, squares, diamonds, hearts can be used. For example, users can even add their own icons to adapt the visualization to the commonly used style of hospitals.
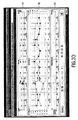
図3Hは、時間tにわたるHRのプロット101、Sp02のプロット102、及びRRのプロット103を含む3つの異なる患者関連パラメータの3つのプロットを示す簡略化されたタイミング図100の第8の実施形態を示す。更に、最上位のプロット101については、プロット101が上部閾値インジケータ121を超える(重複する)場合、重複インジケータ111、112が図3Hにおいて示される。即ち、最上位のプロット101の上にそれ以上、重なる可能性のあるプロットがないので、上部閾値インジケータ121(ここでは、水平線)が提供される。従って、この上部閾値インジケータ121との重なりは、最上位のプロット101のパラメータのパラメータ値が増加して、患者の健康状態にとってクリティカルであると考えられる、即ちこの例ではHRが140の値を超えることの指示として理解されるべきである。
FIG. 3H illustrates an eighth embodiment of the simplified timing diagram 100 showing three plots of three different patient-related parameters, including a
同様に、最下位のプロット103については、プロット103が下部閾値インジケータ122の下に落ちる(重なる)場合、重複インジケータ113が図3Hに示される。即ち最下位のプロット103の下にそれ以上重複する可能性のあるプロットがないので、下部閾値インジケータ122(ここでは、水平線)が提供される。従って、この下部閾値インジケータ122との重なりは、最下位プロット103のパラメータのパラメータ値が減少し、患者の健康状態にとってクリティカルであると考えられる、即ちこの例ではRRが5の値を下回ることの指示として理解されるべきである。
Similarly, for the
重複インジケータ111、112、113は、最上位のプロット101が上部閾値インジケータ121と重なる、又は最下位のプロット103が下部閾値インジケータ122と重複する程度を示す態様で生成される。言い換えると、ユーザは、患者の健康状態が可能性としてどれほど悪化しているかを重複インジケータから直接的に認識することができる。
The
図3Hに示される例では、重複インジケータ111、112、113は、個別の閾値インジケータが超えられる範囲を示す異なる線の太さ及び長さを持つ矢印として視覚化される。例えば、重複インジケータ111は、重複インジケータ112よりも厚い長い方の矢印であり、これは上部閾値インジケータ121が、この時点で重複インジケータ112の時点よりプロット111により大きい程度(即ちHR値がより高い)超えられることを示す。重複インジケータとしての矢印は、一例としてのみ理解されるべきである。程度を示す数字、異なるサイズの三角形など、他の多くの種類のインジケータが同様に使用されることができる。
In the example shown in FIG. 3H, the
図3Iに示される例では、プロットがそれぞれ上部又は下部閾値インジケータ121、122に到達する直前及び/又は直後の個別のプロットの部分114〜119の傾き(勾配)が、重複インジケータとして解釈される。例えば、部分118、119の傾きは、部分116、117の傾きよりも小さく、部分114、115の傾きよりも小さい。傾きが大きいほど、より多くが個別の閾値インジケータ121、122のプロットを超える。言い換えると、部分116、117の大きな傾きは、プロット101が上部閾値インジケータ121をかなり超える(即ち、HRが140よりかなり高い値に達する)ことを示し、一方、部分118、119の小さな傾斜は、プロット103が下部閾値インジケータ122をわずかにだけ下回る(即ち、RRが5よりわずかに小さい)ことを示す。
In the example shown in FIG. 3I, the slopes of the individual plot portions 114-119 immediately before and / or immediately after the plot reaches the upper or
更に、プロットの交差点と個別の閾値インジケータとの距離は、健康状態の悪化が潜在的にどれほど深刻であるかの(追加的又は代替的な)インジケータとして使用されることができる。例えば、より大きな距離d1は、より深刻な劣化の指標として使用されることができ、より小さい距離d2、d3は、それほど深刻でない劣化の指標として使用されることができる。 Furthermore, the distance between the intersection of the plots and the individual threshold indicator can be used as an indicator (however, additional or alternative) how serious the health deterioration is potentially. For example, a larger distance d1 can be used as an indicator of more serious deterioration, and a smaller distance d2, d3 can be used as an indicator of less serious deterioration.
更に、患者の健康状態の潜在的な劣化を示すため、他のインジケータが追加的に使用されることができる。例えば、プロットの視覚化に使用される色、線の太さ、又はアイコンは、個別のパラメータ値がクリティカルになる、プロットが点滅し始める、又は追加の記号(感嘆符など)がクリティカルになり始めるところでプロットに追加的に示される場合、変化することができる。例えば、部分114、116及びプロット101が上部閾値インジケータに到達する部分は、プロット101の下にあるHRのパラメータ値がクリティカルになったことを示すため、プロット101の残りの部分とは異なる色及び/又は線の太さで視覚化されてもよい(及び/又は点滅してもよい)。
In addition, other indicators can additionally be used to indicate potential degradation of the patient's health. For example, the color, line thickness, or icon used to visualize the plot may cause individual parameter values to become critical, the plot will begin to flash, or additional symbols (such as exclamation points) will begin to become critical By the way, it can change if additionally shown in the plot. For example, the
患者モニタは、図2に示されるようなユーザインターフェース12を更に有することができる。共通インタフェースとすることができ、又は複数のサブインタフェースを有することができる上記ユーザインターフェース12は、ユーザが1つ又は複数の機能を実行することを可能にするよう構成されてもよい。実際の実現では、ユーザインターフェース12は、タッチパッド、キーパッド、コンピュータマウス、ノブ(複数可)、スイッチ(複数可)などの1つ又は複数を有することができる。
The patient monitor can further include a
特に、ユーザインターフェース12を介して、ユーザは、プロットのスケール、ベースライン、位置、範囲及び/又は視覚化の種類を選択及び/又は変更することが可能であり得る(例えば、パラメータ値の間の接続線、パラメータ値に関するアイコンの使用などを有り又は無しに)。更に、ユーザインターフェース12を介して、ユーザは、プロット又は完全なプロットの点を選択することができ、上記ディスプレイ11は、上記プロットの選択された点におけるパラメータの、若しくは上記選択された点の時間瞬間におけるすべてのパラメータのパラメータ値、又は上記完全な選択されたプロットのパラメータのパラメータ値を表示するよう構成される。更に、ユーザインターフェース12を介して、ユーザは、隠されてはならないプロットを選択することにより、又は隠されるべきプロットを選択することにより、1つ又は複数のプロットを隠すことができる。これは、他のパラメータ値により重ね合わされる(隠される)パラメータ値が視覚化され、より良い方法で認識されることができるという利点がある。
In particular, via the
一実施形態では、プロットのスケール、ベースライン、位置及び範囲の一般的なデフォルト値が使用される。しかしながら、好ましくは、プロットのスケール、ベースライン、位置及び範囲を選択するための患者関連デフォルト値が使用される。この場合、上記患者関連デフォルト値は、患者の年齢、サイズ、体重、ボディマス指数、性別、健康状態、現在の治療、現在の薬物療法、意識状態、及び患者カテゴリの1つ又は複数に基づき選択される。これらのデフォルト値は例えば、デバイスによるアクセスのためにルックアップテーブル又は他のストレージに格納されることができる。他の実施形態では、プロットのスケール、ベースライン、位置及び範囲は、患者の年齢、サイズ、体重、ボディマス指数、性別、健康状態、現在の治療、現在の投薬、意識状態及び患者カテゴリの1つ又は複数に基づいて、患者に対して個別に決定されることができる。 In one embodiment, typical default values for plot scale, baseline, position and range are used. Preferably, however, patient related default values for selecting the scale, baseline, position and range of the plot are used. In this case, the patient-related default values are selected based on one or more of the patient's age, size, weight, body mass index, gender, health status, current treatment, current medication, consciousness status, and patient category. The These default values can be stored, for example, in a lookup table or other storage for access by the device. In other embodiments, the scale, baseline, position and range of the plot is one of the patient's age, size, weight, body mass index, gender, health status, current treatment, current medication, consciousness status and patient category. Or it can be determined individually for a patient based on a plurality.
提案されるプロット(グラフィカル傾向とも呼ばれる)は、複数のバイタルサイン、スコア、及び全体の患者状態を視覚化することができる。それは、ユーザ(例えば、介護者、医師、病院のスタッフなど)が、患者の健康状態及びその発症を容易に評価することを可能にする。全体的なスコアの低下の理由が、ユーザの介入なしに容易に決定されることができる。複数のバイタルサイン、イベント、アラーム、及びラボ結果を単一のグラフィカルな傾向で視覚化することは、病院スタッフが、これらのデータが互いにどのように関連しているかを簡単に評価することを可能にする。これは、患者の健康傾向を予測する革新的かつ容易な新しい方法を生み出し、従って病院スタッフが医療状況が起こる前にそれを打ち消すためのトリガーとして使用されることができる。 The proposed plot (also called graphical trend) can visualize multiple vital signs, scores, and overall patient status. It allows users (eg, caregivers, doctors, hospital staff, etc.) to easily assess a patient's health status and its onset. The reason for the overall score drop can be easily determined without user intervention. Visualizing multiple vital signs, events, alarms, and lab results in a single graphical trend allows hospital staff to easily assess how these data relate to each other To. This creates an innovative and easy new way of predicting patient health trends and thus can be used as a trigger for hospital staff to counteract before a medical situation occurs.
好ましくは、提案されるグラフィックの傾向は、臨床ワークフローに適合し、病院のスタッフをできる限り最善に支援するため、完全に設定可能である。以下の項目の1つ又は複数が設定可能であることが好ましい。
・同時に視覚化されるチャートの量及びそのサイズ。サイズは、使用可能なスペースにフィットするよう構成されるか、又は固定サイズに設定されることができる。
・各チャートは、複数のバイタルサインと他のデータを表示することができる。
・色、位置、ストロークのサイズ、アイコン、y軸の位置(左又は右)。
・特定のアイコンが、各個々のパラメータに割り当てられることができる。スパイク値を簡単に検出するため、異なるアイコンにスパイク値が割り当てられることができる。
・追加のアイコンがインポートされることができる。
・水平グリッド線と垂直グリッド線が追加されることができる。
・各チャートの見出しは、名前のグループ、例えばボディシステムに対して特定されることができる。
・各パラメータは、単位の有無にかかわらず説明が割り当てられることができる。
・パラメータの範囲は調整されることができる。
・各パラメータは、オフセットを規定することによりチャート内に配置されることができる。これは、スケーリングや重複効果なしにチャート内の任意の位置でパラメータが視覚化されることを可能にする。
・背景色は、作業環境の照明条件に合うように調整されることができる。
Preferably, the proposed graphic trends are fully configurable to fit clinical workflow and assist hospital staff as best as possible. It is preferable that one or more of the following items can be set.
• The amount of charts and their sizes that are visualized simultaneously. The size can be configured to fit in the available space or can be set to a fixed size.
Each chart can display multiple vital signs and other data.
Color, position, stroke size, icon, y-axis position (left or right).
A specific icon can be assigned to each individual parameter. In order to easily detect spike values, different icons can be assigned spike values.
-Additional icons can be imported.
-Horizontal grid lines and vertical grid lines can be added.
• Each chart heading can be specified for a group of names, eg body system.
• Each parameter can be assigned a description with or without units.
-The range of parameters can be adjusted.
Each parameter can be placed in the chart by defining an offset. This allows parameters to be visualized at any position in the chart without scaling or overlapping effects.
The background color can be adjusted to suit the lighting conditions of the work environment.
提案されるグラフィカルな傾向の機能は、通常のチャートアプリケーションの通常の機能を超える。患者の健康状態の悪化は、しばしば複数の複雑な理由の影響を受ける。現在可視のすべてのバイタルサインをラボ結果、BMI、BSA、ADTデータ、及び他のデータといった追加的なデータと組み合わせることにより、提案されるグラフィカルな傾向は、命を救うために現在の既存のチャートアプリケーションよりずっと早い段階で対抗措置をトリガーすることができる。 The proposed graphical trending functionality goes beyond the normal functionality of a normal charting application. Deterioration of a patient's health is often affected by multiple complex reasons. By combining all the currently visible vital signs with additional data such as lab results, BMI, BSA, ADT data, and other data, the proposed graphical trend will be saved to existing charts to save lives. Trigger countermeasures much earlier than the application.
提案されるグラフィカルな傾向の好ましい特徴は、以下を含む。
・特定の値の上を移動又は値をクリックすることにより、利用可能なすべてのバイタルサイン及びその時点で有効な他のデータを含む、より多くの情報が表示される。これは、ユーザが、どの入力データが特定のスコアをもたらすかを特定することを可能にする。
・1つのパラメータが、複数のチャートで同時に視覚化されることができる。
・重複を避けるため、アイコンが、自動的にドットで置き換えられる。
・ズームとスクロールは、別々のチャート間のコンテキストを保持するため、表示領域全体を変更する。
・Y軸の値の範囲は、例えば成人、新生児など患者カテゴリ別に調整されることができる。
・表示スペースが制限される場合(例えば、タブレットの場合)、すべてのバイタルサインが互いの上に表示されることができる。
・より良い概観のため、各トレンドバイタルサインは、そのY軸をクリックすることにより、グラフィカルな傾向の中に一時的に隠されることができる。
・最新の記録されたバイタルサイン及びデータが常に表示されることを確実にするため、自動タイムスクロール機能がイネーブルにされることができる。
・目に見えるスケール領域の外に位置する記録されたバイタルサイン及びデータが、チャートの上部又は下部のアイコンにより示唆される。
Preferred features of the proposed graphical trend include:
• Moving over or clicking on a specific value will display more information, including all available vital signs and other data currently in effect. This allows the user to specify which input data results in a specific score.
• One parameter can be visualized simultaneously on multiple charts.
-Icons are automatically replaced with dots to avoid duplication.
Zooming and scrolling change the entire display area to maintain context between separate charts.
The value range of the Y axis can be adjusted for each patient category such as adults, newborns, etc.
• If the display space is limited (eg for tablets), all vital signs can be displayed on top of each other.
• For a better overview, each trend vital sign can be temporarily hidden in a graphical trend by clicking on its Y axis.
• An automatic time scrolling function can be enabled to ensure that the latest recorded vital signs and data are always displayed.
• Recorded vital signs and data located outside the visible scale area are suggested by icons at the top or bottom of the chart.
要約すると、プロット又はグラフィカルな傾向の特定の視覚化を利用する本発明は、病院のスタッフが患者の健康の悪化に対抗することをトリガするため、複数の異なるバイタルパラメータ、検査データ、ADTデータなどを接続及び視覚化する新規で発明性のある態様を示す。これは、病院のスタッフ、又は介護者などの一般的に任意のユーザが、患者の健康状態及びその発症に関する完全な概要を容易に得ることを可能にする。 In summary, the present invention, which utilizes a specific visualization of plots or graphical trends, can trigger hospital staff to counter patient health deterioration, so that multiple different vital parameters, test data, ADT data, etc. Figure 2 shows a novel and inventive aspect of connecting and visualizing This allows any user, typically a hospital staff or caregiver, to easily obtain a complete overview of the patient's health status and its onset.
本発明が図面及び前述の説明において詳細に図示され及び説明されたが、斯かる図示及び説明は、説明的又は例示的であると考えられ、本発明を限定するものではない。本発明は、開示された実施形態に限定されるものではない。図面、開示及び添付された請求項の研究から、開示された実施形態に対する他の変形が、請求項に記載の本発明を実施する当業者により理解及び実行されることができる。 While the invention has been illustrated and described in detail in the drawings and foregoing description, such illustration and description are to be considered illustrative or exemplary and not restrictive. The invention is not limited to the disclosed embodiments. From a study of the drawings, the disclosure and the appended claims, other variations to the disclosed embodiments can be understood and carried out by those skilled in the art practicing the claimed invention.
請求項において、単語「有する」は他の要素又はステップを除外するものではなく、不定冠詞「a」又は「an」は複数性を除外するものではない。単一の要素又は他のユニットが、請求項に記載される複数のアイテムの機能を満たすことができる。特定の手段が相互に異なる従属項に記載されるという単なる事実は、これらの手段の組み合わせが有利に使用されることができないことを意味するものではない。 In the claims, the word “comprising” does not exclude other elements or steps, and the indefinite article “a” or “an” does not exclude a plurality. A single element or other unit may fulfill the functions of several items recited in the claims. The mere fact that certain measures are recited in mutually different dependent claims does not indicate that a combination of these measured cannot be used to advantage.
コンピュータプログラムは、他のハードウェアと共に又はその一部として供給される光学的記憶媒体又は固体媒体といった適切な非一時的媒体において格納/配布されることができるが、インターネット又は他の有線若しくは無線通信システムを介してといった他の形式で配布されることもできる。 The computer program can be stored / distributed in suitable non-transitory media, such as optical storage media or solid media supplied with or as part of other hardware, but the Internet or other wired or wireless communications It can also be distributed in other formats, such as through a system.
請求項における任意の参照符号は、発明の範囲を限定するものとして解釈されるべきではない。 Any reference signs in the claims should not be construed as limiting the scope.
Claims (15)
時間にわたり患者の患者関連データを取得するデータ入力と、
前記得られた患者関連データを視覚化するために処理するプロセッサであって、前記プロセッサが、前記取得された患者関連データから導出される少なくとも2つの異なる患者関連パラメータの時間にわたる時間依存プロットを生成し、前記プロットは、ディスプレイにおける共通の時間軸を持つ共通のタイミング図において共通の視覚化のために生成される、プロセッサと、
前記生成された時間依存プロットをディスプレイにおける視覚化のため出力するデータ出力とを有し、
前記プロットのスケール、ベースライン、位置及び範囲が、前記プロットにより視覚化される個別のパラメータのパラメータ値が患者の健康状態にとってクリティカルでないと考えられるとき、重複することなく前記共通タイミング図においてプロットを視覚化するよう選択され、所与のプロットのパラメータのパラメータ値が患者の健康状態にとってクリティカルであると考えられるとき、前記共通のタイミング図において視覚化される前記プロットの別のプロットと重複して、前記所与のプロットを視覚化するよう選択される、デバイス。 A device for visualization of patient related data,
Data entry to capture patient related data of patients over time;
A processor for processing to visualize the obtained patient related data, the processor generating a time dependent plot over time of at least two different patient related parameters derived from the acquired patient related data The plot is generated for a common visualization in a common timing diagram with a common time axis in the display; and
A data output for outputting the generated time-dependent plot for visualization on a display;
When the plot's scale, baseline, position, and range are considered not to be critical to the patient's health status, the parameter values of the individual parameters visualized by the plot are not duplicated in the common timing diagram. When selected to visualize and the parameter value of a given plot parameter is considered critical to the patient's health status, it overlaps with another plot of the plot visualized in the common timing diagram A device selected to visualize the given plot.
患者関連データの視覚化のための請求項1に記載のデバイスと、
前記デバイスにより生成される時間依存プロットの視覚化のためのディスプレイとを有する、患者モニタ。 A patient monitor,
The device of claim 1 for visualization of patient related data;
A patient monitor having a display for visualization of a time-dependent plot generated by the device.
患者関連データを取得する複数のセンサと、
前記取得された患者関連データを取得及び処理する請求項9に記載の患者モニタとを有する、システム。 A system for patient monitoring,
Multiple sensors for acquiring patient-related data;
10. A system comprising: a patient monitor according to claim 9 for acquiring and processing the acquired patient related data.
時間にわたり患者の患者関連データを取得するステップと、
前記得られた患者関連データを視覚化するために処理するステップであって、前記処理が、前記取得された患者関連データから導出される少なくとも2つの異なる患者関連パラメータの時間にわたる時間依存プロットを生成し、前記プロットは、ディスプレイにおける共通の時間軸を持つ共通のタイミング図において共通の視覚化のために生成され、前記プロットのスケール、ベースライン、位置及び範囲が、前記プロットにより視覚化される個別のパラメータのパラメータ値が患者の健康状態にとってクリティカルでないと考えられるとき、重複することなく前記共通タイミング図においてプロットを視覚化するよう選択され、所与のプロットのパラメータのパラメータ値が患者の健康状態にとってクリティカルであると考えられるとき、前記共通のタイミング図において視覚化される前記プロットの別のプロットと重複して、前記所与のプロットを視覚化するよう選択される、ステップと、
前記生成された時間依存プロットを視覚化のためディスプレイに出力するステップとを有する、方法。 In a method for visualization of patient related data,
Obtaining patient related data of a patient over time;
Processing to visualize the obtained patient-related data, the process generating a time-dependent plot over time of at least two different patient-related parameters derived from the acquired patient-related data; The plot is generated for common visualization in a common timing diagram with a common time axis in the display, and the scale, baseline, position and range of the plot are individually visualized by the plot Is selected to visualize the plots in the common timing diagram without duplication, and the parameter values for the parameters of a given plot are When it is considered critical to In serial common timing diagram the same as another plot of the plot to be visualized is selected to visualize the given plot, the steps,
Outputting the generated time-dependent plot to a display for visualization.
Applications Claiming Priority (3)
| Application Number | Priority Date | Filing Date | Title |
|---|---|---|---|
| EP15169147 | 2015-05-26 | ||
| EP15169147.4 | 2015-05-26 | ||
| PCT/EP2016/060490 WO2016188741A1 (en) | 2015-05-26 | 2016-05-11 | Device, system and method for visualization of patient-related data |
Publications (2)
| Publication Number | Publication Date |
|---|---|
| JP2018521714A true JP2018521714A (en) | 2018-08-09 |
| JP2018521714A5 JP2018521714A5 (en) | 2019-04-18 |
Family
ID=53267247
Family Applications (1)
| Application Number | Title | Priority Date | Filing Date |
|---|---|---|---|
| JP2017559401A Pending JP2018521714A (en) | 2015-05-26 | 2016-05-11 | Device, system and method for visualization of patient related data |
Country Status (8)
| Country | Link |
|---|---|
| US (1) | US10636523B2 (en) |
| EP (1) | EP3304371A1 (en) |
| JP (1) | JP2018521714A (en) |
| CN (1) | CN107660132B (en) |
| BR (1) | BR112017025022A2 (en) |
| MX (1) | MX2017014884A (en) |
| RU (1) | RU2017145636A (en) |
| WO (1) | WO2016188741A1 (en) |
Cited By (2)
| Publication number | Priority date | Publication date | Assignee | Title |
|---|---|---|---|---|
| JP2018075220A (en) * | 2016-11-10 | 2018-05-17 | フクダ電子株式会社 | Bioinformation display apparatus, bioinformation display control device, and bioinformation processing apparatus |
| JP2021087781A (en) * | 2019-12-04 | 2021-06-10 | ドレーゲルヴェルク アクチェンゲゼルシャフト ウント コンパニー コマンディートゲゼルシャフト アウフ アクチェンDraegerwerk AG & Co.KGaA | Device and method for displaying medical alarm |
Families Citing this family (15)
| Publication number | Priority date | Publication date | Assignee | Title |
|---|---|---|---|---|
| KR20180094082A (en) * | 2015-12-15 | 2018-08-22 | 레스퍼러토리 모션 인코포레이티드 | Assessment of respiratory rate monitoring to detect dyspnea and eliminate false alarms before pulse oximetry |
| JP6828585B2 (en) * | 2016-11-30 | 2021-02-10 | 株式会社リコー | Information display system, information display program, and information display method |
| JP6892759B2 (en) * | 2016-12-27 | 2021-06-23 | フクダ電子株式会社 | Biometric information monitor |
| US20190021677A1 (en) * | 2017-07-18 | 2019-01-24 | Siemens Healthcare Gmbh | Methods and systems for classification and assessment using machine learning |
| US11432720B2 (en) | 2017-08-18 | 2022-09-06 | Nicolette, Inc. | Portable device having user interface for visualizing data from medical monitoring and laboratory equipment |
| CN109273067A (en) * | 2018-09-18 | 2019-01-25 | 北京嘉和美康信息技术有限公司 | A kind of processing method and processing unit of diagnosis and treatment data |
| CN109241324A (en) * | 2018-09-18 | 2019-01-18 | 南方科技大学 | A kind of sign information querying method, device, mobile terminal and medium |
| JP1632949S (en) * | 2018-09-27 | 2019-06-03 | ||
| CN112804935B (en) * | 2018-12-24 | 2023-10-27 | 深圳迈瑞生物医疗电子股份有限公司 | Physiological sign monitoring method and monitoring equipment aiming at infection condition |
| US11600397B2 (en) * | 2019-02-08 | 2023-03-07 | General Electric Company | Systems and methods for conversational flexible data presentation |
| US11031139B2 (en) * | 2019-02-08 | 2021-06-08 | General Electric Company | Systems and methods for conversational flexible data presentation |
| US20210020311A1 (en) * | 2019-07-17 | 2021-01-21 | Richard G. Johnson | Method for Enhanced Medical Data Pattern Recognition |
| JP7385426B2 (en) | 2019-10-23 | 2023-11-22 | Psp株式会社 | Medical information viewing system and medical information viewing method |
| WO2021119919A1 (en) * | 2019-12-16 | 2021-06-24 | 深圳迈瑞生物医疗电子股份有限公司 | Ventilation information display method and apparatus for medical ventilation device, and medical device |
| CN117462077A (en) * | 2022-07-22 | 2024-01-30 | 深圳迈瑞生物医疗电子股份有限公司 | Medical device and target monitoring method |
Citations (14)
| Publication number | Priority date | Publication date | Assignee | Title |
|---|---|---|---|---|
| JPH0182001U (en) * | 1987-11-25 | 1989-06-01 | ||
| JPH0871046A (en) * | 1994-09-02 | 1996-03-19 | Matsushita Electric Ind Co Ltd | Monitor |
| WO2002041137A2 (en) * | 2000-11-17 | 2002-05-23 | Siemens Medical Solutions Usa, Inc. | Flexible form and window arrangement for the display of medical data |
| JP2003000559A (en) * | 2001-06-21 | 2003-01-07 | Fukuda Denshi Co Ltd | Device and method for recording biological information |
| WO2004023994A1 (en) * | 2002-08-27 | 2004-03-25 | Dainippon Pharmaceutical Co., Ltd. | Biological information trend display and its method |
| JP2006263384A (en) * | 2005-03-25 | 2006-10-05 | Toshiba Corp | Alarm reporting system |
| US20110004071A1 (en) * | 2009-05-28 | 2011-01-06 | Anthony Faiola | Medical Information Visualization Assistant System and Method |
| US20110071414A1 (en) * | 2009-09-22 | 2011-03-24 | Cerner Innovation, Inc. | Electronic fetal monitoring applications and display |
| WO2013056160A2 (en) * | 2011-10-13 | 2013-04-18 | Masimo Corporation | Medical monitoring hub |
| JP2014094085A (en) * | 2012-11-08 | 2014-05-22 | Nippon Koden Corp | Biological information display device and biological information display system |
| EP2777493A1 (en) * | 2013-03-14 | 2014-09-17 | DePuy Synthes Products, LLC | Methods, systems, and devices for monitoring and displaying medical parameters for a patient |
| JP2014194721A (en) * | 2013-03-29 | 2014-10-09 | Fujifilm Corp | Graph display device, operating method of graph display device, and graph display program |
| US20150018651A1 (en) * | 2008-06-23 | 2015-01-15 | Cas Medical Systems, Inc. | Indicators for a spectrophotometric system |
| JP2015029566A (en) * | 2013-07-31 | 2015-02-16 | フクダ電子株式会社 | Biological information monitor and method of presentation in biological information monitor |
Family Cites Families (7)
| Publication number | Priority date | Publication date | Assignee | Title |
|---|---|---|---|---|
| US20100217738A1 (en) * | 2009-02-23 | 2010-08-26 | Oded Sarel | Decision support method and apparatus for chaotic or multi-parameter situations |
| US8956292B2 (en) * | 2005-03-02 | 2015-02-17 | Spacelabs Healthcare Llc | Trending display of patient wellness |
| EP2283445A1 (en) * | 2008-05-19 | 2011-02-16 | F. Hoffmann-La Roche AG | Computer research tool for the organization, visualization and analysis of metabolic-related clinical data and method thereof |
| US8911377B2 (en) * | 2008-09-15 | 2014-12-16 | Masimo Corporation | Patient monitor including multi-parameter graphical display |
| US20130179191A1 (en) | 2011-12-22 | 2013-07-11 | Francis E. Bal | Method and system for managing personal health data |
| CA2890873A1 (en) | 2012-11-12 | 2014-05-15 | Koninklijke Philips N.V. | Caregiver centric and acuity adapting multi-patient system |
| US9626479B2 (en) * | 2014-01-27 | 2017-04-18 | Bernoulli Enterprise, Inc. | Systems, methods, user interfaces and analysis tools for supporting user-definable rules and smart rules and smart alerts notification engine |
-
2016
- 2016-05-11 MX MX2017014884A patent/MX2017014884A/en unknown
- 2016-05-11 RU RU2017145636A patent/RU2017145636A/en unknown
- 2016-05-11 EP EP16725388.9A patent/EP3304371A1/en not_active Withdrawn
- 2016-05-11 WO PCT/EP2016/060490 patent/WO2016188741A1/en active Application Filing
- 2016-05-11 CN CN201680030505.XA patent/CN107660132B/en active Active
- 2016-05-11 BR BR112017025022A patent/BR112017025022A2/en not_active Application Discontinuation
- 2016-05-11 JP JP2017559401A patent/JP2018521714A/en active Pending
- 2016-05-20 US US15/160,329 patent/US10636523B2/en active Active
Patent Citations (14)
| Publication number | Priority date | Publication date | Assignee | Title |
|---|---|---|---|---|
| JPH0182001U (en) * | 1987-11-25 | 1989-06-01 | ||
| JPH0871046A (en) * | 1994-09-02 | 1996-03-19 | Matsushita Electric Ind Co Ltd | Monitor |
| WO2002041137A2 (en) * | 2000-11-17 | 2002-05-23 | Siemens Medical Solutions Usa, Inc. | Flexible form and window arrangement for the display of medical data |
| JP2003000559A (en) * | 2001-06-21 | 2003-01-07 | Fukuda Denshi Co Ltd | Device and method for recording biological information |
| WO2004023994A1 (en) * | 2002-08-27 | 2004-03-25 | Dainippon Pharmaceutical Co., Ltd. | Biological information trend display and its method |
| JP2006263384A (en) * | 2005-03-25 | 2006-10-05 | Toshiba Corp | Alarm reporting system |
| US20150018651A1 (en) * | 2008-06-23 | 2015-01-15 | Cas Medical Systems, Inc. | Indicators for a spectrophotometric system |
| US20110004071A1 (en) * | 2009-05-28 | 2011-01-06 | Anthony Faiola | Medical Information Visualization Assistant System and Method |
| US20110071414A1 (en) * | 2009-09-22 | 2011-03-24 | Cerner Innovation, Inc. | Electronic fetal monitoring applications and display |
| WO2013056160A2 (en) * | 2011-10-13 | 2013-04-18 | Masimo Corporation | Medical monitoring hub |
| JP2014094085A (en) * | 2012-11-08 | 2014-05-22 | Nippon Koden Corp | Biological information display device and biological information display system |
| EP2777493A1 (en) * | 2013-03-14 | 2014-09-17 | DePuy Synthes Products, LLC | Methods, systems, and devices for monitoring and displaying medical parameters for a patient |
| JP2014194721A (en) * | 2013-03-29 | 2014-10-09 | Fujifilm Corp | Graph display device, operating method of graph display device, and graph display program |
| JP2015029566A (en) * | 2013-07-31 | 2015-02-16 | フクダ電子株式会社 | Biological information monitor and method of presentation in biological information monitor |
Cited By (3)
| Publication number | Priority date | Publication date | Assignee | Title |
|---|---|---|---|---|
| JP2018075220A (en) * | 2016-11-10 | 2018-05-17 | フクダ電子株式会社 | Bioinformation display apparatus, bioinformation display control device, and bioinformation processing apparatus |
| JP2021087781A (en) * | 2019-12-04 | 2021-06-10 | ドレーゲルヴェルク アクチェンゲゼルシャフト ウント コンパニー コマンディートゲゼルシャフト アウフ アクチェンDraegerwerk AG & Co.KGaA | Device and method for displaying medical alarm |
| JP7146881B2 (en) | 2019-12-04 | 2022-10-04 | ドレーゲルヴェルク アクチェンゲゼルシャフト ウント コンパニー コマンディートゲゼルシャフト アウフ アクチェン | Apparatus and method for displaying medical alarms |
Also Published As
| Publication number | Publication date |
|---|---|
| US20160350488A1 (en) | 2016-12-01 |
| BR112017025022A2 (en) | 2018-08-07 |
| MX2017014884A (en) | 2018-04-20 |
| CN107660132B (en) | 2021-06-22 |
| WO2016188741A1 (en) | 2016-12-01 |
| US10636523B2 (en) | 2020-04-28 |
| EP3304371A1 (en) | 2018-04-11 |
| CN107660132A (en) | 2018-02-02 |
| RU2017145636A (en) | 2019-06-27 |
Similar Documents
| Publication | Publication Date | Title |
|---|---|---|
| US10636523B2 (en) | Device, system and method for visualization of patient-related data | |
| JP6018623B2 (en) | Staged alarm method for patient monitoring | |
| JP5584413B2 (en) | Patient monitoring system and monitoring method | |
| JP6066784B2 (en) | MEDICAL DEVICE MEASUREMENT INFORMATION MONITOR DEVICE AND MEDICAL DEVICE MEASUREMENT INFORMATION MONITOR SYSTEM | |
| CA2845982C (en) | Methods, systems, and devices for monitoring and displaying medical parameters for a patient | |
| JP6235461B2 (en) | Central monitoring room with user settings | |
| JP5677400B2 (en) | Biological information display device and biological information display system | |
| EP3469502A1 (en) | User interface for configurably displaying real-time data for multiple patients | |
| JP2013059621A (en) | System and method for displaying physiologic information | |
| JP7230108B2 (en) | Patient monitor | |
| JP6189713B2 (en) | Biological information monitoring device and central monitor | |
| EP2762063A1 (en) | Physiological data monitor | |
| JP5703274B2 (en) | CLINICAL INFORMATION DISPLAY DEVICE, METHOD, AND PROGRAM | |
| JP2018512237A (en) | A tool for recommendation of ventilation treatment guided by risk score for acute respiratory distress syndrome (ARDS) | |
| JP6467428B2 (en) | Medical practice data display for patient monitoring systems | |
| JP2017148364A (en) | Biological information display device | |
| US20160166148A1 (en) | Visualization Of A Development And Escalation Of A Patient Monitor Alarm | |
| EP3520000A1 (en) | Patient monitoring system and method configured to suppress an alarm | |
| JP6975016B2 (en) | Condition change discriminator | |
| US20170354382A1 (en) | User interface for displaying predictive cardio information | |
| TW202020890A (en) | Display system for medical information and method for producing display content | |
| US20160070876A1 (en) | Methods and systems for informatics data visualization and alerts | |
| Szczepanski | Decision Support Systems for Real-Time Monitoring of Hospital Patients–Automated implementation of the National Early Warning Score II–a preclinical study | |
| WO2015044859A1 (en) | A methodology for hospitalized patient monitoring and icu risk prediction with a physiologic based early warning system | |
| JP2023151323A (en) | Medical care assistance system, medical care assistance device, and program |
Legal Events
| Date | Code | Title | Description |
|---|---|---|---|
| A521 | Request for written amendment filed |
Free format text: JAPANESE INTERMEDIATE CODE: A523 Effective date: 20190306 |
|
| A621 | Written request for application examination |
Free format text: JAPANESE INTERMEDIATE CODE: A621 Effective date: 20190306 |
|
| A131 | Notification of reasons for refusal |
Free format text: JAPANESE INTERMEDIATE CODE: A131 Effective date: 20191128 |
|
| A977 | Report on retrieval |
Free format text: JAPANESE INTERMEDIATE CODE: A971007 Effective date: 20191127 |
|
| A02 | Decision of refusal |
Free format text: JAPANESE INTERMEDIATE CODE: A02 Effective date: 20200623 |